Article

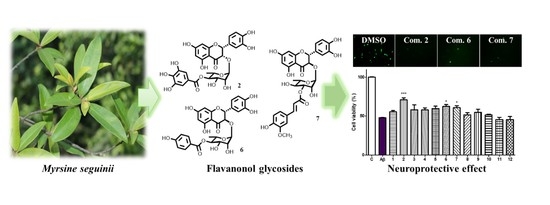
Flavanonol Glycosides from the Stems of Myrsine seguinii and Their Neuroprotective Activities

1
Korea Bioactive Natural Material Bank, Research Institute of Pharmaceutical Sciences, College of Pharmacy, Seoul National University, Seoul 08826, Korea
2
Natural Product Informatics Research Center, Korea Institute of Science and Technology, Gangeung 25451, Korea
3
Department of Botany, Hanoi University of Pharmacy, Hanoi 100000, Vietnam
*
Author to whom correspondence should be addressed.
Pharmaceuticals 2021, 14(9), 911; https://doi.org/10.3390/ph14090911
Submission received: 4 August 2021 / Revised: 26 August 2021 / Accepted: 7 September 2021 / Published: 9 September 2021
(This article belongs to the Special Issue Discovery of Natural Product-Based Amyloid Inhibitors)

Abstract

:
The accumulation of amyloid beta (Aβ) peptides is common in the brains of patients with Alzheimer’s disease, who are characterized by neurological cognitive impairment. In the search for materials with inhibitory activity against the accumulation of the Aβ peptide, seven undescribed flavanonol glycosides (17) and five known compounds (812) were isolated from stems of Myrsine seguinii by HPLC-qTOF MS/MS-based molecular networking. Interestingly, this plant has been used as a folk medicine for the treatment of various inflammatory conditions. The chemical structures of the isolated compounds (112) were elucidated based on spectroscopic data, including 1D and 2D nuclear magnetic resonance (NMR), high-resolution electrospray ionization mass spectrometry (HRESIMS) and electronic circular dichroism (ECD) data. Compounds 2, 6 and 7 showed neuroprotective activity against Aβ-induced cytotoxicity in Aβ42-transfected HT22 cells.

Graphical Abstract

1. Introduction

Alzheimer’s disease (AD) is a neurodegenerative disorder characterized by progressive memory loss and behavioral abnormalities [1]. Due to the increase in the size of the elderly population, the number of patients with AD is currently estimated to be 5.5 million in the United States, and the number is expected to reach over 13.8 million by 2050 [2]. The main pathological features of AD are deposits of extracellular amyloid beta (Aβ) plaques. The insoluble Aβ protein and neurofibrillary tangles of the tau-protein, which are involved in microtubule maintenance in neural cells, ultimately result in memory dysfunction [3]. Aβ peptides composed of 39–42 amino acids are produced by the cleavage of amyloid precursor protein (APP) by β-secretase and γ-secretase [4]. In particular, Aβ1-40 and Aβ1-42, which are more neurotoxic than other Aβ peptides, are excessively produced in cerebral neural cells and accumulate in the form of senile plaques [5]. The accumulated senile plaques form protofibrils, fibrils and plaques by Aβ oligomerization [6], which has been implicated in neuronal dystrophy and synaptic loss through pathways such as neurotoxicity, oxidative stress and inflammatory reactions in both human and mouse models of AD [7,8,9]. The U. S. Food and Drug Administration (FDA) has approved drugs such as tacrine, donepezil, rivastigmine and galantamine (as acetylcholine esterase enzyme inhibitors) and memantine (as an N-methyl-d-aspartate (NMDA) receptor antagonist) for use in AD patients [10]. However, these drugs, which have side effects such as vomiting and hepatotoxicity, have no therapeutic effect and only cause temporary improvement [11]. Galantamine is a naturally occurring plant tertiary alkaloid that acts not only as a reversible inhibitor of acetylcholinesterase but also as an allosteric modulator of nicotinic receptors and is used as a treatment for mild-to-moderate Alzheimer’s disease [12]. Natural products are a good source of potential Alzheimer’s treatments with relatively few side effects and excellent efficacy.
Myrsine seguinii H. Lév., belonging to the family Primulaceae, occurs as shrubs or trees that can grow up to 2–12 meters in height and is distributed in Southeast Asian countries such as Vietnam and China [13]. The plant mainly grows in tropical and subtropical regions of the world and has a limited distribution in the northern area of Japan [14]. The genus Myrsine comprises approximately 300 species of evergreen shrubs and trees, which have traditionally been used as a folk medicine to treat anti-inflammatory and infectious diseases in Southeast Asian countries [15,16]. M. africana is used as an anti-tapeworm infection agent and as a treatment for dropsy, colic and dysmenorrhea [17]. In particular, M. seguinii is used in Myanmar as a medicinal plant for treating colds, influenza and headaches, and it has been used to treat inflammatory diseases on Okinawa Island, Japan [18]. The phytochemical components of M. seguinii have been reported to include flavonol glycosides [19], anti-inflammatory prenylated benzoic acid derivatives and myrsinionosides consisting of hydroquinones and p-benzoquinones [20,21]. Inflammation has been reported as a distinctive feature of Alzheimer’s patients, along with two other pathological features (β-amyloid and neurofibrillary tangles) and the link between the initial accumulation of β-amyloid and the subsequent development of neurofibrillary tangles has been investigated [22]. Myrsine seguinii is a plant of interest for identifying potential AD therapeutic agents because it has traditionally been used to treat inflammation and is reported to contain chemicals with anti-inflammatory effects.
In this study, we attempted to investigate active compounds in a 70% EtOH extract of M. seguinii using the Global Natural Product Social Molecular Networking (GNPS) (https://gnps.ucsd.edu, accessed on 7 January 2019) open-access web-based platform, which forms molecular networks (MNs) [23]. Dereplication by high-performance liquid chromatography-quadrupole time-of-flight mass spectrometry (HPLC-qTOF MS/MS) resulted in the isolation of seven new flavanonol glycosides (17) along with five known compounds (812). In addition, the neuroprotective effects of the isolated compounds (112) were tested against the cytotoxicity induced in Aβ42-transfected HT22 cells.

2. Results

2.1. Authentication of M. seguinii H. Lév

In the case of plants used as traditional medicines, special attention should be paid to the authentication of samples, as their intake in the patients may cause severe side effects [24,25]. In the genus Myrsine, which consists of approximately 300 species of evergreen shrubs and trees, the authentication of M. seguinii was attempted based on plant morphology, cross-sectional observations and the DNA barcode technique.
Morphologically, the studied samples were shrubs with a height of 3–4 m or trees with a height up to 10 m. The stems were highly branched and covered by cracked white bark. The branches were 3–5 mm in diameter and were white lenticellate, rugose, reddish puberulent and glabrescent in early stages. The leaves were simple and alternate, with petioles of 2–3 mm. The leaf blade was elliptic to narrowly linear-oblanceolate, 3–7 cm long, 1–2 cm wide, leathery, glabrous, base cuneate and reddish, with an entire margin and acute apex. Lateral veins were apparent, with 20–25 pairs (Figure 1A). The morphological features closely matched the description of M. seguinii in the Flora of China [26]. A cross-section of a leaf of M. seguinii is illustrated in Figure 1B. The upper and lower epidermis consisted of a single cell layer and covered the entire midrib surface. The upper and lower collenchyma was under the epidermal layer, with straight anticlinal wall cells. Calcium oxalate crystals and secretory schizogenous cavities were distributed in a scattered manner throughout collenchymal tissues. The vascular bundles occupied half of the transverse section area and were covered by 2–4 layers of sclerenchyma. The phloem consisted of 3–5 layers of small cells and covered the xylem. The order of the tissues from the lower to the upper parts of the leaf blade was as follows: lower epidermis, spongy mesophyll, palisade mesophyll and upper epidermis. The image of the stem cross-section shows the secondary structure of the stem of M. seguinii (Figure 1C). The outermost layer was the cork, which consisted of thick multiple cell layers. This layer was followed by multiple layers of parenchyma cells that showed a variety of shapes and could contain calcium oxalate crystals. The vascular bundles occupied more than half of the transverse section area and were arranged as cascade clusters. Each bundle consisted of secondary phloem, secondary xylem and primary xylem. The sclerenchyma cells covered the secondary phloem in the form of fiber bundles. The primary phloem was not visible. Several secretory schizogenous cavities could be observed inside the pith.
The DNA sequence was compared with published sequences available in GenBank (National Institutes of Health) using the basic Local Alignment Search Tool (BLAST) of the National Center for Biotechnology Information (NCBI) to generate the neighbor-joining (NJ) tree. The results of the DNA sequencing analysis and BLAST analysis showed high similarity with sequences from the genus Myrsine (Table S1). The BLAST analysis of trnH-psbA sequences showed sequence similarity of 99% with M. seguinii distributed in Vietnam, Cambodia and China, and M. umbellate distributed in Ecuador and Brazil. The BLAST analysis of nrITS revealed 98% agreement with M. segunii and M. chatthamica from the Chatham Islands. The experimental sample was grouped with the genus Myrsine in the NJ tree based on matK, rbcL, trnL-trnF and trnH-psbA (Figure S1). The NJ tree analysis of trnL-trnF showed that the experimental sample was located closest to M. seguinii from Vietnam, Cambodia and China (Figure S1C). The experimental sample was finally authenticated as M. seguinii H.Lév on the basis of its morphological characteristics and DNA sequencing analysis.

2.2. Isolation of Compounds from M. seguinii Using Molecular Networking

The 70% EtOH extract and its subfractions (25, 50, 75 and 100% MeOH eluent fractions) obtained via Diaion HP-20 column chromatography were analyzed by HPLC-qTOF MS/MS spectrometry. The GNPS web platform suggested 10 clusters (Figure S2) excluding the self-loop, and the precursor ion peak at m/z 449 matched as astilbin moiety according to the GNPS spectral library. The 100% MeOH-eluted fraction, which showed strong protective activity against cytotoxicity induced in Aβ1-42-transfected HT22 cells, was expected to contain the new targeted spectral nodes in the molecular network. Seven new flavanone glycoside derivatives (17), as well as five known compounds (812), were obtained from the 100% MeOH fraction through a series of chromatographic separations steps, including Diaion HP-20, Sephadex LH-20 and preparative HPLC (Figure 2).

2.3. Structural Determination of Compounds from M. seguinii

2.3.1. (2R,3R)-4″-O-Galloylastilbin (1)

Compound 1 was isolated as a white amorphous powder with an [ α ] D 20 +55 (c 0.2, MeOH). Its molecular formula was suggested to be C28H26O15 on the basis of its deprotonated high-resolution electrospray ionization mass spectrometric (HRESIMS) ion peak at m/z 601.1221 [M − H] (calcd. for C28H25O15, 601.1193). The infrared (IR) spectrum showed the presence of hydroxyl and carboxyl bands at 3394 and 1640 cm−1, respectively. The 1H nuclear molecular resonance (NMR) data of 1 showed ABX aromatic proton signals at δH 6.99 (1H, d, J = 1.5 Hz), 6.87 (1H, dd, J = 8.1, 1.7 Hz) and 6.83 (1H, dd, J = 8.1 Hz), one tetra-substituted aromatic proton signal at δH 5.94 (1H, d, J = 1.8 Hz) and 5.91 (1H, d, J = 1.9 Hz) and two oxygenated methines at δH 5.08 (1H, d, J = 11.1 Hz) and 4.64 (1H, d, J = 11.1 Hz), which is suggestive of a flavanone moiety (Table 1). One rhamnose moiety at δH 4.06 (1H, s) and 1.09 (3H, d, J = 6.2 Hz) and one meta-coupled proton at δH 7.10 (2H, s) were observed in the 1H NMR data of 1. The 13C NMR spectrum presented signals for 28 carbons, including two α,β-unsaturated carbonyl groups (δC 196.1 and 168.2), 18 aromatic carbon signals (δC 165.6–96.4), seven oxygenated carbons (δC 102.0–68.5) and one methyl carbon signal (δC 17.7) (Table 2). These results suggested that 1 was a 3,3′,4′,5,7-pentahydroxyflavanone with one rhamnose and one galloyl moiety. Compound 1 was similar to astilbin isolated from the leaves of Engelhardia roxburghiana [27], except for the attachment of one galloyl moiety to C-4′ of rhamnose in compound 1. The analysis of HMBC and 1H-1H COSY showed that the anomeric proton of the rhamnose signal at δH 4.06 (1H, s) was correlated with C-3 (δC 78.6) and H-4″ of rhamnose at 5.04 (1H, t, J = 9.9 Hz), which was correlated with the galloyl ester carbon signal at δC 168.2 (Figure 3). The NMR coupling constants (J2,3) of C-2 and C-3 of 1 showed J2,3 = 11.1 Hz, which was suggestive of a trans-configuration and consequently, its relative configuration was [(2R,3R) or (2S,3S)] based on comparison with that of the reference [28]. The electronic circular dichroism (ECD) data of compound 1, with a positive nπ* (ca. 300–340 nm) and a negative ππ* (ca. 290–300 nm), indicated a 2R configuration based on comparison with reported data (Figure S45A) [29]. Thus, compound 1 was assigned as (2R,3R)-4″-O-galloylastilbin.

2.3.2. (2R,3S)-4″-O-Galloylisoastilbin (2)

Compound 2 was obtained as a brownish gum with [ α ] D 20 −183 (c 0.2, MeOH). The molecular formula of C28H26O15 was determined from its negative HRESIMS ion peak at m/z 601.1186 [M − H] (calcd. for C28H25O15, 601.1193). The IR spectrum of 2 indicated characteristic bands of hydroxyl and carbonyl groups at 3393 and 1636 cm−1, respectively. The 1H and 13C NMR data (Table 1 and Table 2) were similar to those of compound 1 except for the presence of two oxygenated methines at δH 5.48 and 4.16 of H-2 and H-3 (d, J = 2.0 Hz), which indicated that the relative conformations of H-2 and H-3 of compound 2 were different from that of compound 1. The NMR coupling constants (J2,3) and ECD spectra data (Figure S45B) of compound 2 were indicative of a (2R,3S) conformation. Thus, compound 2 was assigned as (2R,3S)-4″-O-galloylisoastilbin.

2.3.3. (2R,3R)-4″-O-(3‴,4‴-Dihydroxybenzoyl)astilbin (3)

Compound 3 was isolated as a brownish gum with [ α ] D 20 +3 (c 0.2, MeOH). The molecular formula of compound 3 was expected to be C28H26O14 according to the HRESIMS ion peak at m/z 585.1233 [M − H] (calcd. for C28H25O14, 585.1244), which was 16 amu less than that of compound 1 and was expected to result in the loss of a hydroxyl group. The IR spectrum indicated the presence of hydroxyl (3394 cm−1) and carbonyl (1640 cm−1) bands. On the basis of the 1H and 13C NMR data (Table 1 and Table 2), the aglycon and rhamnose moieties of compound 3 were similar to those of compound 1, including the two oxygenated methines at δH 5.10 and 4.63 of H-2 and H-3 (d, J = 11.1 Hz). The 1H NMR and 13C NMR data of compound 3 showed ABX aromatic proton signals at δH 7.48 (1H, br s), 6.84 (2H, overlapped with H-5′) and 7.46 (1H, dd, J = 8.1, 2.0 Hz) and seven carbon signals (δC 122.6, 117.6, 146.6, 151.8, 115.9, 123.8 and 168.1), which indicated the presence of a 3,4-dihydroxybenzoic acid group. HMBC correlation showed that the anomeric proton of the rhamnose signal at δH 4.07 (1H, s) was correlated with C-3 at δC 78.7 and that H-4 of the rhamnose signal at 5.04 (1H, t, J = 9.8 Hz) was correlated with the 3,4-dihydroxybenzoic acid ester carbon signal at δC 168.1. The NMR spectrum and ECD spectra (Figure S45A) of compound 3 indicated that the absolute configuration was (2R,3R). Thus, compound 3 was assigned as (2R,3R)-4″-O-(3‴,4‴-dihydroxybenzoyl)astilbin.

2.3.4. (2R,3R)-4″-O-Vanilloylastilbin (4)

Compound 4, obtained as a brownish gum with [ α ] D 20 −21 (c 0.2, MeOH), was deduced to have a molecular formula of C29H28O14 from its HRESIMS ion peak at m/z 599.1396 [M − H] (calcd. for C29H27O14, 599.1401). The IR spectrum showed the presence of hydroxyl (3414 cm−1) and carbonyl (1639 cm−1) bands. The 1H and 13C NMR data (Table 1 and Table 2) of compound 4 were similar to those of compound 3 except for one methoxy group at δH 3.90 (3H, s) and δC 56.5. HMBC correlations showed from the anomeric proton of the rhamnose signal at δH 4.08 (1H, s) to C-3 at δC 78.9, H-4 of the rhamnose signal at δH 5.07 (1H, t, J = 10.0 Hz) to the vanillic acid ester carbon signal at δC 167.9 and the methoxy group at 3.90 (3H, s) to C-3‴ (δC 148.7). The NMR spectrum and ECD spectra (Figure S45A) of compound 4 indicated that the absolute configuration was (2R,3R). Hence, the structure of compound 4 was established as (2R,3R)-4″-O-vanilloylastilbin.

2.3.5. (2R,3S)-4″-O-Vanilloylisoastilbin (5)

The molecular formula of compound 5, obtained as a brownish gum with [ α ] D 20 −56 (c 0.2, MeOH), was deduced to be C29H28O14 from its HRESIMS ion peak at m/z 599.1382 [M − H] (calcd. for C29H27O14, 599.1401). The 1H and 13C NMR data (Table 1 and Table 2) were similar to those of compound 4 except for chemical shifts in two oxygenated methine signals at δH 5.47 (H-2) and 4.16 (H-3) and its coupling constants (d, J = 2.1 Hz). The ECD spectra of compound 5 indicated that the absolute configuration of 5 was (2R,3S) (Figure S45B). Thus, compound 5 was characterized as (2R,3S)-4″-O-vanilloylisoastilbin.

2.3.6. (2R,3R)-4″-O-(4‴-Hydroxybenzoyl)astilbin (6)

Compound 6 was obtained as a brownish gum with [ α ] D 20 −41 (c 0.2, MeOH). The molecular formula of 6 was inferred to be C28H25O13 based on its HRESIMS peak at m/z 569.1301 [M − H] (calcd. for C28H25O13, 569.1295). The molecular weight of compound 6, which was 16 amu less than that of compound 3, suggested the loss of a hydroxyl group. According to 1H and 13C NMR data (Table 1 and Table 2), A2B2 aromatic proton signals at δH 7.92 (2H, d, J = 8.7 Hz) and 6.85 (3H, overlapped with H-5′) and corresponding carbon signals at δC 122.3, 132.9, 116.2, 163.6 and 167.9 of 6 suggested the presence of a para-hydroxybenzoic acid group. The HMBC correlation between H-4″ at δH 5.07 and C-7‴ (δC 167.9) indicated the location of p-hydroxybenzoic acid. The absolute configuration of 6 was assigned as (2R,3R) based on the NMR spectrum and ECD spectra (Figure S45A). Hence, compound 6 was identified as (2R,3R)-4″-O-(4‴-hydroxybenzoyl)astilbin.

2.3.7. (2R,3R)-3″-O-E-Feruloylastilbin (7)

Compound 7 was isolated as a brownish gum with [ α ] D 20 +36 (c 0.2, MeOH). The molecular formula of compound 7 was deduced to be C31H30O14 from its HRESIMS ion peak at m/z 625.1554 [M − H] (calcd. for C31H29O14, 625.1557). On the basis of 1H and 13C NMR data (Table 1 and Table 2), the aglycon and rhamnose moieties of compound 7 were closely related to those of compound 1. The existence of one ABX-type coupling system [δH 7.19 (1H, d, J = 1.8 Hz), 6.81 (1H, d, J = 8.0 Hz) and 7.08 (1H, dd, J = 8.2, 1.8 Hz)], a trans-vinylic group [δH 7.68 (1H, d, J = 15.9 Hz) and 6.41 (1H, d, J = 15.9 Hz)] and one oxygenated methyl proton at δH 3.90 (3H, s) indicated the presence of a trans-feruloyl moiety. In addition, the 1H-1H COSY spectrum and HMBC spectrum showed a correlation between H-3″ at δH 5.08 and C-9‴ at δC 168.9. These results indicated that the feruloyl moiety was linked to the C-3″ position of rhamnose (Figure 3). The NMR coupling constants (J2,3) and ECD spectra (Figure S45A) resulted in the assignment of the absolute configuration of 7 as (2R,3R). The structure of compound 7 was elucidated as (2R,3R)-3″-O-E-feruloylastilbin.
The five known compounds (812) were identified as neoastilbin (8), astilbin (9), isoastilbin (10), engeletin (11) and isoengeletin (12) by the comparison of the spectroscopic data with published data [28,30].

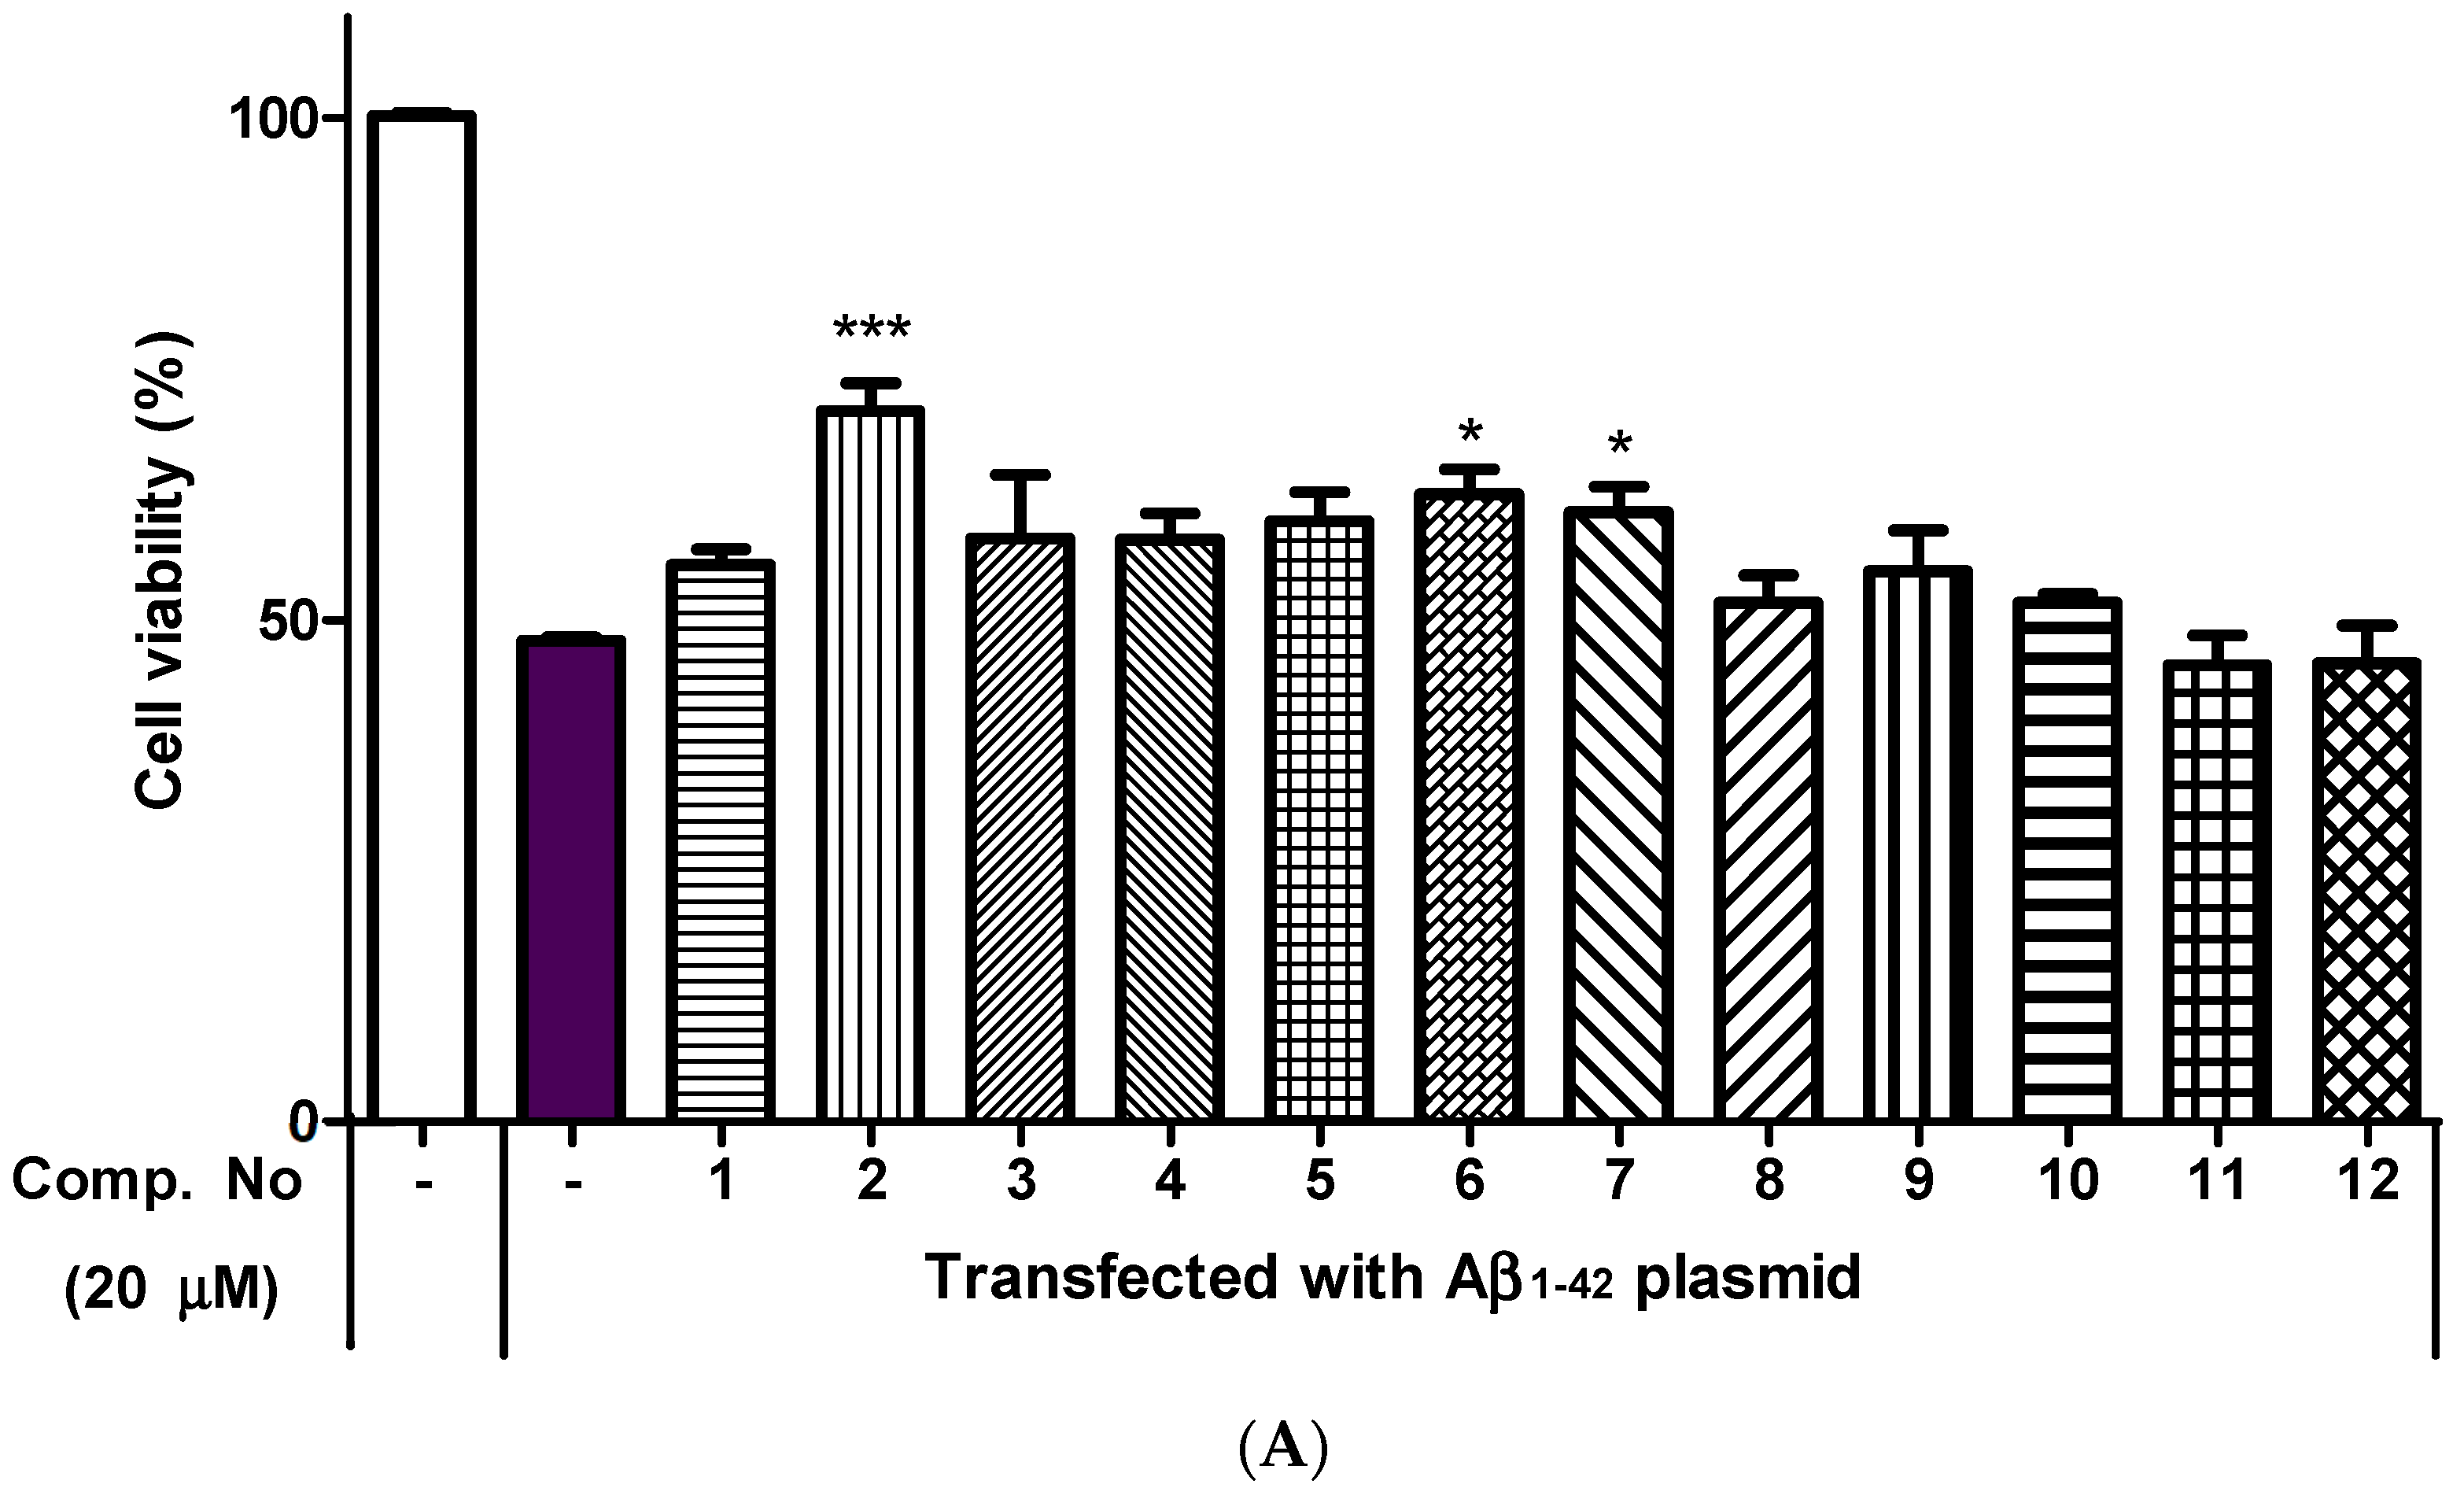
2.4. Neuroprotective Effects of Isolated Compounds (112)

The neuroprotective effects of all isolated compounds against the cytotoxicity induced by Aβ42 plasmids (transfected using Lipofectamine 2000 reagent) were measured in HT22 cells. To evaluate the cytotoxicity of the tested compounds, HT22 cells were incubated with the tested compounds at 20 μM. When cell viability was measured in a 3-(4,5-dimethylthiazol-2-yl)-2,5-diphenyl-2H-tetrazolium bromide (MTT) assay, no significant cytotoxicity was observed (Figure S46). After transfection for 10 h, compounds 2, 6 and 7 showed neuroprotective effects against the cytotoxicity induced by Aβ42 plasmids at 20 μM (Figure 4A). As shown in Figure 4B, the protective effects of 2, 6 and 7 showed dose-dependent activity (5, 10 and 20 μM) in the Aβ42-transfected HT22 cells. The intensity of green fluorescence was measured by pEGFP-C1/Aβ1–42 plasmid transfection in HT22 cells. Compounds 2, 6 and 7 at 20 μM resulted in a moderately decreased fluorescence intensity compared with the results of vehicle treatment (Figure 5).

3. Discussion

In this study, the studied plant was authenticated as M. seguinii H. Lév based on its morphological characteristics and DNA sequencing analysis. The misidentification of plants can result in toxic responses in patients who ingest the plants [24]. The expressed plant phenotype is described as a feature of the genotype that is modified in response to different environmental conditions [31]. Since the authentication of this plant was difficult, analyses of morphological characteristics, leaf and stem cross-sections, and the five DNA barcode sequences (matK, rbcL, trnH-psbA, trnL-trnF and nrITS) were performed. Seven undescribed flavanonols (17) along with five known compounds (812) were isolated by MS/MS molecular networking from the stem of M. seguinii. Compounds 17 were 3,3′,4′,5,7-pentahydroxyflavanones with one rhamnose and a variety of attached benzoyl groups, including galloyl, 3,4-dihydroxybenzoyl, vanilloyl, 4-hydroxybenzoyl and trans-feruloyl groups. Flavanonol glycosides with aromatic groups are uncommon derivatives that can be isolated from plants. In particular, M. seguinii is unique in that flavanonol glycosides with various functional groups can be isolated from this single plant species.
Compounds 2, 6 and 7 showed significant neuroprotective activities against Aβ-induced cytotoxicity in Aβ42-transfected HT22 cells. The occurrence of AD is known to involve deposits of insoluble Aβ proteins and neurofibrillary tangles of tau-protein. Oxidative stress and inflammation are among the results of the production of these proteins [22,32]. Flavanonol glycosides from leaves of Engelhardia roxburghiana were found to have anti-inflammatory properties in an in vitro assay. These derivatives exert inhibitory effects on the mRNA expression of IL-1β and Cox-2 depending on the presence of galloyl or coumaroyl moieties [33]. The stereoisomers of astilbin based on the C-2 and C-3 configurations could affect the capacities of different antioxidants in the DPPH radical system and ABTS+ radical scavenging and anti-inflammatory effects by stimulating IL-1β, IL-6 and NO in RAW264.7 cells [34]. These results also suggest that the observed neuroprotective effects can be attributed to various aromatic groups, such as galloyl, hydroxybenzoyl and trans-feruloyl groups, and show different protective effects against Aβ-induced cytotoxicity depending on the type of substituent. Future research should focus on the structural specificity of the biological activity of phytochemicals.

4. Materials and Methods

4.1. General Experimental Procedures

Optical rotations were measured on a JASCO P-2000 polarimeter (JASCO International Co. Ltd., Tokyo, Japan). IR data were collected using a Nicolet 6700 FT-IR spectrometer (Thermo Electron Corp., Waltham, MA, USA). ECD spectra were recorded using Chirascan Plus (Applied Photophysics Ltd., Surrey, UK). UHPLC systems (Ultimate 3000, Thermo Scientific, Milan, Italy) coupled to a Waters Xevo G2 QTOF MS spectrometer (Waters, Co., Milford, MA, USA) were used to generate HRESIMS values and perform LC-MS/MS analysis. Semipreparative HPLC was performed using a Gilson HPLC system with a UV/VIS-155 detector and a 321 pump. An RS Tech Optima Pak C18 column (10 × 250 mm, 10 μm) was used as the HPLC column. All solvents employed for extraction and isolation were of analytical grade. The 1D (1H and 13C) and 2D (HSQC, HMBC and 1H-1H COSY) NMR spectra were collected using JEOL 400 MHz (JEOL Ltd., Tokyo, Japan), Bruker Avance 500 MHz and Bruker Avance 800 MHz NMR spectrometers (Bruker, Billerica, MA, USA). DiaionTM HP-20 ion exchange resin and GE Healthcare SephadexTM LH-20 (18–111 μm) were employed for column chromatography. Thin layer chromatography was performed with silica gel 60 F254 and RP-18 F254 plates.

4.2. Plant Material

Dried stems of the studied plant material were collected in March 2017 from Gia Sinh Commune, Gia Vien District, Ninh Binh province, Vietnam (20°16′12.8″ N 105°51′59.7″ E). The sample was authenticated as M. seguinii H. Lév. based on morphological characteristics by Msc. Nghiem Duc Trong of the Department of Botany, Hanoi University of Pharmacy. The DNA sequencing of five markers, matK, rbcL, trnH-psbA, trnL-trnF and nrITS, also supported for the species identity of the plant. A voucher specimen (HNIP-21-2017) was deposited in the Herbarium of the Hanoi University of Pharmacy, Hanoi, Vietnam.

4.3. Morphology and DNA Sequencing Analysis of M. seguinii

The sample was authenticated by matching its morphological features with available taxonomic descriptions of M. seguinii H. Lév. Photographs were obtained with a Canon EOS 60D camera and Canon 100 mm f2.8 IS Macro lens (Canon Inc. Tokyo, Japan). An EZ4 stereo microscope was used to analyze the features of M. seguinii leaf and stem cross-sections. Genomic DNA was extracted from a branch from which the outer skin was removed using a G-spinII Plant Genomic DNA extraction kit (Invitrogen, Seoul, Korea). The extracted genomic DNA was amplified by PCR using primers targeting four chloroplast genomic markers (matK, rbcL, trnH-psbA and trnL-trnF) and the nuclear genome marker ITS region. The amplified PCRs products were purified using a PCR quick-spinTM PCR Purification kit (Intron, Seongnam, Korea) and the DNA sequences were determined with the primers used for PCR. The DNA sequence was modified using Geneious 11.1.2 to determine the final DNA sequence.

4.4. LC-MS/MS Analysis and Molecular Networking

LC-MS/MS analysis was carried out by using UHPLC systems (Ultimate 3000, Thermo Scientific, Milan, Italy) coupled to a Waters Xevo G2 QTOF MS spectrometer (Waters, Co., Milford, MA, USA) with an Acquity UPCL BEH C18 column (2.1 × 100 mm, 1.7 μm). The mobile phase was composed of 0.1% formic acid in water (A) and 0.1% formic acid in acetonitrile (B). The gradient program was as follows: 0–20 min, linear gradient of 10% to 90% B; 20–22 min, isocratic at 100% B; 22–24 min, return to the initial conditions. The flow rate was 0.3 mL/min, and the injection volume was 2 μL during the acquisition of negative polarity. The MS/MS analysis was performed in data-dependent scan mode, ranging from m/z = 100 to m/z 1500. All LC-MS/MS data were converted to mzXML files by MZmine-2.38. Molecular networking was carried out via the GNPS web platform (https://gnps.ucsd.edu, accessed on 7 January 2019). The spectral networks were visualized in Cytoscape 3.7.1 (www.cytoscape.org, accessed on 8 January 2019).

4.5. Extraction and Isolation of Flavonoids from M. seguinii

Dried stems of M. seguinii (1.5 kg) were extracted with 70% ethanol under ultrasonication, which was conducted 3 times over 3 days. The extract was evaporated under vacuum to yield the extract (150 g). The 70% ethanol extract (150 g) was subjected to chromatography on a Diaion HP-20 column, with elution via a H2O/MeOH gradient system (25:75→50:50→25:75→0:100) to obtain four fractions (fractions 1–4). Fraction 4 (6 g) was subjected to chromatography on a BUCHI Reveleris® purification system with an RP-18 column (C18, 40 μm, 120 g), with elution via a H2O/MeOH gradient (80:20→0:100, v:v, run time: 200 min) to obtain 14 fractions (fractions 4.1–4.14). Fraction 4.5 (500 mg) was subjected to Sephadex LH-20 chromatography with MeOH to yield five fractions (5.5.1–4.5.5). Compounds 1 and 2 from fraction 4.5.4 were purified on a Gilson HPLC system with a CH3CN/H2O isocratic solvent (26:74, v:v) and a run time of 50 min (com. 1: 32 min, 4.9 mg and com. 2: 35 min, 2.8 mg). Fraction 4.7 (460 mg) was also subjected to chromatography by using a Sephadex LH-20 (2.5 × 70 cm) system with MeOH to obtain seven fractions (4.7.1–4.7.7). Compound 3 from fraction 4.7.5 was isolated on a Gilson HPLC system with a CH3CN/H2O isocratic solvent (27:73, v:v) and a run time of 50 min (com. 3: 35 min, 3.9 mg). Compound 7 from fraction 4.7.4 was analyzed on the Gilson HPLC system with a CH3CN/H2O isocratic solvent (33:67, v:v) and a run time of 50 min (com. 7: 42 min). Fraction 4.8 was subjected to chromatography on a Sephadex LH-20 system (2.5 × 70 cm) by using MeOH to obtain seven fractions (4.8.1–4.8.7). Compounds 4 and 6 from fraction 4.8.4 (130 mg) were analyzed on a Gilson HPLC system with a CH3CN/H2O isocratic solvent (27:73, v:v) and a run time of 50 min (com. 4: 45 min, 3.5 mg and com. 6: 40 min, 3.0 mg). Fraction 4.6 was purified on a Sephadex LH-20 system (2.5 × 70 cm), with elution by MeOH to obtain five fractions (4.6.1–4.6.5). Compound 5 from fraction 4.6.5 was carried out on a Gilson HPLC system with a CH3CN/H2O isocratic solvent (30:70, v:v) and a run time of 50 min (com. 5: 42 min, 2.0 mg). Compounds 8, 9 and 10 were purified from fraction 4.3 using a Gilson HPLC system with a CH3CN/H2O isocratic solvent (20:80, v:v) and a run time of 45 min (com. 8: 26 min, 3.9 mg, com. 9: 30 min, 14.6 mg and com. 10: 42 min, 3.3 mg). From fraction 4.4, compounds 11 and 12 were isolated by using a Gilson HPLC system with a CH3CN/H2O isocratic solvent (25:75, v:v) and a run time of 30 min (com. 11: 21 min, 3.0 mg and com. 12: 28 min, 2.4 mg). The HPLC isolation conditions were as follows: flow rate 2 mL/min, UV detection at 210 and 254 nm, and a Optimapack C18 column (10 × 250 mm, 5 μm).

4.6. Spectroscopic and Physical Characteristic of Compounds

(2R,3R)-4″-O-galloylastilbin (1): Amorphous powder; [ α ] D 20 +55 (c 0.2, MeOH); UV (MeOH) λmax (log ε) 218 (3.2), 289 (3.0) nm; IR νmax 3394, 2980, 1640, 1524, 1454, 1240, 1032 cm−1; ECD (MeOH) λmaxε) 224 (7.4), 257 (1.6), 296 (–10.8), 331 (2.9) nm; 1H and 13C NMR, see Table 1 and Table 2; HRESIMS m/z 601.1221 [M – H] (calcd. for C28H25O15, 601.1193).
(2R,3S)-4″-O-galloylisoastilbin (2): Brownish gum; [ α ] D 20 −183 (c 0.2, MeOH); UV (MeOH) λmax (log ε) 200 (3.1), 216 (3.0), 291 (2.7) nm; IR νmax 3393, 2980, 1636, 1516, 1448, 1229, 1032 cm−1; ECD (MeOH) λmaxε) 224 (−8.6), 251 (−0.2), 283 (−4.4), 310 (−3.9), 343 (3.5) nm; 1H and 13C NMR, see Table 1 and Table 2; HRESIMS m/z 601.1186 [M − H] (calcd. for C28H25O15, 601.1193).
(2R,3R)-4″-O-(3‴,4‴-dihydroxybenzoyl)astilbin (3): Brownish gum; [ α ] D 20 +3 (c 0.2, MeOH); UV (MeOH) λmax (log ε) 201 (3.1), 218 (2.9), 270 (2.4), 292 (2.6) nm; IR νmax 3394, 2980, 1641, 1520, 1448, 1289, 1089, 1032 cm−1; ECD (MeOH) λmaxε) 225 (7.6), 257 (1.4), 297 (−10.4), 330 (2.9) nm; 1H and 13C NMR, see Table 1 and Table 2; HRESIMS m/z 585.1233 [M − H] (calcd. for C28H25O14, 585.1244).
(2R,3R)-4″-O-vanilloylastilbin (4): Brownish gum; [ α ] D 20 −21 (c 0.2, MeOH); UV (MeOH) λmax (log ε) 201 (2.8), 218 (2.7), 268 (2.2), 292 (2.4) nm; IR νmax 3414, 2938, 1639, 1515, 1453, 1281, 1114, 1032 cm−1; ECD (MeOH) λmaxε) 226 (9.0), 257 (1.9), 297 (−12.0), 332 (3.5) nm; 1H and 13C NMR, see Table 1 and Table 2; HRESIMS m/z 599.1396 [M − H] (calcd. for C29H27O14, 599.1401).
(2R,3S)-4″-O-vanilloylisoastilbin (5): Brownish gum; [ α ] D 20 −56 (c 0.2, MeOH); UV (MeOH) λmax (log ε) 200 (3.2), 218 (3.1), 270 (2.7), 294 (2.9) nm; IR νmax 3394, 2980, 1637, 1515, 1455, 1285, 1032 cm−1; ECD (MeOH) λmaxε) 227 (−9.4), 253 (−0.2), 284 (−4.4), 310 (−3.9), 344 (5.3) nm; 1H and 13C NMR, see Table 1 and Table 2; HRESIMS m/z 599.1382 [M − H] (calcd. for C29H27O14, 599.1401).
(2R,3R)-4″-O-(4‴-hydroxybenzoyl)astilbin (6): Brownish gum; [ α ] D 20 −42 (c 0.2, MeOH); UV (MeOH) λmax (log ε) 200 (2.8), 216 (2.6), 261 (2.2), 289 (2.3) nm; IR νmax 3370, 2980, 1640, 1514, 1452, 1275, 1165, 1032 cm−1; ECD (MeOH) λmaxε) 226 (7.7), 258 (1.3), 295 (−8.8), 332 (2.4) nm; 1H and 13C NMR, see Table 1 and Table 2; HRESIMS m/z 569.1301 [M − H] (calcd. for C28H25O13, 569.1295).
(2R,3R)-3″-O-E-feruloylastilbin (7): Brownish gum; [ α ] D 20 +36 (c 0.2, MeOH); UV (MeOH) λmax (log ε) 200 (2.9), 218 (2.8), 230 (2.7), 294 (2.7), 324 (2.6) nm; IR νmax 3340, 2972, 1638, 1515, 1270, 1162, 1032 cm−1; ECD (MeOH) λmaxε) 224 (13.0), 251 (2.1), 294 (−6.9), 326 (5.4) nm; 1H and 13C NMR, see Table 1 and Table 2; HRESIMS m/z 625.1554 [M − H] (calcd. for C31H29O14, 625.1557).

4.7. Cell Culture and Cell Viability Assay

HT22 immortalized mouse hippocampal neuronal cells at 70% confluence were cultured in DMEM (HyClone, Logan, UT, USA) supplemented with 10% fetal bovine serum (FBS), 100 U/mL penicillin and 100 μg/mL streptomycin for 48 h. Then, the HT22 cells were seeded in 96-well plates at 3000 cells/well. After incubation for 24 h, the test compounds (20 μM) were added to the cells for 24 h and cell viability was measured via the MTT (Sigma, St Louis, MO, USA) reagent method. A 20 μL aliquot of MTT solution (2 mg/mL) was injected into each well, and the plate was incubated for 3 h in the dark. After the resultant formazan crystals were dissolved in DMSO, the absorbance was measured with a microplate reader (VersaMaxTM, Randor, PA, USA) at 570 nm.

4.8. Cytotoxicity Assay of Aβ1–42-Transfected HT22 Cells

HT22 cells were seeded in 96-well plates at 3000 cells/well and incubated at 37 °C with 5% CO2 for 3 h [35,36]. The cells in each well were transfected with 0.2 μg of the pEGFP-C1/Aβ42 plasmid (originating from Professor Junsoo Park, Yonsei University, Seoul, Korea) with Lipofectamine 2000 reagent (Invitrogen, Carlsbad, CA, USA). After transfection for 10 h, the tested compounds dissolved in the medium were added to the seeded cells, and the cells were incubated for 24 h. Then, 20 μL of MTT solution (2 mg/mL) was added, and the cells were incubated for 3 h in the dark. The cells were subsequently washed with phosphate-buffered saline (PBS) (Takara, Kusatsu, Japan), and 100 mL of DMSO was added to solubilize formazan. The absorbance at 570 nm was measured with a microplate reader (VersaMaxTM, Randor, PA, USA). Fluorescence imaging was conducted by using a fluorescence microscope (Olympus ix70, Tokyo, Japan).

4.9. Statistical Analysis

Data were evaluated as the mean ± SD of three independent experiments. Data were processed by analysis of variance (ANOVA) which was conducted using SPSS Statistics 23 (SPSS, Inc., Chicago, IL, USA). Statistically significant p values were established at * p < 0.05, ** p < 0.01, *** p < 0.001.

5. Conclusions

The sample studied herein was authenticated as M. seguinii H. Lév on the basis of its morphological features and the DNA barcode technique. Seven new flavanonol glycosides with various conjugated aromatic groups and five known flavanonol glycosides were isolated by LC-MS/MS molecular networking, and their neuroprotective effects against Aβ42-induced cytotoxicity were measured. Among the isolated compounds, compounds 2, 6 and 7 showed potential neuroprotective activity. Compound 2, with a galloyl group and a cis-configuration at the C-2 and C-3 positions, showed the strongest protective activity. These results suggested that flavanonol glycosides from M. seguinii could be good candidates for use in AD treatment.

Supplementary Materials

The following are available online at https://www.mdpi.com/article/10.3390/ph14090911/s1. Figure S1: The neighbor-joining tree based on four DNA sequences. Figure S2: Molecular network of extract and fractions from M. seguinii. Figures S3–S51: HRESIMS, IR spectrum, 1D and 2D NMR spectra of compounds 1–7. Figure S52: ECD spectra of compounds 1–7. Figure S53: Cytotoxicity of compounds 1–12 in HT22 cells. Figure S54: Cell morphology of HT22 cells treated with compounds 1–12 after pEGFP-C1/Aβ1–42 plasmid transfection. Table S1: BLAST results of M. seguinii.

Author Contributions

Conceptualization, H.-J.L. and W.-K.O.; methodology, H.-J.L. and E.-J.P.; software, B.-W.L. and H.-M.C.; validation, H.-J.L. and E.-J.P.; formal analysis, H.-J.L., B.-W.L. and C.-H.P.; investigation, T.-L.-G.P. and Q.-H.H.; resources, T.-L.-G.P. and Q.-H.H.; data curation, H.-J.L. and E.-J.P.; writing—original draft preparation, H.-J.L. and B.-W.L.; writing—review and editing, W.-K.O.; visualization, H.-J.L., E.-J.P. and Q.-H.H.; supervision, W.-K.O.; project administration, W.-K.O.; funding acquisition, W.-K.O. All authors have read and agreed to the published version of the manuscript.

Funding

This research was funded by grants from the Korea Bioactive Natural Material Bank (NRF-2017M3A9B8069409) and from the Basic Science Research Program (NRF-2017R1E1A1A01074674) through the National Research Foundation of Korea funded by the Ministry of Science, ICT and Planning.

Institutional Review Board Statement

Not applicable.

Informed Consent Statement

Not applicable.

Data Availability Statement

The data presented in this study are available in article and supplementary material.

Acknowledgments

We thank Junsoo Park (Yonsei University, Korea) for the donation of pEGFP-C1/Aβ42 plasmid.

Conflicts of Interest

The authors declare no conflict of interest.

References

  1. Alzheimer’s & Dement. 2020 Alzheimer’s disease facts and figures. Alzheimer’s Dement. 2020, 16, 391–460. [Google Scholar] [CrossRef] [PubMed]
  2. Alzheimer’s Disease International; Patterson, C. World Alzheimer Repots 2018; The State of the Art of Dementia Research: New Frontiers; Available online: http://www.alzint.org/resource/world-alzheimer-report-2018/ (accessed on 21 September 2018).
  3. Busche, M.A.; Hyman, B.T. Synergy between amyloid-β and tau in Alzheimer’s disease. Nat. Neurosci. 2020, 23, 1183–1193. [Google Scholar] [CrossRef] [PubMed]
  4. Barril, X.; Orozco, M.; Luque, F.J. Towards improved acetylcholinesterase inhibitors: A structural and computational approach. Mini Rev. Med. Chem. 2001, 1, 255–266. [Google Scholar] [CrossRef] [PubMed]
  5. Gong, Y.; Chang, L.; Viola, K.L.; Lacor, P.N.; Lambert, M.P.; Finch, C.E.; Krafft, G.A.; Klein, W.L. Alzheimer’s disease-affected brain: Presence of oligomeric Aβ ligands (ADDLs) suggests a molecular basis for reversible memory loss. Proc. Natl. Acad. Sci. USA 2003, 100, 10417–10422. [Google Scholar] [CrossRef] [PubMed] [Green Version]
  6. Palop, J.J.; Mucke, L. Amyloid-β-induced neuronal dysfunction in Alzheimer’s disease: From synapses toward neural networks. Nat. Neurosci. 2010, 13, 812–818. [Google Scholar] [CrossRef] [PubMed]
  7. Ferreira, S.T.; Lourenco, M.V.; Oliveira, M.M.; De Felice, F.G. Soluble amyloid-β oligomers as synaptotoxins leading to cognitive impairment in Alzheimer’s disease. Front Cell Neurosci. 2015, 9, 191. [Google Scholar] [CrossRef] [Green Version]
  8. Cheignon, C.; Tomas, M.; Bonnefont-Rousselot, D.; Faller, P.; Hureau, C.; Collin, F. Oxidative stress and the amyloid beta peptide in Alzheimer’s disease. Redox Biol. 2018, 14, 450–464. [Google Scholar] [CrossRef]
  9. Koffie, R.M.; Meyer-Luehmann, M.; Hashimoto, T.; Adams, K.W.; Mielke, M.L.; Garcia-Alloza, M.; Micheva, K.D.; Smith, S.J.; Kim, M.L.; Lee, V.M.; et al. Oligomeric amyloid β associates with postsynaptic densities and correlates with excitatory synapse loss near senile plaques. Proc. Natl. Acad. Sci. USA 2009, 106, 4012–4017. [Google Scholar] [CrossRef] [Green Version]
  10. Tan, C.C.; Yu, J.T.; Wang, H.F.; Tan, M.S.; Meng, X.F.; Wang, C.; Jiang, T.; Zhu, X.C.; Tan, L. Efficacy and safety of donepezil, galantamine, rivastigmine, and memantine for the treatment of Alzheimer’s disease: A systematic review and meta-analysis. J. Alzheimer’s Dis. 2014, 41, 615–631. [Google Scholar] [CrossRef] [PubMed]
  11. Chopra, K.; Misra, S.; Kuhad, A. Current perspectives on pharmacotherapy of Alzheimer’s disease. Expert Opin. Pharmacother. 2011, 12, 335–350. [Google Scholar] [CrossRef]
  12. Scott, L.J.; Goa, K.L. Galantamine. Drugs 2000, 60, 1095–1122. [Google Scholar] [CrossRef] [PubMed]
  13. Stáhl, B.; Anderberg, A.A. Myrsinaceae. In The Families and Genera of Vascular Plants Flowering Plants. Dicotyledons Celastrales, Oxalidales, Rosales, Cornales, Ericales; Kubitzki, K., Ed.; Springer: Berlin, Germany, 2004; Volume 6, pp. 266–281. [Google Scholar]
  14. Oga, N.; Sakura, N. Forest vegetation of Chiba Prefecture: Vegetation catalogue of Chiba Prefecture. In Biological Society of Chiba Prefecture (de) Flora and Vegetation of Chiba Prefecture; Inoue Book Co.: Tokyo, Japan, 1975; 387p. (In Japanese) [Google Scholar]
  15. Makabe, H.; Miyazaki, S.; Kamo, T.; Hirota, M. Myrsinoic acid E, an anti-inflammatory compound from Myrsine seguinii. Biosci. Biotechnol. Biochem. 2003, 67, 2038–2041. [Google Scholar] [CrossRef] [Green Version]
  16. Bloor, S.J.; Qi, L. Cytotoxic saponins from New Zealand Myrsine species. J. Nat. Prod. 1994, 57, 1354–1360. [Google Scholar] [CrossRef] [PubMed]
  17. Githiori, J.B.; Höglund, J.; Waller, P.J.; Baker, R.L. Anthelmintic activity of preparations derived from Myrsine Africana and Rapanea melanophloeos against the nematode parasite, Haemonchus contortus, of sheep. J. Ethnopharmacol. 2002, 80, 187–191. [Google Scholar] [CrossRef]
  18. Hirota, M.; Miyazaki, S.; Minakuchi, T.; Takagi, T.; Shibata, H. Myrsinoic acids B, C, and F, anti-inflammatory compounds from Myrsine seguinii. Biosci. Biotechnol. Biochem. 2002, 66, 655–659. [Google Scholar] [CrossRef] [PubMed] [Green Version]
  19. Zhong, X.N.; Otsuka, H.; Ide, T.; Hirata, E.; Takushi, A.; Takeda, Y. Three flavonol glycosides from leaves of Myrsine seguinii. Phytochemisty 1997, 46, 943–946. [Google Scholar] [CrossRef]
  20. Ito, S.; Narise, A.; Shimura, S. Identification of a methioninase inhibitor, myrsinoic acid B, from Myrsine seguinii Lév., and its inhibitory activities. Biosci. Biotechnol. Biochem. 2008, 72, 2411–2414. [Google Scholar] [CrossRef] [PubMed] [Green Version]
  21. Matsunami, K.; Otsuka, H.; Takeda, Y. Myrseguinosides A-E, five new glycosides from the fruits of Myrsine seguinii. Chem. Pharm. Bull. 2011, 59, 1274–1280. [Google Scholar] [CrossRef] [Green Version]
  22. Metcalfe, M.J.; Figueiredo-Pereira, M.E. Relationship between tau pathology and neuroinflammation in Alzheimer’s disease. Mt Sinai J. Med. 2010, 77, 50–58. [Google Scholar] [CrossRef] [PubMed]
  23. Cho, H.M.; Lee, Y.R.; Lee, B.W.; Zhang, M.; Ryu, B.; Nghiem, D.T.; Pham, H.T.; Oh, W.K. Phenolic constituents of the roots of Rhamnoneuron balansae with senolytic activity. J. Nat. Prod. 2020, 83, 3661–3670. [Google Scholar] [CrossRef]
  24. Tourdjman, M.; Srihawong, R.; Soy, T.K.; Touch, S.; Hul, S.; Janssens, B.; Galliot-Guilley, M.; Vong, S. Plant poisoning outbreak in the western area of Cambodia, 2005. Trans. R. Soc. Trop. Med. Hyg. 2009, 103, 949–951. [Google Scholar] [CrossRef] [Green Version]
  25. Thongkhao, K.; Tungphatthong, C.; Phadungcharoen, T.; Sukrong, S. The use of plant DNA barcoding coupled with HRM analysis to differentiate edible vegetables from poisonous plants for food safety. Food Control 2020, 109, 106896. [Google Scholar] [CrossRef]
  26. Jie, C.; Pipoly, J.J. Myrsinacea through Loganiaceae. In Flora of China; Science Press: Beijing, China; Missouri Botanical Garden Press: St. Louis, MO, USA, 1996; Volume 15, pp. 1–38. [Google Scholar]
  27. Huang, H.; Cheng, Z.; Shi, H.; Xin, W.; Wang, T.T.Y.; Yu, L. Isolation and characterization of two flavonoids, engeletin and astilbin, from the leaves of Engelhardia roxburghiana and their potential anti-inflammatory properties. J. Agric. Food Chem. 2011, 59, 4562–4569. [Google Scholar] [CrossRef] [PubMed]
  28. Kuspradini, H.; Mitsunaga, T.; Ohashi, H. Antimicrobial activity against Streptococcus sobrinus and glucosyltransferase inhibitory activity of taxifolin and some flavanonol rhamnosides from kempas (Koompassia malaccensis) extracts. J. Wood Sci. 2009, 55, 308–313. [Google Scholar] [CrossRef]
  29. Slade, D.; Ferreira, D.; Marais, J.P.J. Circular dichroism, a powerful tool for the assessment of absolute configuration of flavonoids. Phytochemistry 2005, 66, 2177–2215. [Google Scholar] [CrossRef] [PubMed]
  30. Xu, J.; Li, X.; Zhang, P.; Li, Z.L.; Wang, Y. Antiinflammatory constituents from the roots of Smilax bockii warb. Arch. Pharm. Res. 2005, 28, 395–399. [Google Scholar] [CrossRef]
  31. Gratani, L. Plant phenotypic plasticity in response to environmental factors. Adv. Bot. 2014, 4, 1–17. [Google Scholar] [CrossRef] [Green Version]
  32. Yves, C. Oxidative stress and Alzheimer disease. Am. J. Clin. Nutr. 2000, 71, 621S–629S. [Google Scholar] [CrossRef]
  33. Xin, W.; Huang, H.; Yu, L.; Shi, H.; Sheng, Y.; Wang, T.T.Y.; Yu, L. Three new flavanonol glycosides from leaves of Engelhardia roxburghiana, and their anti-inflammation, antiproliferative and antioxidant properties. Food Chem. 2012, 132, 788–798. [Google Scholar] [CrossRef]
  34. Zhao, X.; Chen, R.; Shi, Y.; Zhang, X.; Tian, C.; Xia, D. Antioxidant and anti-inflammatory activities of six flavonoids from Smilax glabra Roxb. Molecules 2020, 25, 5295. [Google Scholar] [CrossRef] [PubMed]
  35. Cho, H.M.; Ha, T.K.Q.; Doan, T.P.; Dhodary, B.; An, J.P.; Lee, B.W.; Yang, J.L.; Oh, W.K. Neuroprotective effects of triterpenoids from Camellia japonica against amyloid β-induced neuronal damage. J. Nat. Prod. 2020, 83, 2076–2086. [Google Scholar] [CrossRef] [PubMed]
  36. An, J.P.; Ha, T.K.Q.; Kim, H.W.; Ryu, B.; Kim, J.; Park, J.; Lee, C.H.; Oh, W.K. Eudesmane glycosides from Ambrosia artemisiifolia (Common Ragweed) as potential neuroprotective agents. J. Nat. Prod. 2019, 82, 702–713. [Google Scholar] [CrossRef] [PubMed]
Figure 1. (A) Morphological characteristics of Myrsine seguinii H. Lév. (1) branchlets, (2) plant bark, (3) abaxial leaf, (4) adaxial leaf; (B) Cross-section of the leaf of M. seguinii. (1) upper epidermis, (2) upper collenchyma, (3) sclerencyma, (4) phloem, (5) xylem, (6) collenchymal tissues, (7) schizogenous cavity, (8) calcium oxalate crystals, (9) lower chollenchyma, (10) lower epidermis, (11) palisade mesophyll, (12) spongy mesophyll; (C) Cross-section of the stem of M. seguinii. (1) cork, (2) parenchyma cells, (3) calcium oxalate crystals, (4) parenchyma, (5) sclerenchyma cells, (6) secondary phloem, (7) secondary xylem, (8) schizogenous cavities, (9) primary xylem.
Pharmaceuticals 14 00911 g001
Figure 2. The structures of the isolated flavanonol glycosides from M. seguinii.
Pharmaceuticals 14 00911 g002
Figure 3. The key COSY and HMBC correlations of compounds 1 and 7.
Pharmaceuticals 14 00911 g003
Figure 4. (A) Neuroprotective effects of compounds 112 against cytotoxicity induced by Aβ42 plasmid transfection into HT22 cells. The cells were transfected with Aβ42 plasmids for 10 h and treated with the test compounds at 20 μM. (B) Neuroprotective effects of compounds 2, 6 and 7 at different concentrations. After incubation for 24 h, cell viability was measured using the MTT assay. Each value was calculated as the mean ± SD (n = 3); * p < 0.05, ** p < 0.01, *** p < 0.001 compared with the untreated Aβ42 transfection group.
Pharmaceuticals 14 00911 g004aPharmaceuticals 14 00911 g004b
Figure 5. Effects of compounds 112 on the intensity of the green fluorescence induced by pEGFP-C1/Aβ42 plasmid transfection using Lipofectamine in HT22 cells after 10 h of transfection. The transfected cells were continually exposed to the test compounds at 20 μM. After incubation for 24 h, the cells were visualized using fluorescence microscopy.
Pharmaceuticals 14 00911 g005
Table 1. 1H NMR data for compounds 17 in CD3OD (δH in ppm, mult. J in Hz).
No.1 a2 a3 a4 b5 a6 b7 c
25.08, d (11.1)5.48, d (2.0)5.10, d (11.2)5.09, d (11.0)5.47, d (2.1)5.09, d (11.1)5.12, d (11.0)
34.64, d (11.1)4.16, d (2.2)4.63, d (11.1)4.63, d (11.0)4.16, d (2.2)4.63, d (11.1)4.61, d (11.0)
4
5
65.94, d (1.8)6.00, d (1.9)5.93, d (1.7)5.92, d (1.7)6.00, d (2.1)5.94, d (2.0)5.93, d (2.2)
7
85.91, d (1.9)5.93, d (1.9)5.91, d (1.7)5.90, d (1.6)5.94, d (2.1)5.92, d (1.9)5.91, d (2.1)
9
10
1′
2′6.87, dd (8.1, 1.7)6.85, dd (8.3, 1.8)6.99, d (1.6)6.98, d (1.3)6.87, br s6.99, d (1.8)6.98, d (2.0)
3′6.83, d (8.1)6.89, d (8.1)
4′
5′ 6.84, overlap6.82, d (8.1)6.87, br s6.85, overlap6.80, d (8.0)
6′6.99, d (1.5)7.08, d (1.6)6.87, d (8.1, 1.7)6.87, overlap7.03, br s6.87, dd (8.1, 1.8)6.87, dd (8.1, 2.0)
1″4.06, s5.02, br s4.07, br s4.08, s5.02, d (1.2)4.08, br s4.03, d (1.3)
2″3.59, br s3.72, m3.60, m3.59, m3.74, dd (3.3, 1.5)3.60, m3.76, dd (3.1, 1.8)
3″3.93, dd (9.8, 1.3)3.68, dd (9.7, 3.3)3.94, dd (9.8, 3.2)3.95, dd (9.8, 3.1)3.70, dd (9.8, 3.4)3.94, dd (9.8, 3.2)5.08, dd (10.0, 3.2)
4″5.04, t (9.9)4.85, m5.04, t (9.8)5.07, t (10.0)4.95, t (9.9)5.07, t (9.9)3.59, m
5″4.59, d (9.9, 6.3)2.43, dq (12.4, 6.1)4.58, d (9.9, 6.3)4.56, dq (12.4, 6.1)2.43, dd (9.9, 6.2)4.58, dd (9.9, 6.2)4.45, dd (9.7, 6.2)
6″1.09, d (6.2)0.81, d (6.2)1.10, d (6.3)1.09, d (6.2)0.82, d (6.3)1.09, d (6.2)1.24, d (6.2)
1‴
2‴7.10, s7.11, s7.48, br s7.57, d (1.5)7.55, d (1.9)7.92, d (8.7)7.19, d (1.8)
3‴ 6.85, overlap
4‴
5‴ 6.84, overlap6.87, overlap6.96, d (8.4)6.85, overlap6.81, d (8.0)
6‴7.10, s7.11, s7.46, dd (8.1, 2.0)7.60, dd (8.3, 1.7)7.66, dd (8.3, 2.0)7.92, d (8.7)7.08, dd (8.2, 1.8)
7‴ 7.68, d (15.9)
8‴ 6.41, d (15.9)
9‴
OCH3 3.90, s3.96, s 3.90, s
a measured at 400 MHz. b measured at 500 MHz. c measured at 800 MHz.
Table 2. 13C NMR data for compounds 17 in CD3OD (δC in ppm).
No.1 a2 a3 a4 b5 a6 b7 c
284.082.084.084.082.084.083.9
378.674.778.778.974.778.878.9
4196.1193.6196.1196.1193.8196.1195.8
5165.6164.6165.6164.2164.2165.6165.6
697.596.497.597.597.597.597.5
7168.9169.5168.9168.8169.2168.8168.8
896.497.696.396.396.396.396.3
9164.2166.4164.2165.6166.3164.2164.2
10102.4101.6102.5102.5101.6102.5102.5
1′129.2129.2129.2129.2128.8129.2129.2
2′120.5118.9115.5115.5118.9115.6115.4
3′116.3116.2146.1146.6146.6146.6146.6
4′147.5146.6147.5147.5146.6147.5147.4
5′146.6146.3116.3116.3116.1116.4116.3
6′115.5115.2120.5120.5114.9120.6120.5
1″102.099.2102.1102.299.4102.2102.1
2″71.972.171.971.972.271.969.7
3″70.470.370.470.370.270.475.4
4″75.574.975.575.774.975.571.3
5″68.567.968.468.668.068.670.7
6″17.717.717.817.817.717.817.9
1‴121.5121.4122.6122.6122.4122.3127.8
2‴110.2110.6117.6113.7113.8132.9111.7
3‴146.5146.3146.6148.7148.7116.2149.3
4‴139.8139.8151.8152.9152.9163.6150.6
5‴146.5146.3115.9115.9116.2116.2116.5
6‴110.2110.6123.8125.3125.9132.9124.1
7‴168.2168.1168.1167.9168.0167.9146.9
8‴ 115.8
9‴ 168.9
OCH3 56.556.7 56.4
a measured at 100 MHz. b measured at 125 MHz. c measured at 200 MHz.
Publisher’s Note: MDPI stays neutral with regard to jurisdictional claims in published maps and institutional affiliations.

