1. Introduction
Since the adoption of the policy of economic reform in China in late 1970s, a large amount of concealed surplus labor force in the old communal system in the rural area was released (
Zhao, 1999;
Lu et al, 2005). Given the government relaxation in limiting rural to urban migration and the increasing income gaps between the cities and rural areas, millions of people from the rural areas migrate to the cities to seek better economic fortunes every year. The total migration, including intra-, in- and out-provincial migration, from 1982∼1987 to 1995∼2000 increased from 36 million/year to 165 million/year (
Li, 1994;
Fan, 2005a). The scale and number of human migration in China is unprecedented (
Zhao, 1999;
Liang, 2001). The vast resource of cheap migrant labor helps sustain the competitiveness of labor intensive goods manufactured in China. Current literature on migration in China primarily focused on why and how migrants move from place to place, and the consequences of their welfare (
Zhao, 1999;
Liang, 2001;
Liang and Ma, 2004;
Fan, 2005a). Little is known about its environmental effects. Migration has two potential contrasting impacts on vegetation. On the one hand, the enormous exodus of people from rural areas allows regrowth of vegetation and reduces deforestation; on the other hand, huge rural-to-urban migration provided an almost unlimited labor force for construction and the expansion of manufacturing industry, causing rapid urban sprawl and loss of vegetation (
Heilig, 1997). Urban area in China increased 25 percent from 1990 to 2000 based on satellite observations (
Liu et al., 2005). In the southern coastal regions, the expansion of urban areas can be as much as 30 percent per year (
Ji, et al., 2001). China lost approximately 500,000 ha/year of agricultural land to development in the 1990s (
Smil, 1999). However, several other recent studies found increased vegetation activity in China (Fang et al., 1999;
Xiao and Moody, 2004). The purpose of this study is to understand the environmental impacts of the large scale rural-to-urban migration, which has profound implications on the already fragile human-environment connections in China. Rural-to-urban migration is an international phenomenon, particularly in the developing countries, such as Viet Nam (
Dang et al., 1997) and Brazil (Perz, 2003). Understanding the impacts of migration on the environment in China has global implications.
2. Data and Methods
Our analysis is based on two sets of data: migration data from census and a vegetation index from remote sensing. We used China migration data at the provincial scale published in the literature for 1982-1987 (1 percent national sample survey), 1985-1990 (4
th national census), and 1995-2000 (5
th national census), as shown in
Table 1 (
Li, 1994;
Fan, 2005;
China Data Center, 2006). For convenience, we will refer the three time intervals as τ
1, τ
2, and τ
3, respectively. The environmental settings for the three municipal cities, Beijing, Shanghai and Tianjin, are significantly different from other provinces or autonomous regions. We excluded these cities in the analysis. In addition, Taiwan, Macau, Hongkong, and Xizang were not included in the analysis due to lack of data in the literature. It is well known that the definition of migration is not consistent during the three periods. A migrant before and during the 4
th census was defined as one who left his/her
hukou (household registration) location for more than one year. The temporal criterion was revised from one year to six months in the 5
th census. It is difficult to assess the effect of the change in the definition on the total migration assessment (
Fan, 2005b). However, it is reasonable to assume that the difference in the definition of migration causes systematic errors which would not significantly alter the results of subsequent statistical analysis. There are three types of migration with regard to its direction and distance: intra-, in-, and out-provincial migration. Due to the differences in the areas and population among the provinces, the total migration do not compare well. We normalized the increase in migration to become the rate of increase in migration for better comparison among provinces as in the following:
where ΔM
ij (j<i) is the rate of change in migration from τ
j to τ
i, and M
i and M
j is the number of migrants in a province at time τ
i and
j. ΔM
ij is calculated for intra-, in-, out-migration and total migration, respectively.
The abundance of vegetation is quantified by the Normalized Difference Vegetation Index (NDVI), which is a standard measure of the abundance of active green vegetation with satellite observations. NDVI varies within [-1, 1] with a higher NDVI indicating more abundance of green vegetation. It is calculated based on the reflectance measured in the red and near-infrared spectra as
where ρ
NIR and ρ
RED are reflectance in the near-infrared and red bands, respectively.
The remotely sensed data used in this study is the continuous measurements of time series NDVI from the Advanced Very High Resolution Radiometer (AVHRR) on board the NOAA-series satellites from 1982 to 2000 with a spatial resolution of 8×8 km (
Tucker, et al., 2005). AVHRR provides daily NDVI measurements for the entire globe. However, NDVI can be contaminated by the aerosols and the clouds in the atmosphere. The dataset used in this study is a 15-day composite NDVI, which takes the maximum NDVI from the 15 daily values for each pixel to minimize the contamination from the atmosphere. Therefore, there are twenty four AVHRR NDVI images for China each year. We use the annual total NDVI (ATN) as indicator for vegetation abundance in this study. Due to the fact that each census or 1 percent sample survey spanned six years, we took the mean ATN (MATN) during the same six years as the measure of vegetation amount so that the measurement of vegetation abundance corresponds to the same period of time over which the migration data were collected. NDVI for water pixels was set to -1. Pixels that remain water for the entire year is excluded from the analysis, i.e. pixels with ATN being -24 were not used because their NDVI is not influenced by migration. After the 15-day composite, some pixels remain contaminated by clouds. These pixels were flagged in the NDVI dataset. Single missing value due to cloud contamination was filled with the average of the two NDVI values from the same pixel that were immediately before and after the missing one in time. If there were two missing values next to each other in time, we replaced the first missing value with the NDVI that is immediately before and the second one with that immediate after the missing value. If a pixel had three or more missing values within a year, the NDVI of the pixel for that year was considered missing, and MATN was calculated with the remaining data points during the 6 years. We did not perform any spatial interpolation to fill missing values as the process might change the spatial pattern of vegetation, which is critical to our analysis. We then converted the MATN to a point coverage using ArcGIS version 9.1 using the longitude and latitude at the center of the pixel as the coordinates for the points. The point coverages were overlayed on the 1982 provincial polygons. For the convenience of comparison through time, we merged Hainan province with Guangdong and Chongqiang municipal city with Sichuan province as they were separated out from the corresponding provinces in 1988 and 1997, respectively. Otherwise, the data from these provinces could not be compared through time. We did a point in polygon analysis and calculated the average of MATN (AMATN) for all points within a province for each census period. Unlike migration, changes in NDVI are comparable among provinces without normalization. We evaluated the change in vegetation abundance in each province as in the following:
where ΔV
ij (j<i) is the change in vegetation abundance from τ
j to τ
i, and AMATN
i and AMATN
j are the provincial Average of the Mean Annual Total NDVI during τ
i and τ
j, respectively. ΔV
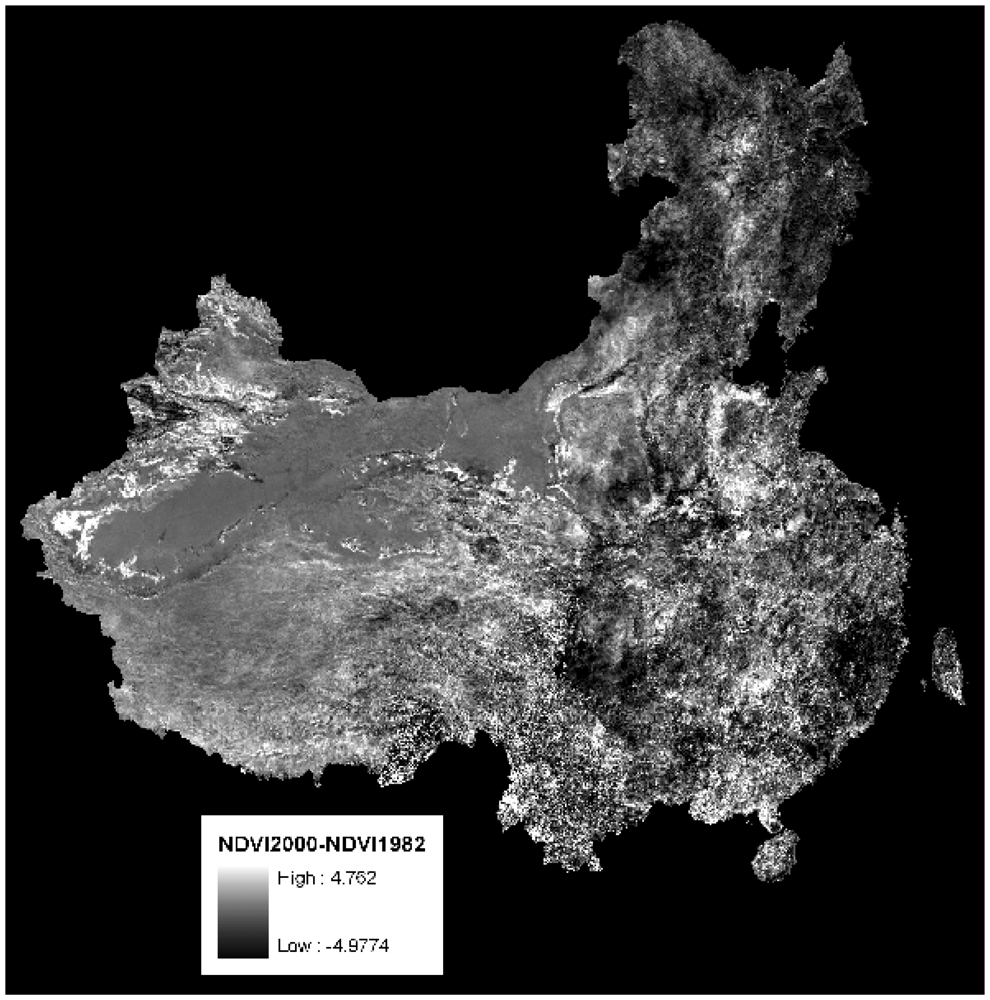
31 is the change in AMATN from τ
1 to τ
3 as shown in
Figure 1. We did not present results for the analysis from τ
1 to τ
2 due to the overlap and short interval in time.
Growth of vegetation without human disturbance is primarily determined by temperature and precipitation (
Lieth, 1972). Due to the trend of global warming, changes in temperature and precipitation can also alter vegetation dynamics in China. Therefore, we also analyze the relationship between change in temperature and precipitation and the change in vegetation abundance. The annual mean temperature and annual total precipitation for each province in China were obtained from the global monthly climatology dataset available at Oak Ridge National Laboratory (
http://www.daac.ornl.gov). We did not normalize the changes in temperature and precipitation as we did for migration as they are comparable across the provinces. The change in temperature is calculated as ΔT
ij=T
i-T
j, where j<i, and T
i and T
j are the provincial mean annual temperature during τ
i and τ
j, respectively, and the change in precipitation is calculated similarly as ΔP
ij=P
i-P
j. Due to the fact that climate change is related to human activities (
Zhou et al., 2004;
Kaufmann et al., 2007), we need to remove these effect in the climate data in order to fully understand the impacts from human activities. Our data show there is a statistically significant relationship between migration and changes in temperature and precipitation. Therefore, we first regressed ΔT
ij and ΔP
ij with ΔM
ij, separately, and obtain the residuals from the regressions,
rΔT
ij and
rΔP
ij. These residuals of change in temperature and precipitation would not contain the effect from migration. We then did a multiple regression of ΔV
ij with
rΔT
ij and
rΔP
ij, and obtain the residuals,
rΔV
ij, from which the impacts of changes in temperature and precipitation are removed, while the impact from changes in migration remains. We finally did a regression between
rΔV
ij with ΔM
ij to evaluate the impact of migration on vegetation dynamics controlled for effect of the changes in temperature and precipitation.
In addition to temperature and precipitation, we also studied the impact of the change in gross primary production (GDP) (
China Compendium of Statistics, 2005) on vegetation abundance to account for possible impact from other sectors of the economy. Similar to migration, change in GDP was normalized to become rate of increase in GDP from τ
j to τ
i (ΔGDP
ij).
3. Results and Discussions
The three data points, 1982∼1987 (τ
1), 1985∼1990 (τ
2), and 1995∼2000 (τ
3), allow us to examine the impacts of migration on vegetation dynamics between three periods. However, the first two data points have a two-year overlap, thus results between these two periods were not included here. We analyzed the relationships between ΔV
ij and ΔM
ij for intra-, in-, and out-migration as well as for the total migration during [τ
1, τ
3] and [τ
2, τ
3]. Regression results are given in
Table 2, indicating that all forms of migration negatively influences vegetation abundance. The influence of in-migration on vegetation abundance is statistically significant for both periods, and dominates the effect of migration. In-migrants are pulled by existence of better economic opportunities. Migrant workers often take low-skill labor intensive manufacturing jobs in the cities, thus more in-migrants are indicative of industrial expansion, which is usually associated with urban sprawl and causes dramatic decrease in NDVI. Though the influences from intra- and out-provincial migration are not statistically significant either for [τ
1, τ
3] or for [τ
2, τ
3], the negative impacts are increasing. Intra-provincial migration has similar effect on vegetation as in-migration, but to a much smaller extend. Net economic gain is the driving factor for rural-to-urban migration. In general, there is a high cost associated with migration from one province to another. There must be a greater economic return at the destination for in-migrants. A greater vigor of industrial growth is needed to attract people from another province than attracting people within the province. Therefore, a greater deal of urban expansion is associated with in-migration than intra-provincial migration, leading to stronger negative impact on vegetation growth for in-migration compared with intra-provincial migration. Contrary to our expectation, out-migration also negatively influences vegetation abundance, though not statistically significant. We originally hypothesized that reduction of population in the rural areas allows the regrowth of vegetation. However, remittance sending back from out-migrants may expedite land-cover/land-use change in the rural area, reducing vegetation growth. Based on a recent trip to the rural areas in Anhui province, a major out-migration province, the first author of this study observed that a large proportion of households with people working away built a new house with the money earned. Therefore, the negative effect on vegetation from out-migration outweighs the positive effect at the provincial scale.
The statistical results in
Table 2 contain the confounding effects from other factors, particularly changes in temperature, precipitation, as well as other economic activities. Therefore, we evaluated the percent increase in vegetation abundance with temperature, precipitation and GDP (
Table 3). The relationship between change in vegetation abundance from τ
1 to τ
3 (ΔV
31) is also statistically significant with rate of increase in gross domestic production (ΔGDP
31), but its R
2 is lower compared to changes in temperature and precipitation as well as the rate of increase in migration. GDP reflects the economic activities in all sectors of the economy, many of which are not directly influenced by rural-to-urban migration though migrant related manufacture is a significant component of GDP in China. Therefore, GDP should be significantly related to decrease in vegetation, but to a less degree compared to migration.
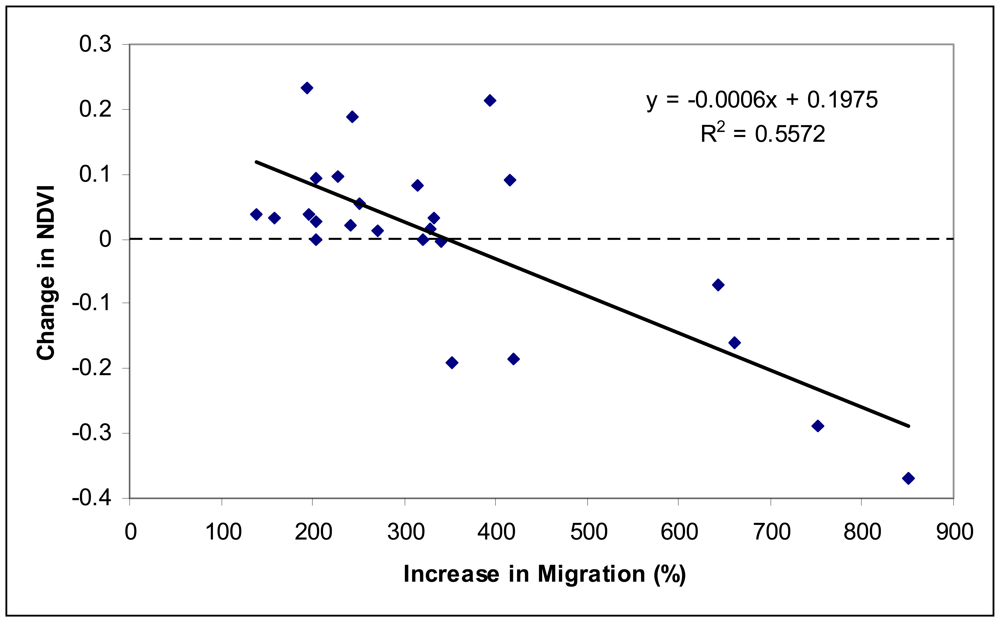
Figure 2 shows the negative relationship between the rate of increase in total migration from τ
1 to τ
3 and change in AMATN during the same period for each province as listed in
Table 1 after controlling the effects from changes in temperature and precipitation. The relationship is stronger compared to that in
Table 2, indicating climate change obscured the impacts of migration on vegetation dynamics.
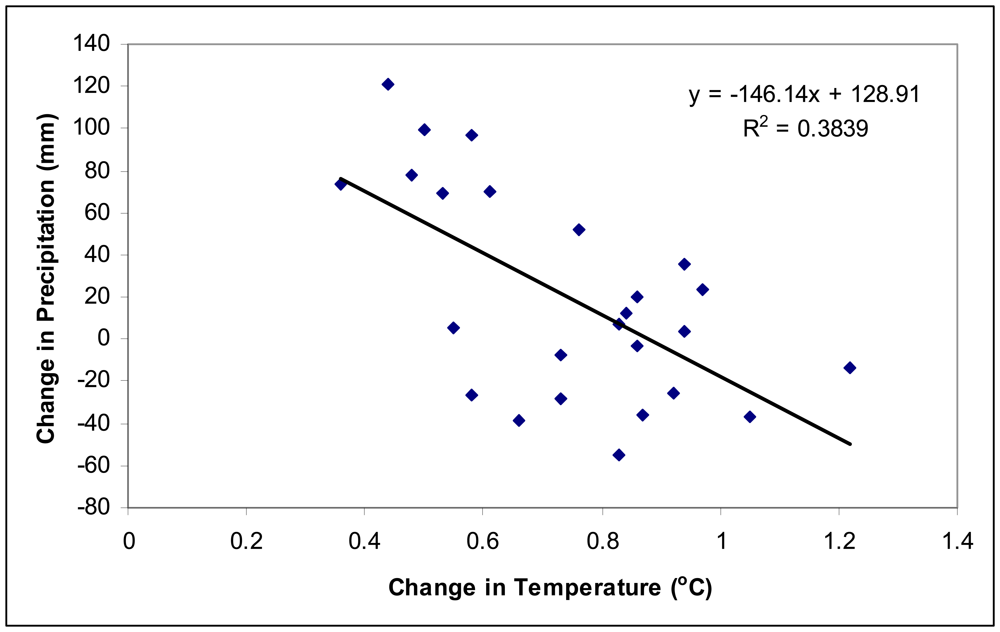
Both changes in temperature and precipitation significantly influence change in vegetation abundance. Increase in temperature increases vegetation abundance. This agrees with satellite observations in other parts of the world as a result of global warming (
Myneni et al., 1997;
Zhou et al., 2003). However, the change in vegetation abundance is negatively correlated with changes in precipitation. Further analysis found that the change in precipitation is negatively correlated with change in temperature in China from τ
1 to τ
3 (
Figure 2). The R
2 between ΔT
ij and ΔV
ij is much higher than that between ΔP
ij and ΔV
ij in
Table 3, thus temperature dominated the effect of climate change on vegetation dynamics during this time in China.
Though the negative relationship is statistically significant and strong between the change in vegetation abundance and the rate of increase in migration in
Figure 2, the overall NDVI in China increased during 1982∼2000 (
Fang et al., 2004).
Figure 2 does not contradict the finding as the change in vegetation abundance for most of the provinces are positive. Despite the rapid urbanization and many other environmental problems created by the fast economic growth (
Liu et al., 2005), a positive feedback from the economic growth is the increased investment in environmental projects (
Nei, 2005), which would not be affordable otherwise. As a result, China's forest cover increased dramatically from 12.0 percent in 1982 percent to 18.2 percent in 2003 (
Zhang and Song, 2006). China returned over 24 million hectares of low productivity agricultural land to forest since 1999, increasing forest cover by 2 percentage points (People's Daily, August 26, 2007). Given that there are many other factors that may influence vegetation growth in China, it is impressive that total migration alone explained 55 percent of the variation in the change in NDVI at provincial scale after controlling for temperature and precipitation effects. Therefore, migration should be an important factor in making environmental policies, such as those aiming at carbon sequestration via increased vegetation growth.


