Feature Extraction and Spatial Interpolation for Improved Wireless Location Sensing

Abstract
:1. Introduction
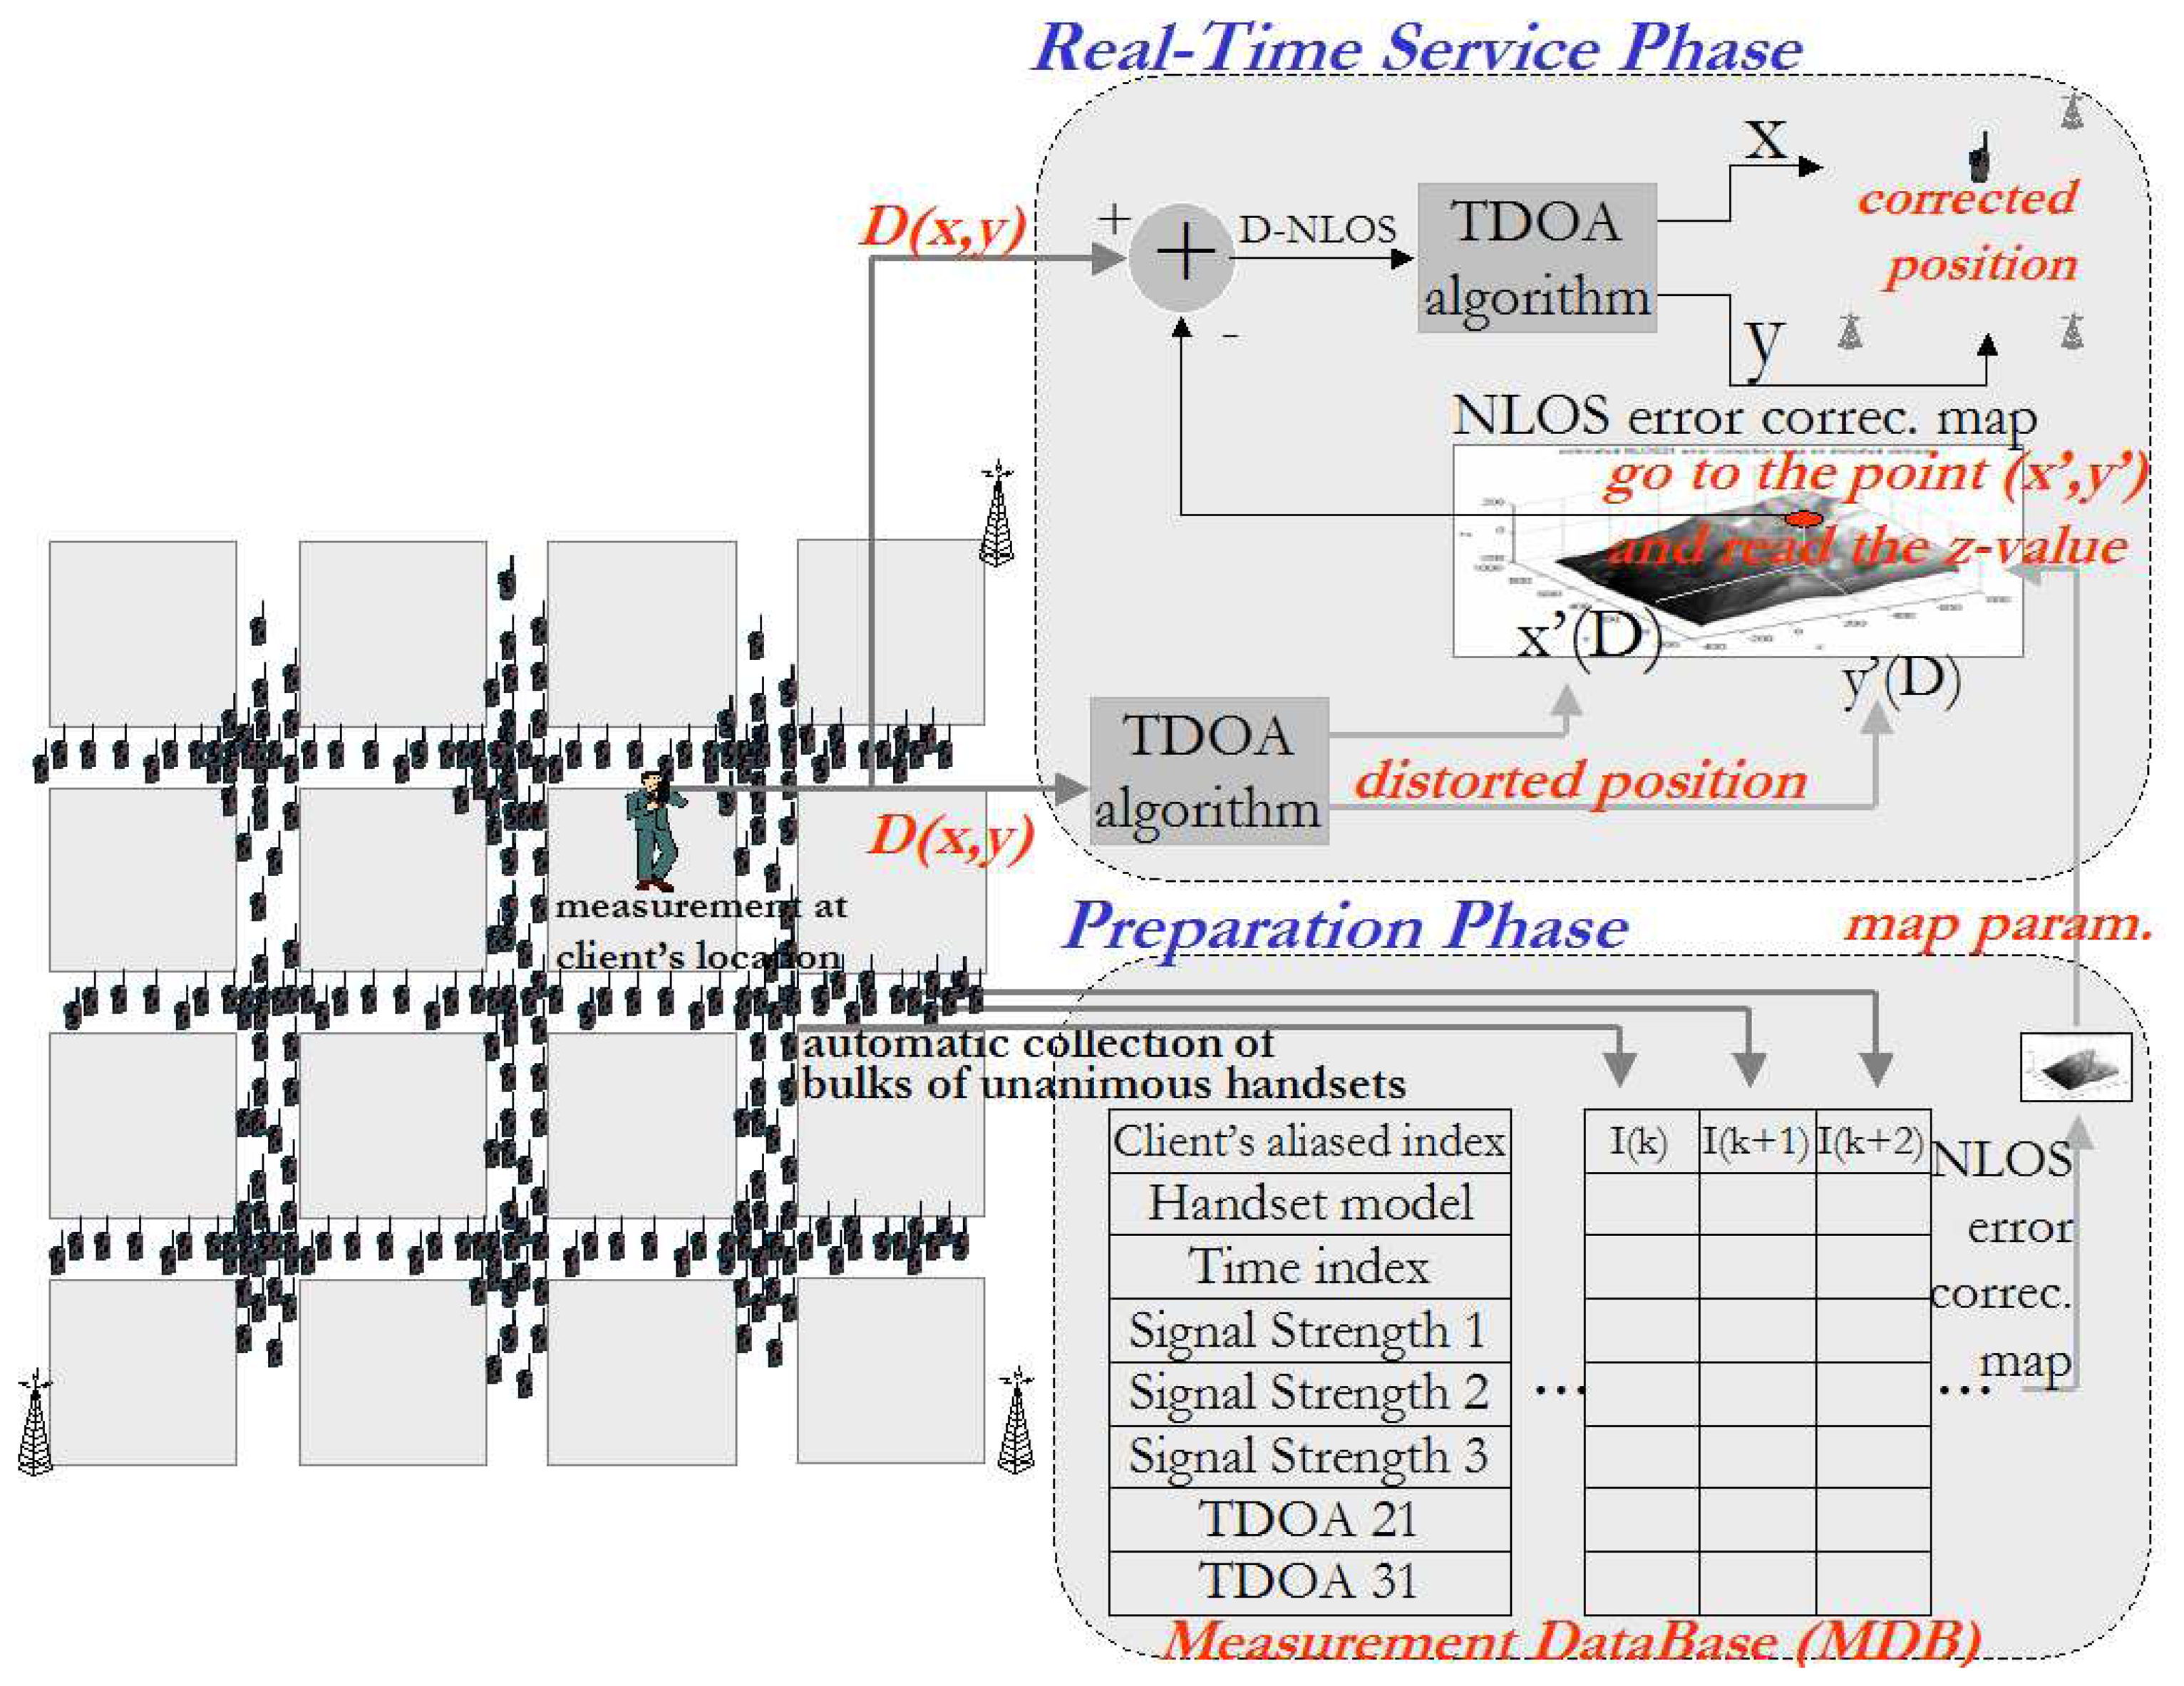
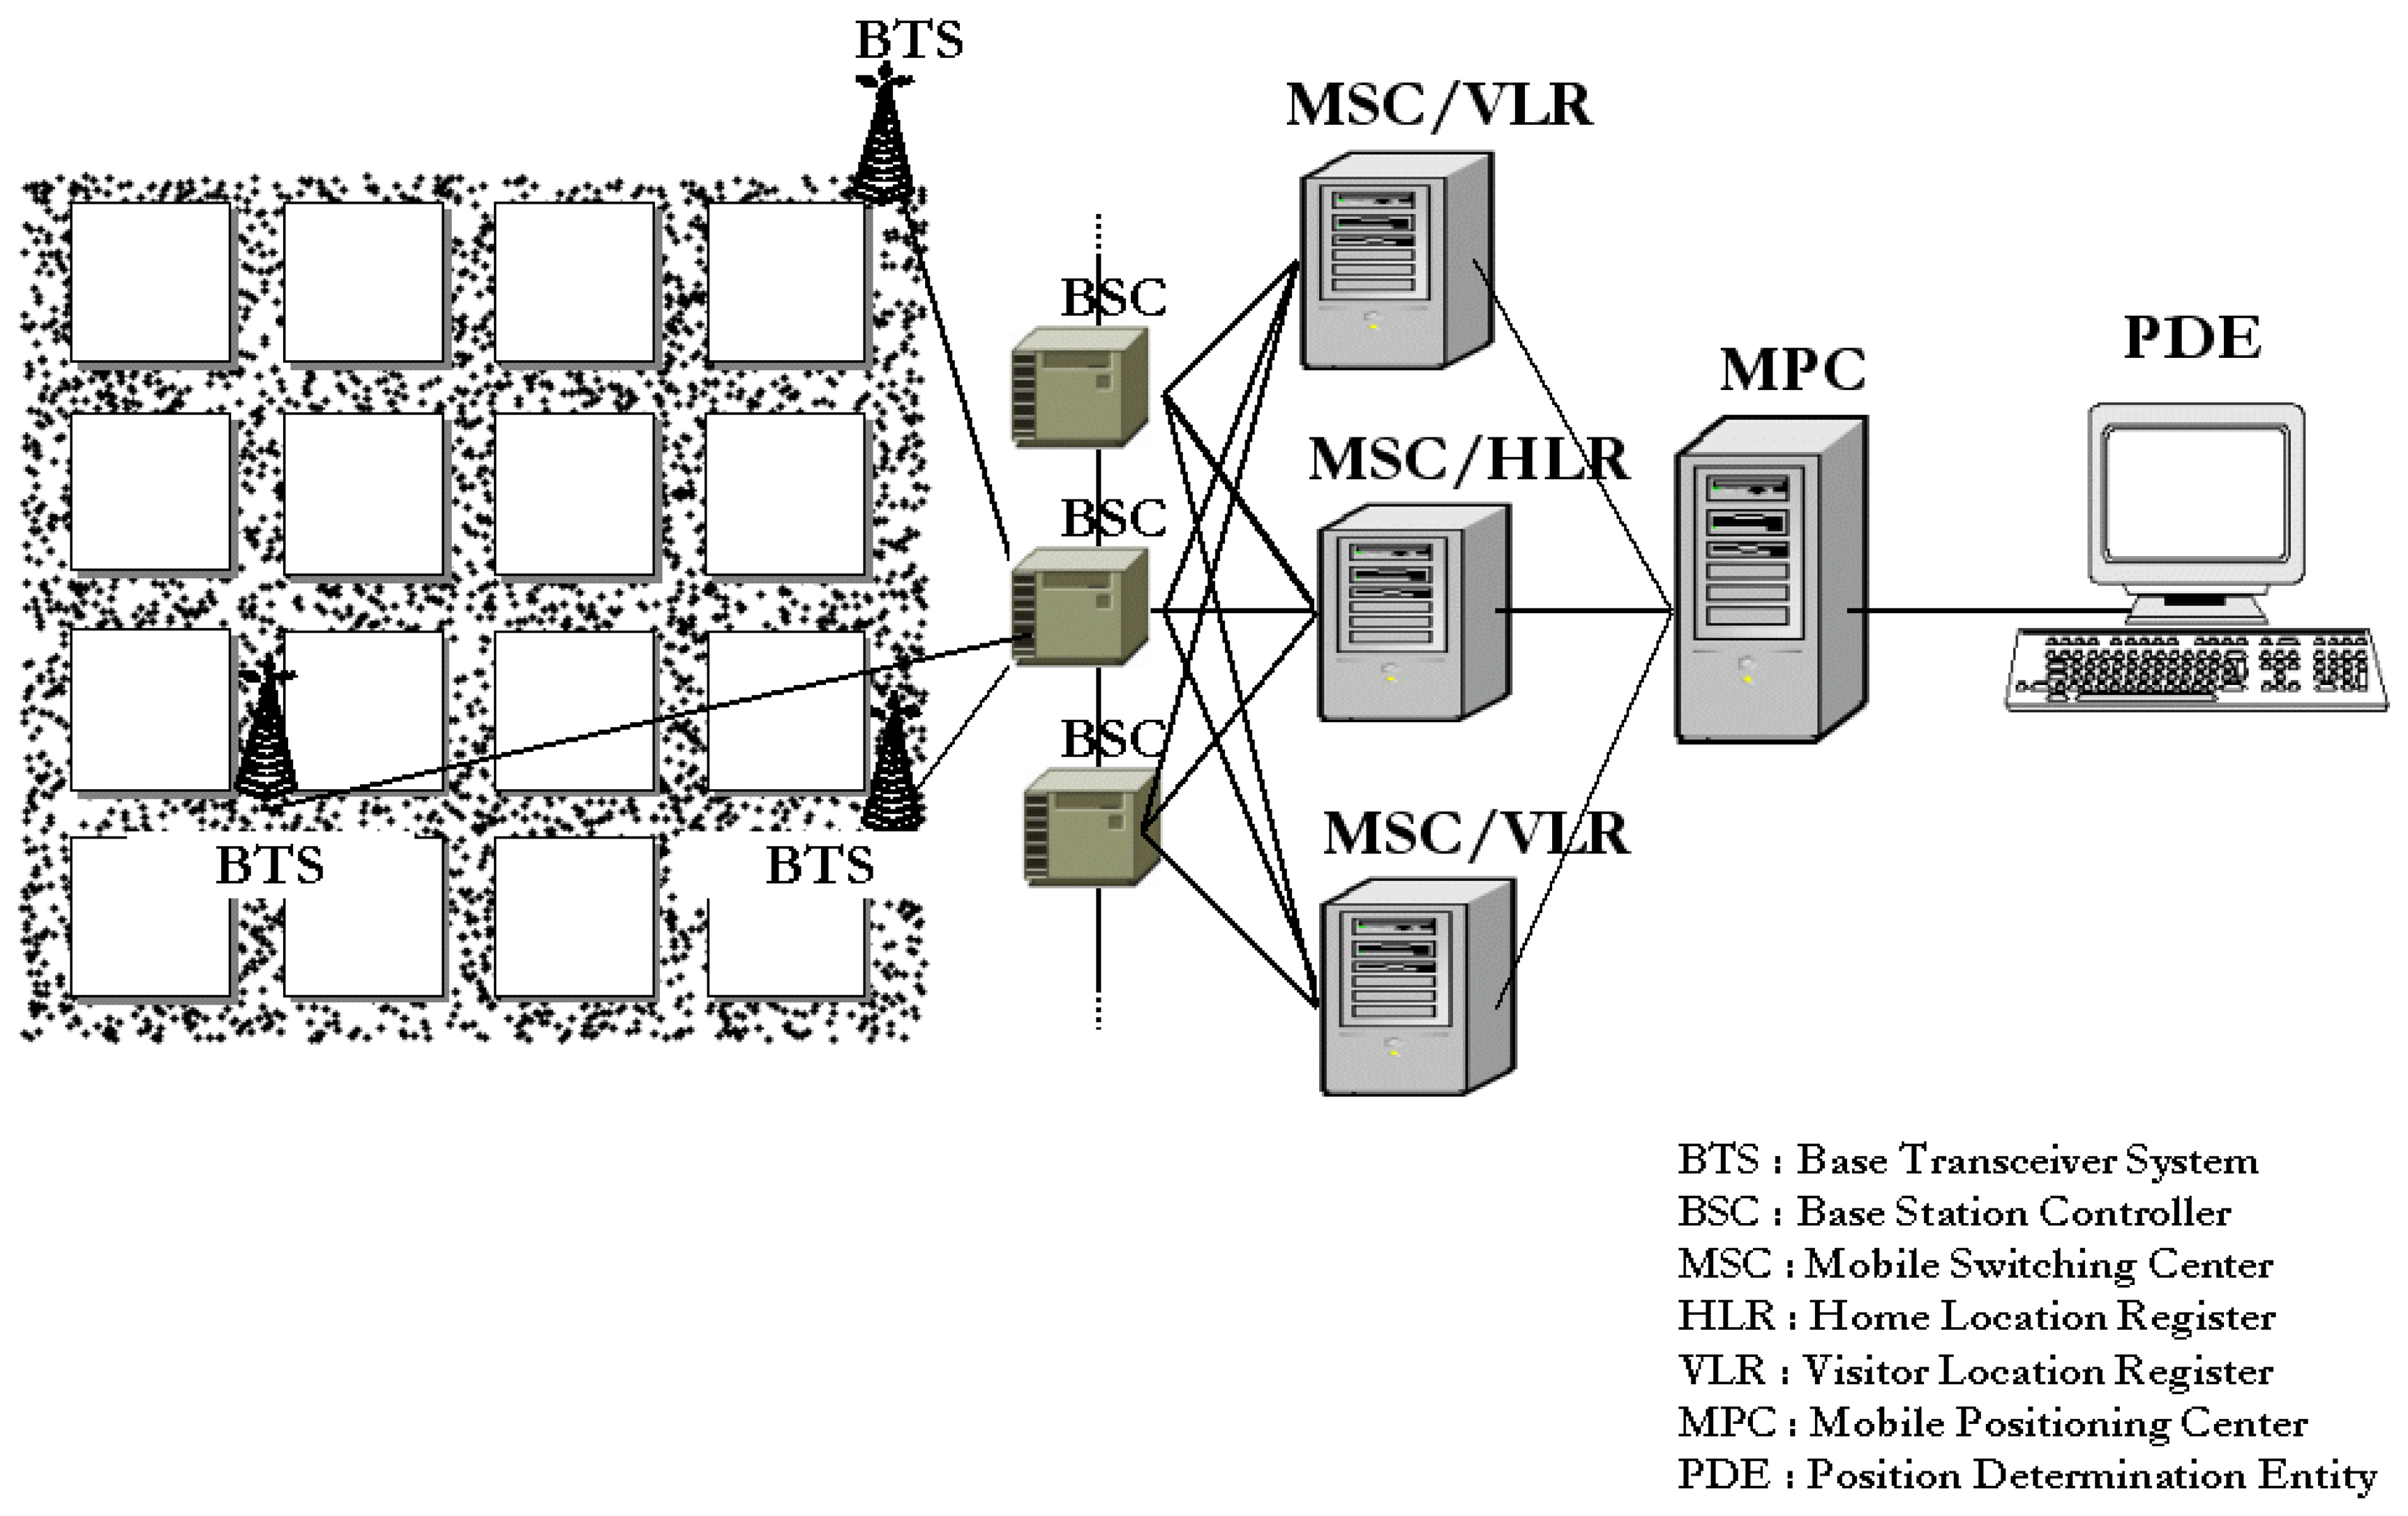
2. Localization Exploring Network Measurement Occurances
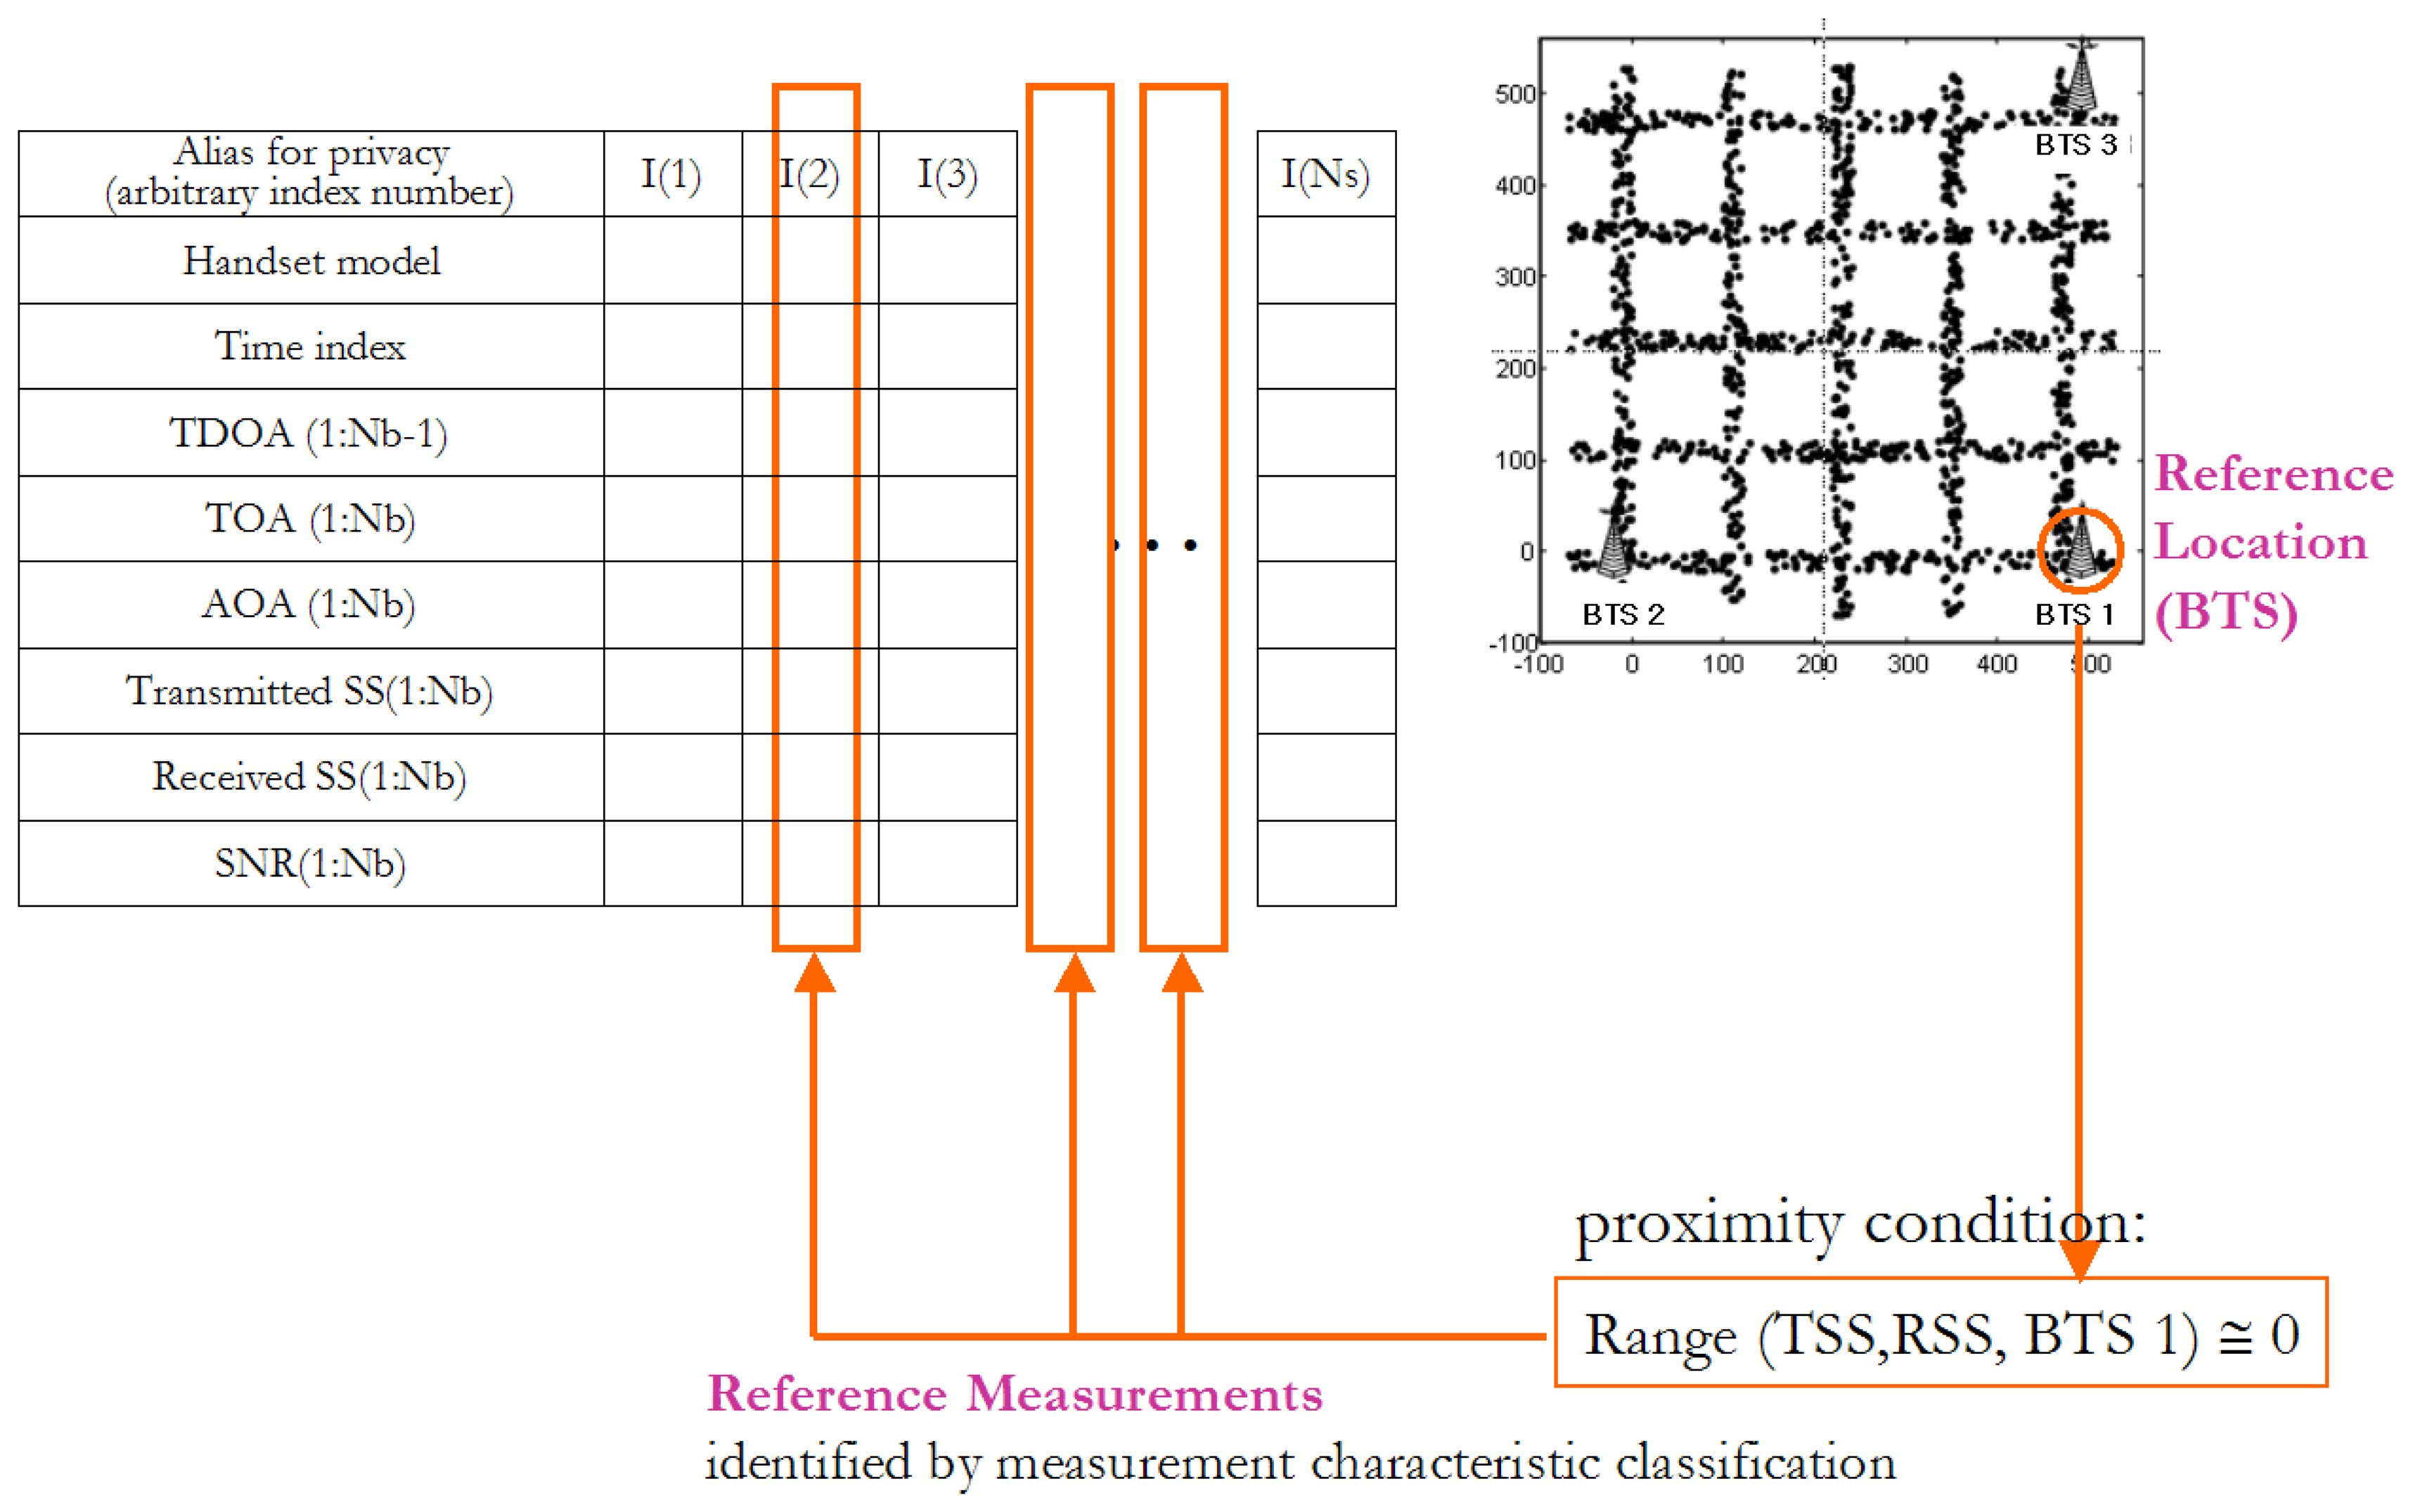
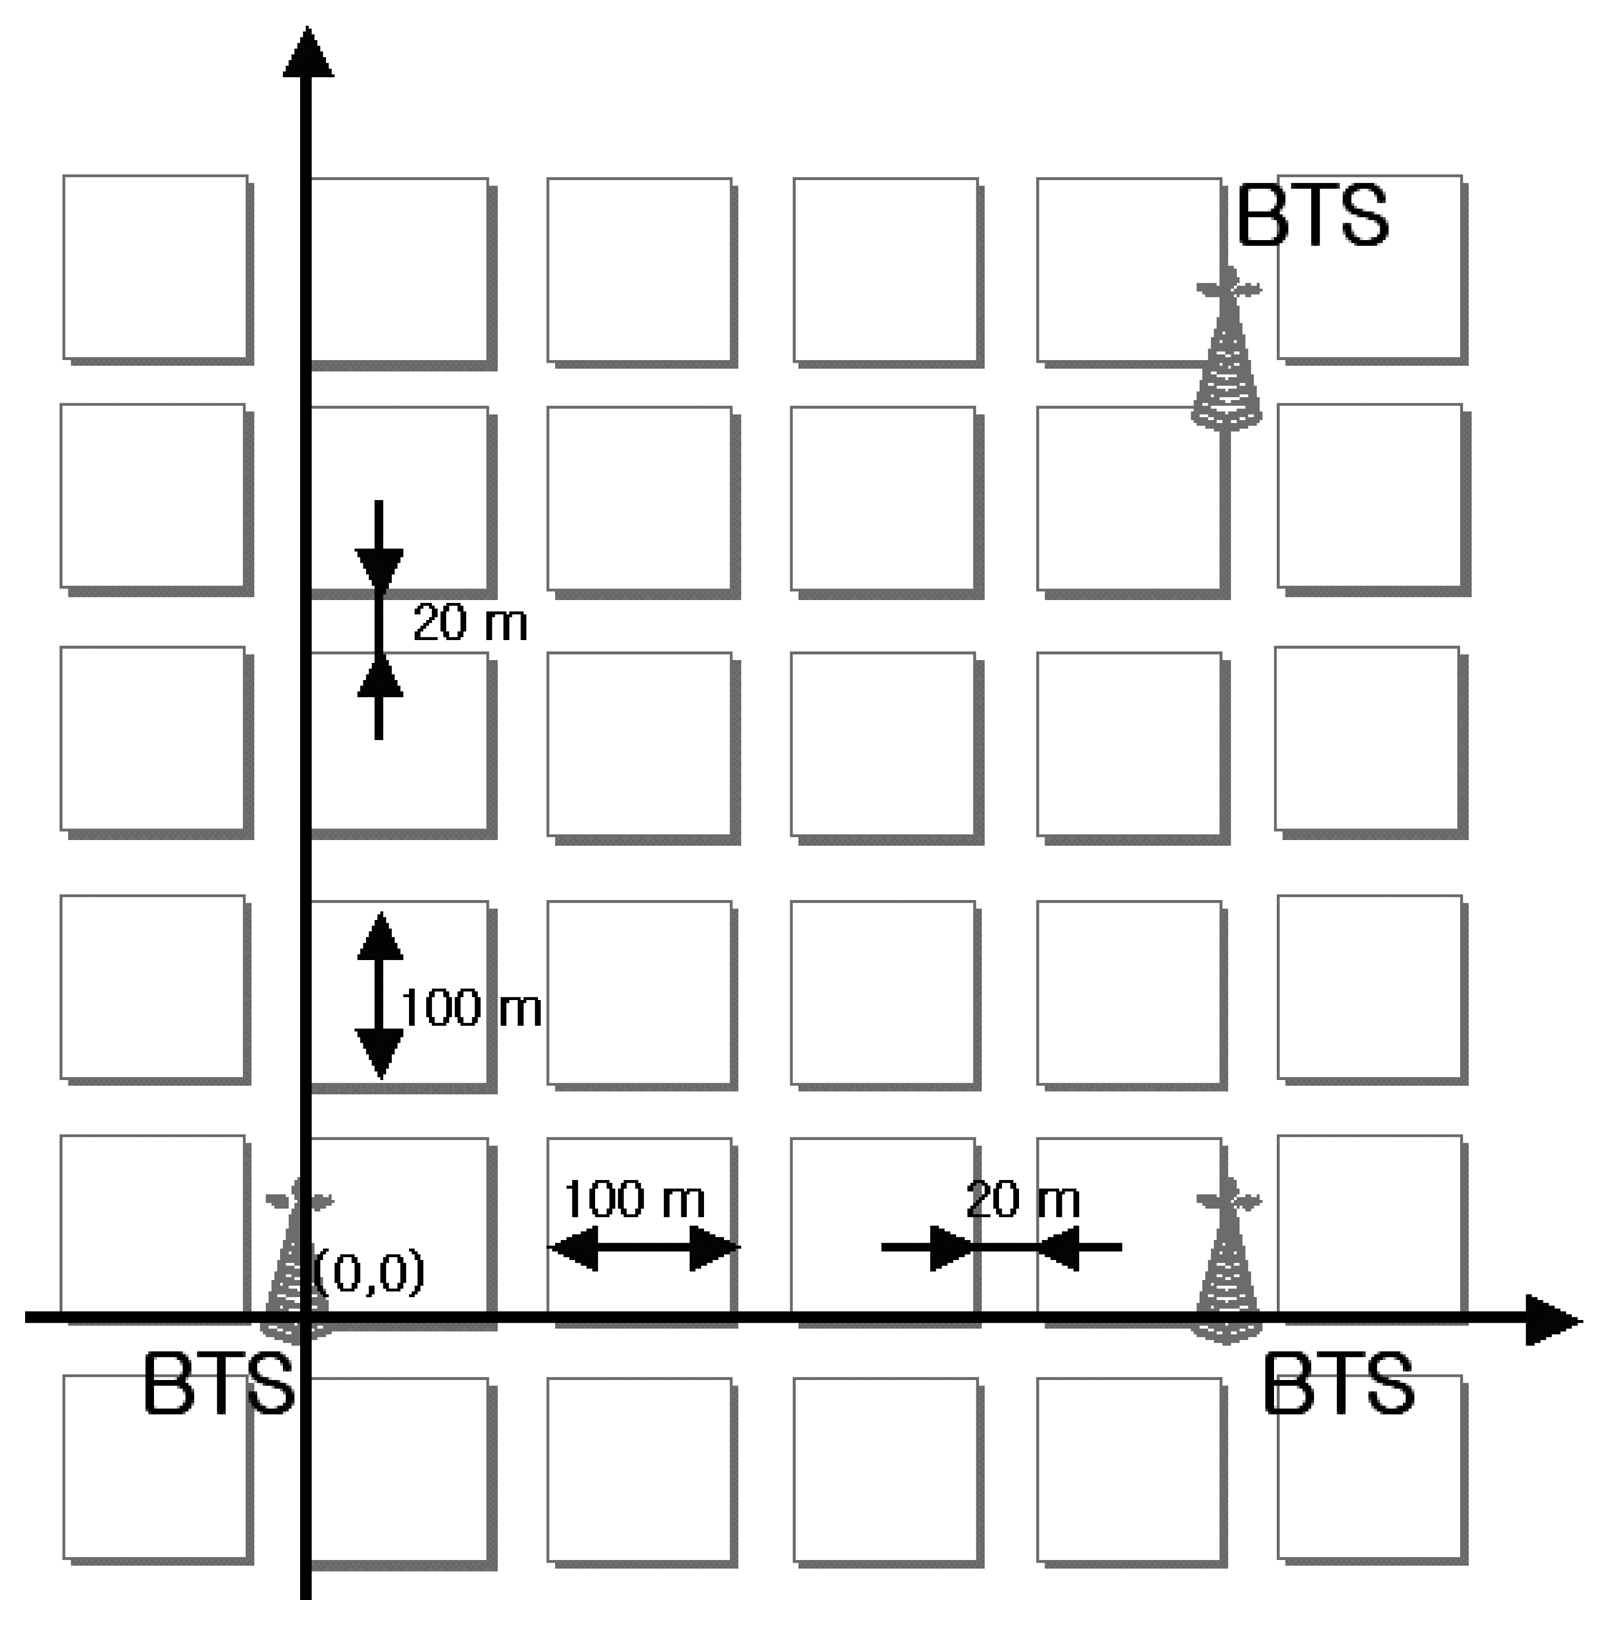
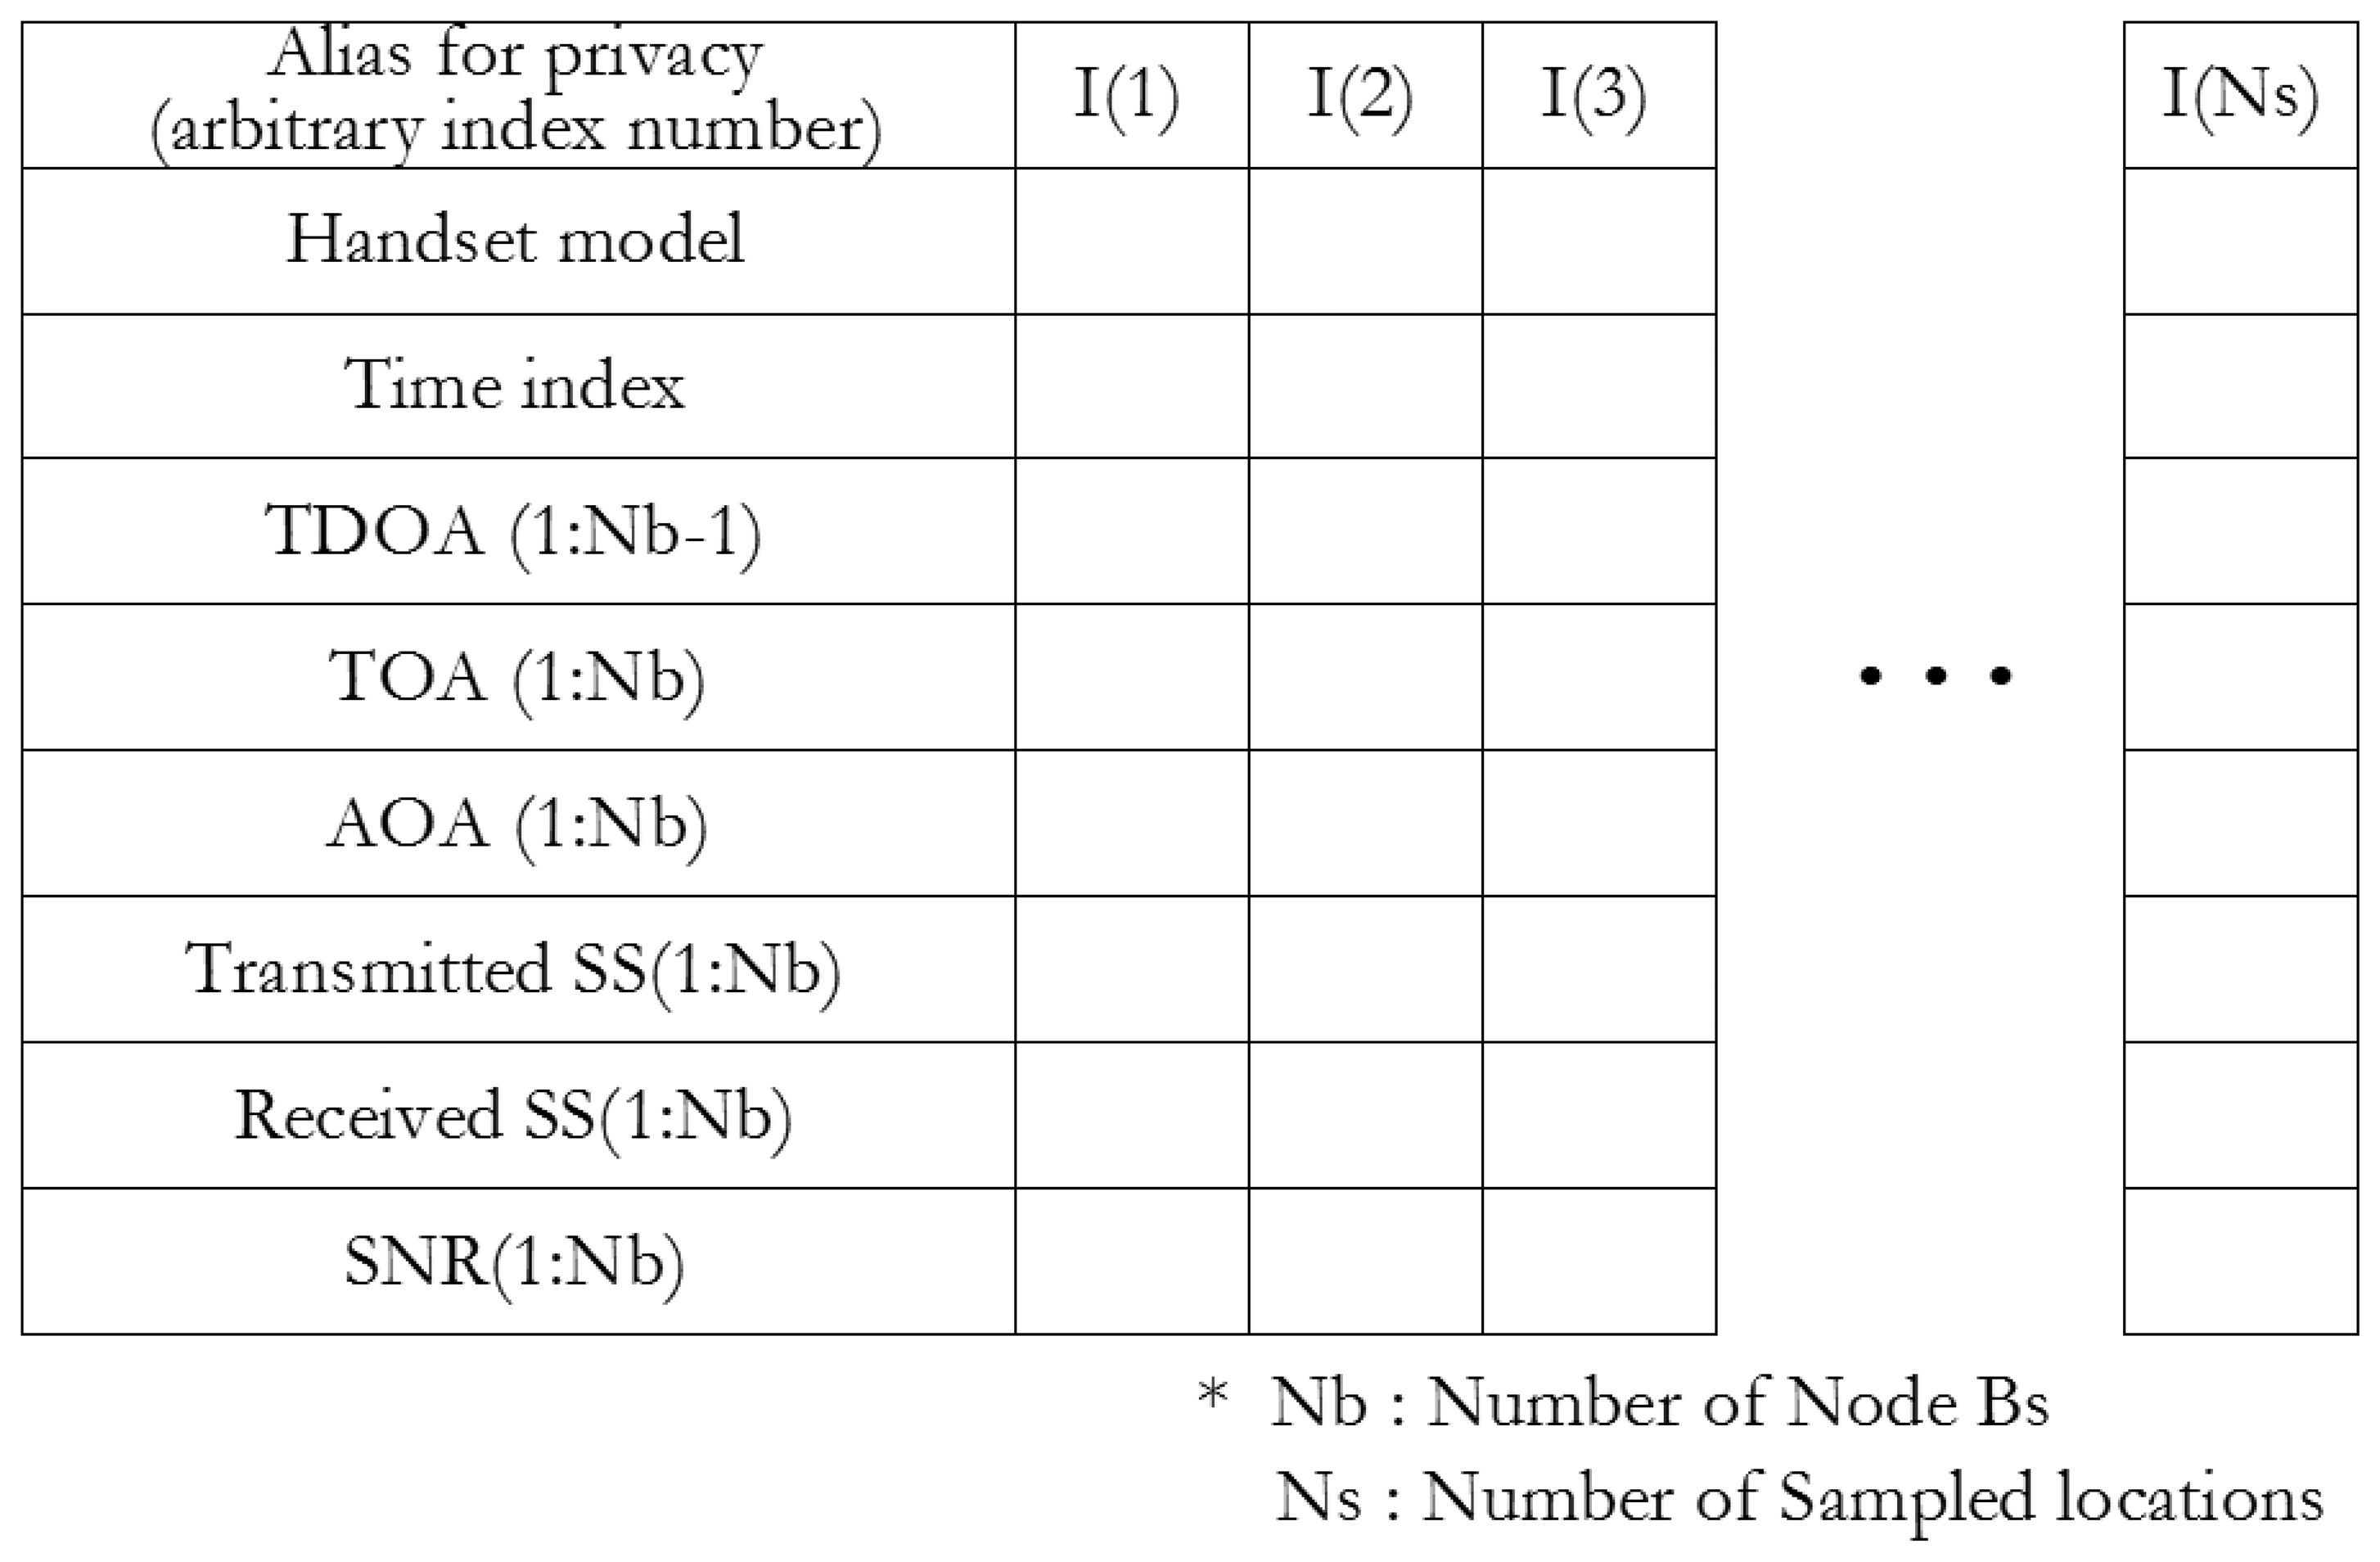
2.1. Measurement Sampling and Data Structure
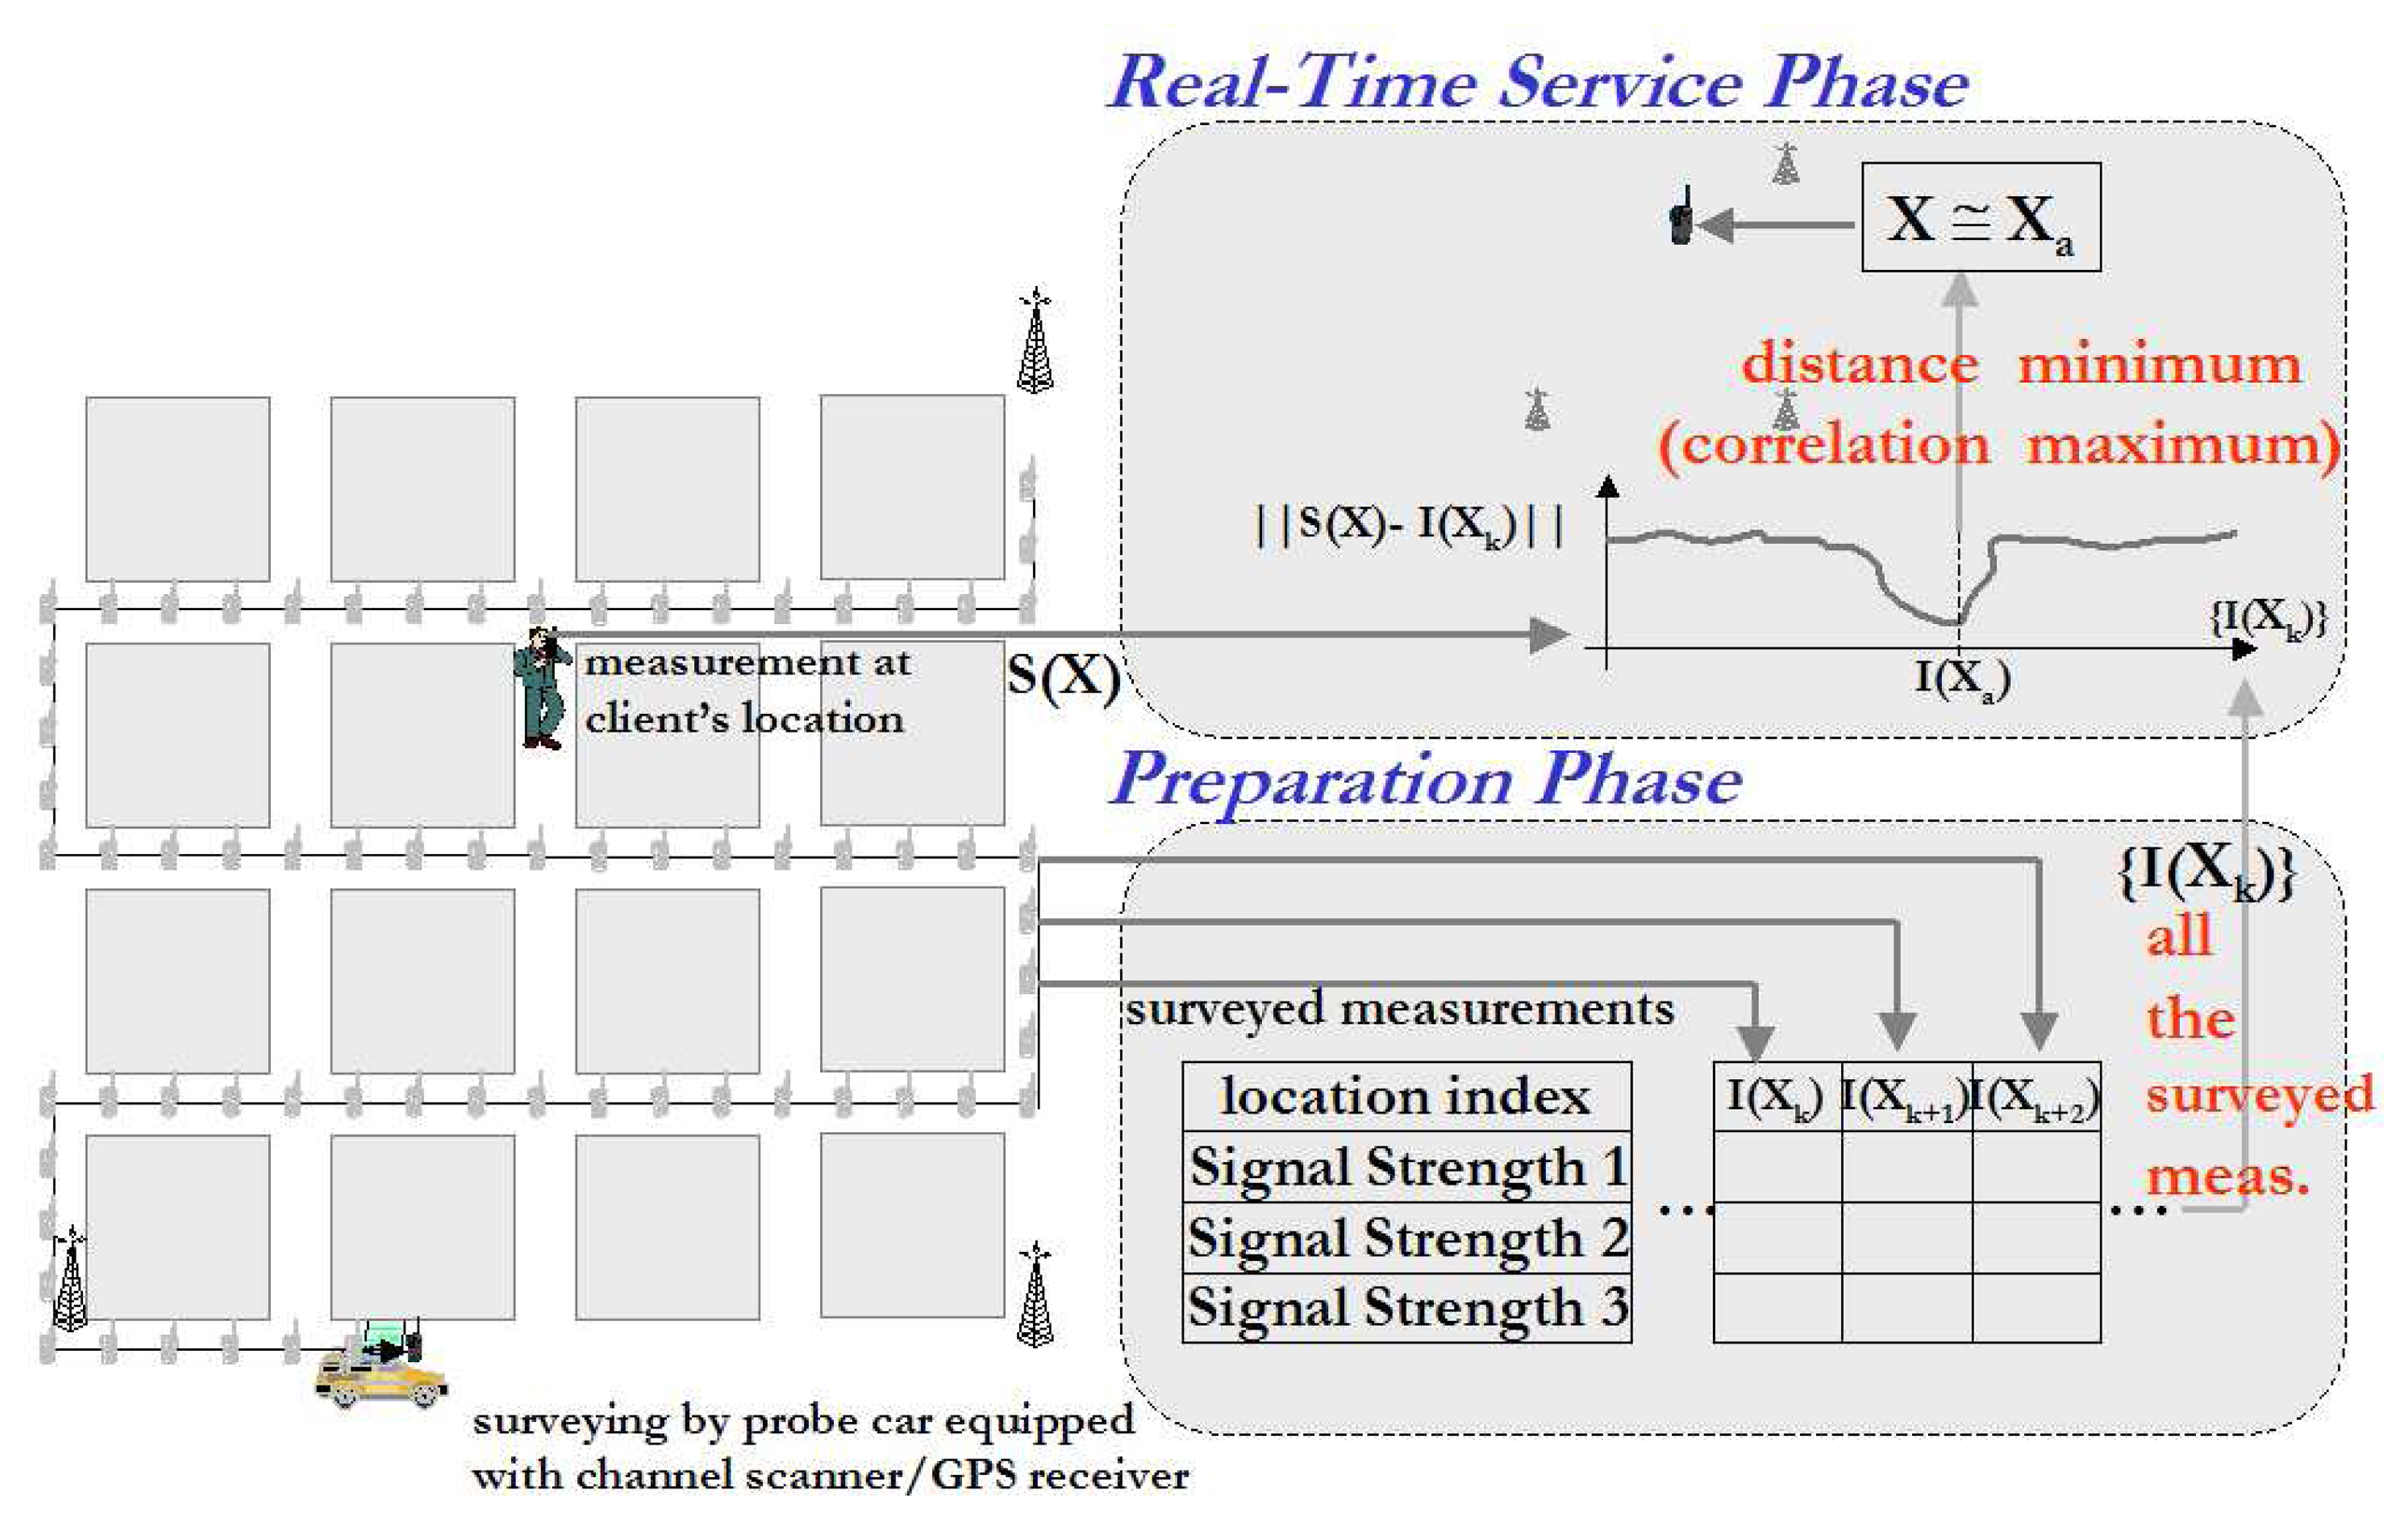
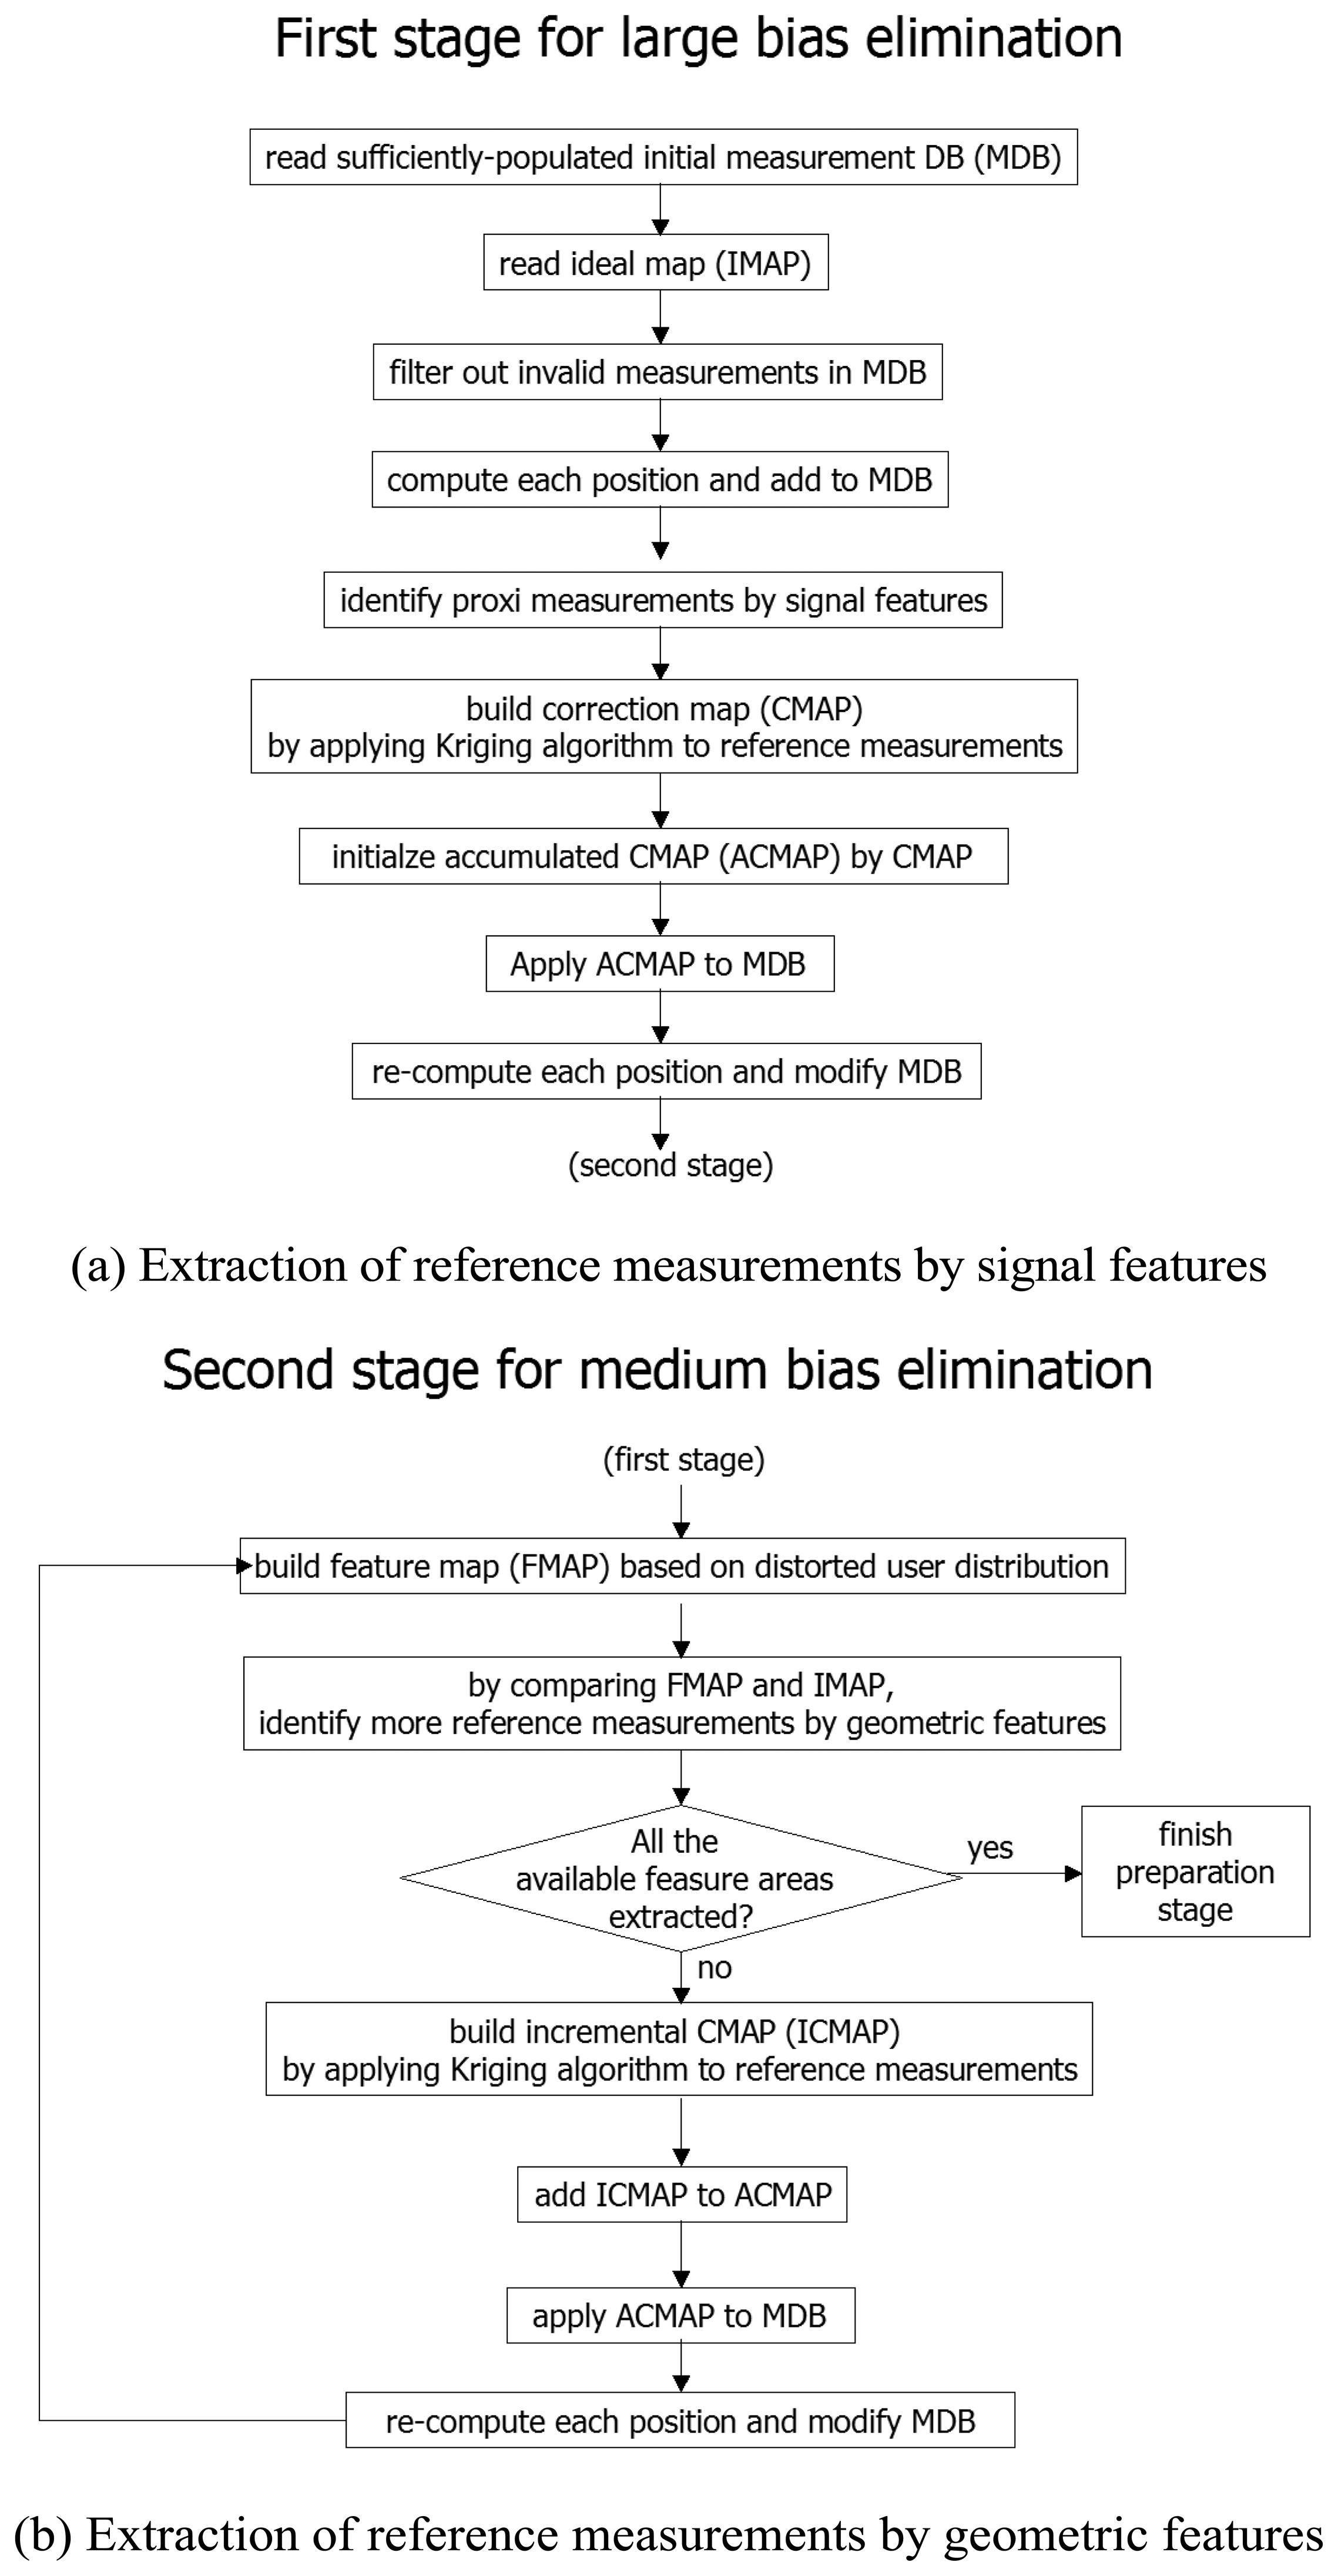
2.2. Reference Measurement Extraction
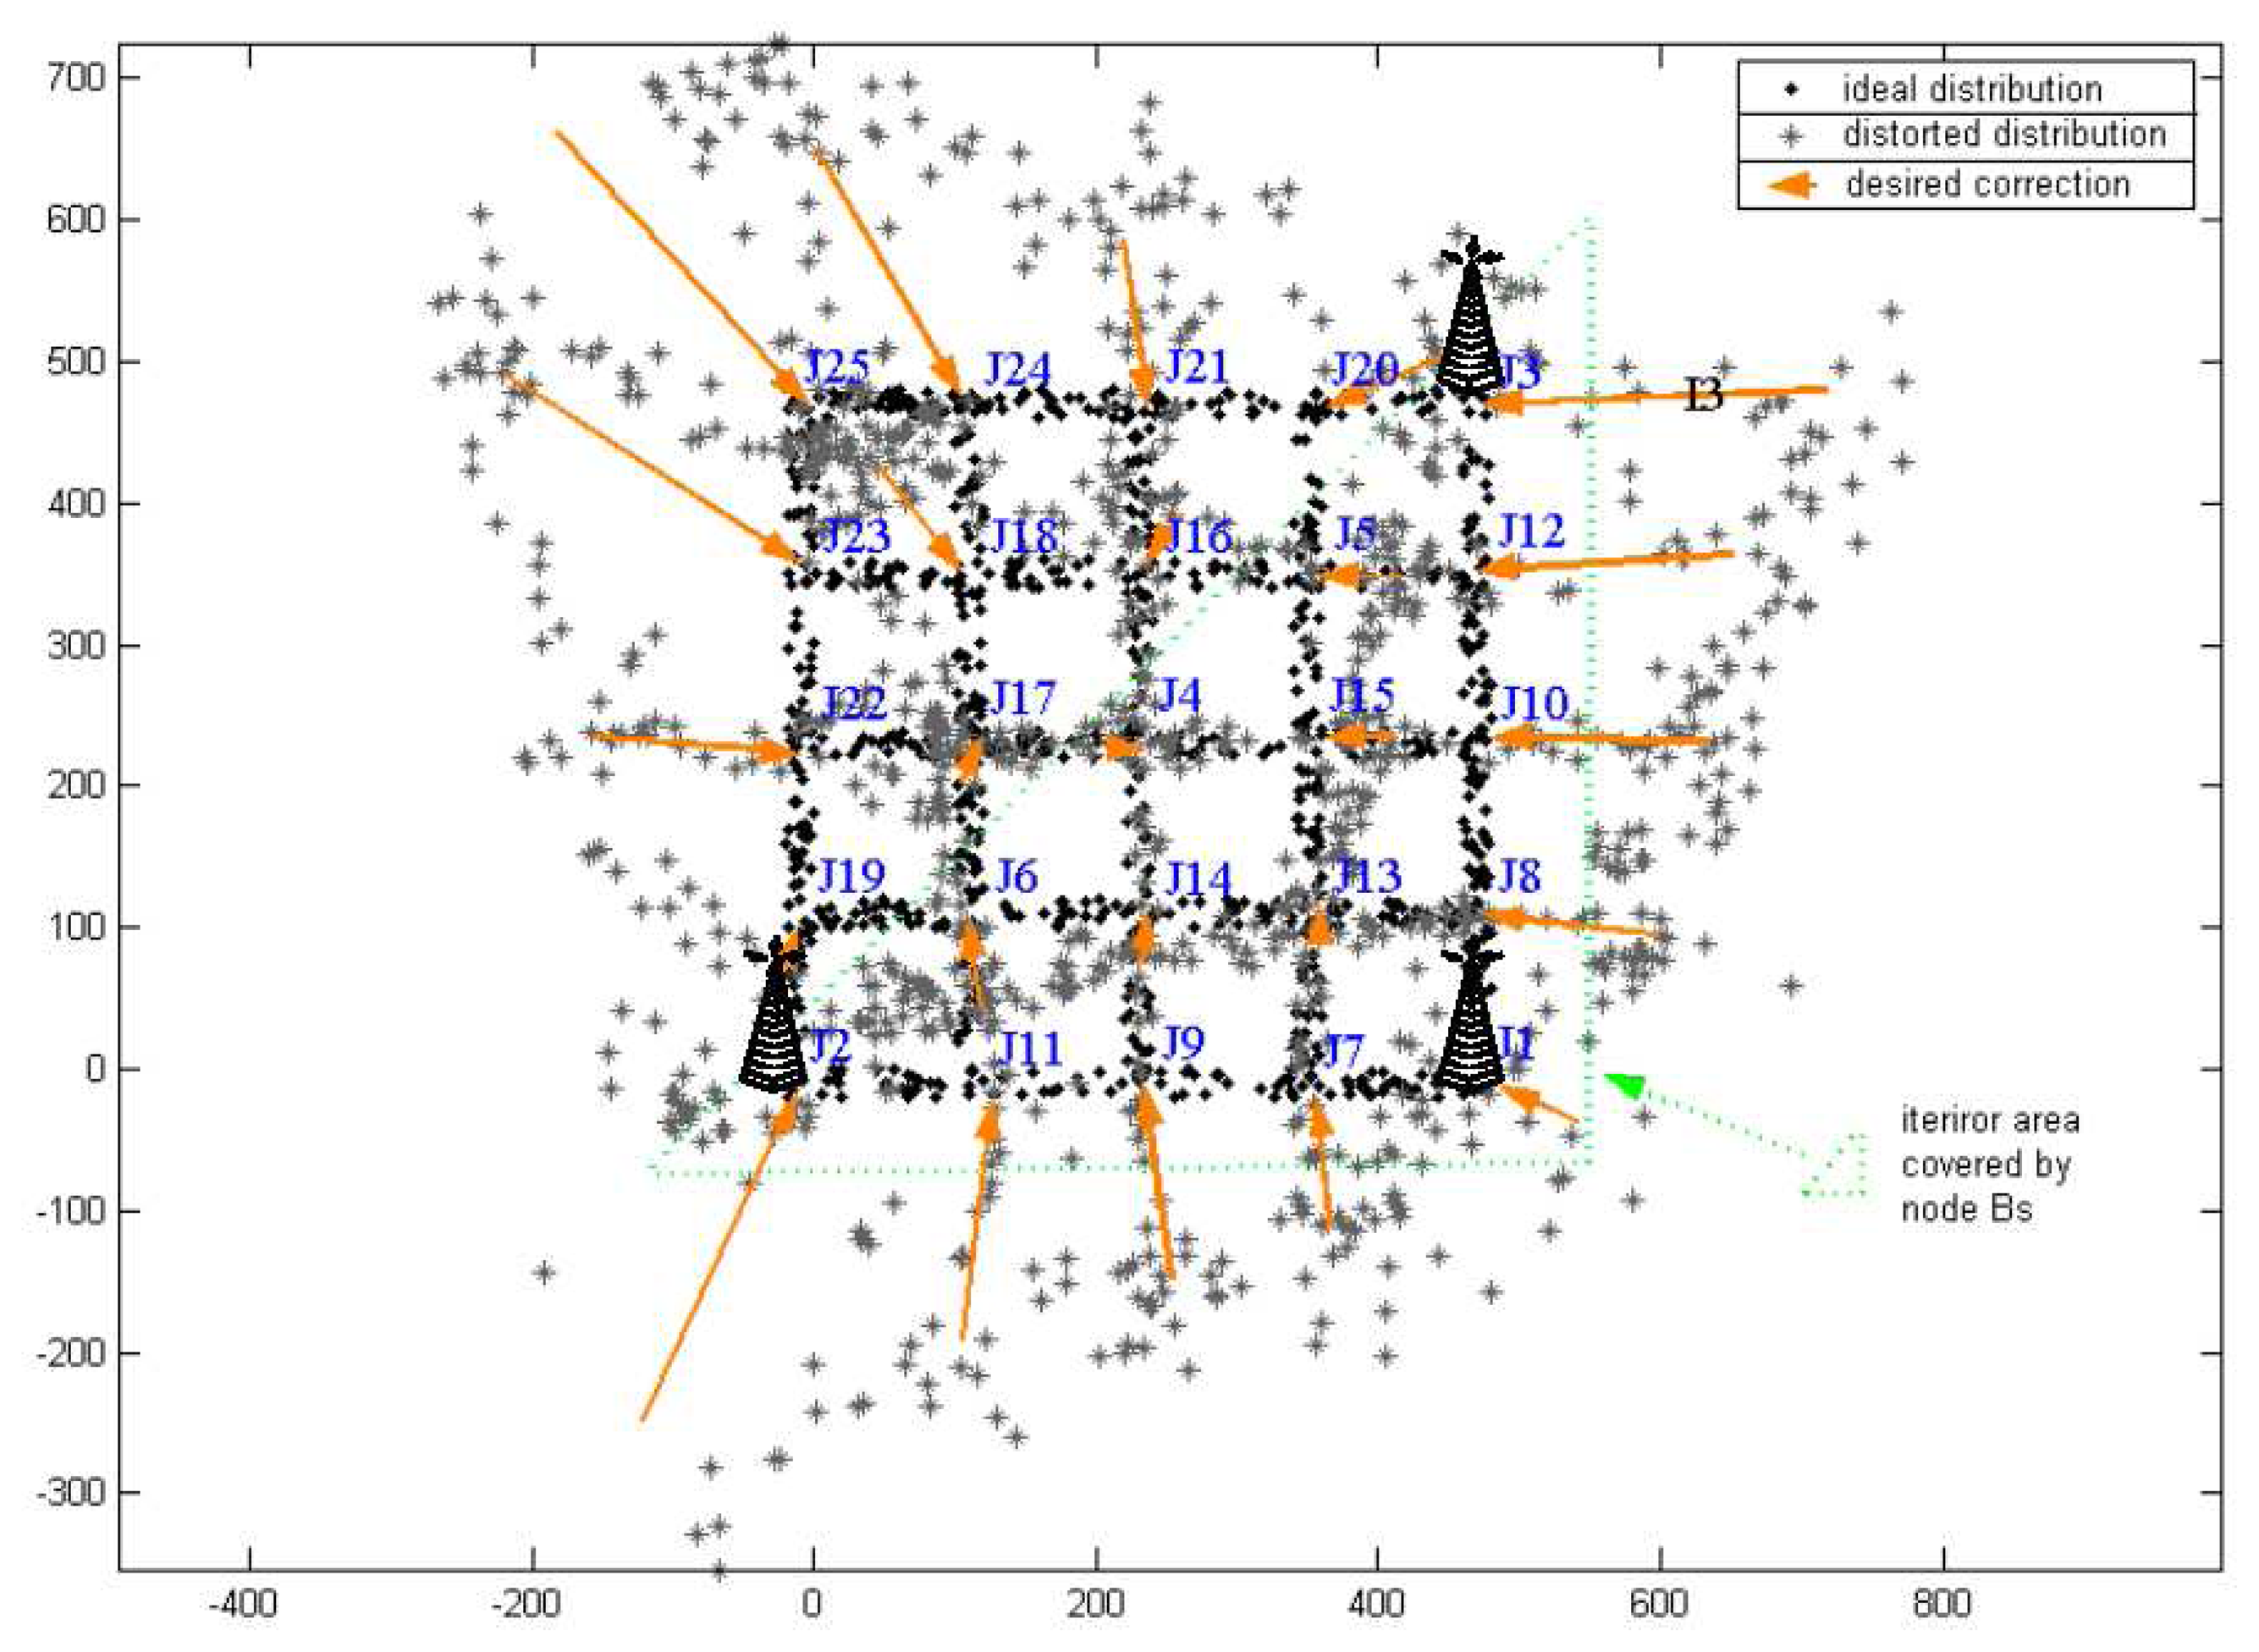
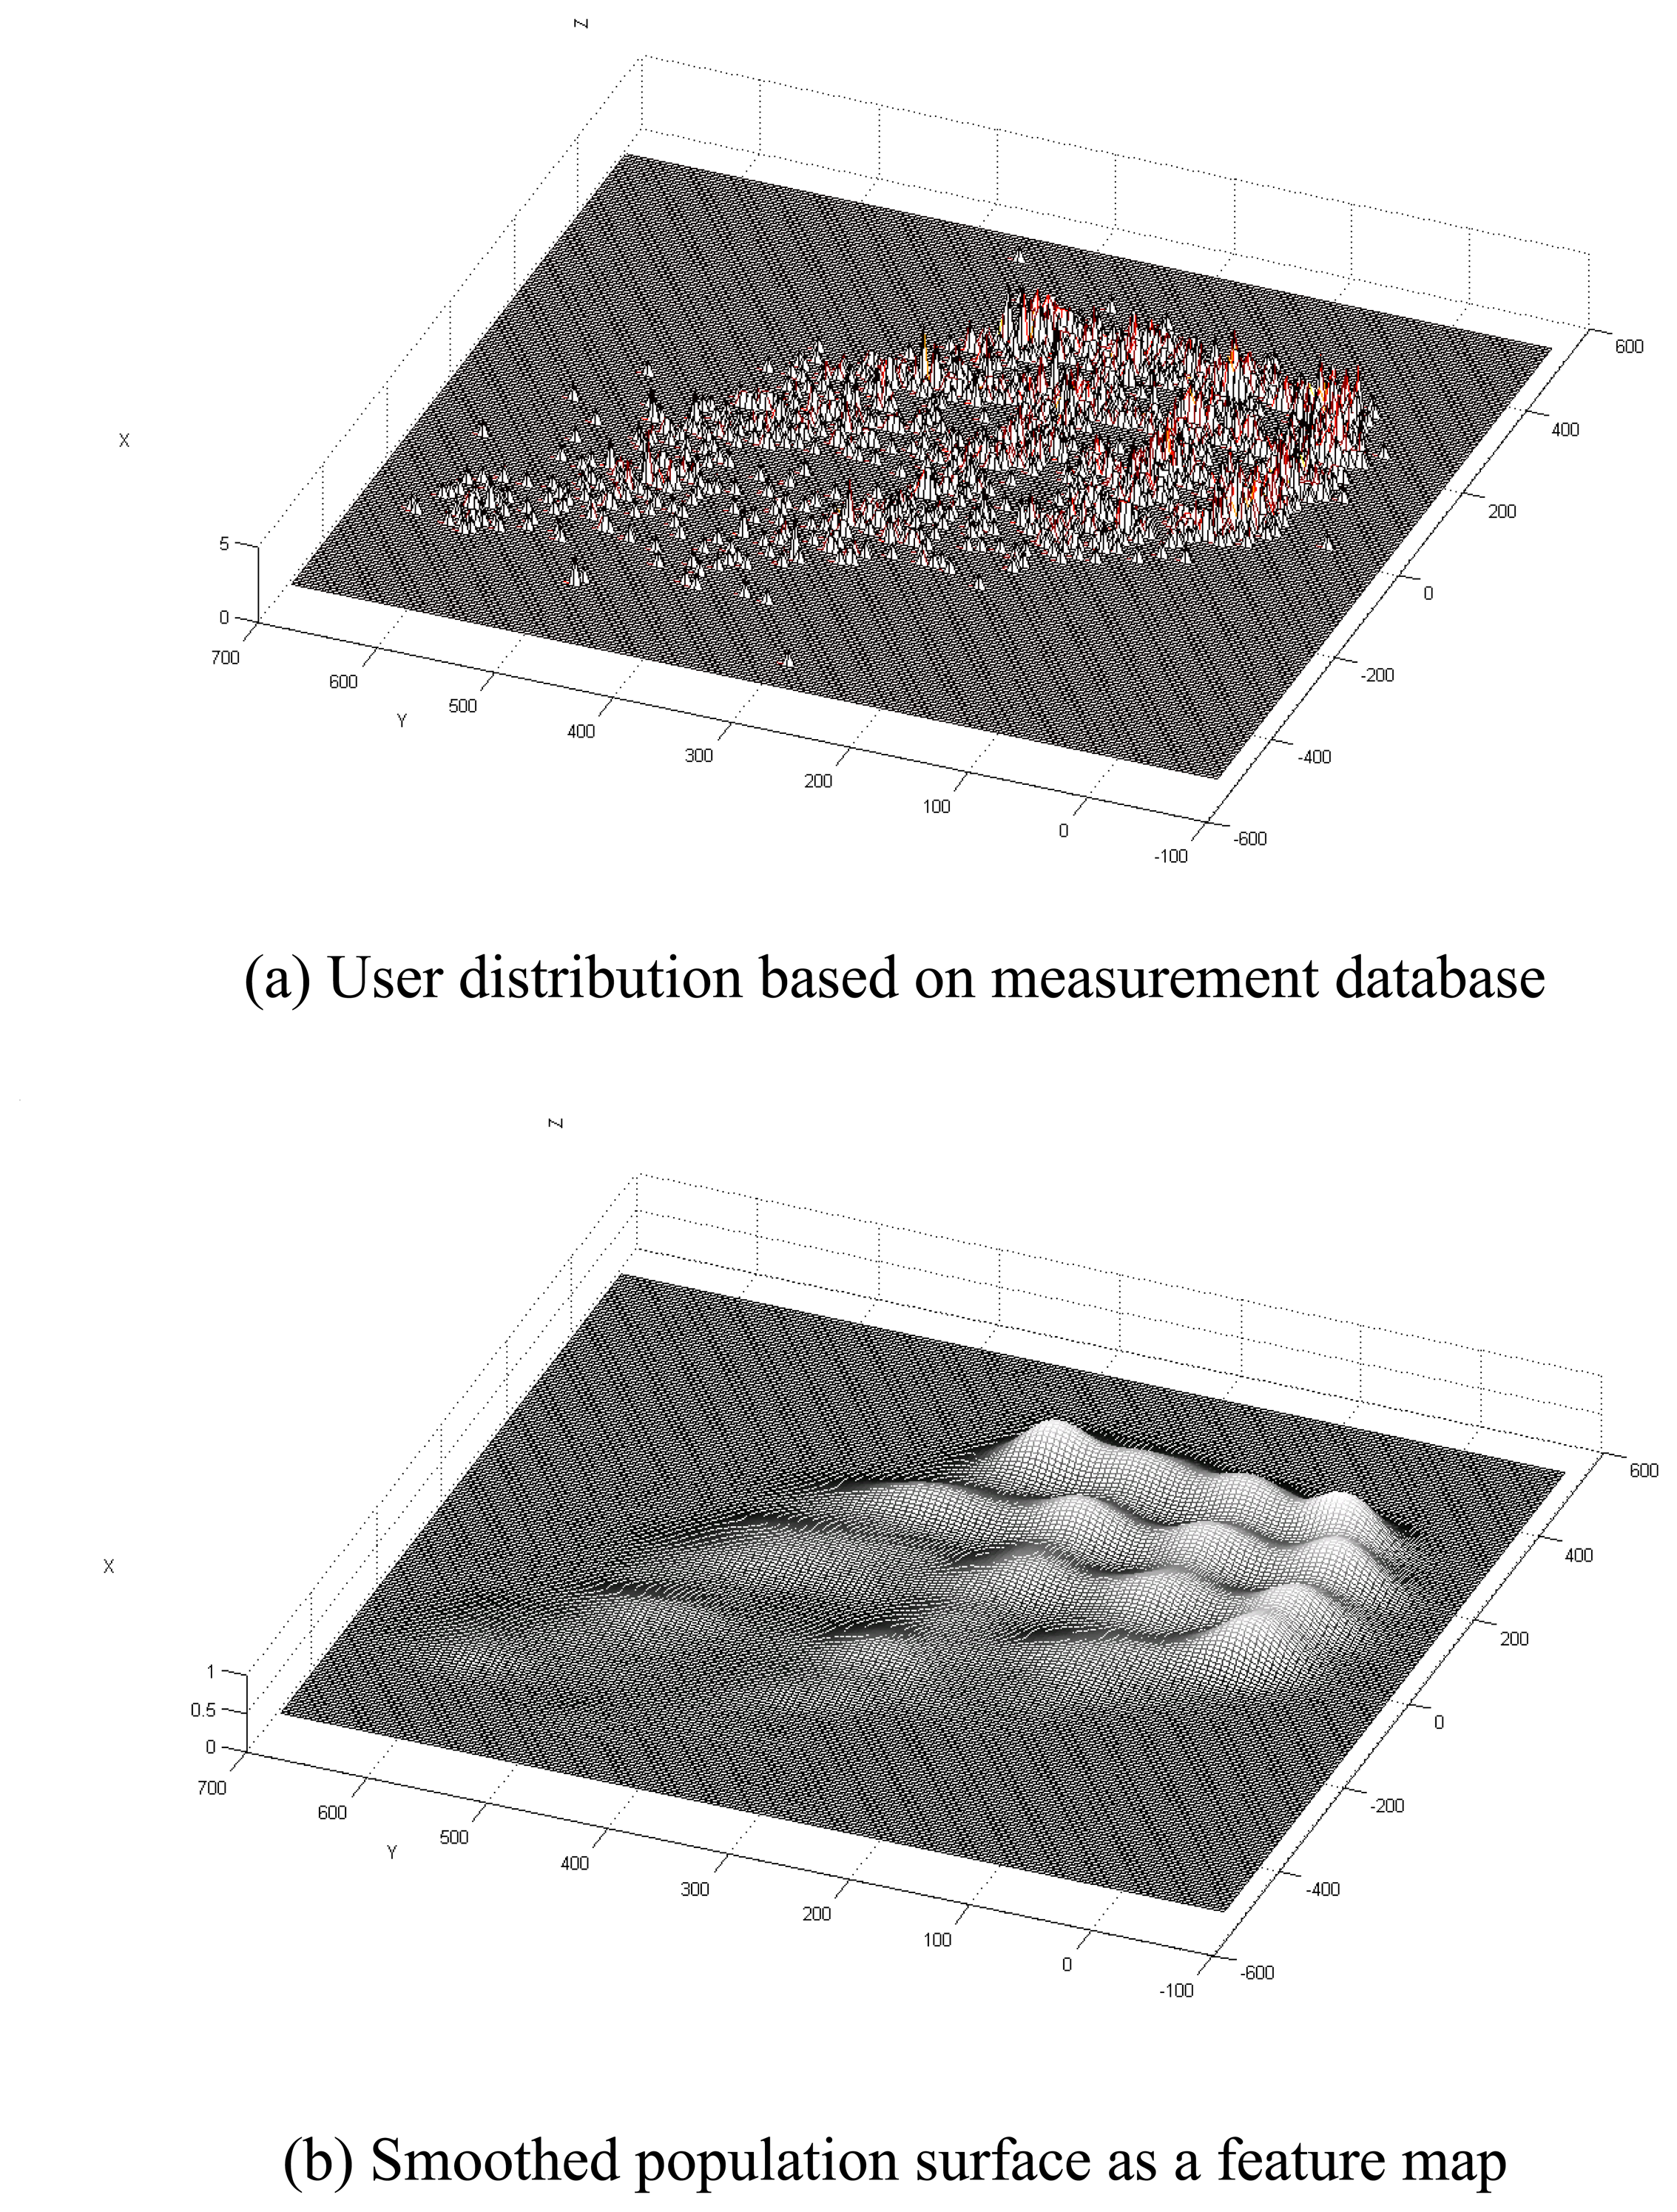
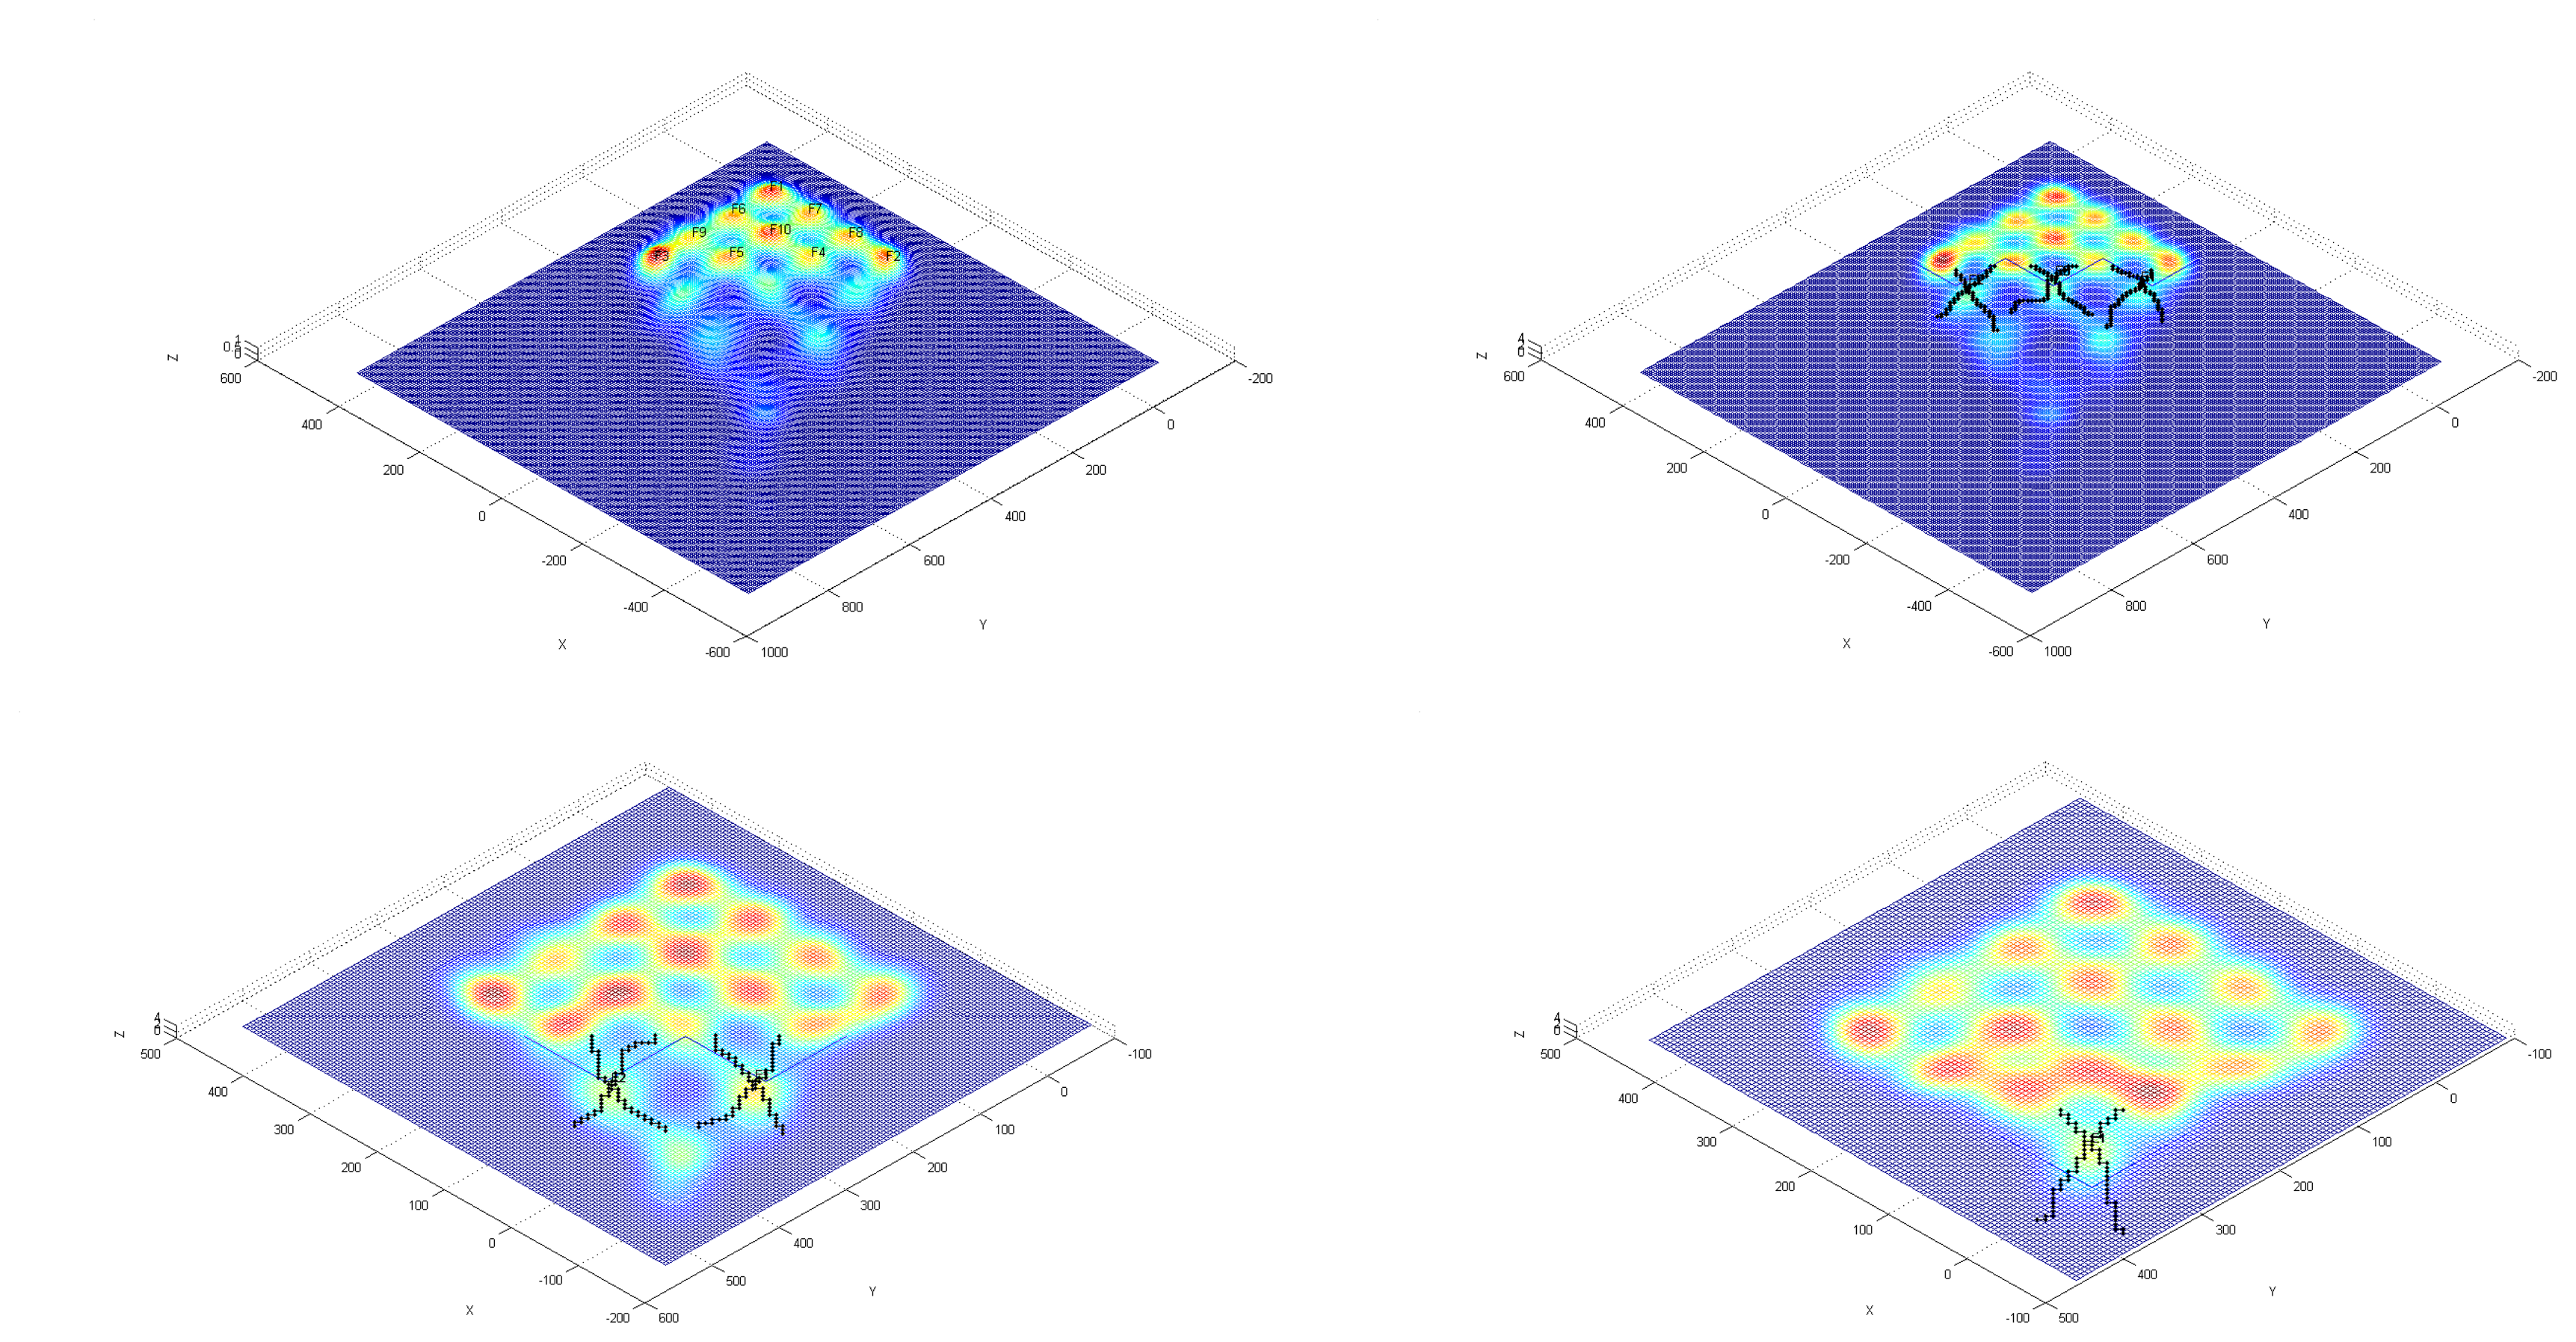
2.3. Spatial Interpolation
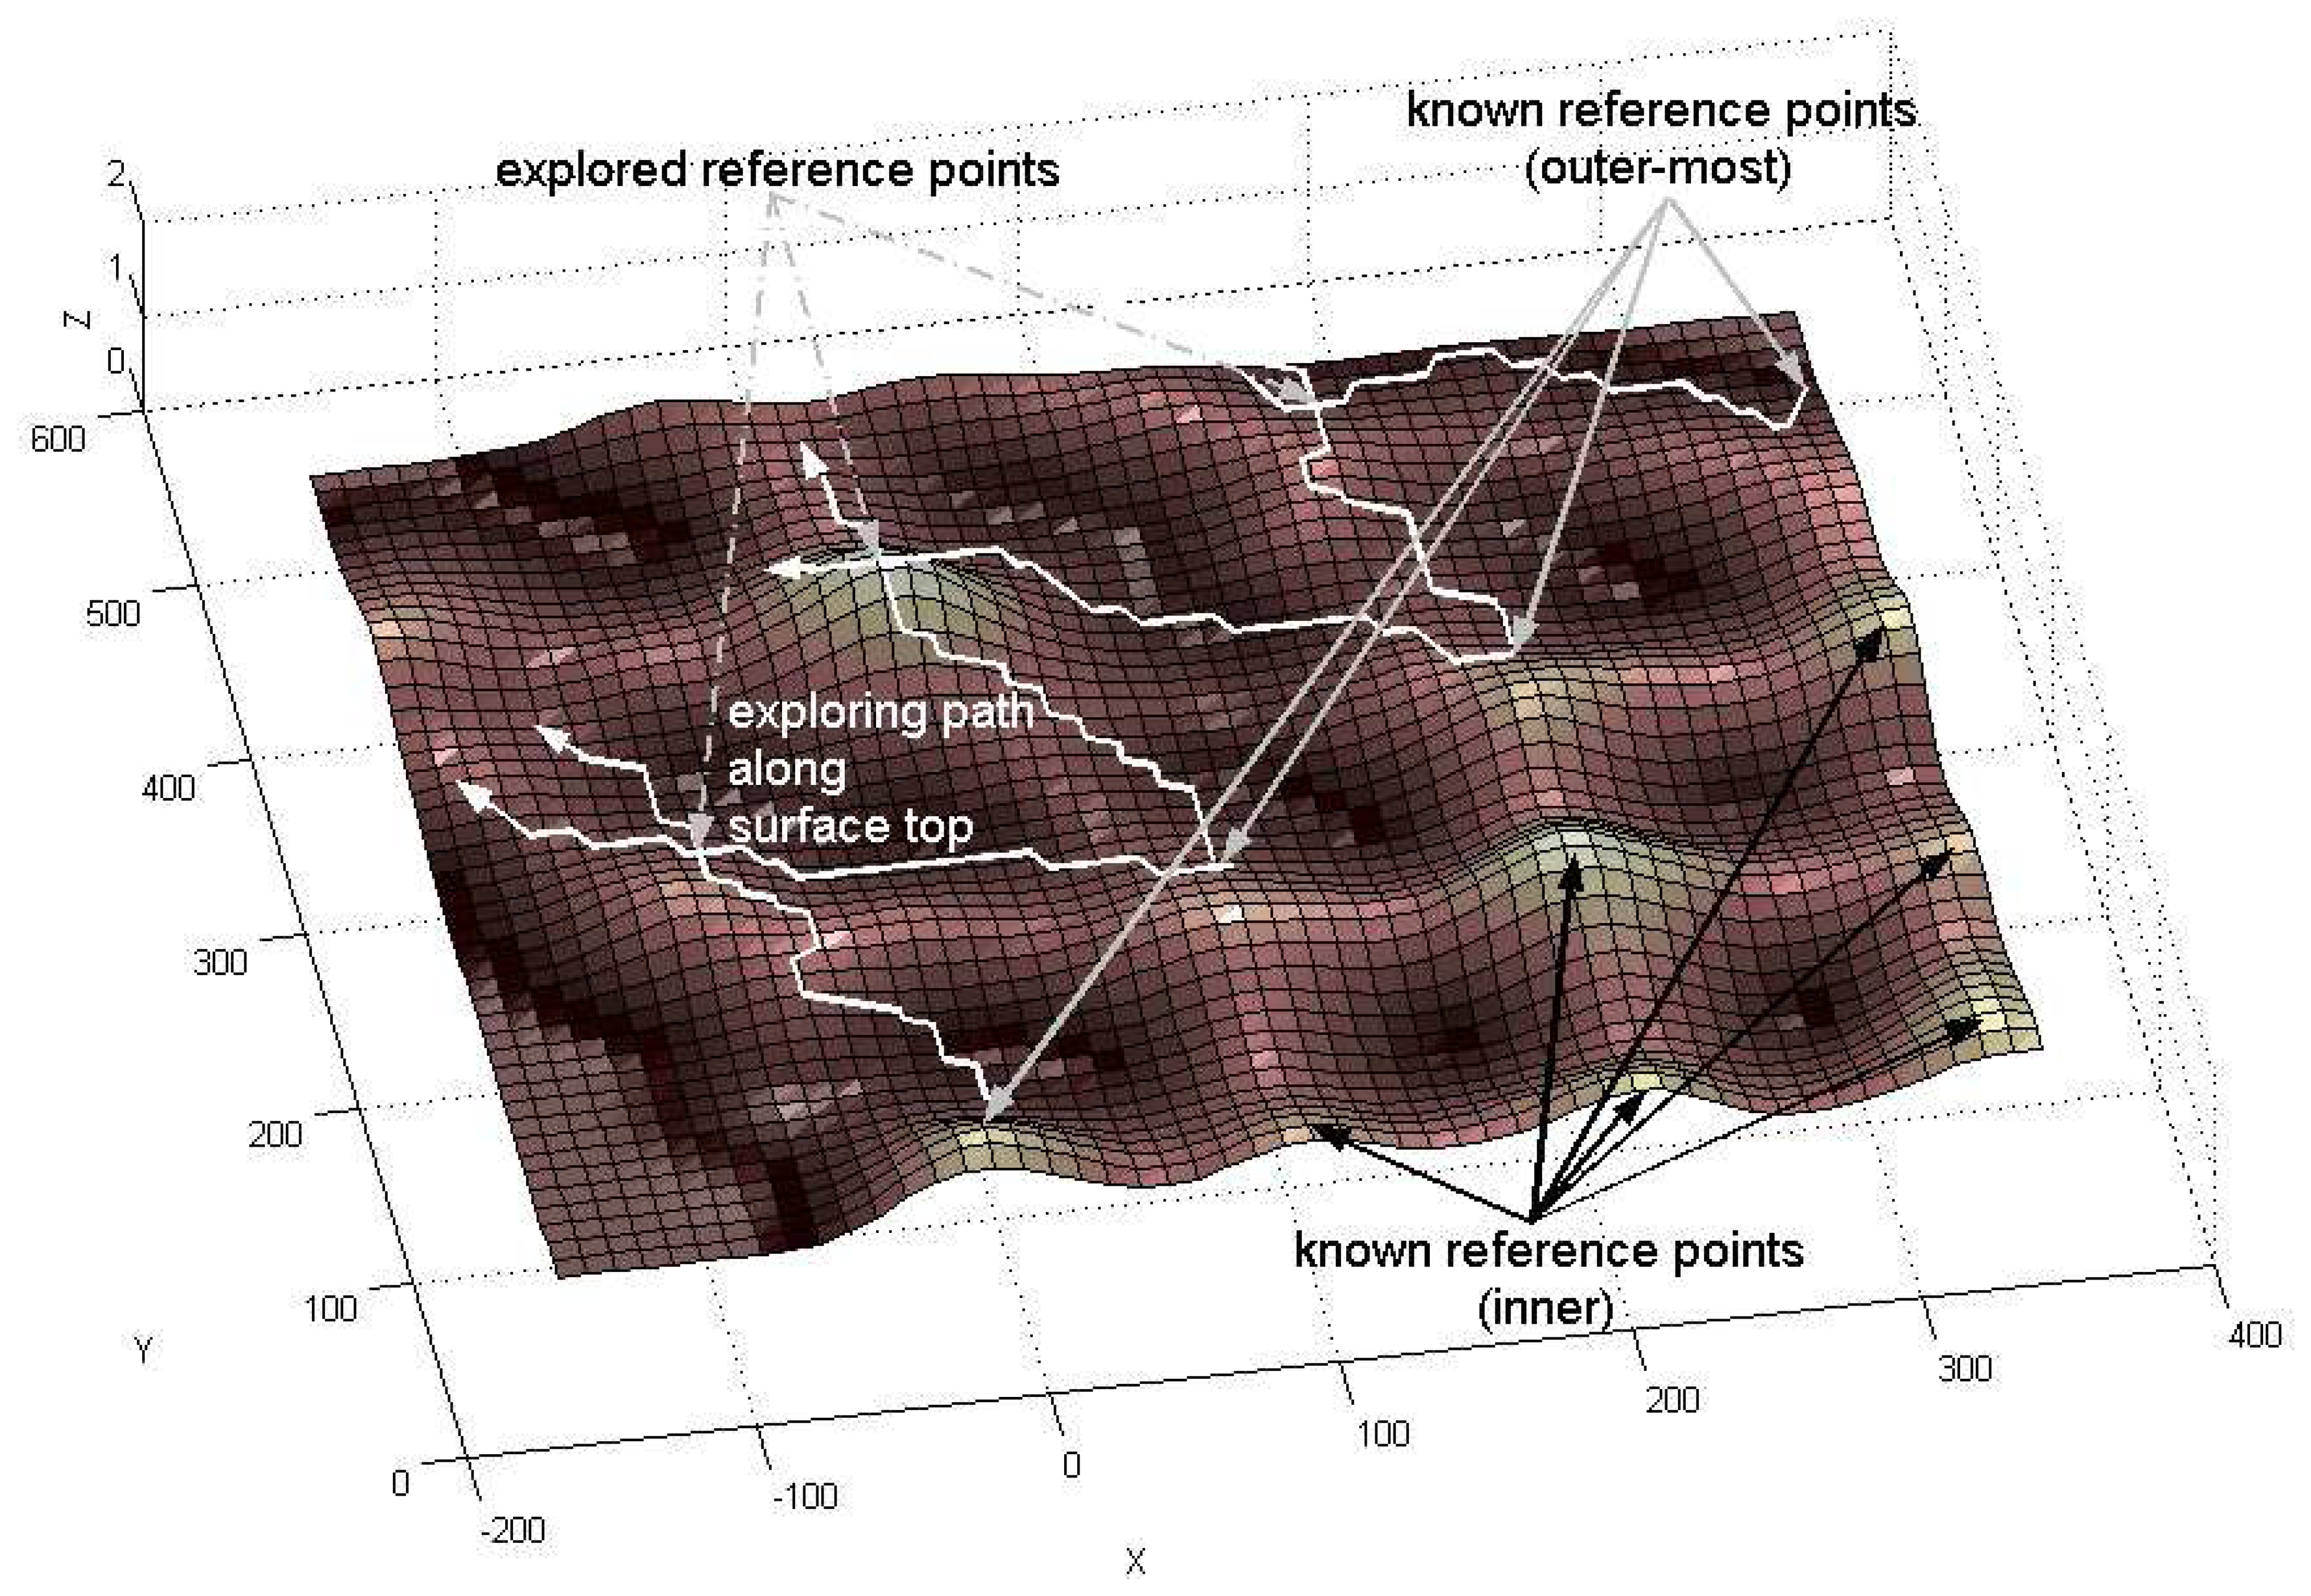
2.4. Exploration of More Reference Measurements
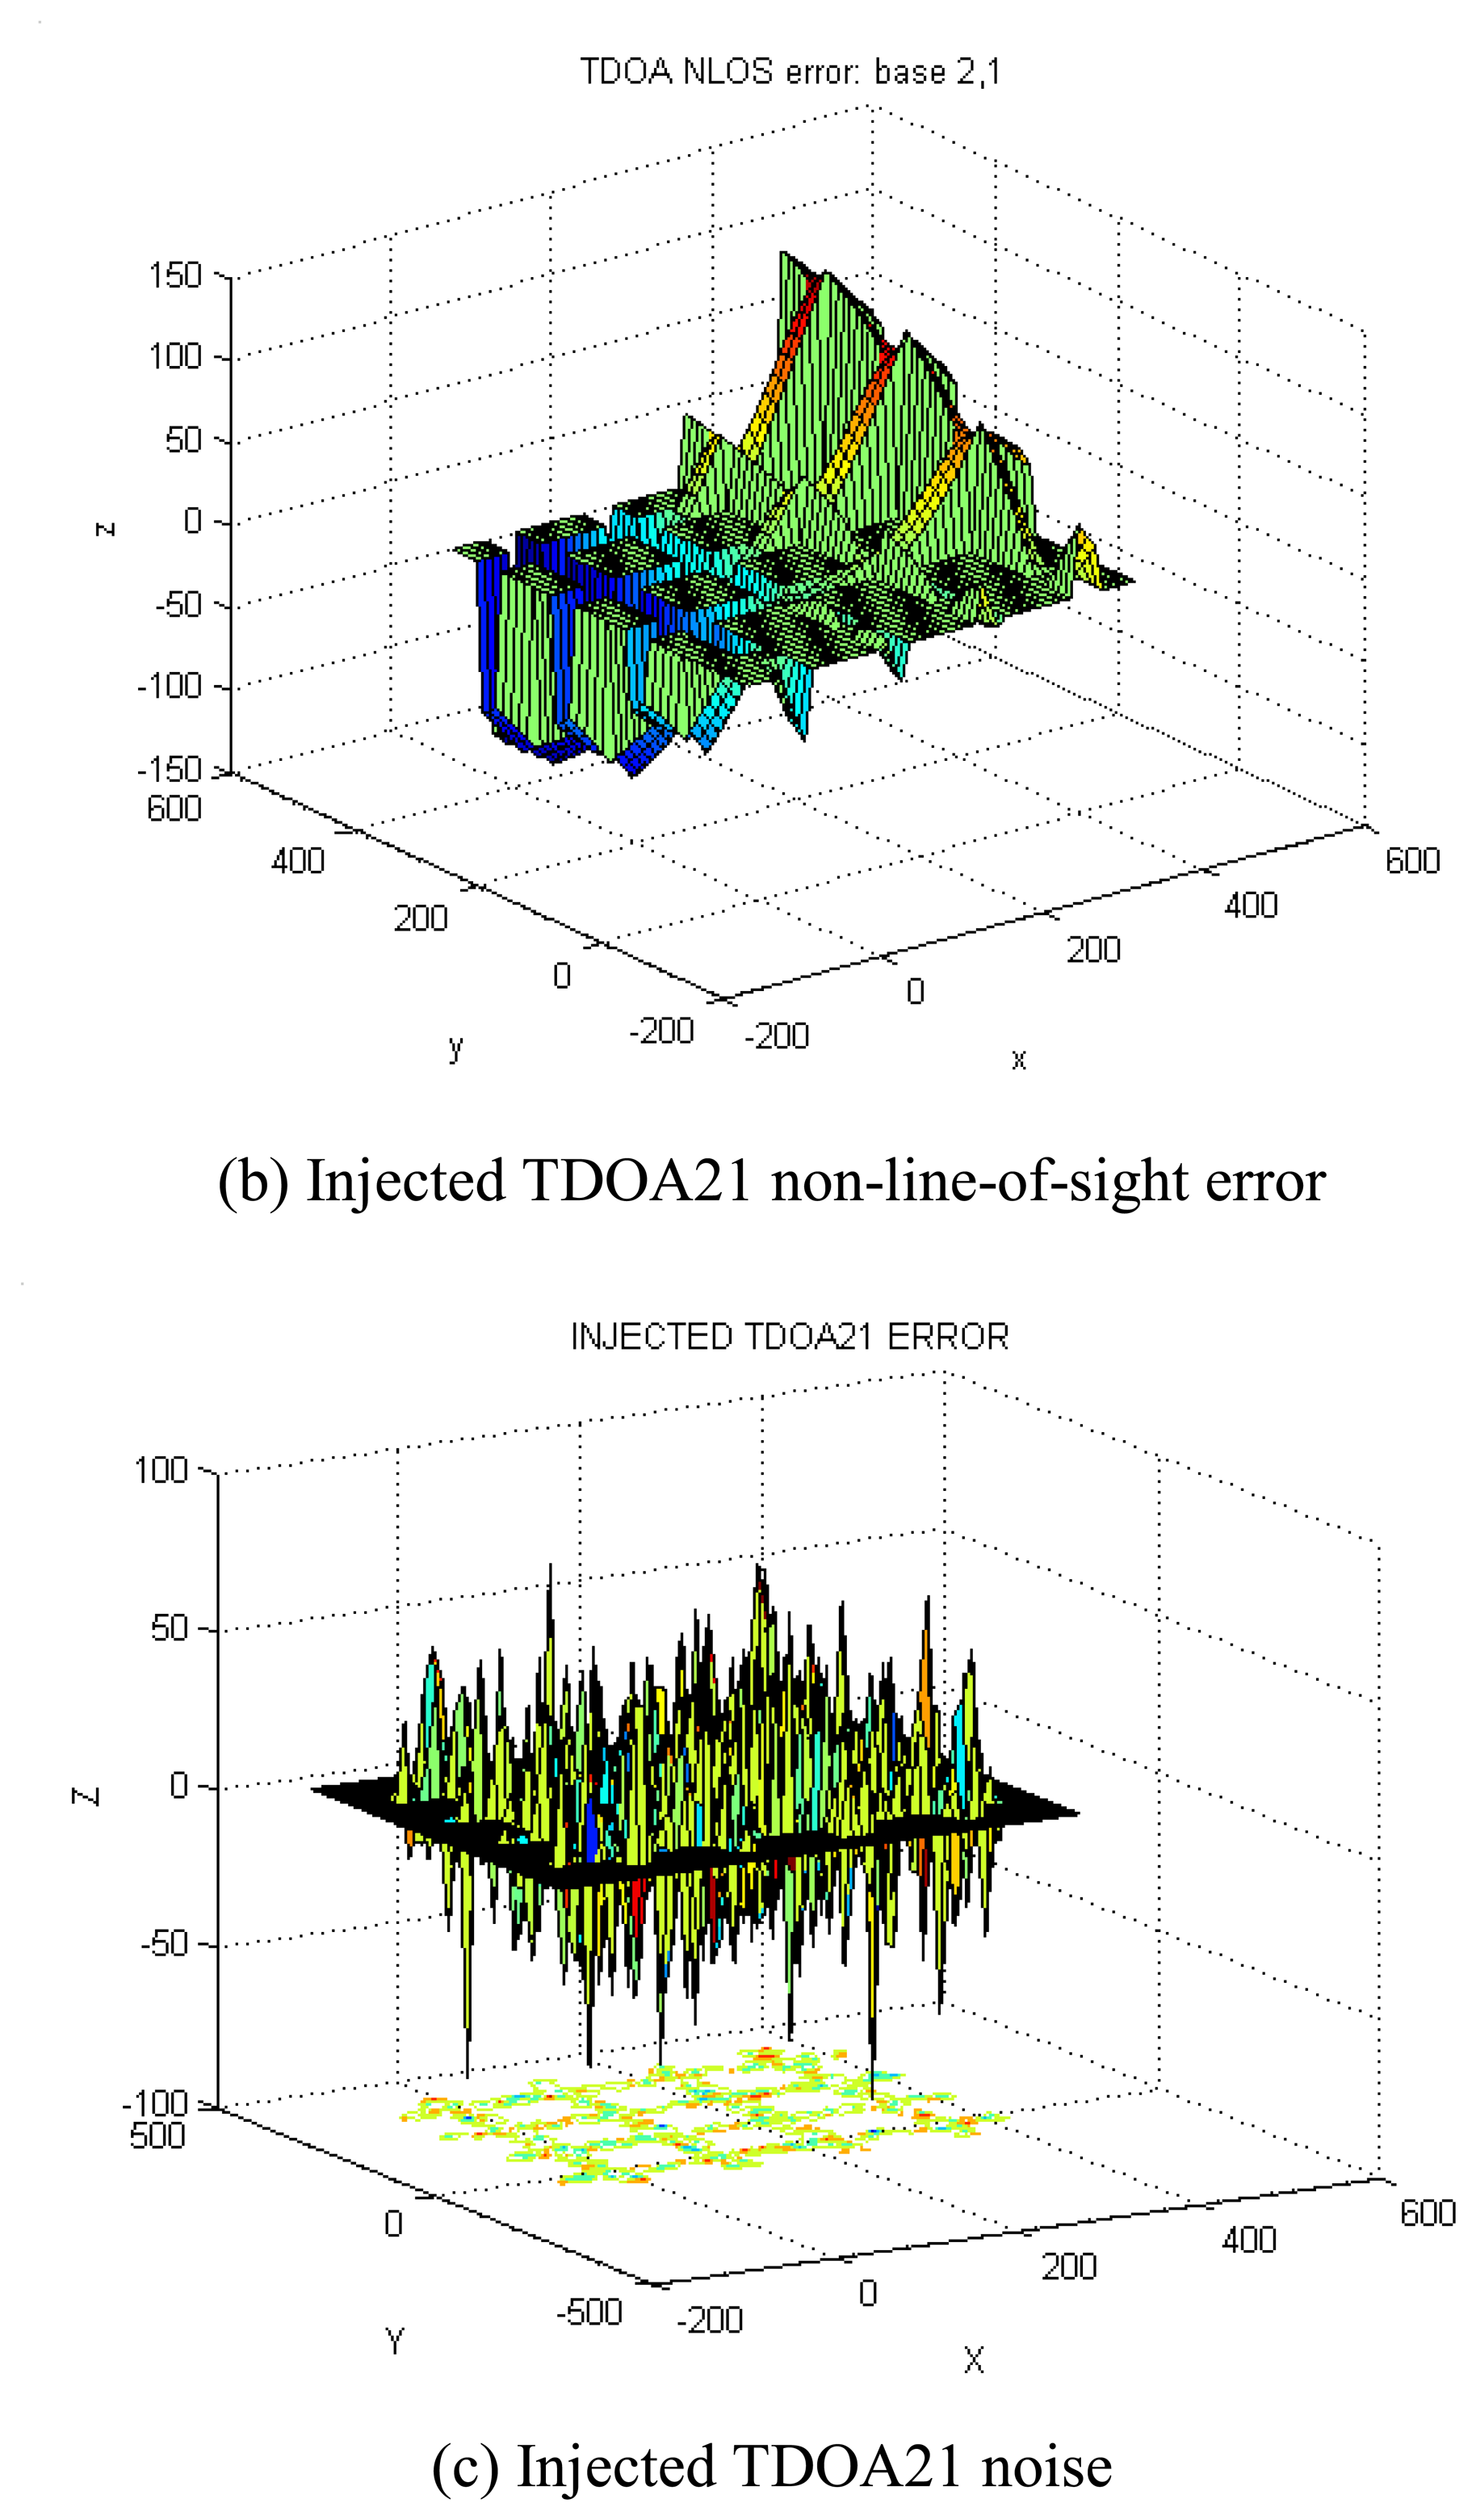
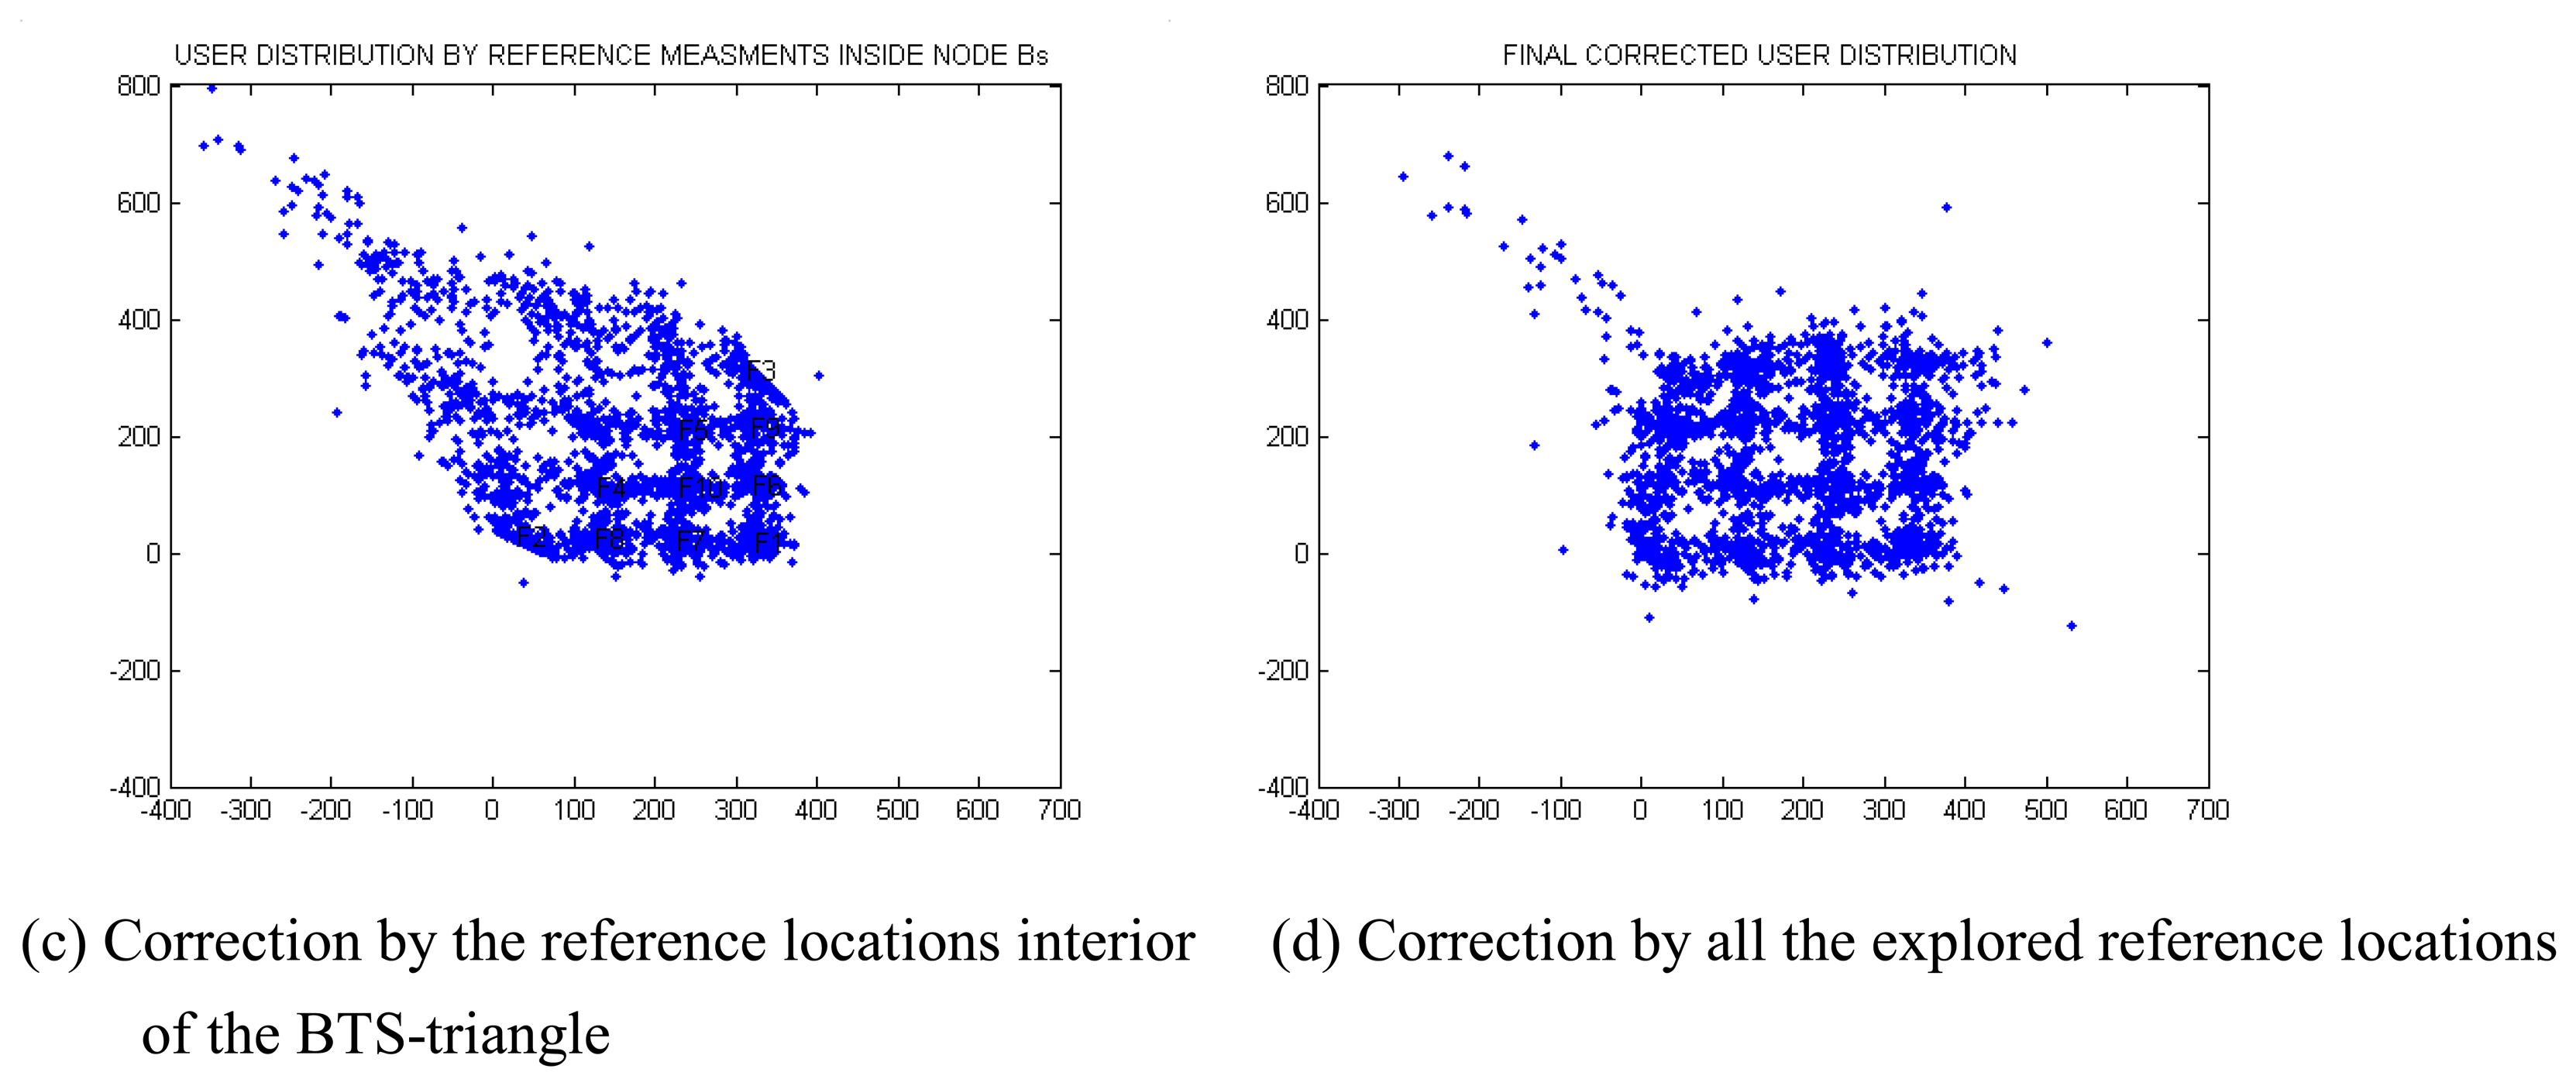
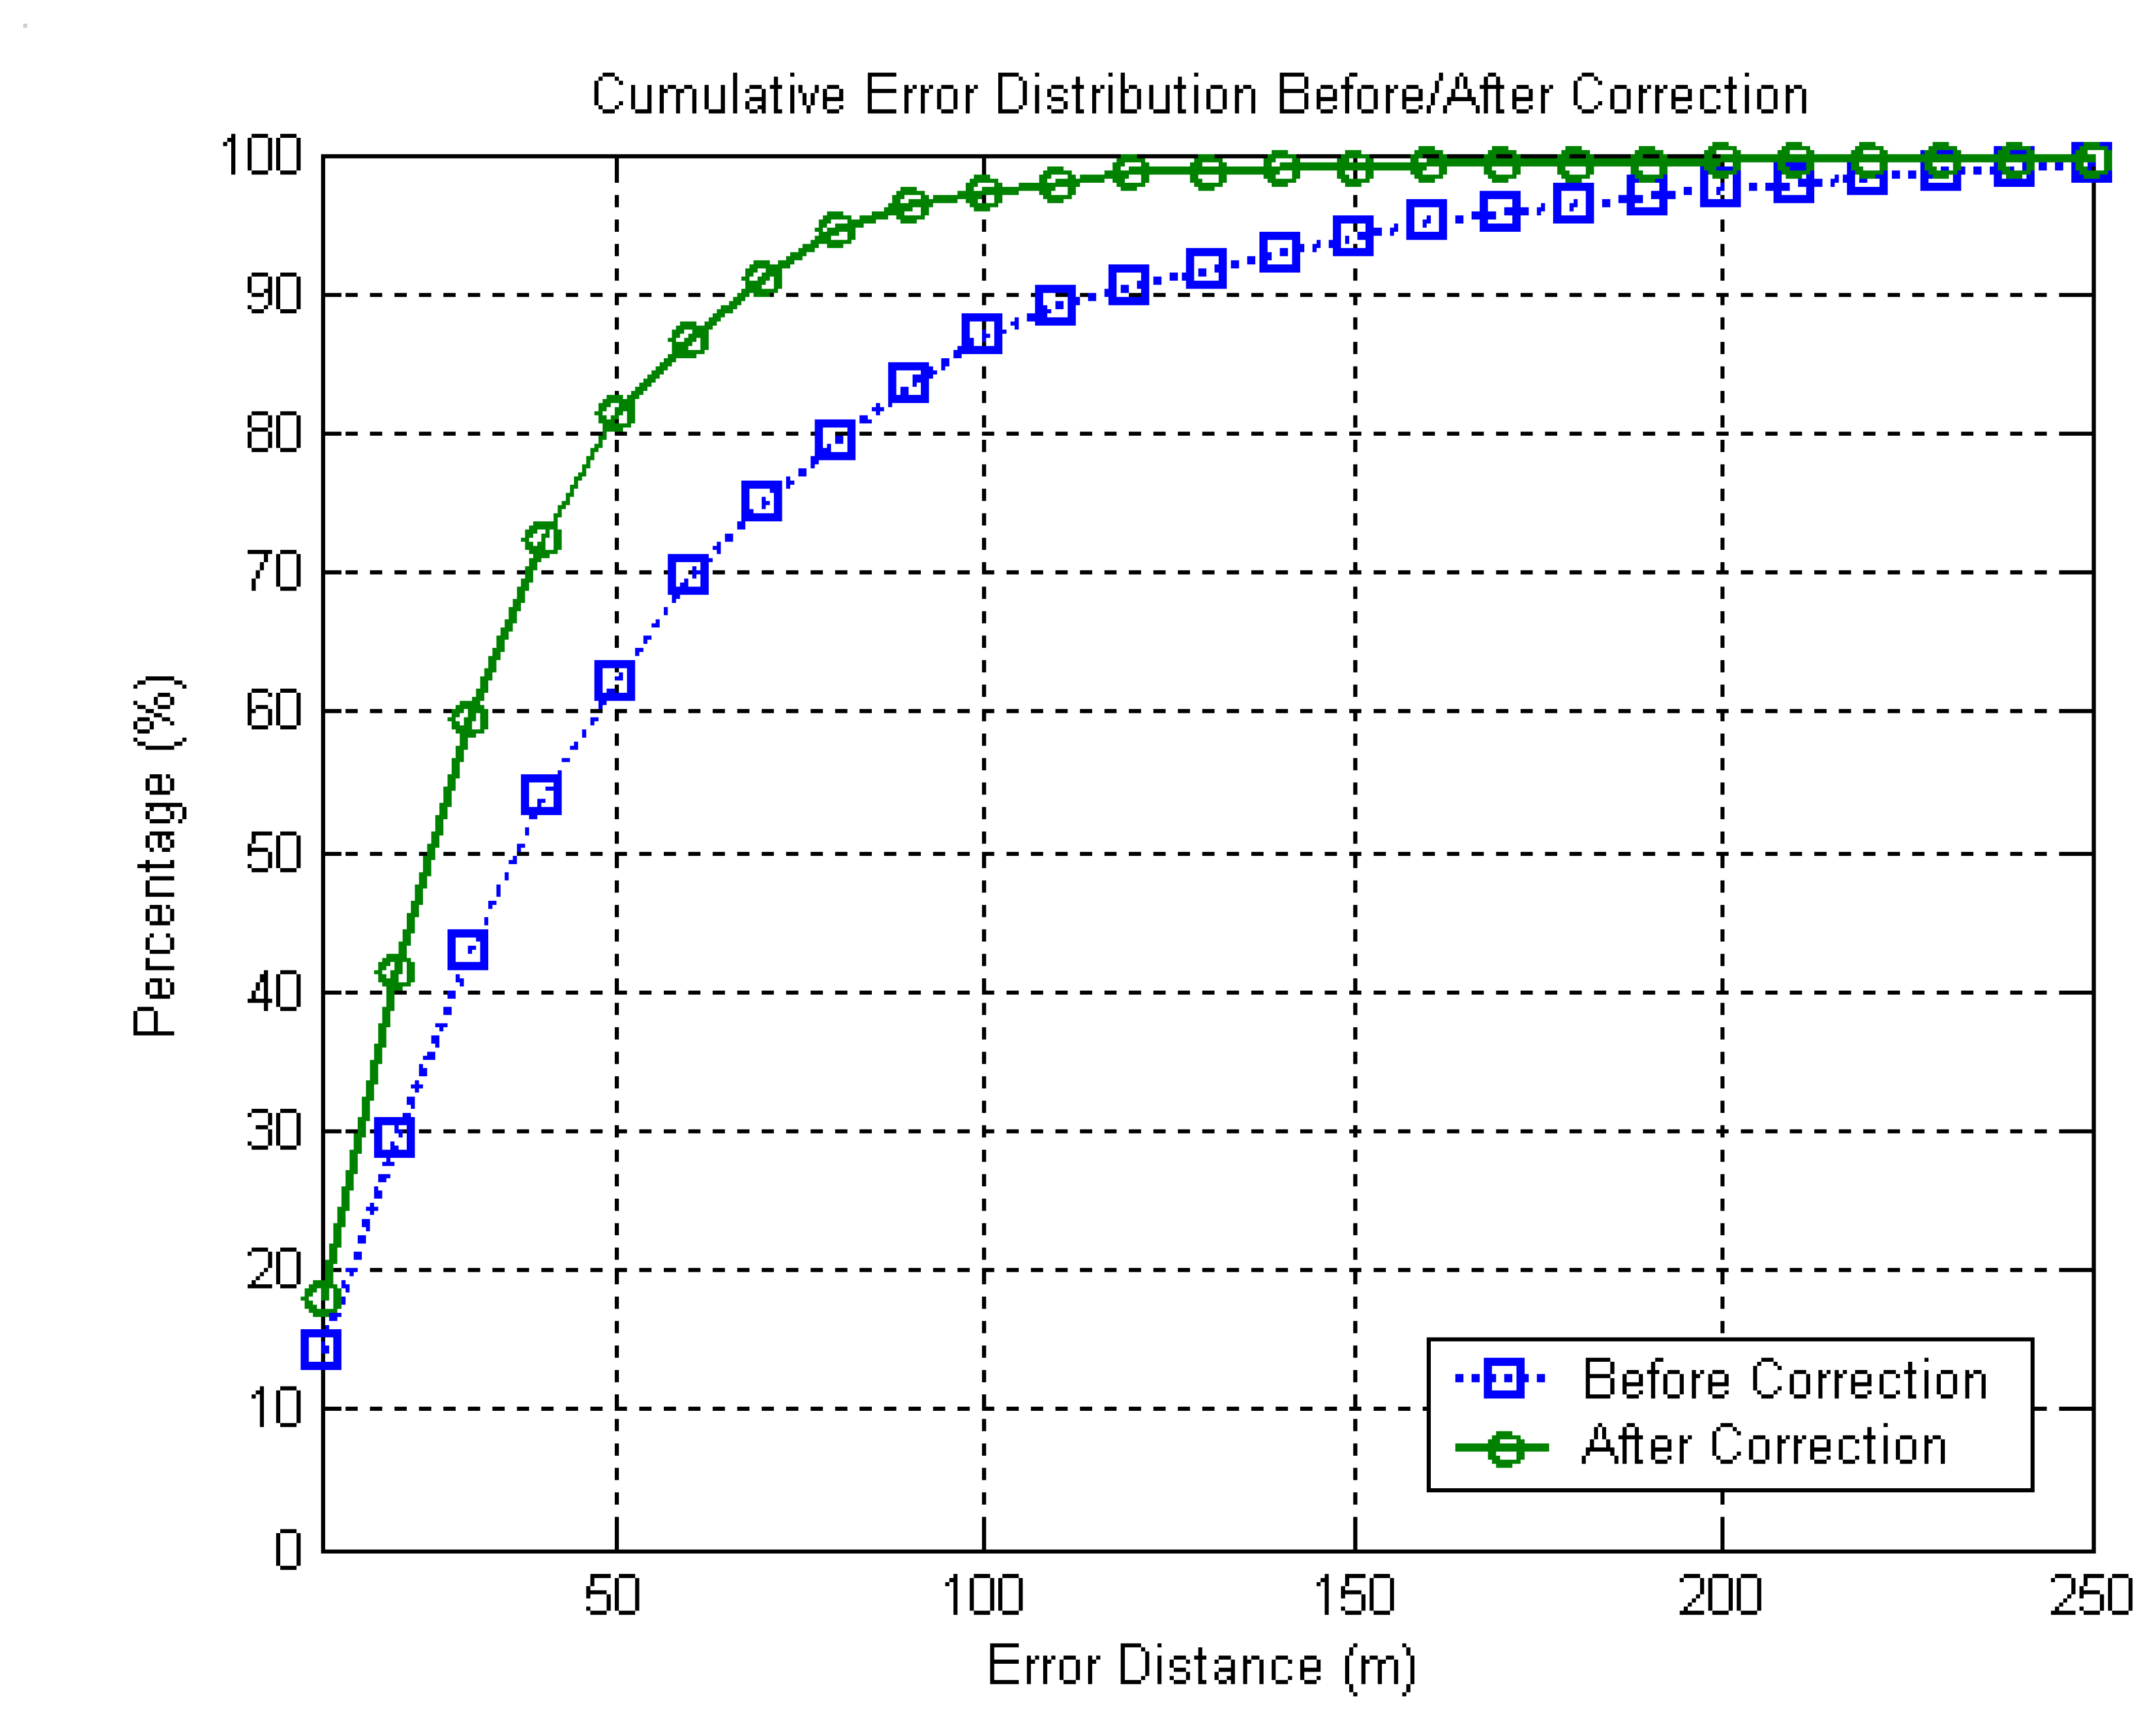
3. Simulation
4. Conclusions
Acknowledgments
References and Notes
- Morley, G.; Grover, W. Improved location estimation with pulse-ranging in presence of shadowing and multipath excess-delay effects. Electron. Lett. 1995, 31(18), 1609–1610. [Google Scholar]
- Wylie, M.; Holtzman, J. The nonline of sight problem in mobile location estimation. IEEE Int. Conf. Universal Personal Communication 1996, 827–831. [Google Scholar]
- Chen, W. A cellular based mobile location tracking system. 49th IEEE Vehicular Technology Conf. 1999, 3, 1979–1983. [Google Scholar]
- Xiong, L. A selective model to suppress NLOS signals in angle-of-arrive (AOA) location estimation. 9th IEEE Int. Symp. Personal, Indoor and Mobile Radio Communication 1998, 1, 461–465. [Google Scholar]
- Caffery, J.J.; Stuber, G. Subscriber location in CDMA cellular networks. IEEE Trans.Veh. Technol. 1998, 47, 406–416. [Google Scholar]
- Kim, W.; Lee, J.G.; Jee, G.I. Direct estimation of NLOS propagation delay for mobile station location. Electronics Letters 2002, 38(18), 1056–1057. [Google Scholar]
- Wang, X.; Wang, Z.; O′Dea, B. A TOA-Based Location Algorithm Reducing the Errors Due to Non-Line-of-Sight (NLOS) Propagation. IEEE Trans.Veh. Technol. 2003, 52, 112–116. [Google Scholar]
- Watters, J.M.; Strawczynski, L.; Steer, D. Devices and processing in a mobile radio communication network having calibration terminals. US patent 6,230,018, 2001. [Google Scholar]
- Wax, M.; Hilsenrath, O. Signature Matching for Location Determination in Wireless Communication Systems. U.S. Patent 6,112,095, 2000. [Google Scholar]
- Laitinen, H.; Nordstrom, T.; Lahteenmaki, J. Database Correlation Method for GSM Location. Proceedings of IEEE Vehicular Technology Conference 2001, 4, 2504–2508. [Google Scholar]
- Li, B.; Wang, Y.; Lee, H.K.; Dempster, A.; Rizos, C. Method for yielding a database of location fingerprints in WLAN. IEE Proceedings-Communications 2005, 152(5), 580–586. [Google Scholar]
- Lee, H.K; Li, B.; Rizos, C. Implementation Procedure of Wireless Signal Map Matching for Location-Based Services. Proceedings of 2005 IEEE International Symposium on Signal Processing and Information Technology(ISSPIT) 2005, 429–434. [Google Scholar]
- 3GPP2 S.R0005-B: Newwork Reference Model.
- 3GPP2 S.R0019: Location-Based Services System.
- 3GPP2 N.S0030: Enhanced Wireless 9-1-1 Phased 2.
- 3GPP2 C.P0022-A: Positioning determination service standard for dual-mode spread spectrum systems.
- 3GPP TS 25.305: Stage 2 functional specification of User Equipment (UE) positioning in UTRAN.
- 3GPP TS 43.059: Functional stage 2 description of Location Services (LCS) in GERAN.
- 3GPP TS 23.271: Functional stage 2 description of Location Services (LCS).
- Location Based Services, Permanent Reference Document; SE23, GSM association, Jan 2003.
- Foy, W.H. Position-location solutions by Taylor-Series Estimation. IEEE Tr. Aerospace and Electronic Systems 1987, 12, 187–194. [Google Scholar]
- Hata, M. Empirical Formula for Propagation Loss in Land Mobile Radio Systems. IEEE Transactions on Vehicular Technology 1980, 29(3), 317–325. [Google Scholar]
- Damosso, E. COST 231 (Digital mobile radio towards future generation systems), Final report; European Comission: Bruxelles, 1999. [Google Scholar]
- White, C.E.; Bernstein, D.; Kornhauser, A.L. Some map matching algorithms for personal navigation assistants. Transportation Research Part C 2000, 8, 91–108. [Google Scholar]
- Gonzalez, R.; Woods, R. Digital Image Processing; Addison-Wesley Publishing Company, 1992. [Google Scholar]
- Matheron, G. Principles of Geostatistics. Economic Geology 1963, 58, 1246–1266. [Google Scholar]
- Wackernagel, H. Multivariate Geostatistics, An Introduction With Applications, 2nd Ed. ed; Springer Verlag: Berlin, 1998. [Google Scholar]
- Watson, D.F.; Philip, G.M. A Refinement of Inverse Distance Weighted Interpolation. Geo-process 1985, 2, 315–327. [Google Scholar]
- de Boor, C. A Practical Guide to Splines; Springer Verlag: New York, 1978. [Google Scholar]
- Mardia, K.V.; Goodall, C.; Redfern, E.J.; Alonso, F.J. The Kriged Kalman filter. Test 1998, 7(2), 217–285. [Google Scholar]
- Cressie, N.; Wikle, C.K. Space-time Kalman filter. Encyclopedia of Environmetrics 2002, 4, 2045–2049. [Google Scholar]


© 2008 by MDPI (http://www.mdpi.org). Reproduction is permitted for noncommercial purposes.
Share and Cite
Lee, H.K.; Shim, J.-Y.; Kim, H.-S.; Li, B.; Rizos, C. Feature Extraction and Spatial Interpolation for Improved Wireless Location Sensing. Sensors 2008, 8, 2865-2885. https://doi.org/10.3390/s8042865
Lee HK, Shim J-Y, Kim H-S, Li B, Rizos C. Feature Extraction and Spatial Interpolation for Improved Wireless Location Sensing. Sensors. 2008; 8(4):2865-2885. https://doi.org/10.3390/s8042865
Chicago/Turabian StyleLee, Hyung Keun, Ju-Young Shim, Hee-Sung Kim, Binghao Li, and Chris Rizos. 2008. "Feature Extraction and Spatial Interpolation for Improved Wireless Location Sensing" Sensors 8, no. 4: 2865-2885. https://doi.org/10.3390/s8042865
APA StyleLee, H. K., Shim, J.-Y., Kim, H.-S., Li, B., & Rizos, C. (2008). Feature Extraction and Spatial Interpolation for Improved Wireless Location Sensing. Sensors, 8(4), 2865-2885. https://doi.org/10.3390/s8042865