A Review on the Electrochemical Sensors and Biosensors Composed of Nanowires as Sensing Material

Abstract
:1. Introduction
2. Synthesis of Nanowires
2.1. Anodic Alumina Membranes (AAM)
2.2. AAM on Silicon Substrates
2.3. Nanoporous Anodic Titania Films
3. Electrical Properties of Nanowires
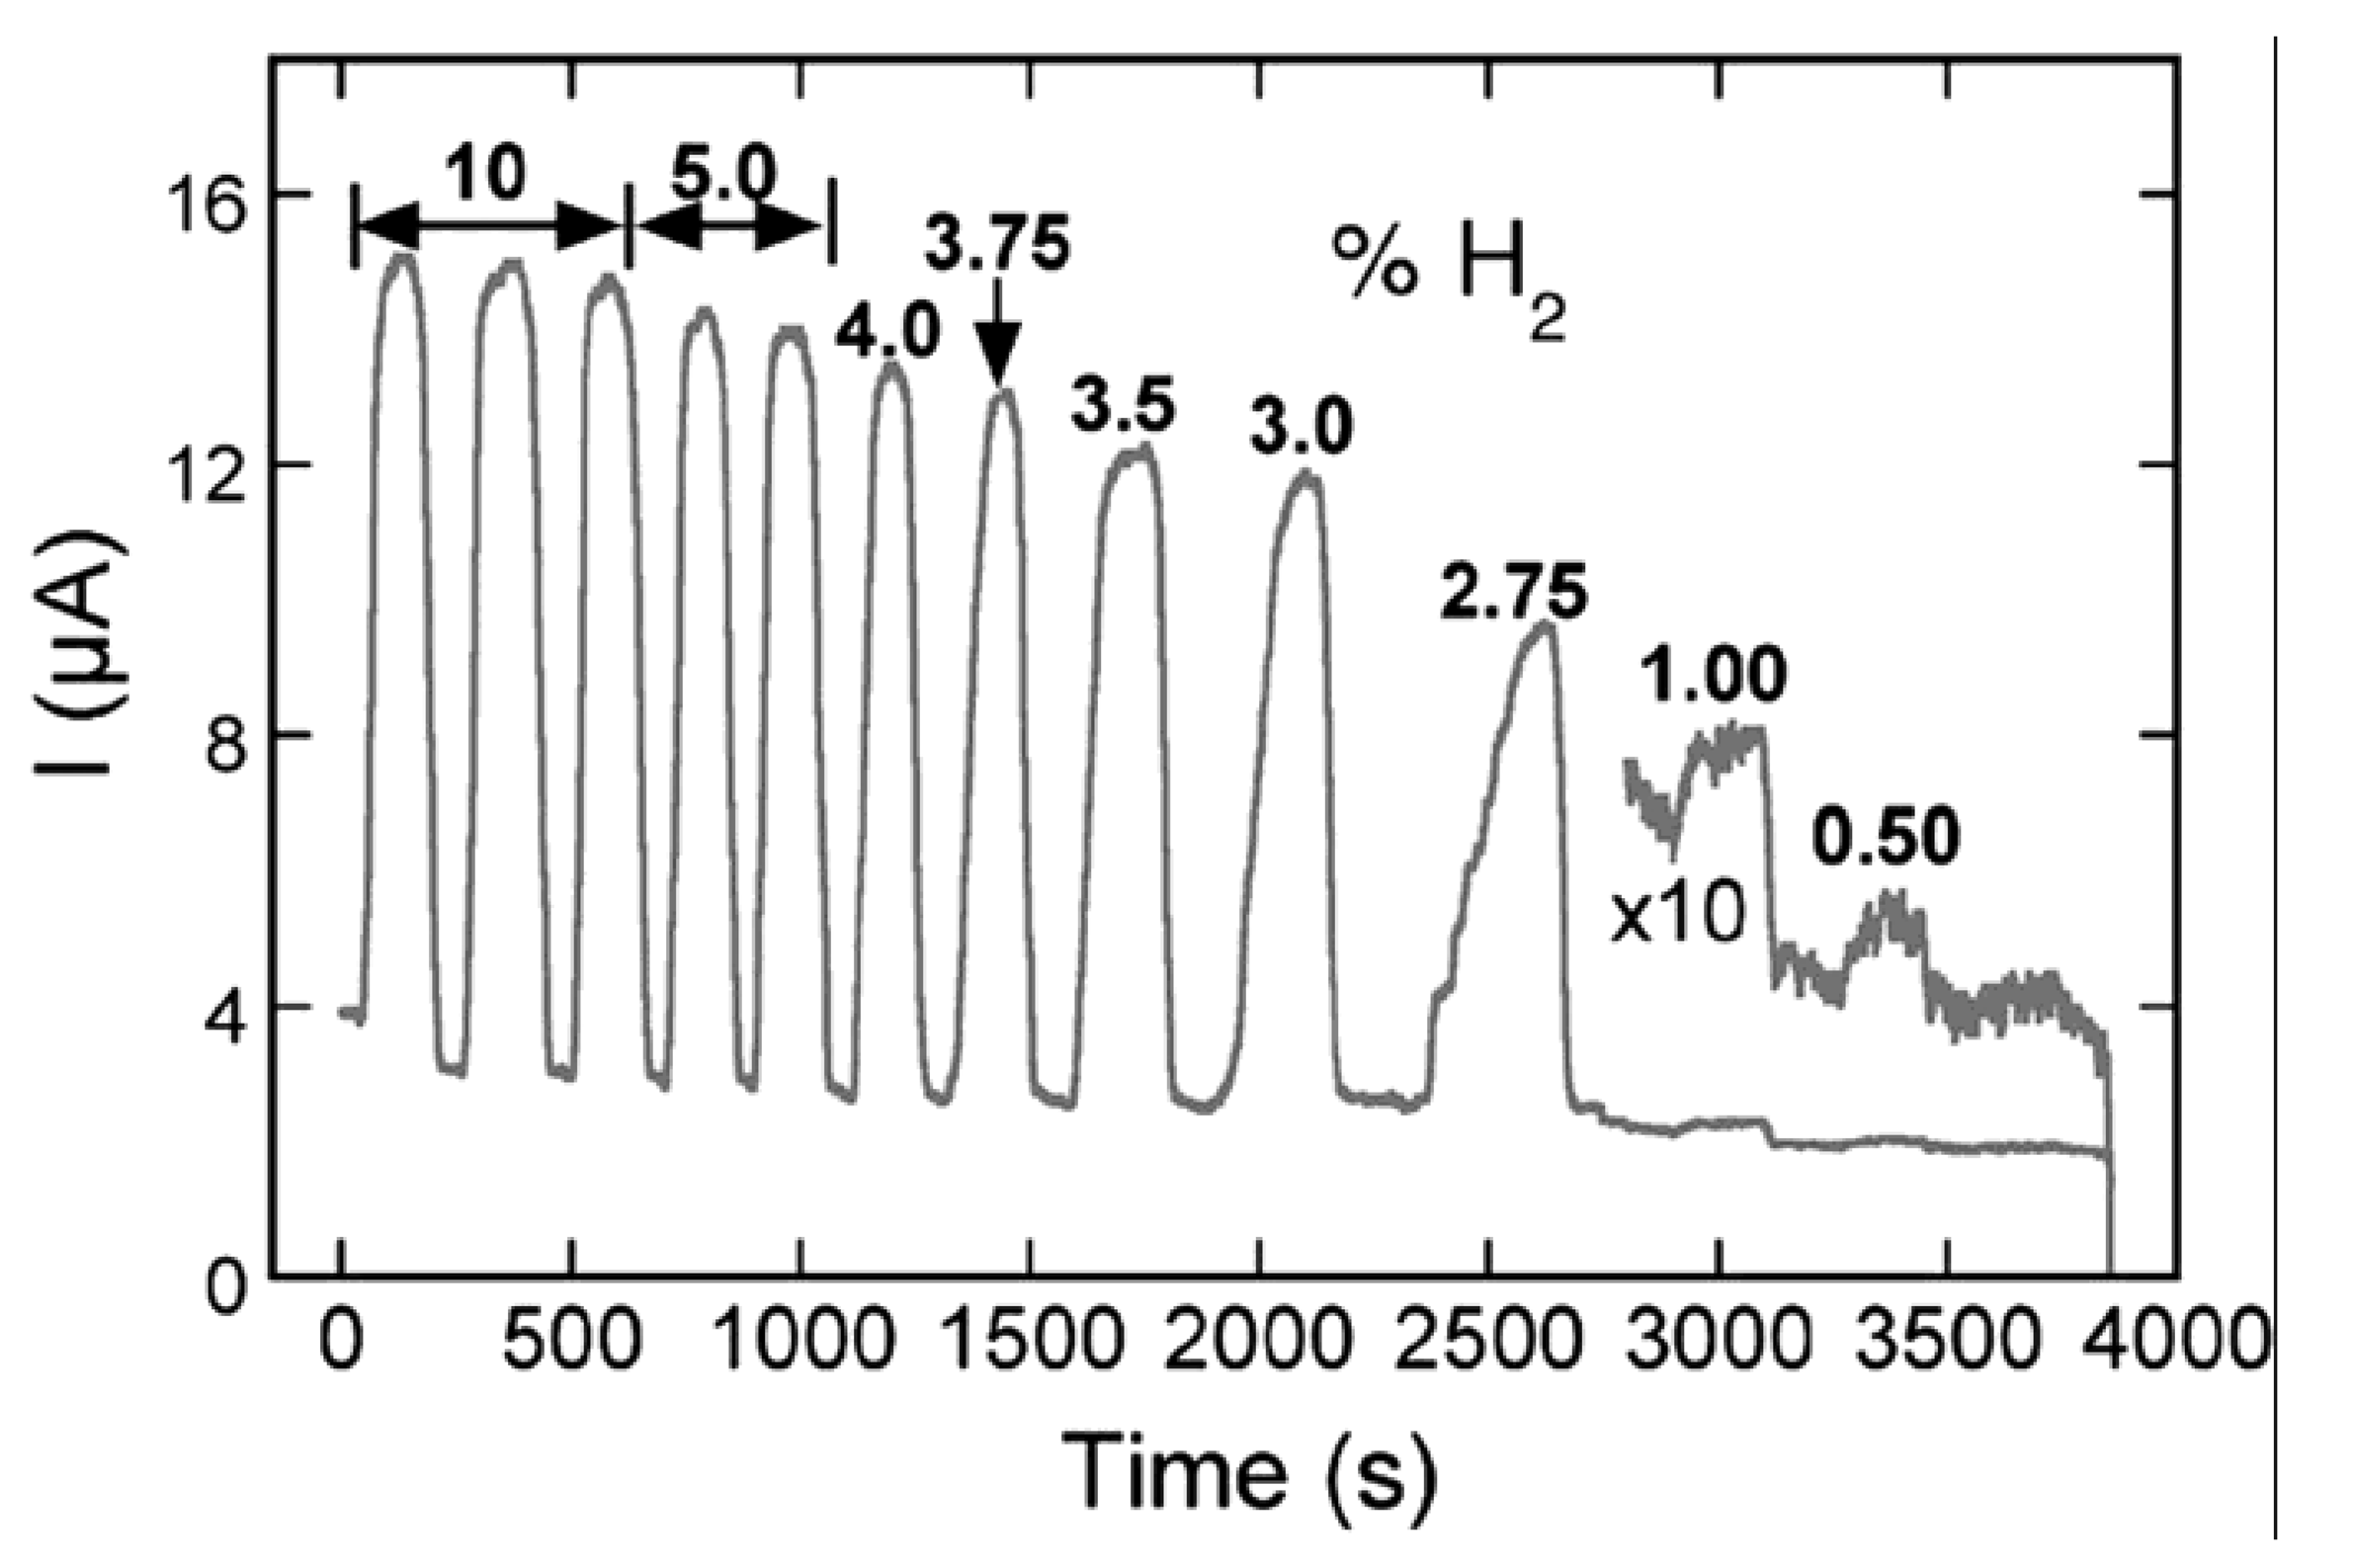
4. Nanowires for Hydrogen and Ethanol Sensors
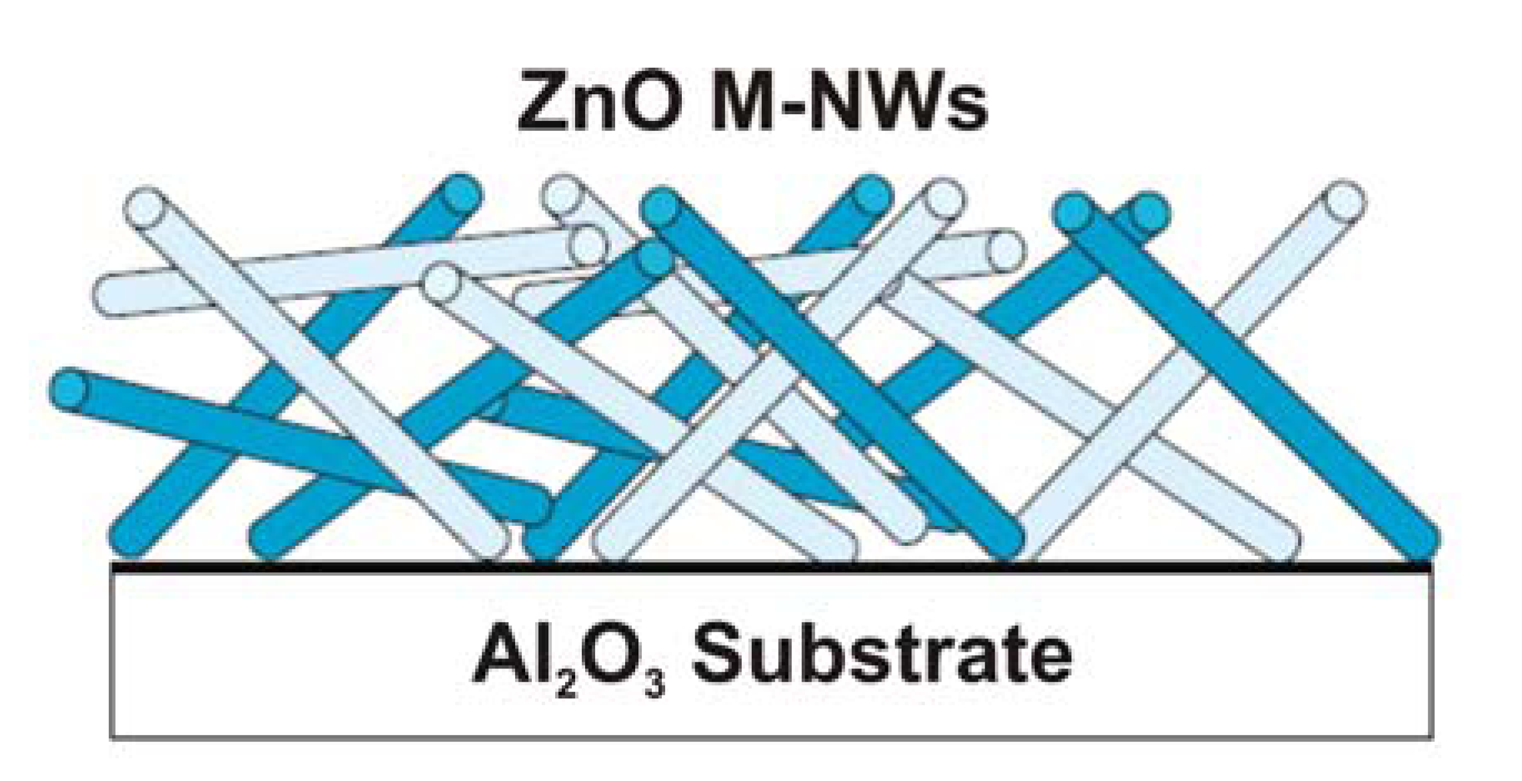
4.1. ZnO Nanowires, Nanorods and Nanotubes
4.2. Beaded Metal Nanowires (Pd, Cd, Mo, Au, Ag, Cu)
4.3. Mo and Pd Metal Nanowires
5. Nanowires for Hydrogen Peroxide and Glucose Sensors
5.1. Gold Nanowires with Chitosan and Glucose Oxidase (GOx)
5.2. Platinum Nanowires with CNTs, Chitosan and GOx
5.3. GoldNanowires/MPA/MPE with GOx
6. Nanowires for Cholesterol Sensor
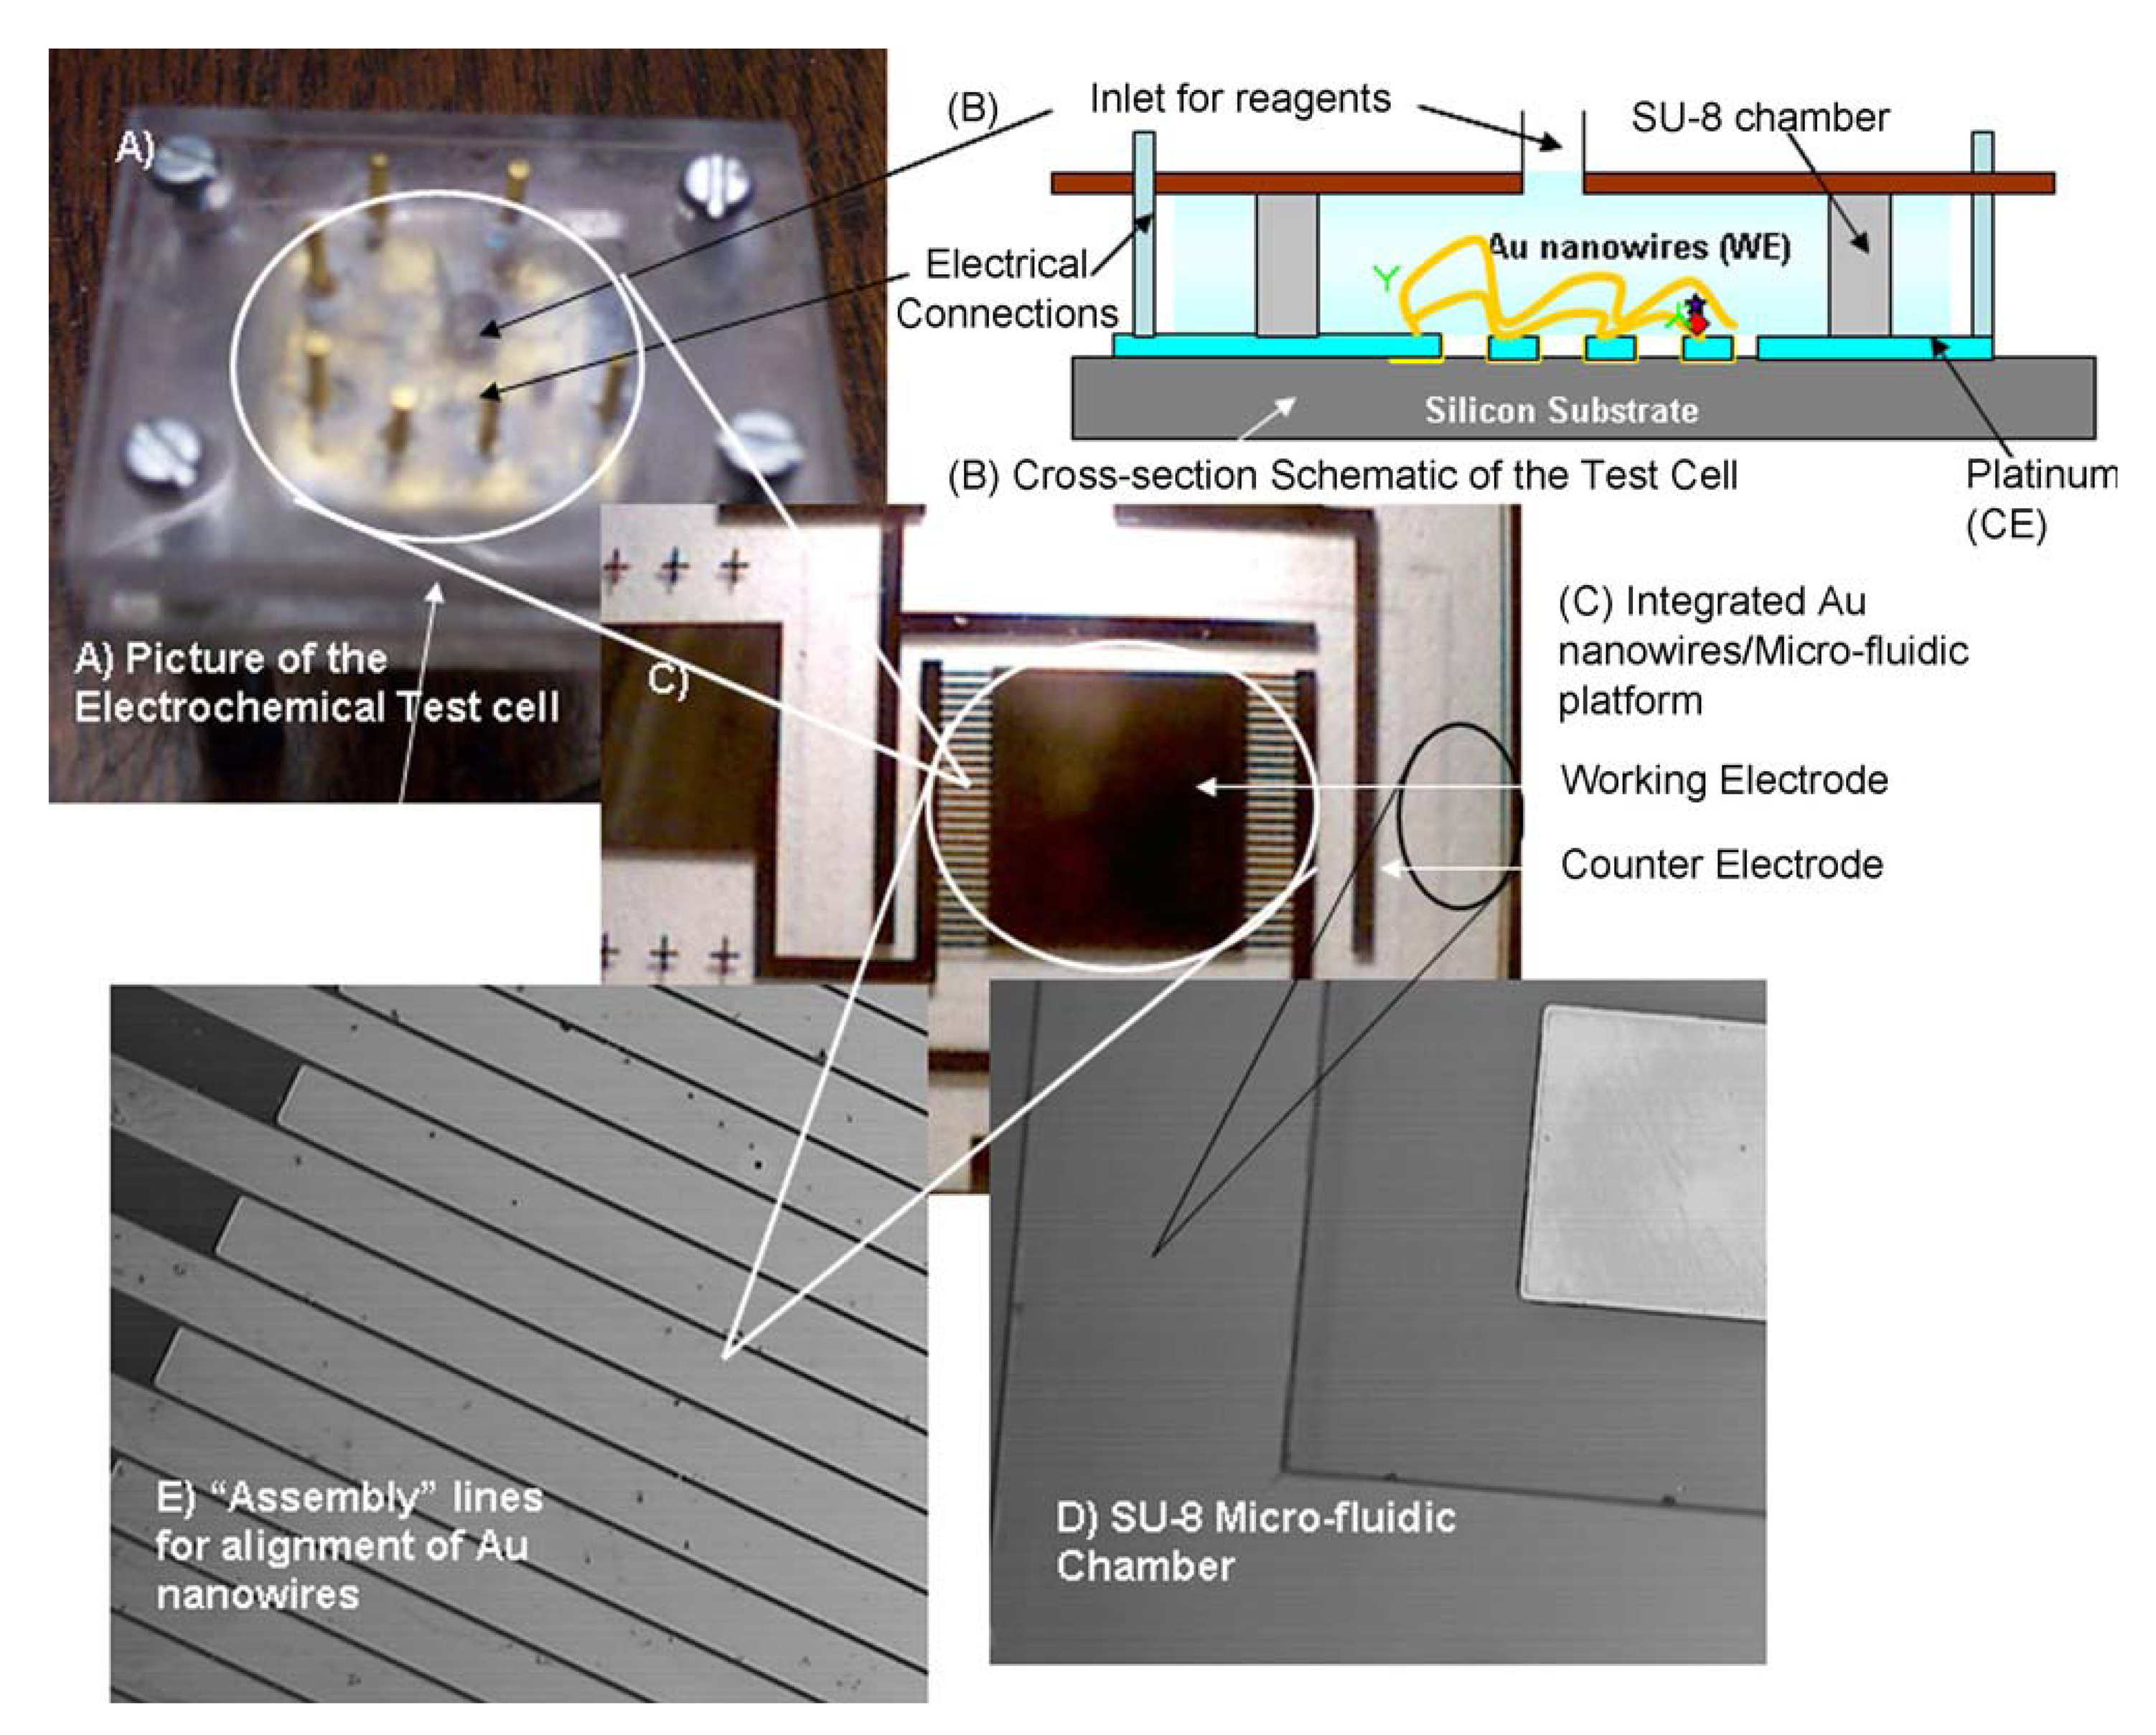
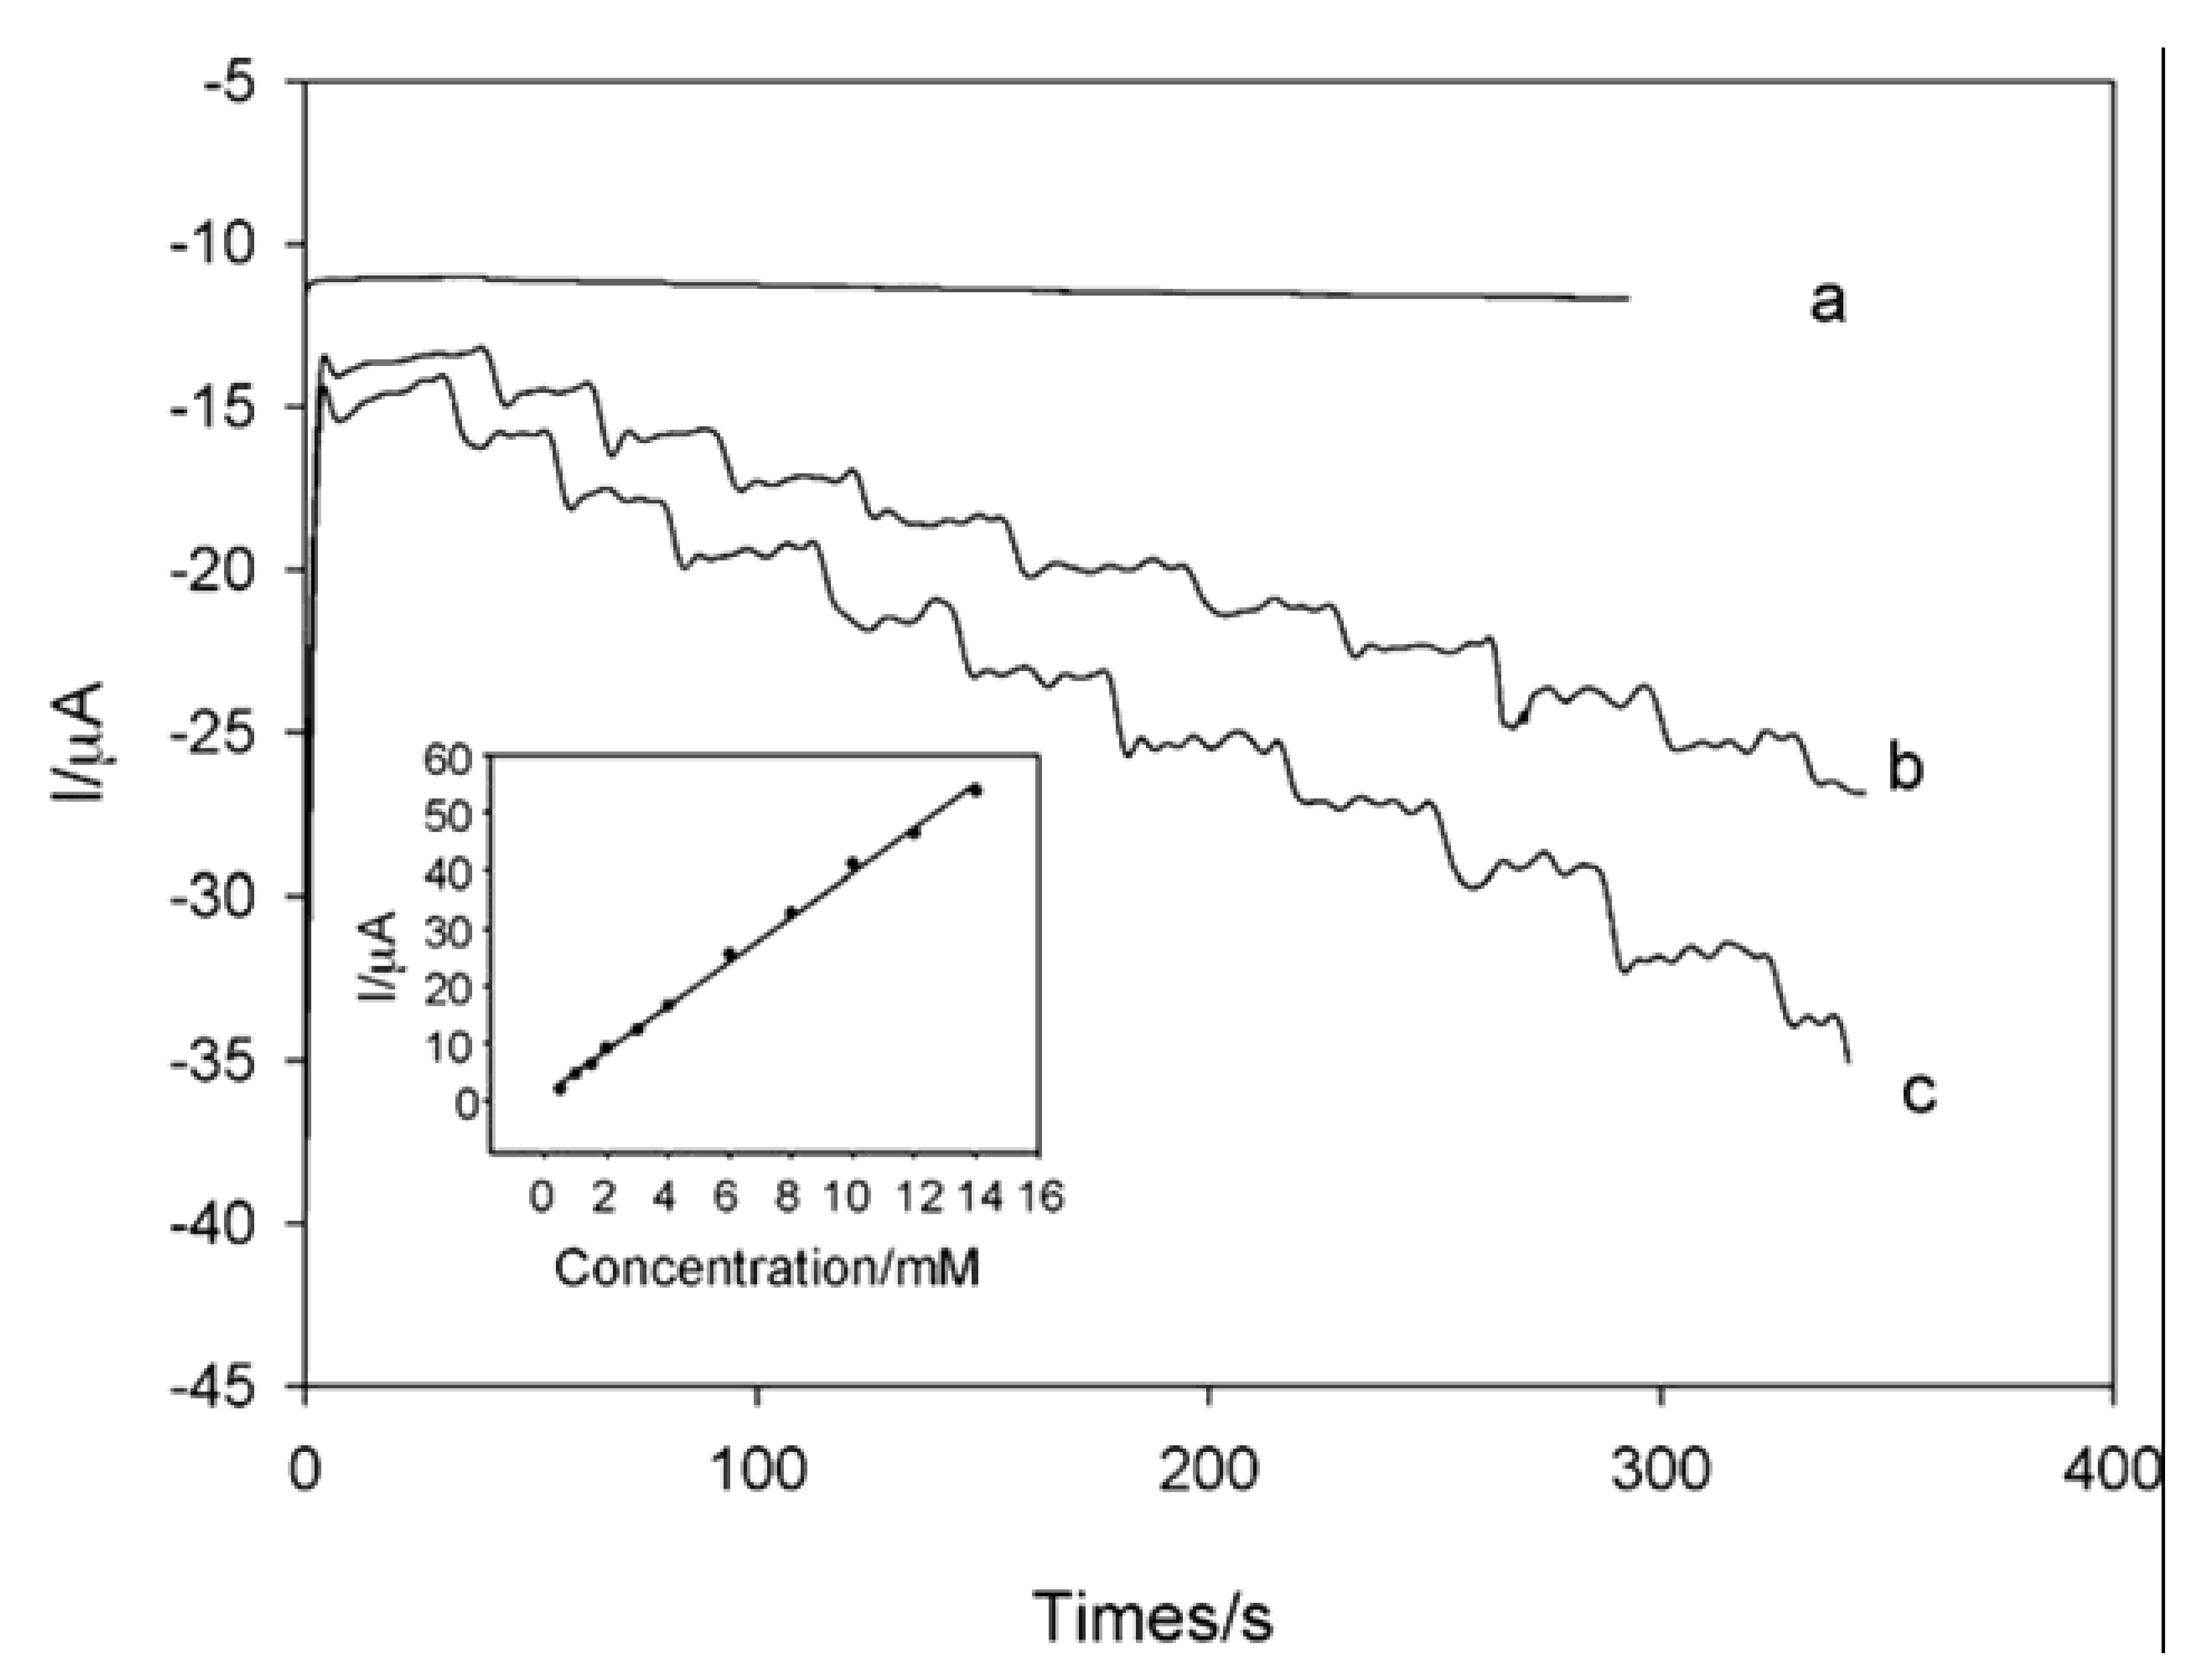
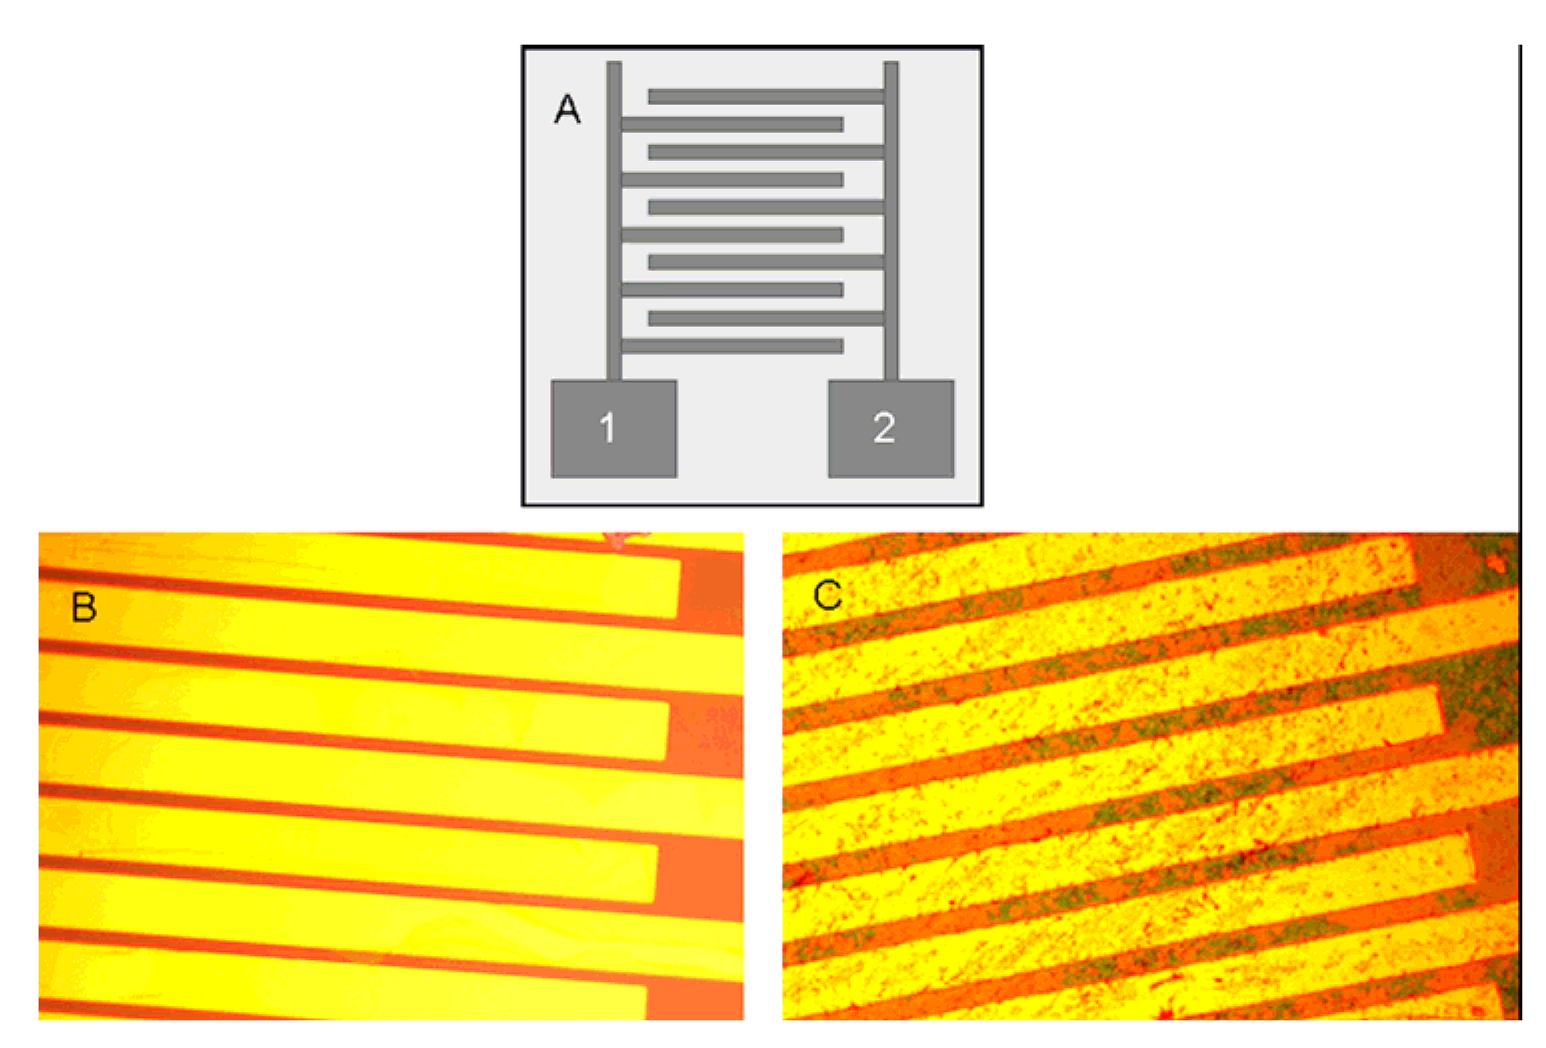
6.1. MEMS Micro-Fluidic Platform Modified with Gold Nanowires
6.2. Gold Nanowires with COx and CE
7. Nanowires for DNA Sensor
8. Nanowires for Other Chemical Sensors and Biosensors
8.1. La(OH)3 Nanowires Modified Carbon Paste Electrode (CPE) for Inosine Sensor
8.2. Gold Nanowires with Glycoconjugate (Antibody) for Bacterial Detection and Octadecanethiol Sensor
8.3. Silica Nanowires for the Detection of Cancer Biomarkers Exemplified by Interleukin-10 and Osteopontin
8.4. Silver Mesowires for Amine Vapor Sensor
9. Conclusions
Acknowledgments
References
- Wilson, G.S.; Gifford, R. Biosensors for real-time in vivo measurements. Biosens. Bioelectron. 2005, 20, 2388–2403. [Google Scholar] [CrossRef]
- Sakaguchi, T.; Morioka, Y.; Yamasaki, M.; Iwanaga, J.; Beppu, K.; Maeda, H.; Morita, Y.; Tamiya, E. Rapid and onsite BOD sensing system using luminous bacterial cells-immobilized chip. Biosens. Bioelectron. 2007, 22, 1345–1350. [Google Scholar] [CrossRef]
- Chen, S.M.; Chzo, W.Y. Simultaneous voltammetric detection of dopamine and ascorbic acid using didodecyldimethylammonium bromide (DDAB) film-modified electrodes. J. Electroanal. Chem. 2006, 587, 226–234. [Google Scholar] [CrossRef]
- Vasantha, V.S.; Chen, S.M. Electrocatalysis and simultaneous detection of dopamine and ascorbic acid using poly(3,4-ethylenedioxy)thiophene film modified electrodes. J. Electroanal. Chem. 2006, 592, 77–87. [Google Scholar] [CrossRef]
- Simoyi, M.F.; Falkenstein, E.; Dyke, K.V.; Blemings, K.P.; Klandorf, H. Allantoin the oxidation product of uric acid is present in chicken and turkey plasma. Comparative Biochemistry and Physiology Part B 2003, 135, 325–335. [Google Scholar] [CrossRef]
- Balasubramanian, K.; Burghard, M. Biosensors based on carbon nanotubes. Anal. Bioanal. Chem. 2006, 385, 452–468. [Google Scholar] [CrossRef]
- Zhang, S.; Wang, N.; Niu, Y.; Sun, C. Immobilization of glucose oxidase on gold nanoparticles modified Au electrode for the construction of biosensor. Sens. Act. B. 2005, 109, 367–374. [Google Scholar] [CrossRef]
- Wang, J.; Musameh, M.; Lin, Y. Solubilization of carbon nanotubes by nafion toward the preparation of amperometric biosensors. J. Am. Chem. Soc. 2003, 125, 2408–2409. [Google Scholar] [CrossRef]
- Yogeswaran, U.; Thiagarajan, S.; Chen, S.M. Nanocomposite of functionalized multiwall carbon nanotubes with nafion, nano platinum, and nano gold biosensing film for simultaneous determination of ascorbic acid, epinephrine, and uric acid. Anal. Biochem. 2007, 365, 122–131. [Google Scholar] [CrossRef]
- Yogeswaran, U.; Chen, S.M. Separation and concentration effect of f-MWCNTs on electrocatalytic responses of ascorbic acid, dopamine and uric acid at f-MWCNTs incorporated with poly (neutral red) composite films. Electrochim. Acta. 2007, 52, 5985–5996. [Google Scholar] [CrossRef]
- Hubalek, J.; Hradecky, J.; Adam, V.; Krystofova, O.; Huska, D.; Masarik, M.; Trnkova, L.; Horna, A.; Klosova, K.; Adamek, M.; Zehnalek, J.; Kizek, R. Spectrometric and voltammetric analysis of urease – nickel nanoelectrode as an electrochemical sensor. Sensors 2007, 7, 1238–1255. [Google Scholar]
- Yogeswaran, U.; Thiagarajan, S.; Chen, S.M. Pinecone shape hydroxypropyl-β-cyclodextrin on a film of multi-walled carbon nanotubes coated with gold particles for the simultaneous determination of tyrosine, guanine, adenine and thymine. Carbon 2007, 45, 2783–2796. [Google Scholar] [CrossRef]
- Yogeswaran, U.; Chen, S.M. Electrocatalytic properties of electrodes which are functionalized with composite films of f-MWCNTs incorporated with poly(neutral red). J. Electrochem. Soc. 2007, 154, E178–E186. [Google Scholar]
- Kim, I.J.; Han, S.D.; Han, C.H.; Gwak, J.; Lee, H.D.; Wang, J.S. Micro semiconductor CO sensors based on indium-doped tin dioxide nanocrystalline powders. Sensors 2006, 6, 526–535. [Google Scholar]
- Lyons, M.E.G.; Keeley, G.P. The redox behaviour of randomly dispersed single walled carbon nanotubes both in the absence and in the presence of adsorbed glucose oxidase. Sensors 2006, 6, 1791–1826. [Google Scholar]
- Liang, W.; Zhuobin, Y. Direct electrochemistry of glucose oxidase at a gold electrode modified with single-wall carbon nanotubes. Sensors 2003, 3, 544–554. [Google Scholar]
- Hernandez-Velez, M. Nanowires and 1D arrays fabrication: An overview. Thin Solid Films. 2006, 495, 51–63. [Google Scholar] [CrossRef]
- Yogeswaran, U.; Chen, S.M. Multi-walled carbon nanotubes with poly(methylene blue) composite film for the enhancement and separation of electroanalytical responses of catecholamine and ascorbic acid. Sens. Act. B 2008, 128. in press. [Google Scholar] [CrossRef]
- Shie, J.W.; Yogeswaran, U.; Chen, S.M. Electroanalytical properties of cytochrome c by direct electrochemistry on multi-walled carbon nanotubes incorporated with DNA biocomposite film. Talanta 2008, 74, 1659–1669. [Google Scholar]
- Li, S.; He, P.; Dong, J.; Guo, Z.; Dai, L. DNA-directed self-assembling of carbon nanotubes. J. Am. Chem. Soc. 2005, 127, 14–15. [Google Scholar] [CrossRef]
- Vaseashta, A.; Dimova-Malinovska, D. Nanostructured and nanoscale devices, sensors and detectors. Sci. Tech. Adv. Mat. 2005, 6, 312–318. [Google Scholar]
- Zhang, X.L.; Wang, J.X.; Wang, Z.; Wang, S.C. Improvement of amperometric sensor used for determination of nitrate with polypyrrole nanowires modified electrode. Sensors 2005, 5, 580–593. [Google Scholar]
- Qian, L.; Yang, X. Composite film of carbon nanotubes and chitosan for preparation of amperometric hydrogen peroxide biosensor. Talanta 2006, 68, 721–727. [Google Scholar] [CrossRef]
- Wang, J.; Chen, G.; Chatrathi, M.P.; Musameh, M. Capillary electrophoresis microchip with a carbon nanotube-modified electrochemical detector. Anal. Chem. 2004, 76, 298–302. [Google Scholar] [CrossRef]
- Curreli, M.; Li, C.; Sun, Y.; Lei, B.; Gundersen, M.A.; Thompson, M.E.; Zhou, C. Selective functionalization of In2O3 nanowire mat devices for biosensing applications. J. Am. Chem. Soc. 2005, 127, 6922–6923. [Google Scholar] [CrossRef]
- Roberts, M.A.; Kelley, S.O. Ultrasensitive detection of enzymatic activity with nanowires electrodes. J. Am. Chem. Soc. 2007, 129, 11356–11357. [Google Scholar] [CrossRef]
- Shi, L.; Yu, C.; Zhou, J. Thermal characterization and sensor applications of one-dimensional nanostructures employing microelectromechanical systems. J. Phys. Chem. B. 2005, 109, 22102–22111. [Google Scholar] [CrossRef]
- Laocharoensuk, R.; Bulbarello, A.; Hocevar, S.B.; Mannino, S.; Ogorevc, B.; Wang, J. On-demand protection of electrochemical sensors based on adaptive nanowires. J. Am. Chem. Soc. 2007, 129, 7774–7775. [Google Scholar] [CrossRef]
- Lee, E.P.; Peng, Z.; Cate, D.M.; Yang, H.; Campbell, C.T.; Xia, Y. Growing Pt nanowires as a densely packed array on metal gauze. J. Am. Chem. Soc. 2007, 129, 10634–10635. [Google Scholar] [CrossRef]
- Zhu, N.; Chang, Z.; He, P.; Fang, Y. Electrochemically fabricated polyaniline nanowires-modified electrode for voltammetric detection of DNA hybridization. Electrochim. Acta. 2006, 51, 3758–3762. [Google Scholar] [CrossRef]
- Tian, Y.; Wang, J.; Wang, Z.; Wang, S. Electroreduction of nitrite at an electrode modified with polypyrrole nanowires. Synthetic Metals. 2004, 143, 309–313. [Google Scholar] [CrossRef]
- Hultgren, A.; Tanase, M.; Felton, E.J.; Bhadriraju, K.; Salem, A.K.; Chen, C.S.; Reich, D.H. Optimization of yield in magnetic cell separations using nickel nanowires of different lengths. Biotechnol. Prog. 2005, 21, 509–515. [Google Scholar] [CrossRef]
- Wanekaya, A.K.; Chen, W.; Myung, N.V.; Mulchandani, A. Nanowire-based electrochemical biosensors. Electroanalysis. 2006, 18, 533–550. [Google Scholar] [CrossRef]
- Müller, T.; Heining, K.H.; Schmidt, B. Formation of Ge nanowires in oxidized silicon V-grooves by ion beam synthesis. Nucl. Instrum. Methods Phys. Res. 2001, 175, 468–473. [Google Scholar]
- Sun, Y.; Khang, D.Y.; Hua, F.; Hurley, K.; Nuzzo, R.G.; Rogers, J.A. Photolithographic route to the fabrication of micro/nanowires of III-V semiconductors. Adv. Funct. Mater. 2005, 15, 30–40. [Google Scholar] [CrossRef]
- Cheng, F.L.; Zhang, M.L.; Wang, H. Fabrication of polypyrrole nanowire and nanotube arrays. Sensors 2005, 5, 245–249. [Google Scholar]
- Penumetcha, S.S.; Kona, R.; Hardin, J.L.; Molder, A.L.; Steinle, E.D. Monitoring transport across modified nanoporous alumina membranes. Sensors 2007, 7, 2942–2952. [Google Scholar]
- Martin, C.R. Membrane-based synthesis of nanomaterials. Chem. Mater. 1996, 8, 1739–1746. [Google Scholar] [CrossRef]
- Müller, F.; Birner, A.; Schilling, J.; Li, A.P.; Nielsch, K.; Gösele, U.; Lehmann, V. High aspect ratio microstructures based on anisotropic porous materials. Microsyst. Technol. 2002, 8, 7–9. [Google Scholar] [CrossRef]
- Choi, J.; Nielsch, K.; Reiche, M.; Wehrspohn, R.B.; Gösele, U. Fabrication of monodomain alumina pore arrays with an interpore distance smaller than the lattice constant of the imprint stamp. J. Vac. Sci. Technol. B. 2003, 21, 763–766. [Google Scholar] [CrossRef]
- Masuda, H.; Abe, A.; Nakao, M.; Yokoo, A.; Tamamura, T.; Nishio, K. Ordered mosaic nanocomposites in anodic porous alumina. Adv. Mater. 2003, 15, 161–164. [Google Scholar] [CrossRef]
- Masuda, H.; Ohya, M.; Asoh, H.; Nishio, K. Photonic band gap in naturally occurring ordered anodic porous alumina. Jpn. J. Appl. Phys. 2001, 40, L1217–L1219. [Google Scholar]
- Bae, E.J.; Choi, W.B.; Jeong, K.S.; Chu, J.U.; Park, G.S.; Song, S.; Yoo, I.K. Selective growth of carbon nanotubes on pre-patterned porous anodic aluminum oxide. Adv. Mater. 2002, 14, 277–279. [Google Scholar] [CrossRef]
- Martín, A.; Martínez, F.; Calvo, J.I.; Prádanos, P.; Palacios, L.; Hernández, A. Protein adsorption onto an inorganic microfiltration membrane: Solute-solid interactions and surface coverage. J. Membr. Sci. 2002, 207, 199–207. [Google Scholar] [CrossRef]
- Dickey, E.C.; Varghese, O.K.; Ong, K.G.; Gong, D.; Paulose, M.; Grimes, C.A. Room temperature ammonia and humidity sensing using highly ordered nanoporous alumina films. Sensors 2002, 2, 91–110. [Google Scholar]
- Asoh, H.; Ono, S.; Hirose, T.; Nakao, M.; Masuda, H. Growth of anodic porous alumina with square cells. Electrochim. Acta. 2003, 48, 3171–3174. [Google Scholar] [CrossRef]
- Choi, J.; Wehrspohn, R.; Gösele, U. Moiré pattern formation on porous alumina arrays using nanoimprint lithography. Adv. Mater. 2003, 15, 1531–1534. [Google Scholar] [CrossRef]
- Asoh, H.; Matsuo, M.; Yoshihama, M.; Ono, S. Transfer of nanoporous pattern of anodic porous alumina into Si substrate. Appl. Phys. Lett. 2003, 83, 4408–4410. [Google Scholar] [CrossRef]
- Hoyer, P. Formation of a titanium dioxide nanotube array. Langmuir 1996, 12, 1411–1413. [Google Scholar] [CrossRef]
- Sander, M.S.; Coté, M.J.; Gu, W.; Kile, B.M.; Tripp, C.P. Template-assisted fabrication of dense, aligned arrays of titania nanotubes with well-controlled dimensions on substrates. Adv. Mater. 2004, 16, 2052–2057. [Google Scholar] [CrossRef]
- Zhang, R.; Tejedor, M.I.; Anderson, M.A.; Paulose, M.; Grimes, C.A. Ethylene detection using nanoporous PtTiO2 coatings applied to magnetoelastic thick films. Sensors 2002, 2, 331–338. [Google Scholar]
- Varghese, O.K.; Paulose, M.; Grimes, C.A.; Dickey, E.C. Crystallization and high-temperature structural stability of titanium oxide nanotube arrays. J. Mater. Res. 2003, 18, 156–165. [Google Scholar]
- Sarkar, J.; Khan, G.G.; Basumalick, A. Nanowires: properties, applications and synthesis via porous anodic aluminium oxide template. Bull. Mater. Sci. 2007, 30, 271–290. [Google Scholar] [CrossRef]
- Muller, C.J.; van Ruitenbeek, J.M.; de Jongh, L.J. Conductance and supercurrent discontinuities in atomic-scale metallic constrictions of variable width. Phys. Rev. Lett. 1992, 69, 140–143. [Google Scholar] [CrossRef]
- Muller, C.J.; Krans, J.M.; Todorov, T.N.; Reed, M.A. Quantization effects in the conductance of metallic contacts at room temperature. Phys. Rev. B. 1996, 53, 1022–1025. [Google Scholar] [CrossRef]
- van Wees, B.J.; van Houten, H.; Beenakker, C.W.J.; Williamson, J.G.; Kouvenhoven, L.P.; van der Marel, D.; Foxon, C.T. Quantized conductance of point contacts in a two-dimensional electron gas. Phys. Rev. Lett. 1988, 60, 848–850. [Google Scholar] [CrossRef]
- Wharam, D.A.; Thornton, T.J.; Newbury, R.; Pepper, M.; Ahmed, H.; Frost, J.E.F.; Hasko, D.G.; Peacock, D.C.; Ritchie, D.A.; Jones, G.A.C. One-dimensional transport and the quantisation of the ballistic resistance. J. Phys. C: Solid State Phys. 1988, 21, L209–L214. [Google Scholar]
- Costa-Krämer, J.L.; Garcia, N.; Olin, H. Conductance quantization in bismuth nanowires at 4 K. Phys. Rev. Lett. 1997, 78, 4990–4993. [Google Scholar] [CrossRef]
- Zhao, J.; Buia, C.; Han, J.; Lu, J.P. Quantum transport properties of ultrathin silver nanowires. Nanotechnology 2003, 14, 501–504. [Google Scholar] [CrossRef]
- Duan, X.; Huang, Y.; Lieber, C.M. Nonvolatile memory and programmable logic from moleculegated nanowires. Nano. Lett. 2002, 2, 487–490. [Google Scholar] [CrossRef]
- Rout, C.S.; Krishna, S.H.; Vivekchand, S.R.C.; Govindaraj, A.; Rao, C.N.R. Hydrogen and ethanol sensors based on ZnO nanorods, nanowires and nanotubes. Chem. Phy. Lett. 2006, 418, 586–590. [Google Scholar] [CrossRef]
- Tien, L.C.; Wang, H.T.; Kang, B.S.; Ren, F.; Sadik, P.W.; Norton, D.P.; Pearton, S.J.; Linc, J. Room-Temperature Hydrogen-Selective Sensing Using Single Pt-Coated ZnO Nanowires at Microwatt Power Levels. Electrochem. Solid-State Lett. 2005, 8, G230–G232. [Google Scholar] [CrossRef]
- Wang, H.T.; Kang, B.S.; Ren, F.; Tien, L.C.; Sadik, P.W.; Norton, D.P.; Pearton, S.J.; Lin, J. Detection of hydrogen at room temperature with catalyst-coated multiple ZnO nanorods. Appl. Phys. A. 2005, 81, 1117–1119. [Google Scholar] [CrossRef]
- Walter, E.C.; Ng, K.; Zach, M.P.; Penner, R.M.; Favier, F. lectronic devices from electrodeposited metal nanowires. Microelectronic Eng. 2002, 61-62, 555–561. [Google Scholar]
- Walter, E.C.; Penner, R.M.; Liu, H.; Ng, K.H.; Zach, M.P.; Favier, F. Sensors from electrodeposited metal nanowires. Surf. Interface Anal. 2002, 34, 409–412. [Google Scholar] [CrossRef]
- Lu, Y.; Yang, M.; Qu, F. Enzyme-functionalized gold nanowires for the fabrication of biosensors. Bioelectrochem. 2007, 71, 211–216. [Google Scholar] [CrossRef]
- Qu, F.; Yang, M.; Shen, G.; Yu, R. Electrochemical biosensing utilizing synergic action of carbon nanotubes and platinum nanowires prepared by template synthesis. Biosen. Bioelectron. 2007, 22, 1749–1755. [Google Scholar] [CrossRef]
- Cusmà, A.; Curulli, A.; Zane, D.; Kaciulis, S.; Padeletti, G. Feasibility of enzyme biosensors based on gold nanowires. Mat. Sci. Eng. C. 2007, 27, 1158–1161. [Google Scholar] [CrossRef]
- Aravamudhan, S.; Kumar, A.; Mohapatra, S.; Bhansali, S. Sensitive estimation of total cholesterol in blood using Au nanowires based micro-fluidic platform. Biosen. Bioelectron. 2007, 22, 2289–2294. [Google Scholar] [CrossRef]
- Aravamudhan, S.; Ramgir, N.S.; Bhansali, S. Electrochemical biosensor for targeted detection in blood using aligned Au nanowires. Sensors and Actuators B. 2007, 127, 29–35. [Google Scholar] [CrossRef]
- Gao, Z.; Agarwal, A.; Trigg, A.D.; Singh, N.; Fang, C.; Tung, C.H.; Fan, Y.; Buddharaju, K.D.; Kong, J. Silicon nanowire arrays for label-free detection of DNA. Anal. Chem. 2007, 79, 3291–3297. [Google Scholar] [CrossRef]
- Lapierre-Devlin, M.A.; Asher, C.L.; Taft, B.J.; Gasparac, R.; Roberts, M.A.; Kelley, S.O. Amplified electrocatalysis at DNA-modified nanowires. Nano Lett. 2005, 5, 1051–1055. [Google Scholar] [CrossRef]
- Liu, L.; Song, J.F.; Yu, P.F.; Cui, B. A novel electrochemical sensing system for inosine and its application for inosine determination in pharmaceuticals and human serum. Electrochem. Comm. 2006, 8, 1521–1526. [Google Scholar] [CrossRef]
- Basu, M.; Seggerson, S.; Henshaw, J.; Jiang, J.; Cordona, R.D.A.; Lefave, C.; Boyle, P.J.; Miller, A.; Pugia, M.; Basu, S. Nano-biosensor development for bacterial detection during human kidney infection: Use of glycoconjugate-specific antibody-bound gold NanoWire arrays (GNWA). Glycoconjugate Journal. 2004, 21, 487–496. [Google Scholar] [CrossRef]
- Liu, Z.; Searson, P.C. Single nanoporous gold nanowire sensors. J. Phys. Chem. B. 2006, 110, 4318–4322. [Google Scholar] [CrossRef]
- Ramgir, N.S.; Zajac, A.; Sekhar, P.K.; Lee, L.; Zhukov, T.A.; Bhansali, S. Voltammetric detection of cancer biomarkers exemplified by interleukin-10 and osteopontin with silica nanowires. J. Phys. Chem. C. 2007, 111, 13981–13987. [Google Scholar] [CrossRef]
- Murray, B.J.; Walter, E.C.; Penner, R.M. Amine vapor sensing with silver mesowires. Nano Lett. 2004, 4, 665–670. [Google Scholar] [CrossRef]

© 2008 by MDPI Reproduction is permitted for noncommercial purposes.
Share and Cite
Yogeswaran, U.; Chen, S.-M. A Review on the Electrochemical Sensors and Biosensors Composed of Nanowires as Sensing Material. Sensors 2008, 8, 290-313. https://doi.org/10.3390/s8010290
Yogeswaran U, Chen S-M. A Review on the Electrochemical Sensors and Biosensors Composed of Nanowires as Sensing Material. Sensors. 2008; 8(1):290-313. https://doi.org/10.3390/s8010290
Chicago/Turabian StyleYogeswaran, Umasankar, and Shen-Ming Chen. 2008. "A Review on the Electrochemical Sensors and Biosensors Composed of Nanowires as Sensing Material" Sensors 8, no. 1: 290-313. https://doi.org/10.3390/s8010290
APA StyleYogeswaran, U., & Chen, S.-M. (2008). A Review on the Electrochemical Sensors and Biosensors Composed of Nanowires as Sensing Material. Sensors, 8(1), 290-313. https://doi.org/10.3390/s8010290