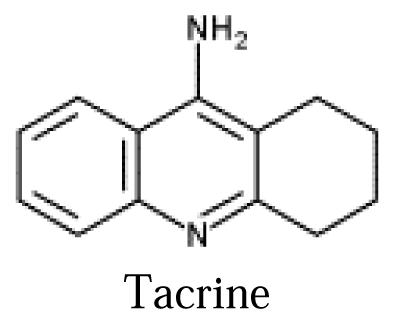
Flow-Injection Amperometric Determination of Tacrine based on Ion Transfer across a Water–Plasticized Polymeric Membrane Interface

Abstract
:1. Introduction
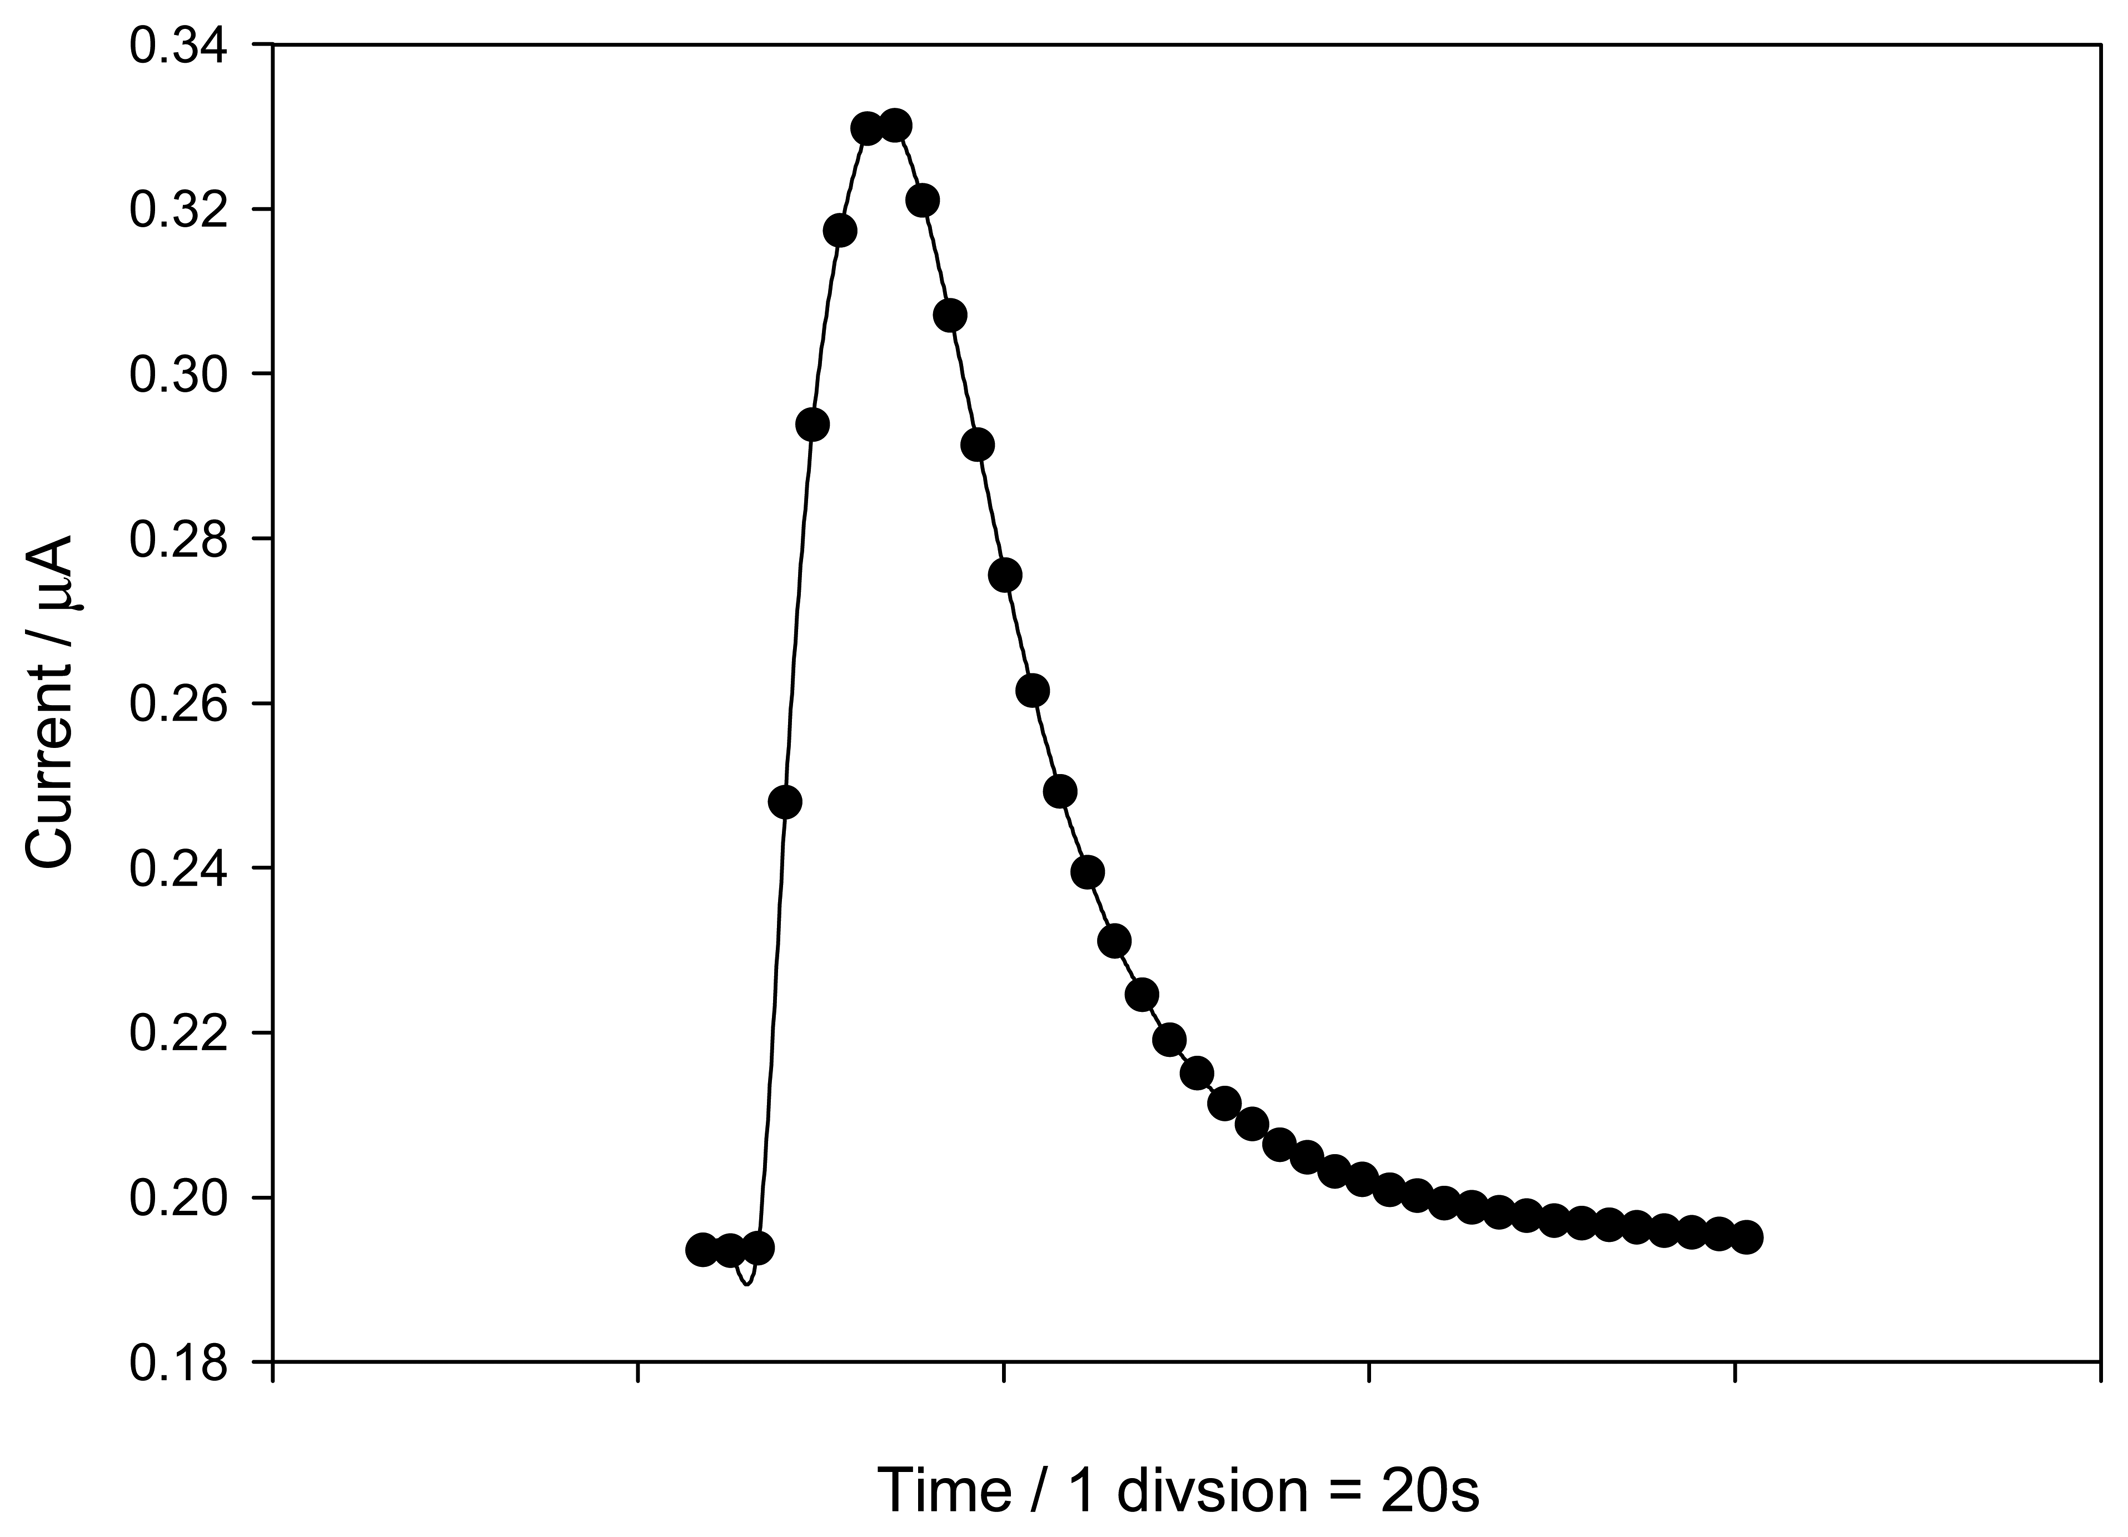
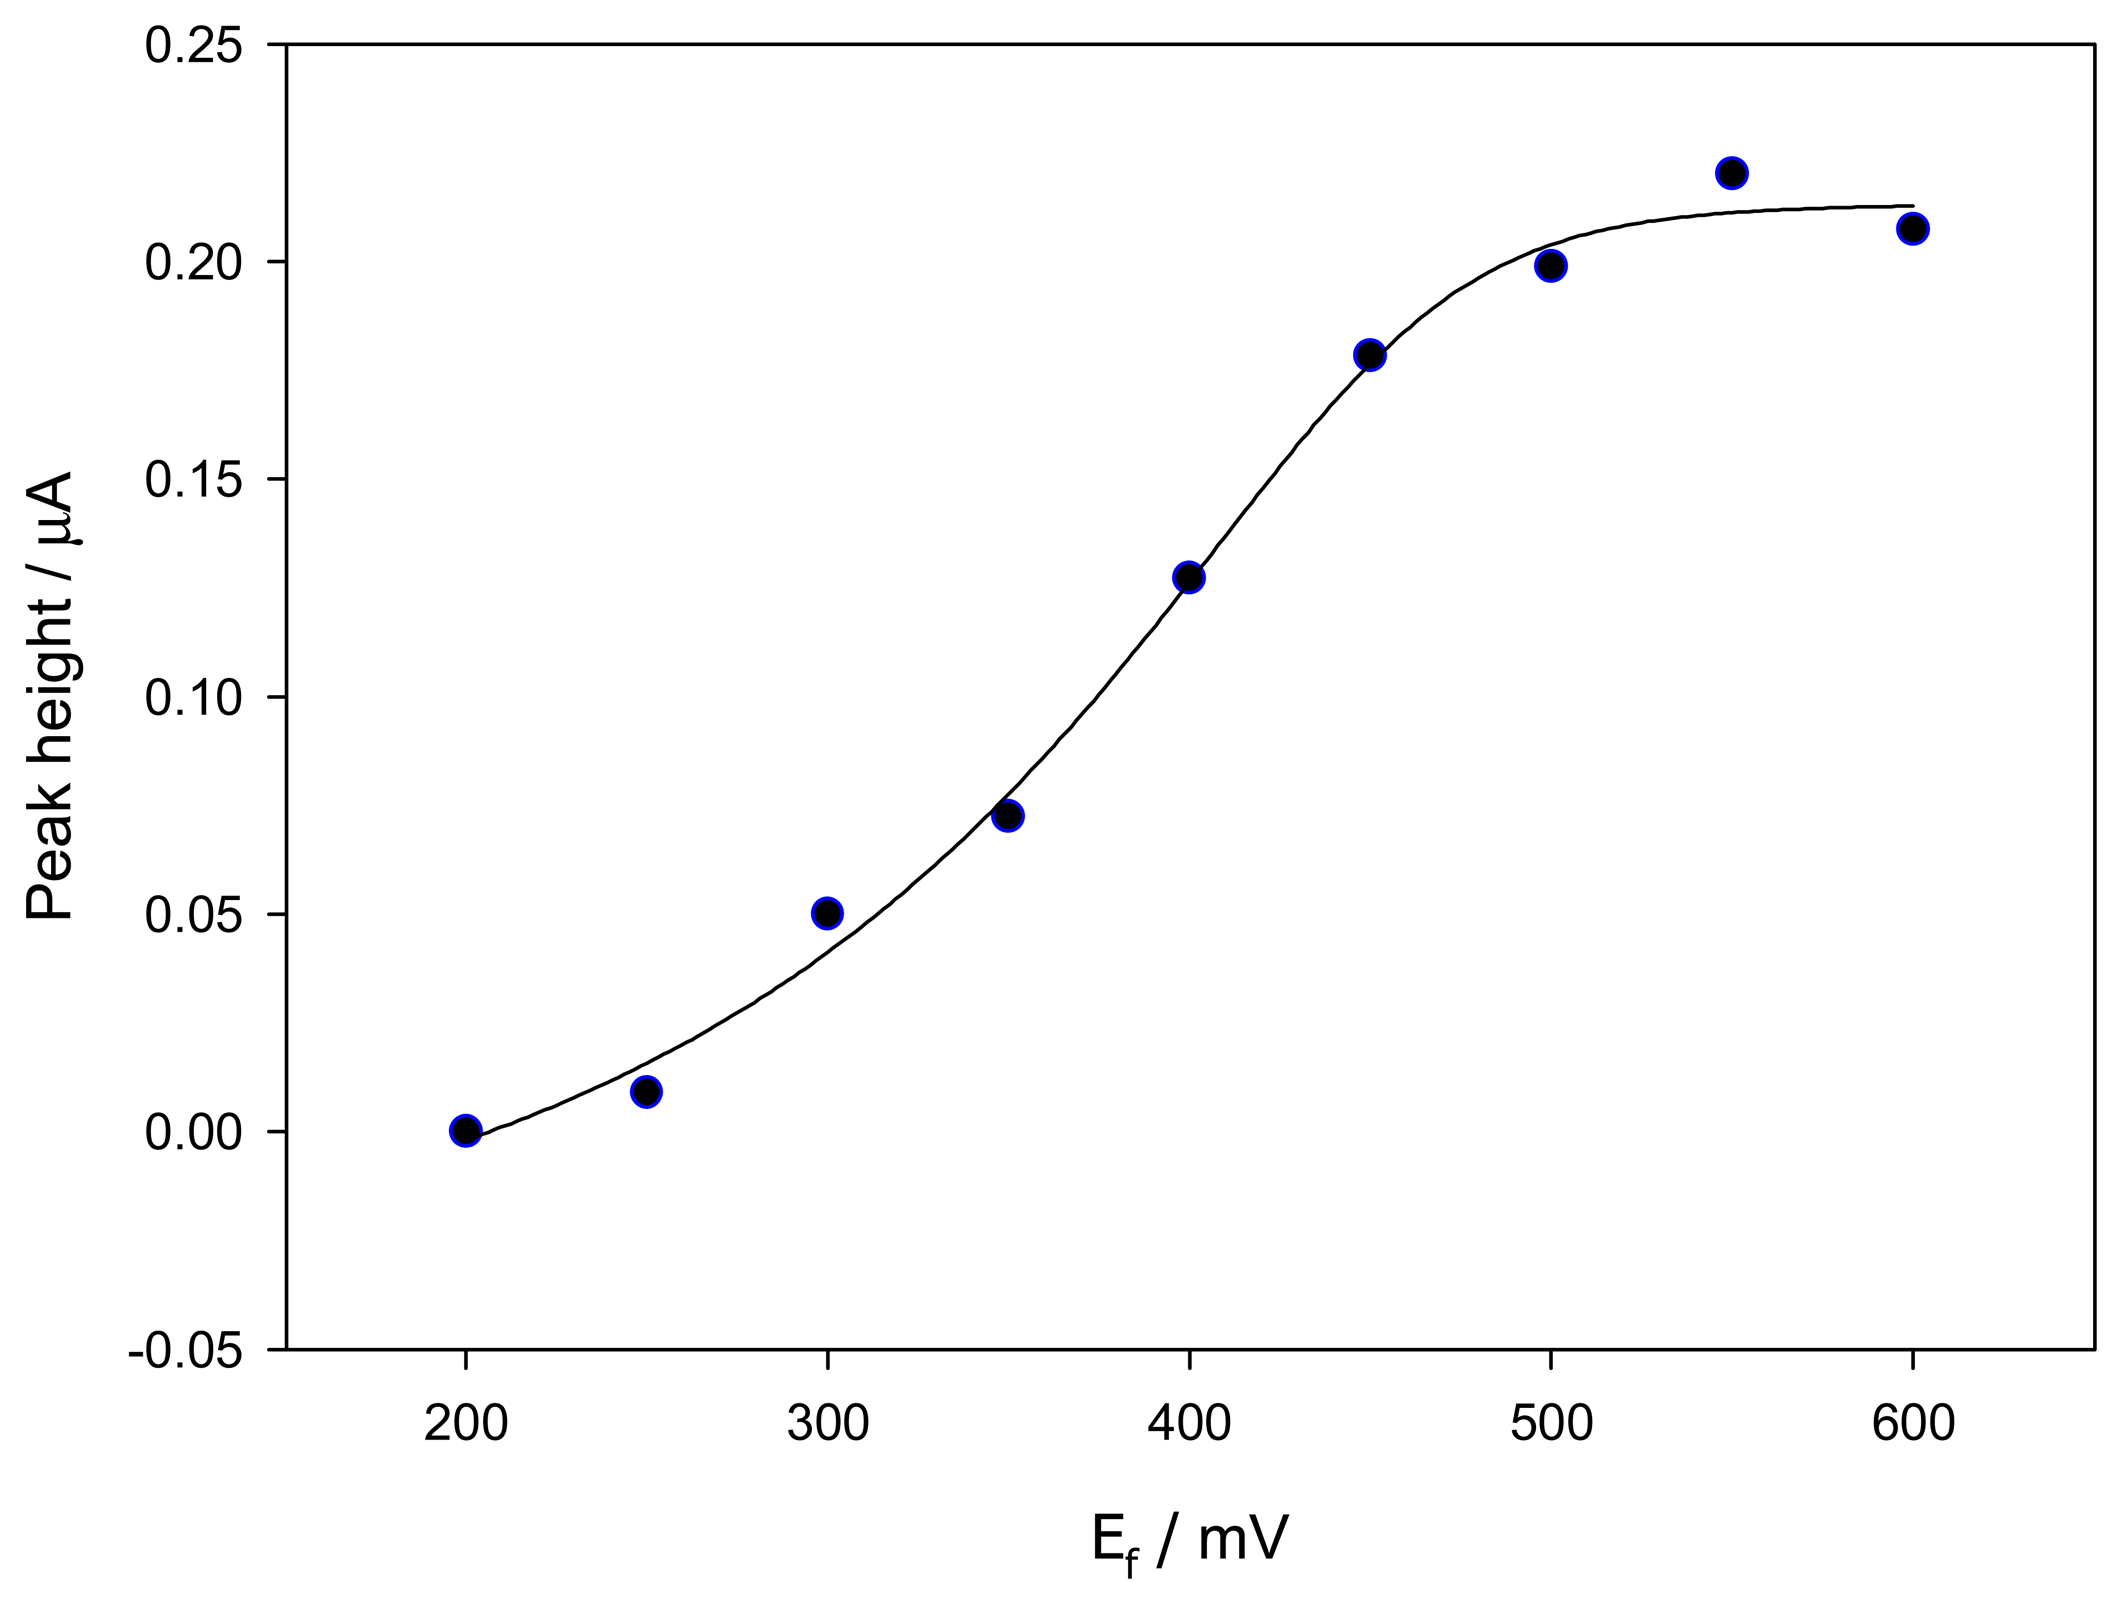
2. Results and Discussion
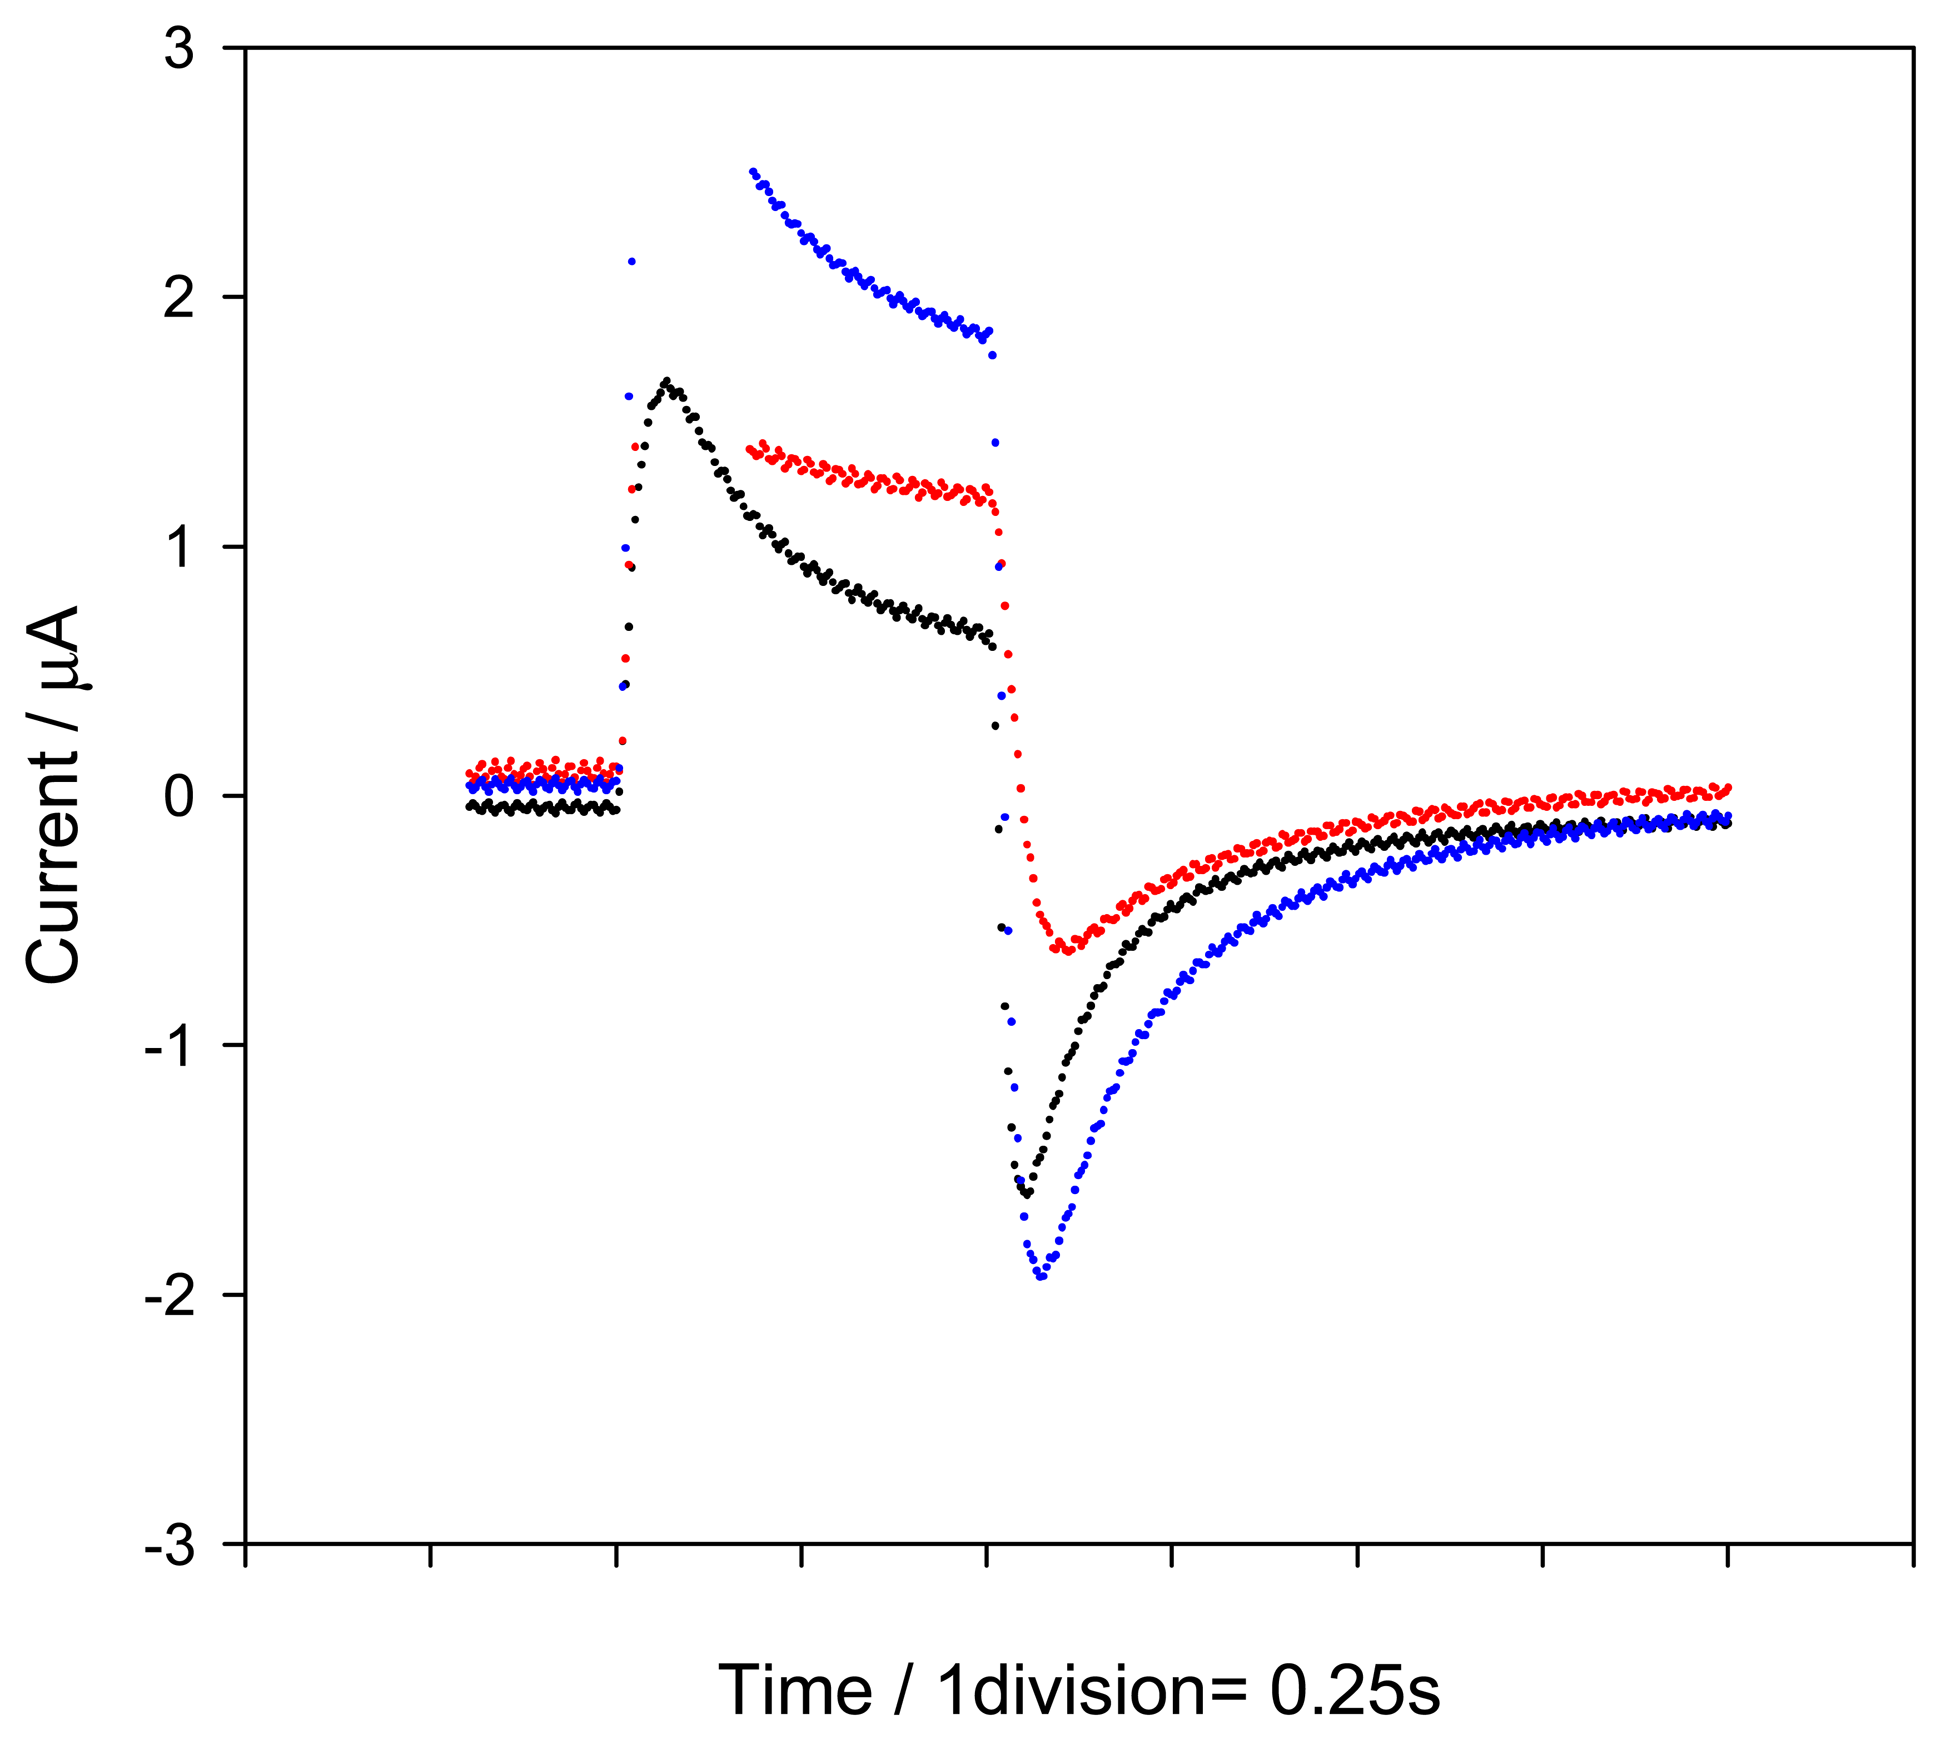
2.1. Influence of the applied potential
2.2. Influence of the flow-injection variables
2.3. Features of the method
2.4. Effect of other species
3. Experimental
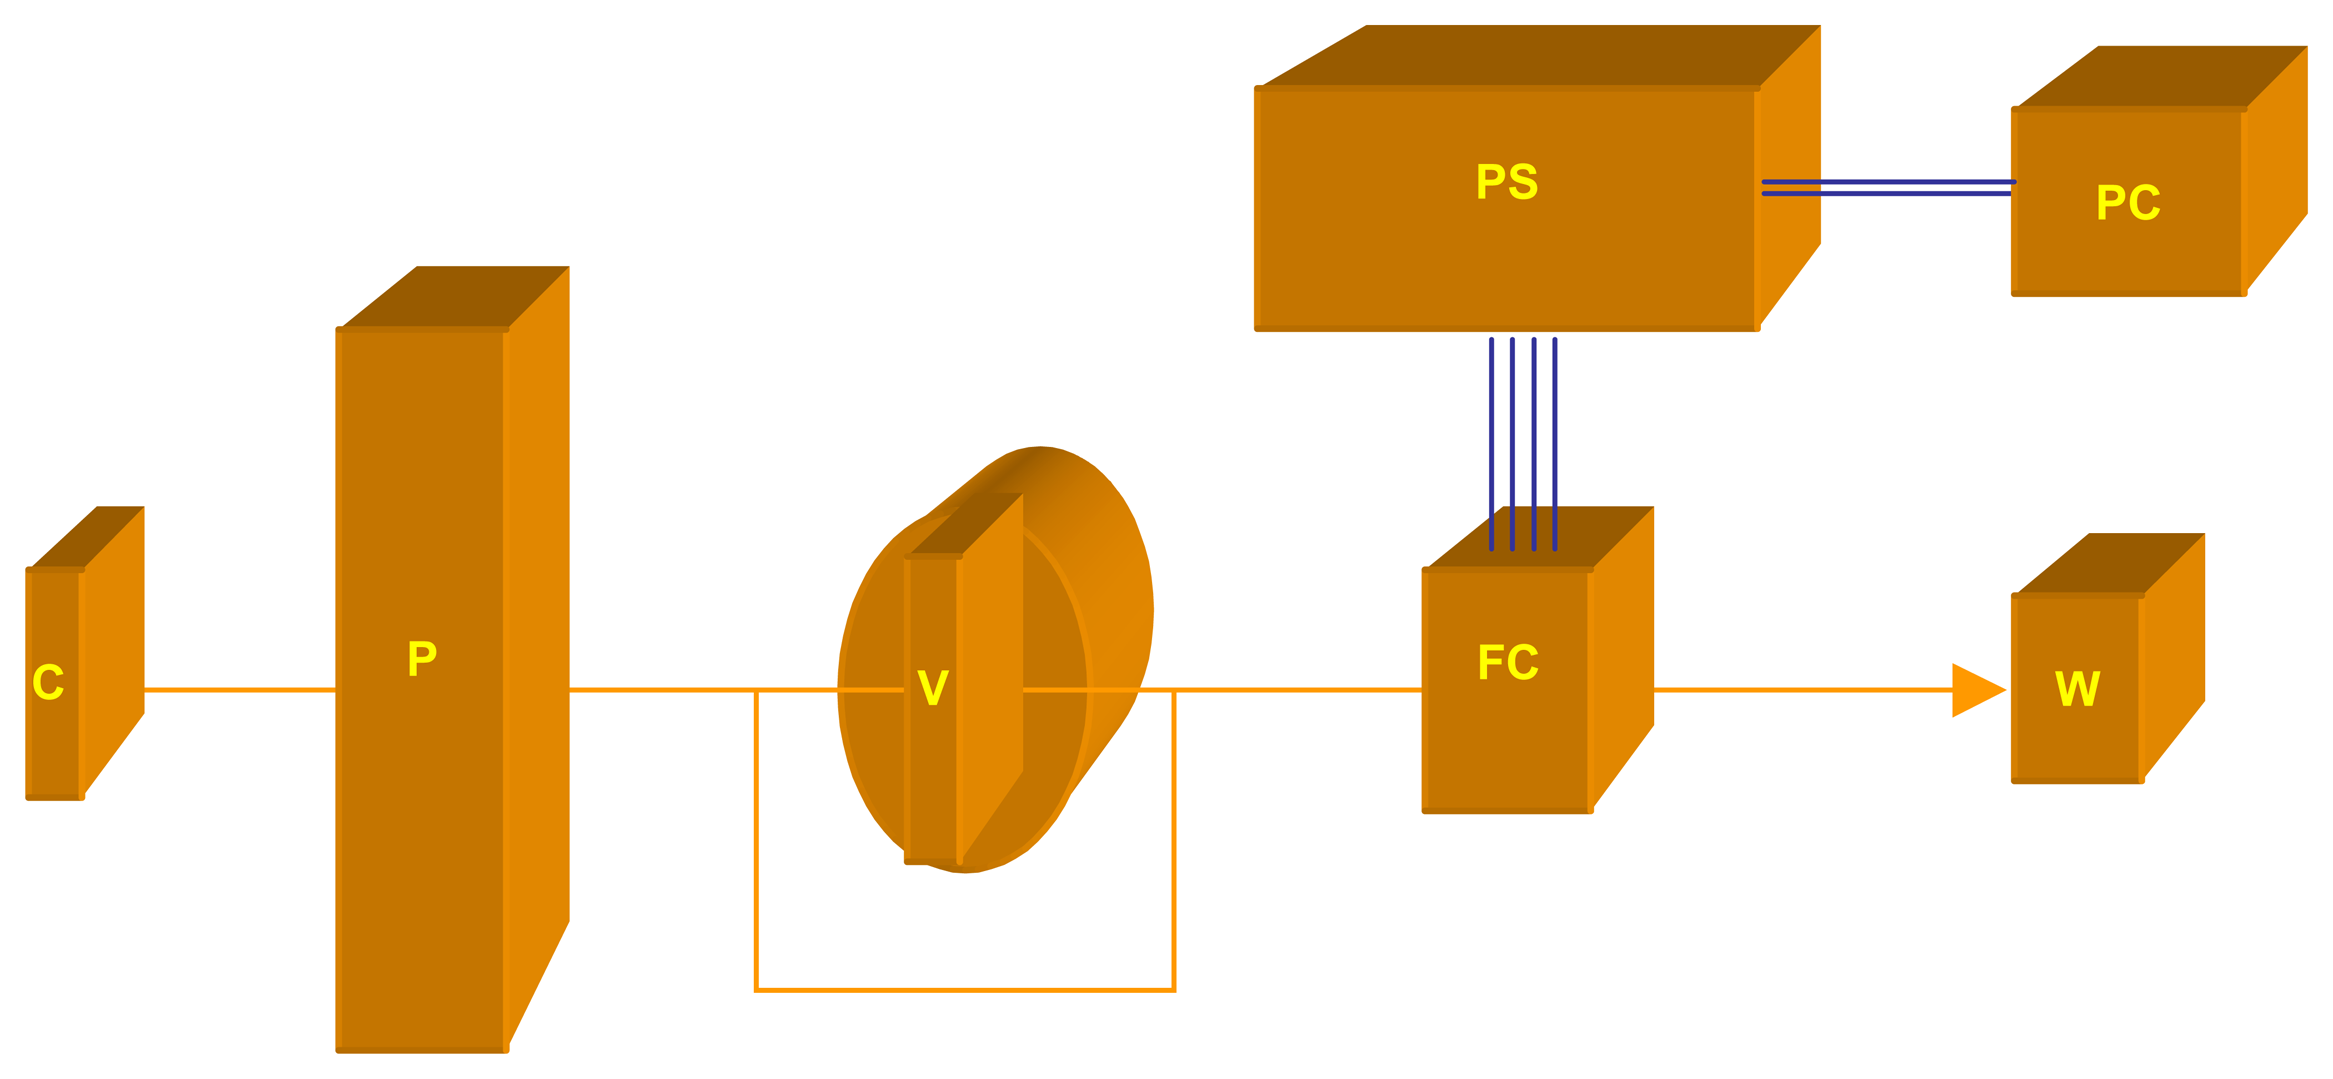
3.1. Apparatus
3.2. Reagents and solutions
3.3. Membrane preparation
3.4. Flow-injection pulse amperometric procedure for the determination of tacrine
Acknowledgments
References
- Vanýsek, P. Electrochemical processes at liquid interfaces. Anal. Chem. 1990, 62, A827–A835. [Google Scholar]
- Senda, M.; Kakiuchi, T.; Osaka, T. Electrochemistry at the interface between two immiscible electrolyte solutions. Electrochim. Acta 1991, 26, 253–262. [Google Scholar]
- Reymond, F.; Fermín, D.; Lee, H. J.; Girault, H.H. Electrochemistry at liquid/liquid interfaces: methodology and potential applications. Electrochim. Acta 2000, 45, 2647–2662. [Google Scholar]
- Samec, Z.; Samcova, E.; Girault, H.H. Ion amperometry at the interface between two immiscible electrolyte solutions in view of realizing the amperometric ion-selective electrode. Talanta 2004, 63, 21–32. [Google Scholar]
- Hundhammer, B.; Wilke, S. Investigation of ion transfer across the membrane stabilized interface of two immiscible electrolyte solutions. Part II. Analytical Applications. J. Electroanal. Chem. 1989, 266, 133–141. [Google Scholar]
- Wilke, S.; Franzke, H.; Müller, H. Simultaneous determination of nitrate and chloride by means of flow-injection amperometry at the membrane-stabilized water/nitrobenzene interface. Electrochim. Acta 1992, 26, 285–292. [Google Scholar]
- Wilke, S.; Picht, R. Impulse-response functions of flow-through detectors based on the membrane-stabilized liquid-liquid interface .1. Mathematical treatment. Anal. Chim. Acta 1994, 291, 41–52. [Google Scholar]
- Dunaeva, A.A.; Wilke, S.; Kolycheva, N.V.; Petrukhin, O.M.; Muller, H. Determination of alkali metal ions by flow-injection amperometry at the interface of two immiscible electrolyte solutions in the presence of dicyclohexyl-18-crown-6. Anal. Chem. 1999, 54, 438–441. [Google Scholar]
- Sawada, S.; Torii, H.; Osakai, T. Pulse amperometric detection of lithium in artificial serum using a flow injection system with a liquid/liquid-type ion-selective electrode. Anal. Chem. 1998, 70, 4286–4290. [Google Scholar]
- Hill, S.S.; Dryfe, R.A.W.; Roberts, E.P.L.; Fisher, A.C.; Yunus, K. Hydrodynamic study of ion transfer at the liquid/liquid interface: the channel flow cell. Anal. Chem. 2003, 75, 486–493. [Google Scholar]
- Marecek, V.; Janchenova, H.; Colombini, M.P. Charge-transfer across a polymer gel liquid interface a voltammetric detector for a flow system. J. Electroanal.Chem. 1987, 217, 213–219. [Google Scholar]
- Ji, H.; Wang, E. Flow-injection amperometric detection based on ion transfer across a water-solidified nitrobenzene interface for the determination of tetracycline and terramycin. Analyst 1988, 113, 1541–1543. [Google Scholar]
- Lee, H.J.; Girault, H.H. Amperometric ion detector for ion chromatography. Anal. Chem. 1988, 70, 4280–4285. [Google Scholar]
- Lee, H.J.; Pereira, C.M.; Silva, A.F.; Girault, H.H. Pulse amperometric detection of salt concentrations by flow injection analysis using ionodes. Anal. Chem. 2000, 72, 5562–5566. [Google Scholar]
- Sánchez-Pedreño, C.; Ortuño, J.; Hernández, J. Chronocoulometric flow-injection analysis with solvent polymeric membrane ion sensors. Anal. Chim. Acta 2002, 459, 11–17. [Google Scholar]
- Ortuño, J.A.; Hernandez, J.; Sanchez-Pedreño, C.N. Flow-injection amperometric detection with solvent polymeric membrane ion sensors. Electroanalysis 2004, 16, 827–831. [Google Scholar]
- Ortuño, J.A.; Sanchez-Pedreño, C.; Gil, A. Flow-injection pulse amperometric detection based on ion transfer across a water-plasticized polymeric membrane interface for the determination of verapamil. Anal. Chim. Acta 2005, 554, 172–176. [Google Scholar]
- Ortuño, J.A.; Sanchez-Pedreño, C.; Gil, A. Flow injection pulse amperometric detection based on ion transfer across a water-plasticized polymeric membrane interface for the determination of imipramine. Sens. Act. B: Chem. 2007, 122, 369–374. [Google Scholar]
- Armstrong, R.D.; Horvai, G. Properties of PVC based membranes used in ion-selective electrodes. Electrochim. Acta 1990, 35, 1–7. [Google Scholar]
- Aparicio, I.; Callejon, M.; Jimenez, J.C.; Bello, M.A.; Guiraúm, A. Electrochemical oxidation at carbon paste electrode of tacrineand 1-hydroxytacrine and differential pulse voltammetric determination of tacrine in pharmaceuticals and human urine. Analyst 2000, 125, 2016–2019. [Google Scholar]
- Bollo, S.; Munoz, L.; Nunez-Vergara, L.J.; Squella, J.A. Electrochemical characterization of Tacrine, Antialzheimer's disease drug, and its determination in pharmaceuticals. Electroanal. 2000, 12, 376–382. [Google Scholar]
- Aparicio, I.; Callejon, M.; Jimenez, J.C.; Bello, M.A.; Guiraúm, A. Spectrofluorimetric determination of tacrine in pharmaceuticals and spiked human serum. Analyst 1998, 123, 1575–1573. [Google Scholar]
- Hsu, R.S.; Dileo, E.M.; Chesson, S.M. High-performance liquid chromatography for the determination of tacrine and its metabolites in plasma. J. Chromatography 1990, 530, 170–176. [Google Scholar]
© 2007 by MDPI ( http://www.mdpi.org). Reproduction is permitted for noncommercial purposes.
Share and Cite
Ortuño, J.A.; Rueda, C. Flow-Injection Amperometric Determination of Tacrine based on Ion Transfer across a Water–Plasticized Polymeric Membrane Interface. Sensors 2007, 7, 1185-1192. https://doi.org/10.3390/s7071185
Ortuño JA, Rueda C. Flow-Injection Amperometric Determination of Tacrine based on Ion Transfer across a Water–Plasticized Polymeric Membrane Interface. Sensors. 2007; 7(7):1185-1192. https://doi.org/10.3390/s7071185
Chicago/Turabian StyleOrtuño, Joaquin A., and C. Rueda. 2007. "Flow-Injection Amperometric Determination of Tacrine based on Ion Transfer across a Water–Plasticized Polymeric Membrane Interface" Sensors 7, no. 7: 1185-1192. https://doi.org/10.3390/s7071185
APA StyleOrtuño, J. A., & Rueda, C. (2007). Flow-Injection Amperometric Determination of Tacrine based on Ion Transfer across a Water–Plasticized Polymeric Membrane Interface. Sensors, 7(7), 1185-1192. https://doi.org/10.3390/s7071185