Abstract
This study examines the temporal and spatial changes in land use as a consequence of rapid urban development in the city of Beijing. Using a combination of techniques of remote sensing and GIS, the study identifies a substantial loss of plain dryland and a phenomenal expansion of urban construction land over the recent decade. Geographically, there is a clear shifting of urban construction land from the inner city to the outskirts as a consequence of suburbanization. The outward expansion of the ring-road system is found to be one of the most important driving forces explaining the temporal and spatial pattern of land use change. The uneven distribution of population stands as another factor with significant correlation with land use change. The application of the techniques of remote sensing and GIS can enhance the precision and comparability of research on land use change and urban transformation in China.
1. Introduction
One of the most influential bodies of literature generated in recent decades has concerned the growth and transformation of “world cities”, “global cities”, and “global city-regions” as both the integral part and direct outcome of globalization [1-4]. Much scholarly attention has been devoted to identify the special characteristics of “world cities” or “global cities”, describe their processes of formation and reformation, and pinpoint the new challenges posed by these cities for research, planning, and policy making [5-12]. This burgeoning corpus of literature has thus far been derived predominantly from the experiences of a handful of cases in Europe and North America. Although many cities outside of Anglo-America have been included in the hierarchical formulation of the “world city system”, they are often treated in a selective and superficial manner without any in-depth elaboration on either their internal growth dynamics or external linkages.
In China, one of the largest developing countries recently re-integrated itself with the globalizing world, there is a large body of Chinese literature on the emergence of “world cities” (shijie chengshi) or “international cities” (guoji chengshi) in the country as a result of the intrusion of global forces. However, the Chinese documentation of world cities has been overwhelmingly concerned with what qualify a city to be a “world city” and hence what should be done to promote a Chinese city to the world city rank. Relatively little is understood about the fundamental processes of urban transformation unfolding in China in the current era of globalization and their manifestations in land use change both temporally and spatially.
The latest national population census conducted in China in 2000-the fifth of this kind ever conducted there since 1949-revealed a tremendous urban transformation with a scale and speed unparalleled anywhere else in the world [13-15]. In the last two decades since economic reforms, China's urban population increased dramatically from 170 million in 1978 to 456 million in 2000 and its share of the total population rose from a mere 18 percent to 36 percent. Chinese authorities anticipated that another 250 million people would move into cities and towns in the next 15 years so that half or more of its population would be urbanized. The census also revealed a trend of growing concentration of the urban population in a few large cities on the open and economically advanced eastern coast. Large cities such as Beijing, Shanghai, and Guangzhou have attracted a large number of migrants because of their advantageous positions as both centers of economic growth and destinations of foreign capital investments [16,17]. Although these Chinese cities are economically not as significant as such “world cities” as New York, London, and Tokyo, their continued expansion has posed great challenges not only for our theoretical understanding of urban transformation in a transitional planned economy but also for planning and policy making for the betterment of over one-fifth of humankind [13,18,19].
This study examines the internal dynamics of urban transformation in one of the largest cities in China. The purpose is to investigate in a finer scale the temporal and spatial pattern of change in land use as a consequence of accelerated economic development and urbanization. Our study is focused on the case of Beijing which is the national capital city with an urban economy undergoing profound structural and spatial changes in recent years as China continues to carry out its reforms and opening up programs. Although a case study of Beijing cannot be taken as representative of the general situation in the country, a detailed assessment of changes in land use over time and across space within a leading Chinese city can help generate important insights into the internal dynamics of urban transformation in a transitional socialist economy in the era of marketization and globalization.
The remainder of the paper is organized into three sections. We first introduce our subject of research in the current intellectual contexts of ongoing debates about the patterns and processes of Chinese urbanization. This is then followed by a clarification of our research design and methodology. The actual patterns of land use change in Beijing over time and across space are then identified and explained. The interactions between changes in land use and urban economic development are examined. We conclude the paper with a summary of the main findings of our research and a discussion of future research directions.
2. China's Urbanization and Land Use Change
In the extant literature of economic development in less developed countries, there is no shortage of documentation on the process of land use transformation as a consequence of economic growth and urbanization [20-23]. It is generally believed that urbanization has both direct and indirect impacts on land use transformation. Urban sprawl is one of the most noticeable effects of urbanization on land use. Less obvious but equally important are the distinct lifestyles of an urbanized society which create a wide range of market demands for land to be taken out of the agricultural stock for the developments of industrial facilities, transportation infrastructure, residential and recreational uses [22,24,25]. The central locations, higher population density, and agglomeration economies that characterize urban settlements give rise to a land value and land rent significantly higher than that of rural land and lead to a urban-rural differential that is sufficiently profitable to attract the conversion of land from rural to urban uses [26-30]. While the relationship between urbanization and land use change appears to be self-evident, the extent to which urbanization affects land use change and the ways in which they interact to yield various spatial forms in different political and geographic contexts remain poorly understood.
China, one of the largest developing countries undergoing profound economic and spatial transformation, has since the 1980s experienced accelerated urbanization subsequent to steady economic growth and structural change. Documentation of China's urbanization has thus far been focused on the growth and distribution of the Chinese population. Important effort has been made to clarify the Chinese definitions of “urban population”, estimate the actual magnitude of urbanization, and unfold the complex pattern of rural to urban migration [13,15,18,31-37]. Despite the massive development of land resulting from both urban sprawl and rural urbanization, the existing literature has thus far been revolved around two paralleled lines of scholarly enquiry.
On one hand, there is an established tradition of research on the patterns and processes of China's accelerated urbanization [35,38-43]. This tradition is not without debates, however. At least three different perspectives have characterized this line of research. First, there is the notion of large cities as the natural centers of economic growth, modernization, and urbanization. For years, the Chinese urbanization strategy has been to “strictly control the growth of large cities, rationally develop medium-sized cities, and vigorously promote the development of small cities and towns” [44,45]. As China shifted its development strategy from the rhetoric of egalitarianism into realistic promotion of comparative advantages, a growing number of scholars have become critical of the policy to control the expansion of large cities. Researchers within and outside China have suggested that large cities function as the most efficient center of growth or most powerful driving engine for China's national development because of the operation of such natural market forces as the economies of scale and agglomeration. Zhou and Yang, for instance, have compared industrial economic returns among Chinese cities of different size and found that large cities outperformed their smaller counterparts [46]. Similar findings have been presented in other studies [40,47,48]. Based on these findings, it has been contended that the existing Chinese urban development policy to control the expansion of large cities “is theoretically misinformed, historically inappropriate, and incorrect in practice” [48]. It was further advocated that “China should take full advantage of its large cities and pursue a large-city-led policy for its development” [48]. The arguments along this line of thinking may be conceptualized as a model of “urbanization from above” as the idea essentially represents an extension of the paradigm of “development from above” which advocates a growth pole or growth center strategy for the pursuit of efficient economic expansion [49].
The second perspective focuses on the revitalization and explosive growth of numerous small towns in China since institutional changes were made in 1978. Fei Xiaotong, a leading Chinese sociologist, has maintained that the numerous small towns have actually played a role of great significance in China's urbanization because they function as “storage reservoirs” to accommodate the enormous surplus rural laborers and prevent them from flooding the large cities that already suffered from congestion [50]. The phenomenal growth of China's small towns since the reforms has received great attention from scholars of the west [51,52]. The development of China's small towns has been understood as primarily a bottom-up phenomenon facilitated by such forces as the spontaneous marketization of the rural economy, dramatic growth of township and village enterprises (TVEs), reduced state involvements in local economic affairs, and relaxed restriction on village-town migration [45]. This pattern of urban transition based on small towns has been conceptualized as “urbanization from below” [53], an extension of the paradigm of “development from below” [54].
Finally, there is the model of metropolitanism or extended metropolis enthusiastically advocated by McGee and Ginsburg [55,56]. The models of “urbanization from above” and “urbanization from below” have both seen urban transition as a city-based process shaped by the forces of agglomeration economies and comparative advantages. McGee and Ginsburg have argued that the city-based model of urban transition may not be the only option for Asian urbanization. It has been observed that a distinct process of region-based urbanization has been taking place in the extended metropolitan regions of many Asian countries in recent years as a result of economic restructuring, influx of foreign capital investment, and revolutionary advances in telecommunication and transportation. This process has led to the formation of zones of intensive urban-rural mixture and interaction located in the area surrounding and between metropolitan centers. These extended metropolitan regions have become the locales where foreign investment and time-space compression are based. The emergence of these regions is believed to present a viable option and alternative for urban transition of many countries not only in Southeast Asia but also in East Asia and China as well [57,39].
In parallel to the ongoing research of Chinese urbanization that focused on the growth and structural change of China's population, another established line of scholarly enquiry concerns the causes and consequences of land use change in rural and urban China as a result of economic growth and structural change in recent decades [24,25,58-70]. Research on land use change in rural China has focused on the loss of cultivated land and has shown that, while much of the lost cultivated land was caused by structural changes within agriculture, a significant portion of the loss in cultivated land was due to the conversion of farmland to non-agricultural developmental purposes [24,25,61,71,72]. Studies of land use change in urban China have provided extensive documentation and evaluation of how institutional changes were made in many Chinese cities to commercialize the urban housing sector as a means to overcome the obstacles of housing provision in the reformed socialist economy [58-60,62-69]. Meanwhile, a large number of case studies have been undertaken to analyze land use change in individual Chinese cities such as Beijing, Shanghai, Guangzhou, and many others [73-80]. Missing in this literature is the logical connections between land use change in the urban and rural sectors. Since much of the land used for urban expansion has come from the expropriation of rural land, it will not be possible to fully understand the dynamics of land use change without a careful analysis of the conversion of land from the rural to urban sector.
Although considerable scholarly attempts have been made to document and interpret China's urbanization and land use change, the interrelationship between these two processes remains vague. Several important issues have yet to be carefully clarified and investigated. For instance, what is the cause-effect relationship between the dramatic expansion of Chinese metropolises and the structural change in land? What are the sources of the land used for urban expansion? How is the newly acquired land distributed in an expanding metropolis? What is the internal structure of land use in a Chinese metropolis and how has this structure changed as a result of urban expansion and land development? What are the forces operating behind the dramatic urban expansion and land development observed from many Chinese cities? What is the relationship between structural land use change and urban economic development? These are some of the important questions that have significant implications not only for our understanding of the processes of Chinese urbanization but also for planning and policy making in land management. The purpose of this study is to obtain insights into the interrelationship between urban growth and land use change in Chinese metropolises based on a case study of Beijing.
3. Data Sources and Research Methods
Beijing, China's capital city, serves as a significant case to understand the internal dynamics of urban transformation in a Chinese metropolis undergoing market reforms and globalization. The city covers a land area of 16,808 sq. km and is divided into 16 districts and 2 counties. In 2004, Beijing had a population of more than 14.5 million, of which 3.2 million people were found in the peri-urban districts and counties of the metropolitan area. The core of the city includes 4 districts with about 87.1 sq. km and a high population density of 27506 persons/sq. km. In the peri-urban area of Beijing the population density is about 161 persons/sq. km. Dramatic economic growth and structural change over the recent two decades have firmly placed Beijing on a path of accelerated and sustained urbanization with an average annual increase of 2.48 % in its level of urbanization. At the same time, the arable land in the Beijing metropolitan region reduced from 413000 ha in 1990 to 26000 ha in 2003.
There are 18 districts and counties in Beijing (Figure 1). The central city includes 4 districts, namely Dongcheng, Xicheng, Chongwen and Xuanwu. The inner suburb contains 4 districts, Chaoyang, Fengtai, Shijingshan and Haidian. The outer suburb includes the remaining 8 districts and 2 counties, which are Mentougou, Fangshan, Tongzhou, Shunyi, Changping, Daxing, Pinggu, Huairou, Miyun and Yanqing. The statistical data for 18 districts and counties were collected through office visits to these districts' statistical bureaus and copied from the internal data sets. Due to the variations in the data they collected and the permissions we got, only nine (9) data items were consistent across the 18 districts and counties in 1990 and 2000. These variables are, total increased staff salary (SALA), total increased retail sales (RETA), total increased fixed capital investment (FCIN), total employee (EMPL), total industrial output value (INDU), total revenue tax from town and village enterprises (TVTAX), total population (TPOP), urban population (UPOP), and actually utilized foreign investment (FINV).
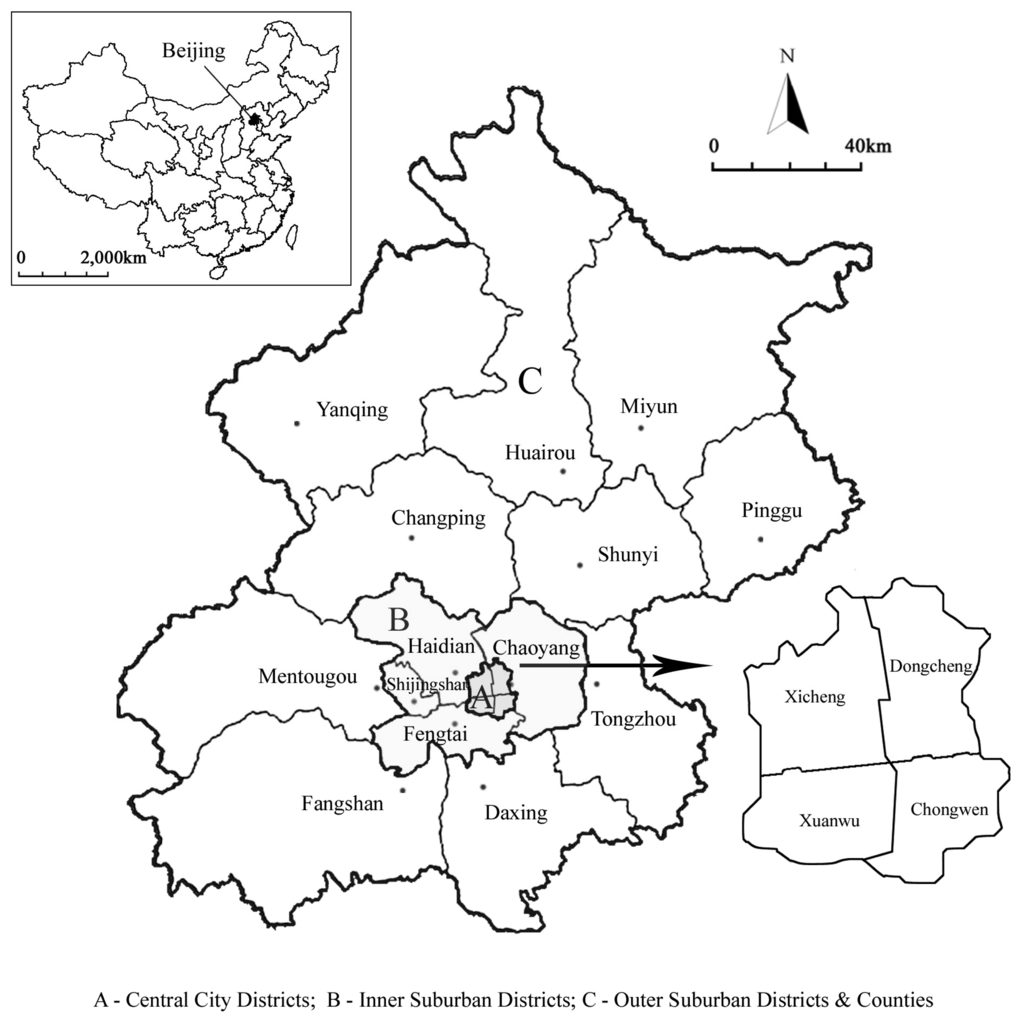
Figure 1.
Administrative Structure of Beijing City.
The vector data of LUCC was obtained through detection analysis of Landsat Thematic Mapper (TM) images in 1990, and 2000. The geometric registration was done using the quadratic method. The specification for image to image registration is 0.3 pixel in both directions. Anderson's classification system [81] was employed as a starting point and was adjusted according to the characteristics of the study area. The city land-use vector datasets were created by interpreting TM images assisted with the 1:50,000 topography maps. During the interpreting process, topography, geomorphology, vegetation, precipitation and temperature datasets were used as the ancillary data. Erdas Imagine and ArcGIS software were used in image classification.
There are many methods for detecting land cover changes available in the literature. The post-classification image comparison method was adopted in this study to achieve a better classification result. Before interpreting the images, field trips were conducted to train the image analysts. The 2000 Landsat images were classified using an unsupervised classification (Maximum Likelyhood method) first, and then these classes were merged into the classification system adopted for this study based on the field training sets (Table 1). The TM images in 2000 were used to interpret the dynamic change vector data by comparing with the vector data derived from interpreting TM images in 1990. The quality control was executed by checking up the identities and the boundaries of the land use patches to decrease incidences of errors. According to the check-up result, the classification accuracy of the changes of land use-cover patches is 97.6% [82,83]. The wrong identities of land use patches were all corrected.

Table 1.
Land Use Classification System and Code
The yearly change rates of land uses as well as economic growth indicators were computed from the observed values between 1990 - 2000, based on the equation,
where Ri is the increase rate of the observed value of a land use or socio-economic indicator; V1 the value of an indicator i at the date t1; V2 the value of the indicator i at the date t2; n the difference of years between the two dates (10 years between 1990 – 2000 in this case study).
Tempo-spatial changes of land uses were detected through GIS overlay analysis and the cross-tabulation method with ArcGIS 9.1. Several change matrices were produced to extract quantitative data of the overall land use changes, gains and losses, as well as those in each land use category [71]. A series of spatial configurations were processed systematically to investigate pattern changes of land uses during the 10 years period, on the basis of the classic theories of urban morphology [84-88] and the recent concepts of urban sprawl and fringe development [89,90]. In particularly we partitioned the study area in such ways that urban growth pattern changes could be discerned by referring to Burgess' concentric zone theory (urban pattern as concentric rings of different land use types with a central business district in the middle); Hoyt's sector theory (concentric zone pattern modified by transportation networks), and Harris and Ullman's multiple nuclei theory (patchy urban pattern formed by multiple centers of specialized land use activities).
- Firstly, we partition Metropolitan Beijing into three circular (concentric) rings from the perspective of suburban growth (called “the suburban rings structure”).
- Secondly, we revisit the concentric urban growth structure from the angle of transportation network development. In other words, we divide Metropolitan Beijing into five circular rings using four vital circling-city highway networks (i.e., The Third Ring, The Fourth Ring, The Fifth Ring, and The Sixth Ring), which signifies important stages of urban expansion in Beijing (Figure 2). This partition is called “the transportation rings structure.”
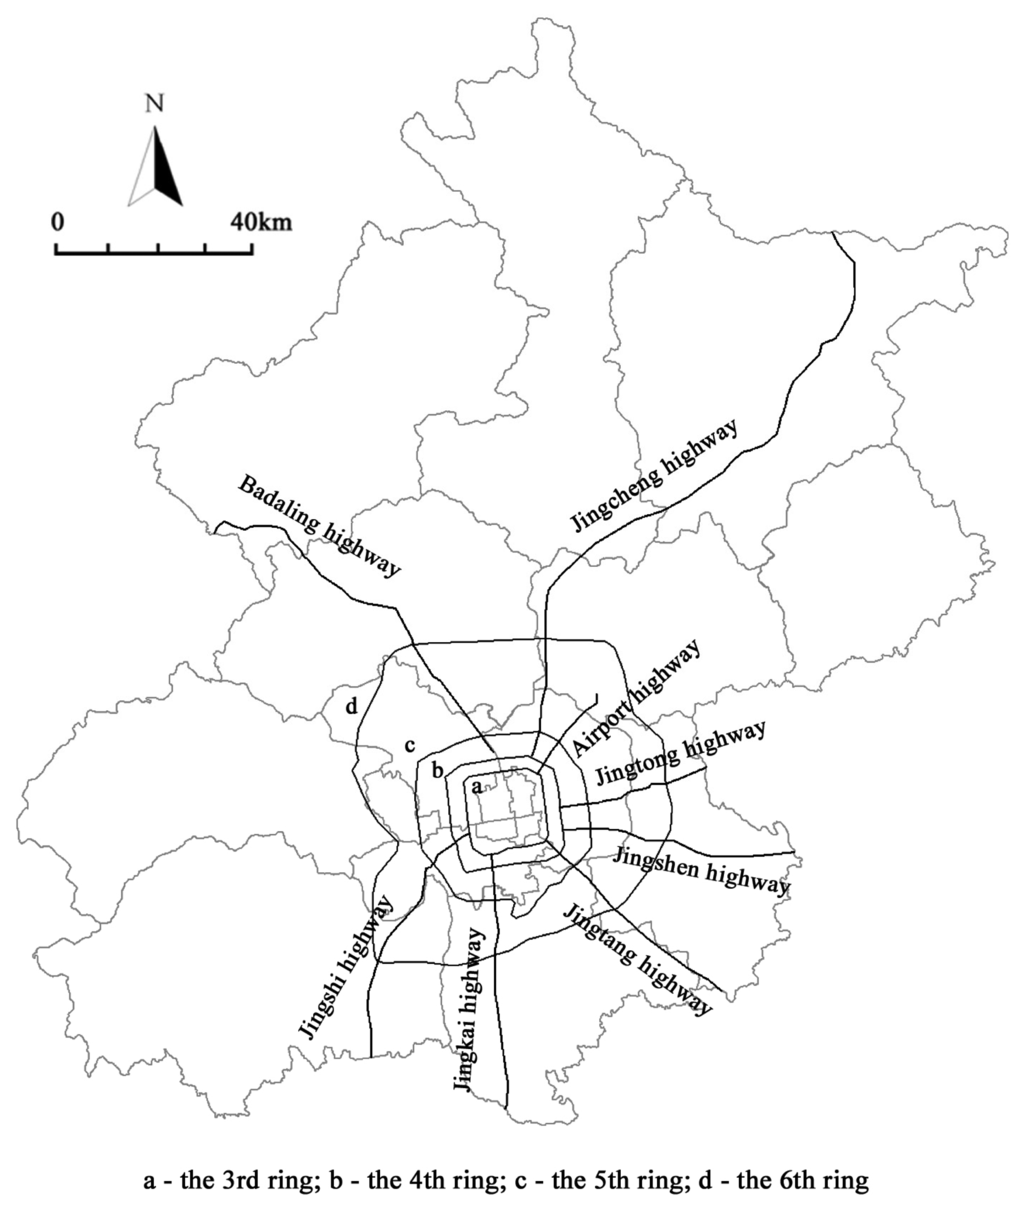 Figure 2. Transportation Networks in Beijing.
 - Thirdly, we examine land use changes along major highways that traverse the city from either N-S or E-W direction, which is called “the transportation zones structure.”
- Fourthly, we investigate land use changes around major urban centers within suburban districts and counties to identify urban growth from the approach of multi-center development, called “the multi-nuclei structure.”
- Finally, the LUCC data are partitioned at the geography of districts and counties (18 in total) and linked with the nine economic indicators to conduct correlation and regression analyses to explore the economic driving forces behind LUCC.
4. Structural Patterns of Land Use Changes in Beijing
4.1. Land use changes within the suburban ring structures
Beijing land uses in 1990 and 2000 are mapped in Figures 3 and 4, respectively. In the northern and western portions, mountains and hilly areas are predominant, and land uses are primarily forest and grassland. Croplands are seen in the lower northeast corner and scattered along the valleys. In the southeastern plains, croplands and urban development are the primary land uses. Considering the city as whole, the forest land (accounting to 45%), the cropland (30%), and the constructed land (15%) are three major land uses in 2000 (Table 2).
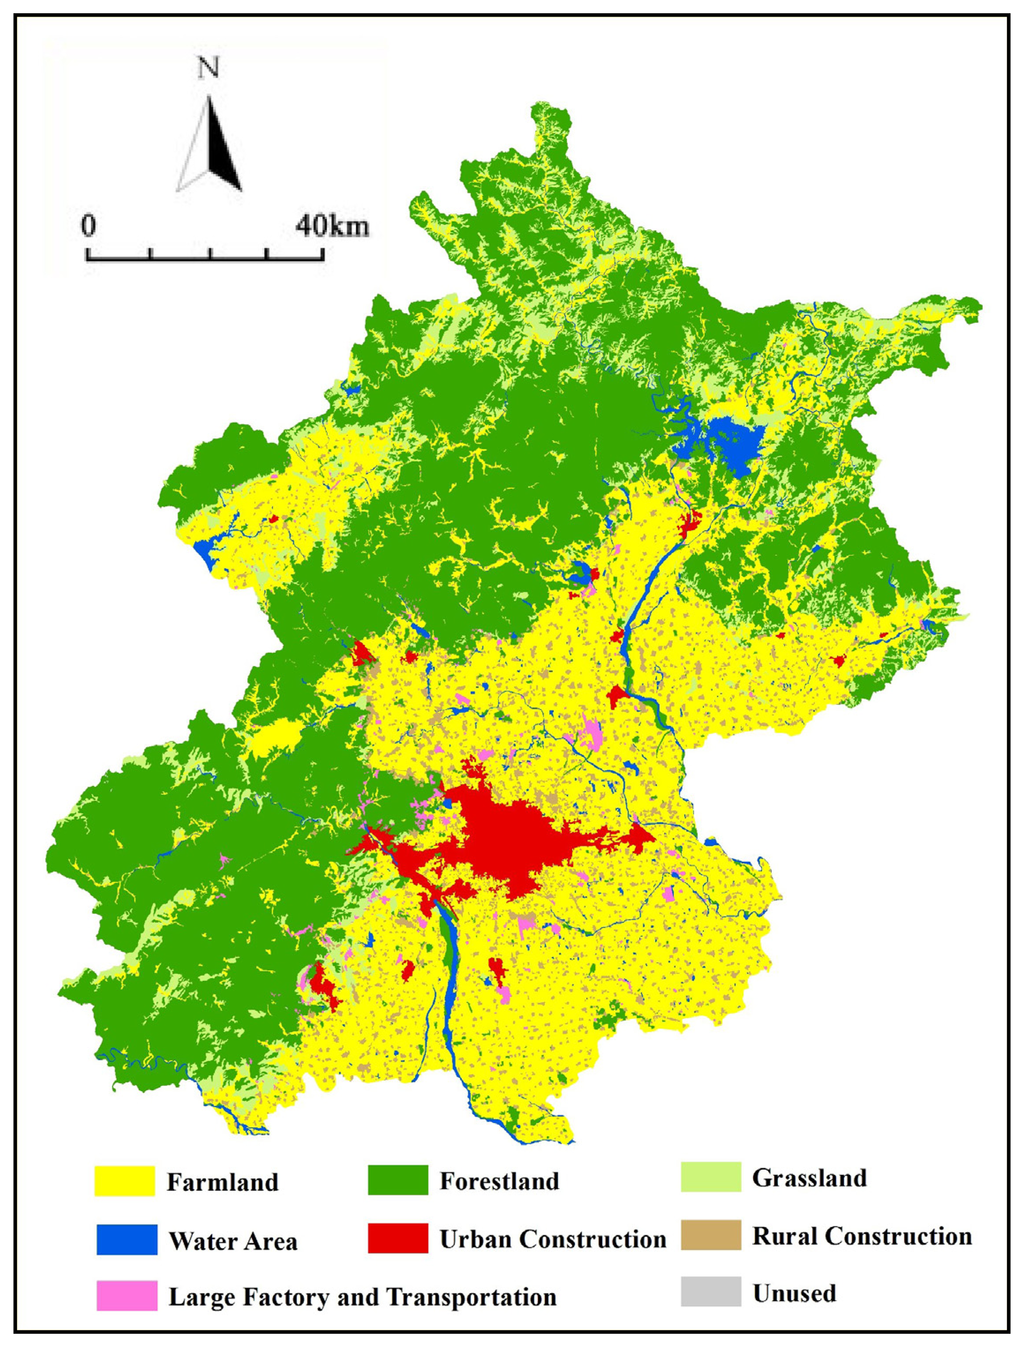
Figure 3.
Beijing Land Use Map in 1990.
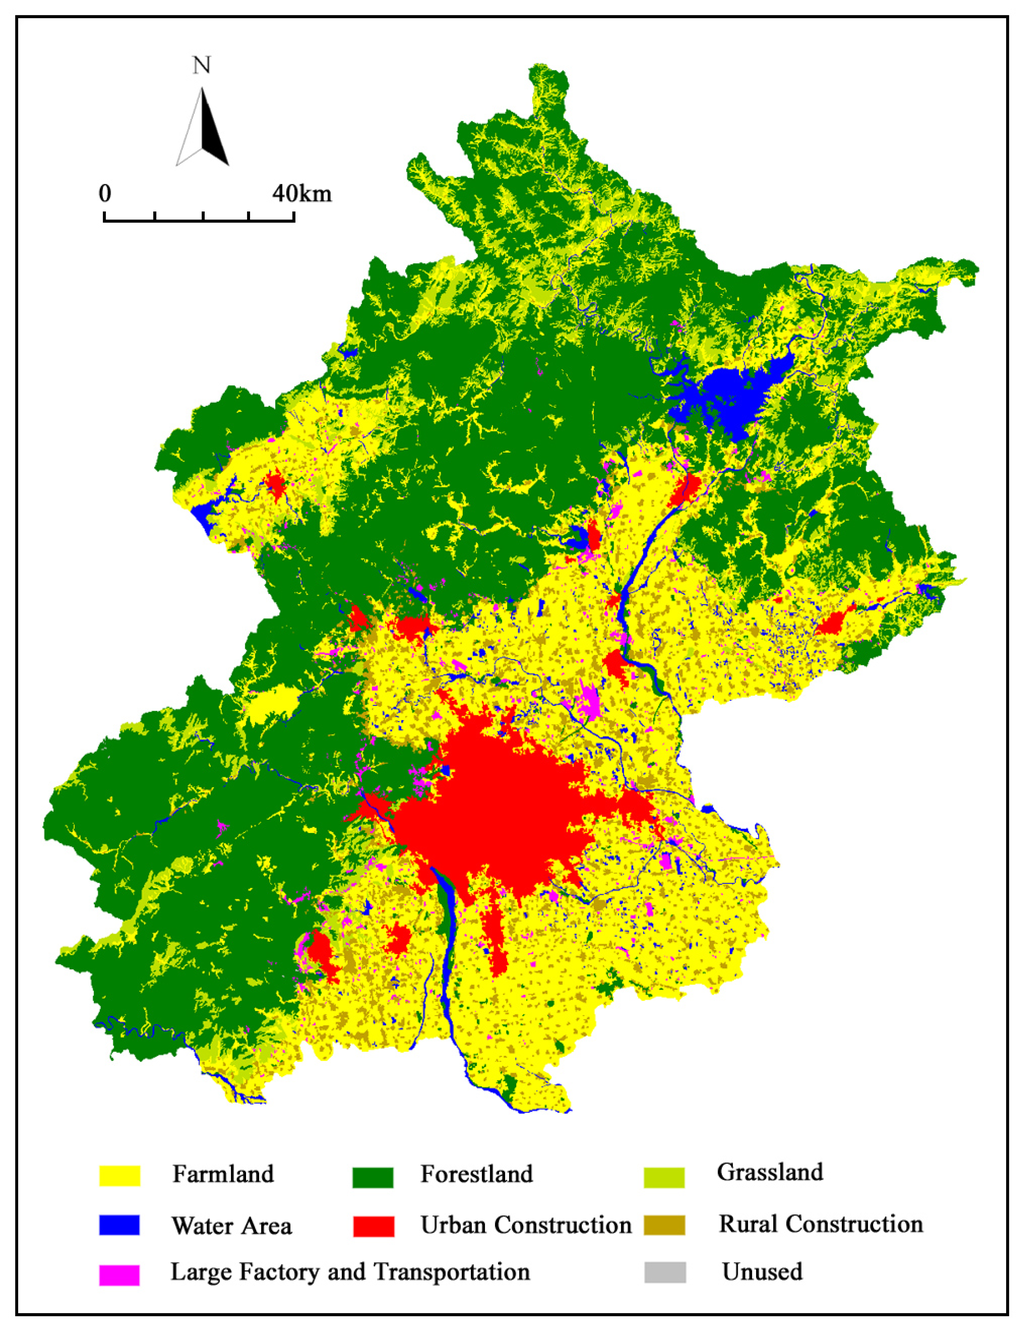
Figure 4.
Beijing Land Use Map in 2000.
Table 2.
Land use by categories and by suburban rings in 2000 (hundred hectare)*
The suburban structure of Beijing consists of three rings, Central City Districts, Inner Suburban Districts, and Outer Suburban Districts and Counties (Figure 1). The central city is apparently small and only accounts 0.57% of its total land area, but is fully developed as urban construction (Table 2). The inner suburban is still small in terms of total land area (7.87%), but around 60% of its land is the built area. The remaining primarily consists of cropland and forest. The outer suburban occupies the largest portion of land (91.56%), where forest and cropland are far important than construction and grassland in terms of size. The weights of various land uses in the outer suburban determine the overall city land use distributions due to its overwhelming predominance (Figure 5).
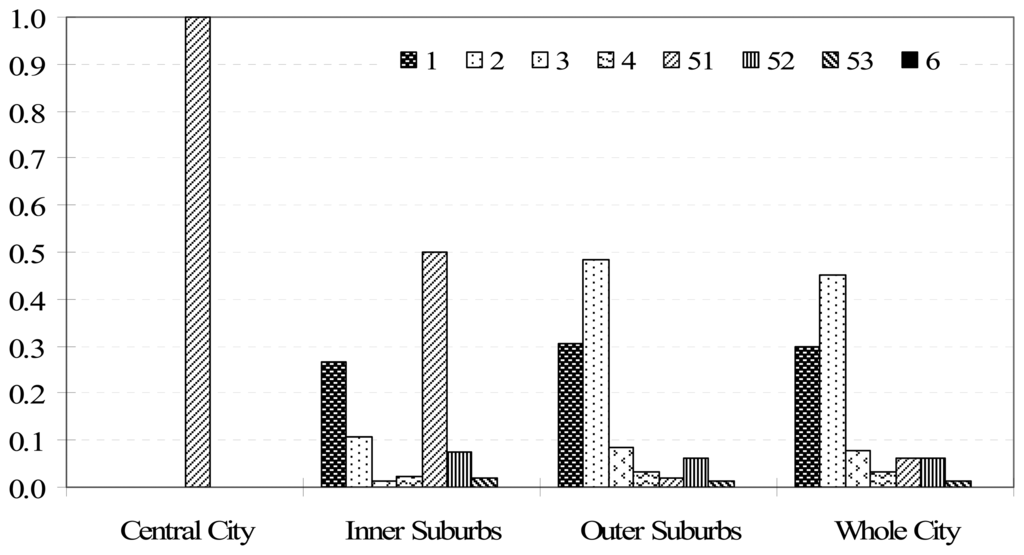
Figure 5.
Beijing Land Use Structures by Suburbs in 2000.
Cross tabulations of land use changes over the suburb rings were presented in Table 3. Focuses were placed on looking at the absolute values of change larger than 200HH first and then larger than 100HH, and at the conversion rates higher than 1.0. Plain dryland suffered the biggest loss of 845.00HH. The inner suburbs lost 280.30HH from its initial 485.93HH in 1990. The loss of plain drayland was more than 57.68% and the yearly conversion rate was -8.24. The outer suburbs witnessed a decrease of 563.60HH plain dryland with a conversation rate of -1.41. The second biggest change was urban construction land, which increased by 550.01HH with a conversion rate of 7.88. The inner suburbs had an increase of 354.25HH and this increase surpassed the existing urban construction land in 1990, 285.60HH by 68.65HH. The third biggest change was other forest land (including orchard), which saw an increase of 216.32HH and a conversion rate of 4.67. The increase of other forest land mainly occurred in the outer suburbs. The primary reason of forest increase was the campaign of planting trees and nurturing forests and preventing sandstorm and stabilizing sand dunes [91].
Table 3.
Cross tabulations of land use changes in Beijing between 1990-2000 (hundred hectares - HH)
Moreover, rural construction land and large factory and transportation land were moving toward outskirts (Table 3). The inner suburbs registered losses of both land uses, while the outer suburbs recorded significant increases. On the other hand, hilly dryland saw losses in both inner and outer suburbs.
Another interesting finding was the reservoir and ponds witnessed noticeable increases in both inner and outer suburbs. Water shortage has been a serious concern in North China and particularly in Beijing area. It seems that more and more land was converted to man-made lakes and ponds accompanied with luxury vacation villages although no rigorous validation was done by the authors [92]. A related land use change was shoal, which showed an increase in the inner suburbs and a decrease in the outer suburbs. Both increase in the inner suburbs and decrease in the outer suburbs were often linked with the construction of vacation villages and recreation parks. This provided ancillary evidence that water body (wetland) was a scarce land resource in Beijing, which might be excessively utilized in an area where fresh water supply was in a severe shortage [93].
In summary, among various types of land uses, plain dryland, urban construction, other forest and orchard, rural construction, reservoir and ponds, large factory and transportation, hilly dryland, loose forest, highly-covered grassland, and shoal illustrated significant changes in areas, or conversion rates. Therefore, the conversion characteristics of these land uses in terms of which land types they were converted from and were changing to were further analyzed below (Table 4).
Table 4.
Conversion Matrices of Major Land Use Types in 1990-2000 (hundred hectare)
During 1990-2000, urban construction saw no decrease but only witnessed conversions from other land sources e.g. 384.55 HH from plain dryland (indicating cropland losses), and 119.96 HH from rural constructions (revealing the annexation of rural villages into urban areas). Secondly, plain dryland suffered the biggest lose. In addition to its conversion of 384.55 HH to urban construction, it was converted 260.3 HH to rural construction, 75.89 HH to reservoir and pond, 68.62 HH to other forest and orchard, and 64.62 HH to lager factory, mining and transportation. The other two big losers are hilly dryland and highly-covered grassland. Hilly dryland was mainly converted to other forest and orchard, and rural construction, while highly-covered grassland was converted to a wide arrange of land uses though its conversions to reservoir and pond, and other forest and orchard were significant.
4.2. Land use changes by the transportation ring structures
The road system in Beijing is a good illustration of a metropolitan transportation network, with concentric ring-roads and diagonal and traversing (east-west or north-south) throughways as its arteries (Figure 2). The road around the Forbidden City is named the first ring, and the ring-roads beyond are the second, third, fourth, fifth, and sixth ring-roads in order of the radial distance from the center of the city. The changes in land use between these road rings are analyzed as follows (Table 5).
Table 5.
Land use changes between major road-rings in Beijing, 1990-2000 (hundred hectare).
Land use within the third ring is solid urban construction in 2000 though there were some cropland and rural residences in 1990. The change trends between the third ring and the fourth ring and between the fourth ring and the fifth ring are quite similar. Urban construction was significantly increased. Rural construction and large factory, mining and transportation were merging with urban construction. Cropland and natural land (forest and grassland) were disappearing
The difference between these circular belts is that the conversion rates between the third ring and the fourth ring were much higher than those between the fourth and fifth ring. Forest, rural residence, and large factory, mining and transportation between the third and the forth rings were totally replaced by urban construction. However these land uses were still present between the fourth and the fifth rings though they were dramatically decreased.
The change trends beyond the fifth ring were different from those within the fifth ring. Cropland and grassland beyond the fifth ring witnessed loses. However, the land uses of forest and water body were increasing. The land uses of rural construction and large factory, mining and transportation increased too in addition to the significant increase of urban construction. Furthermore, the conversion rates were differentiated by the sixth ring. The decrease rates of cropland and grassland and the increase rate of urban construction were much higher within the sixth ring than those beyond the sixth ring. On the other hand, the increase rates of rural construction and large factory, mining and transportation were much higher beyond the sixth ring than those inside the sixth ring.
4.3. Structural land use changes along the transportation zones
Another important characteristic of Beijing's transportation network is its traversing and diagonal throughways, which are focal linear attractors stimulating land use changes. We chose Badaling Highway (Figure 2) as an illustration. Four buffer belts (2km, 2-4km, 4-6km, and 6-8km) between the 5th Ring-road and the 6th Ring-road were created (Figure 6). The land use changes over these buffered belts were reported in Table 6 and depicted in Figure 7.
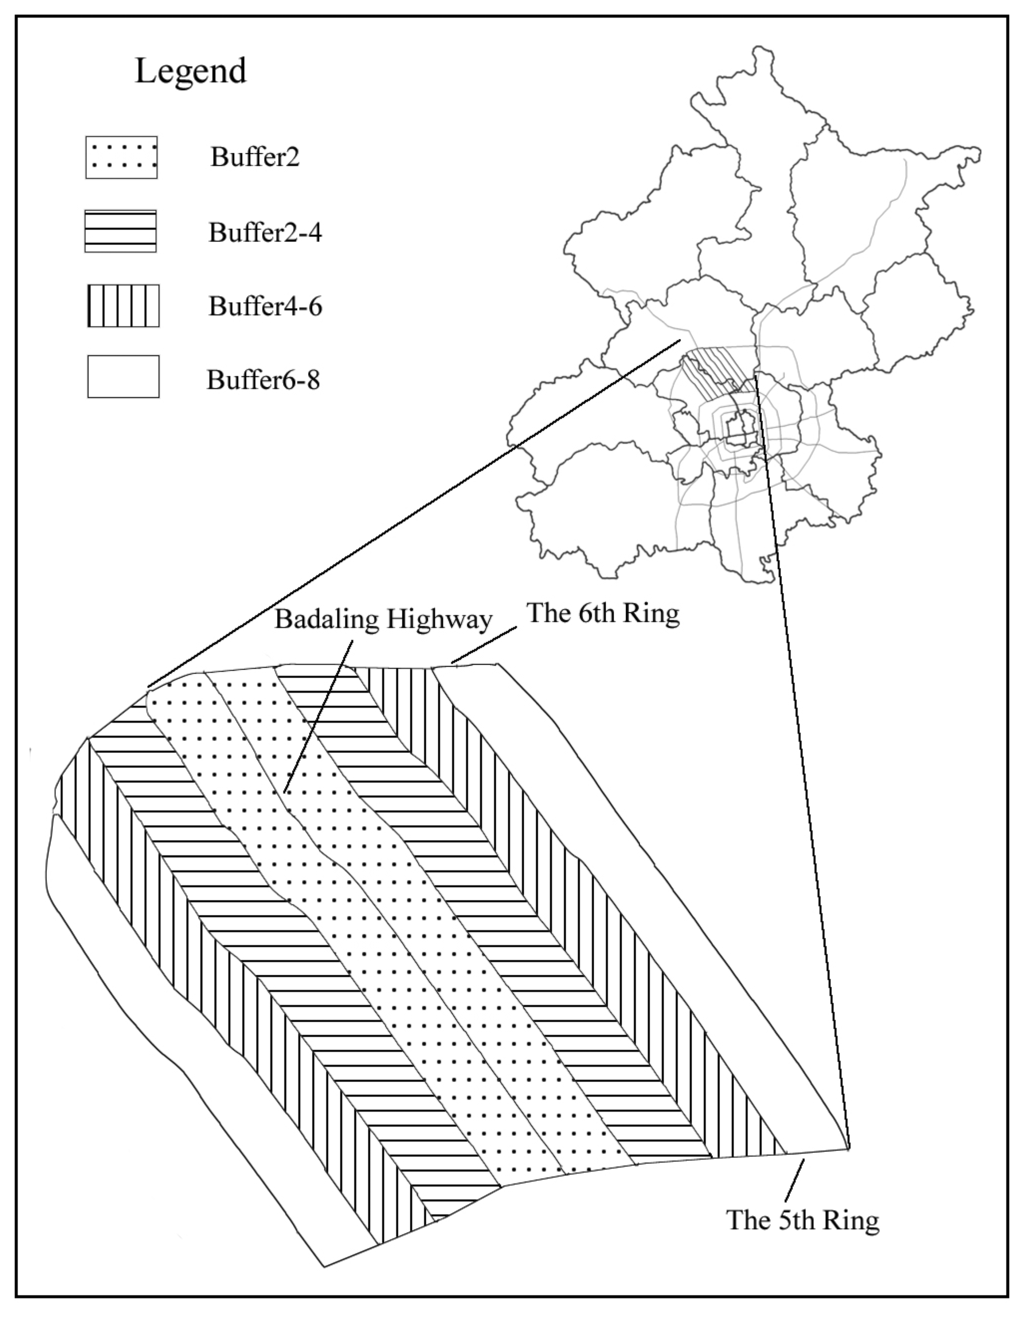
Figure 6.
The Study Area (Buffered Belts) along Badaling Highway.
Table 6.
Land use changes in the buffered belts along Badaling Highway*, 1990-2000 (hundred hectare, %)
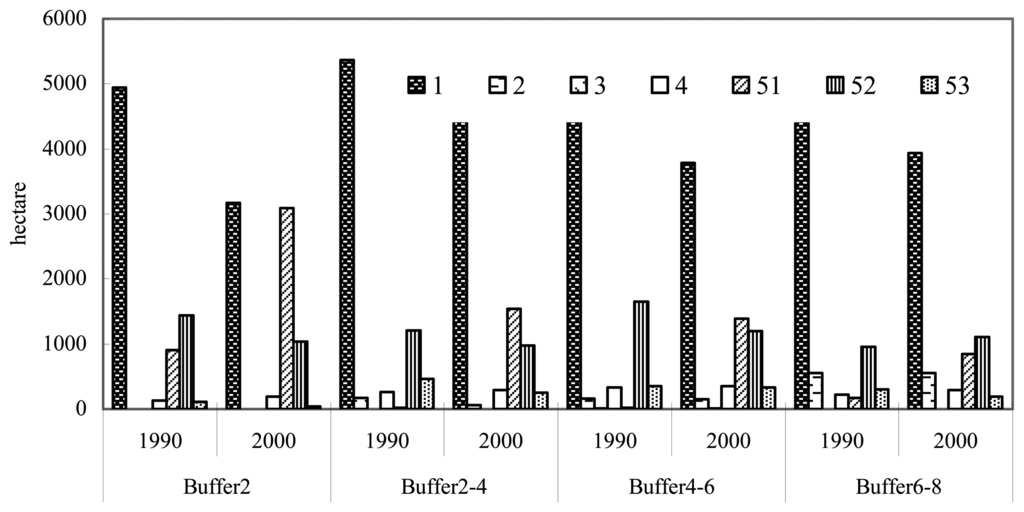
Figure 7.
Land use changes along the buffered belts from Badaling Highway.
Badaling Highway acted as an attractor for urban development and its influencing power diminished outwards. For instance, the absolute areas of urban construction increase and the loses for cropland, rural construction and large factory, mining and transportation were highest within the 2 kmbuffer. These trends were obvious in the 2-4 km and 4-6 km buffers. However, the same trends were significantly weakened in the 6-8 buffers. As Figure 7 indicates, the areas of urban construction over these four buffering zones were decreasing outwards.
4.4. Structural land use changes around multi-nuclei
There are 18 districts and counties in Beijing. Excluding 4 districts in the central city, 14 of them are suburban districts and counties. Each one of them has several urbanized business or residence centers and one primary center, where the district or county government is situated. In general these suburban urbanipzed centers are hot spots where rapid urbanization and land use changes were observed. Moreover, some of these suburban centers (not necessarily district or county government seats) witnessed dramatic development due to unique geographic locations. There suburban centers were selected as the multi-nuclei of stimulating urban growth in Beijing. Urban land use changes in these hot spots were to be analyzed in this section.
Urban construction increase and cropland decrease were two key indices that we used to examine land use changes around the district and county centers. First, three district centers in the inner suburban, Fengtai, Shijingshan and Haidian, were almost developed into urban districts (Table 7). Most of cropland and rural construction in these districts were converted to urban construction. Second, the northwestern districts and counties witnessed high urban conversion rates (Yanqing 19.75%, Changping 15.57%, and Huairou 11.65%). Third, the southern districts and counties, Fangshan and Daxing saw high conversion rates too, 11.40% and 8.31%, respectively. Fourth, the conversion rate in the eastern district, Pinggu, was very high, amounting to 14.6%.
Table 7.
Land Use Changes around Business Centers of Beijing Suburban Districts and Counties, 1990 - 2000 (hundred hectare, %)
5. Interactions Between Land Use Changes and Economic Development
Five districts (Chaoyang, Chongwen, Dongcheng, Xicheng, and Xuanwu) out of the eighteen districts and counties have been turned into solid urban built-up areas since 1990. Therefore, only remaining thirteen districts and counties were examined in terms of the interactions between land use changes and socioeconomic driving forces. In addition to the nine data items discussed above (SALA, RETA, FCIN, EMPL, INDU, TVTAX, TPOP, UPOP, and FINV), two variables that were derived from the image classification were added to reflect the changes of urban construction land (ULND), and cropland (CLND). The annual change rates between 1990 and 2000 for all eleven variables were computed based on Equation 1, and the rates were used to calculate the Pearson correlations (Table 8) and regression analysis (Tables 9 and 10).
Table 8.
Correlation Analysis of Land Use Changes and Socioeconomic Driving Forces
Table 9.
Summary of the Regression Model with the Explanatory Variable, UPOP
Table 10.
Coefficients for the Regression Model with UPOP
First, the change rate of ULND correlates highly and significantly with the growth rates of UPOP, TPOP, FCIN, and RETA in a descending order. This finding reveals that the expansion of urban land is primarily related to population growth and urban population increase in particular. Urban growth is also closely linked with the increase of the fixed capital investment. In general the growth of urban construction does not necessarily correlate with these indices that reflect economic development or performance, except the retail sale (RETA). Second, UPOP and FCIN were highly correlated with each other, and also with INDU, RETA, EMPL, and TPOP in addition to ULND. This finding indicates that there existed high multicollinearity among these descriptive variables, which might affect the applicability of regression analysis under such a circumstance. As a matter of fact, no meaningful regression analysis results could be generated for the dependent variable, the annual growth rate of ULND. The strong and positive correlations for ULND with these indicators did not guarantee causal relationships. After careful examining these variables, we found ULND, FCIN, INDU and TPOP displayed clustered spatial patterns. Urban expansion and these key related economic factors were unevenly distributed over the thirteen suburban districts and counties (a very small sample size), which confounded a causal relationship, though the growth rate of ULND was highly correlated with the indicators of population growth (TPOP) and fixed capital investment (FCIN).
Moreover, urban population growth was a universal phenomenon. We found out a significant regression over the thirteen suburban districts and counties. As Tables 9 and 10 illustrate, the annual increase of urban population was relatively well explained with the increases of total retail sale and staff employment (around 80% since the adjusted R square was 0.793). This finding provides an auxiliary evidence that the increase of urban population was across all suburban districts and counties and stimulated a region wide growth of retail sale and employment opportunity.
Another interesting finding was that the change rate of CLND showed no significant correlations with any socioeconomic variables. Moreover, CLND was even not correlated with the change of ULND, which was a surprise to our normal understanding that agricultural land loss was strongly related to rapid urban expansion and economic development. Our analysis indicated that the weak association between CLND and other variables was due to the disproportional distributions of cropland losses over the thirteen administrative districts and counties.
6. Conclusions and Discussions
Deepened market reforms and increased globalization have brought about profound structural changes not only to the Chinese economy but also to its urban landscape. The growth and structural change of the Chinese economy have captured a global attention. Increased urbanization as a result of accelerated economic growth has also been extensively documented and interpreted. Thus far, scholarly attempts to understand the causes and consequences of Chinese urbanization have concerned primarily the ongoing processes of rural-urban migration, the re-organization of the settlement systems, and suburbanization as well as rural-urban integration in leading economic regions of the country. Studies of the internal structural changes of Chinese cities have tended to focus on the sectorial and spatial redistribution of urban economic activities and the population including migrants. The changing inter-relationship between urban development and land use change in Chinese cities remains less explored partly because of the lack of systematic data at a fine scale and partly because of the complex nature of the subject matter.
This study examines the temporal and spatial pattern of land use change as a consequence of urban economic development using the Beijing metropolis as a case. Using a combination of the techniques of remote sensing and GIS, the study clearly identifies a temporal pattern of land use change within the city of Beijing characterized by a substantial loss of plain dryland and a phenomenal expansion of urban construction land. Geographically, there are clear spatial patterns which are crafted by the policies from the macro scale and by the urban economics from the meso-micro levels. Metropolitan-wide, the outer suburbs (beyond the six ring-road) have become greener and wetter due to the reforestation efforts to prevent sand storms in springs that have frequently intruded Beijing, though rural construction has been expanded significantly in this area. Special land uses such as industrial, transportation, and large factories have been moving from the inner suburbs toward the outskirts because of the policy of recovering blue skies in Beijing. Moreover, spatial disparities in urbanization have been apparent. The northwestern and southern suburban districts and counties observed more growth than other counterparts. On the contrary, land use changes in the inner suburbs have been one directional. Natural lands and farming land have been converted to urban land. Their conversion rates have been rapidly increasing and the ecologic outcomes from the losses of these natural and farming lands have been worrying. It should be wise to adopt a planned development approach as that has been practiced in the outer suburbs.
Our study has also highlighted the close association between land use change and the outward expansion of the urban ring road system, which is in common with many other large cities in the country. Reducing traffic jams and promoting economic viability through automobile industries pushed the city boundaries outward by constructing new city ring-roads. The inauguration of each ring-road marked “a big jump of city territory” and the duration of each jump was shortened and the distance of each jump was dramatically increased. Moreover, each ring-road and other major transportation arteries themselves have become the attractors of new growth. From these arteries expanding outwards, a micro-scale land use pattern has been formed, transforming from urban to suburban industrial, rural residential and then to farming land.
The most controversial finding is about the driving forces behind rapid urban expansion. Apparently the Beijing case revealed that population growth, the central government controlled fixed capital investment (FCIN), and population related retail were the primary factors that have explained urban land changes, rather than other economic indicators. Statistically it could be interpreted that the uneven distribution of economic activities has stood out as a compounding factor to obscure a causal relationship between urban expansion and economic development. However, this finding could easily lead people to ask more questions. For instance, is rapid urban growth in Beijing actually simulated by its economic development? Is urban development in Beijing actually reflecting a market driven economy or a governmental intervention? Is it healthy and sustainable to expedite urban growth through encouraging rural-urban migration and increasing governmental investment?
Nevertheless, the case of Beijing cannot be taken to draw generalizations applicable to the entire nation. What has distinguished Beijing is its functioning as the capital city of the nation with a high concentration of administrative facilities and subsidiaries of multinational corporations. The city is situated in a flat plain with an urban infrastructure planned and built under the influence of the former Soviet Union. This unique political and geographic situation has greatly facilitated the outward expansion of urban land use in a speed and scale more significant than what has occurred in other Chinese cities. Future studies are needed to analyze the inter-relationship between land use change and urban economic development in other Chinese cities under different administrative, demographic, and geographic environments. Moreover, an adoption of factor analysis to consolidate the correlated socio-economic variables into several factors that describe their interactions in conceived economic dimensions may help overcome the multicollinearity and shed new insights about the interactions between land use change and its underlying driving forces.
It is also necessary to compare the case of Beijing with other capital cities in other developing countries that are experiencing similar forces of marketization and globalization. It is hoped that our application of the techniques of remote sensing and GIS to urban research as demonstrated in this study can open up new arena of comparative research so that a broad and full picture can eventually be unfolded to shed light over the pattern and processes of urban transformation in China under globalization.
Acknowledgments
The authors wish to thank The National Natural Science Foundation of China for supporting this research through a key project grant (Foundation Item: 40335049), and Dr. Chao Bao at Institute of Geographic Science and Natural Resource Research for insightful comments.
References and Notes
- Friedmann, J.; Wolff, G. World city formation: An agenda for research and action. International Journal of Urban and Regional Research 1982, 6(3), 309–344. [Google Scholar]
- Sassen, S. The Global City; Princeton University Press: Princeton, 1991. [Google Scholar]
- Sassen, S. Cities in a World Economy; Pine Forge Press: Thousand Oaks, CA, 1994. [Google Scholar]
- Global City-Regions; Scott, A. J. (Ed.) Oxford University Press: Oxford, 2001.
- Hall, P. The World Cities; Weidenfeld and Nicolson: London, 1966. [Google Scholar]
- King, A. D. Global Cities: Post-Imperialism and the Internationalization of London; Routledge: London, 1990. [Google Scholar]
- World Cities in a World-System; Knox, P. L.; Taylor, P. J. (Eds.) Cambridge University Press: Cambridge, 1995.
- Emerging world cities in Pacific Asia; Lo, F. C.; Yeung, Y. M. (Eds.) United Nations University Press: Tokyo, 1996.
- Yeh, A. G. O.; Xu, X. Globalization and the urban system in China. In Emerging world cities in Pacific Asia; Lo, F.C., Yeung, Y.M., Eds.; United Nations University Press: Tokyo, 1996; pp. 219–267. [Google Scholar]
- Globalizing Cities: A New Spatial Order? Marcuse, P.; Van Kempen, R. (Eds.) Blackwell: Oxford, 2000.
- Understanding the City: Contemporary and Future Perspectives; Eade, J.; Mele, C. (Eds.) Blackwell: Oxford, 2002.
- Taylor, P. J.; Catalano, G.; Walker, D. R. F. Measurement of the World City Network. Urban Studies 2002, 39(13), 2367–2376. [Google Scholar]
- Pannell, C. W. China's continuing urban transition. Environment and Planning A 2002, 34(9), 1571–1589. [Google Scholar]
- Lin, G. C. S. The growth and structural change of Chinese cities: A contextual and geographic analysis. Cities 2002, 19(5), 299–316. [Google Scholar]
- Zhou, Y.; Ma, L. J. C. China's urbanization levels: Reconstructing a baseline from the Fifth Population Census. The China Quarterly 2003, 173, 176–196. [Google Scholar]
- Fan, C. C. The elite, the natives, and the outsiders: Migration and labor market segmentation in urban China. Annals of the Association of American Geographers 2002, 92(1), 103–124. [Google Scholar]
- Liang, Z.; Ma, Z. China's Floating Population: New Evidence from the 2000 Census. Population and Development Review 2004, 30(3), 467–488. [Google Scholar]
- Ma, L. J. C. Urban Transformation in China, 1949-2000: a review and research agenda. Environment and Planning A 2002, 33(9), 1545–1569. [Google Scholar]
- Lin, G. C. S.; Wei, Y. H. D. China's restless urban landscapes 1: new challenges for theoretical reconstruction. Environment and Planning A 2002, 34(9), 1535–1544. [Google Scholar]
- Healey, P.; Barrett, S.M. Structure and agency in land and property development processes: some ideas for research. Urban Studies 1990, 27(1), 89–104. [Google Scholar]
- Healey, P. Models of the development process: a review. Journal of Property Research 1991, 8, 219–238. [Google Scholar]
- Heilig, G. K. Neglected dimensions of global land-use change: Reflections and data. Population and Development Review 1994, 20(4), 831–859. [Google Scholar]
- Guy, S.; Henneberry, J. Understanding urban development processes: Integrating the economic and the social in property research. Urban Studies 2000, 37(13), 2399–2416. [Google Scholar]
- Heilig, G. K. Anthropogenic Factors in Land-Use Change in China. Population and Development Review 1997, 23(1), 139–68. [Google Scholar]
- Smil, V. China's agricultural land. The China Quarterly 1999, 158, 414–429. [Google Scholar]
- Barlowe, R. Land resource economics; Prentice-Hall: Englewood Cliffs, NJ, 1986. [Google Scholar]
- Mills, E. S.; Hamilton, B. W. Urban Economics; Scott Foresman: Glenview, Il, 1989. [Google Scholar]
- Harvey, J.; Jowsey, E. Urban land economics; Macmillan: Basingstoke, 2004. [Google Scholar]
- Zhou, Y.; Ma, L. J. C. Economic Restructuring and Suburbanization in China. Urban Geography 2000, 21(3), 205–236. [Google Scholar]
- Ho, S. P. S.; Lin, G. C. S. Converting land to nonagricultural use in China's coastal provinces: Evidence from Jiangsu. Modern China 2004, 30(1), 81–112. [Google Scholar]
- Ma, L. J. C.; Cui, G. H. Administrative changes and urban population in China. Annals of the Association of American Geographers 1987, 77(3), 373–395. [Google Scholar]
- Goldstein, S. Urbanization in China, 1982-87: Effects of migration and reclassification. Population and Development Review 1990, 16(4), 673–701. [Google Scholar]
- Zhang, L.; Zhao, S. X. B. Re-examining China's “urban” concept and the level of urbanization. The China Quarterly 1998, 154, 330–381. [Google Scholar]
- Chan, K. W.; Hu, Y. Urbanization in China in the 1990s: New definition, different series, and revised trends. The China Review 2003, 3(2), 49–71. [Google Scholar]
- Pannell, C. W. China's Urban Geography. Progress in Human Geography 1990, 14(2), 214–236. [Google Scholar]
- Solinger, D. J. Contesting Citizenship in Urban China; University of California Press: Berkeley, CA, 1999. [Google Scholar]
- Fan, C. C. Rural-Urban Migration and Gender Division of Labor in Transitional China. International Journal of Urban and Regional Research 2003, 27(1), 24–47. [Google Scholar]
- Urban development in modern China; Ma, L. J. C.; Hanten, E. W. (Eds.) Boulder; Westview, 1981.
- Pannell, C. W. China's urban transition. Journal of Geography 1995, 5/6, 394–403. [Google Scholar]
- Wei, Y. D. Large Chinese cities: a review and a research agenda. Asian Geographer 1995, 14(1), 1–13. [Google Scholar]
- Chen, X.; Parish, W. L. Urbanization in China: Reassessing an evolving model. In The Urban Transformation of the Developing World; Gugler, J., Ed.; Oxford University Press: New York, 1996; pp. 61–90. [Google Scholar]
- Tang, W. S. Urbanisation in China: A review of its causal mechanisms and spatial relations. Progress in Planning 1997, 48(1), 1–65. [Google Scholar]
- The New Chinese City: Globalization and Market Reform; Logan, J. (Ed.) Blackwell: London, 2001.
- Kirkby, R. J. R. Urbanization in China: Town and country in a developing economy, 1949-2000 AD; Columbia University Press: New York, 1985; p. 207. [Google Scholar]
- Ma, L. J. C.; Lin, G. C. S. Development of towns in China: A case study of Guangdong Province. Population and Development Review 1993, 19(3), 583–606. [Google Scholar]
- Zhou, Y.; Yang, Q. Geographical analysis of the industrial economic return of Chinese cities. Urban Geography 1995, 16(6), 505–520. [Google Scholar]
- Wei, Y. D. Urban policy, economic policy, and the growth of large cities in China. Habitat International 1994, 18(4), 53–65. [Google Scholar]
- Zhao, S. X. B.; Zhang, L. Urban performance and the control of urban size in China. Urban Studies 1995, 32(4-5), 813–845. [Google Scholar]
- Hansen, N. M. Development from above: The center-down development paradigm. In Development from above or below? Stohr, W.B., Taylor, D.R.F., Eds.; Wiley: New York, 1981; pp. 15–38. [Google Scholar]
- Fei, X.T.; et al. Small towns in China: functions, problems, and prospects; New World Press: Beijing, 1986; in Chinese. [Google Scholar]
- Kwok, R. Y. W. The role of small cities in Chinese urban development. International Journal of Urban and Regional Research 1982, 4, 549–565. [Google Scholar]
- Tan, K.C. Revitalized small towns in China. Geographical Review 1986, 76(2), 138–148. [Google Scholar]
- Ma, L. J. C.; Fan, M. Urbanization from below: the growth of towns in Jiangsu, China. Urban Studies 1994, 31(10), 1625–1645. [Google Scholar]
- Stohr, W. B. Development from below: The bottom-up and periphery-inward development paradigm. In Development from above or below? Stohr, W.B., Taylor, D. R. F., Eds.; Wiley: New York, 1981; pp. 39–72. [Google Scholar]
- Mcgee, T. G. The emergence of desakota regions in Asia: Expanding a hypothesis. In The extended metropolis; Ginsburg, N., Ed.; University of Hawaii Press: Honolulu, 1991; pp. 3–25. [Google Scholar]
- Ginsburg, N. The urban transition: Reflections on the American and Asian experiences.; The Chinese University Press: Hong Kong, 1990. [Google Scholar]
- Zhou, Y. The metropolitan interlocking region in China: A preliminary hypothesis. In The extended metropolis: Settlement transition in Asia; Ginsburg, N., Koppel, B., McGee, T. G., Eds.; University of Hawaii Press: Honolulu, 1991; pp. 89–112. [Google Scholar]
- World Bank. China: Urban land management in an emerging market economy.; The World Bank: Washington, DC, 1993. [Google Scholar]
- Wu, F. Changes in the structure of public housing provision in urban China. Urban Studies 1996, 33, 1601–1627. [Google Scholar]
- Yeh, A. G. O.; Wu, F. The new land development process and urban development in Chinese cities. International Journal of Urban and Regional Research 1996, 20(2), 330–353. [Google Scholar]
- Ash, R. F.; Edmonds, R. L. China's land resources, environment and agricultural production. The China Quarterly 1998, 156, 836–879. [Google Scholar]
- Wang, Y. P.; Murie, A. Commercial housing development in urban China. Urban Studies 1999, 36, 1475–1494. [Google Scholar]
- Li, S. M. Housing consumption in urban China: a comparative study of Beijing and Guangzhou. Environment and Planning A 2000, 32, 1115–1134. [Google Scholar]
- Xie, Q.; Parsa, A. R. G.; Redding, B. The emergence of the urban land market in China: evolution, structure, constraints and perspectives. Urban Studies 2002, 39(8), 1375–1398. [Google Scholar]
- Zhu, J. Urban development under ambiguous property rights. International Journal of Urban and Regional Research 2002, 26(1), 41–57. [Google Scholar]
- Zhu, J. A transitional institution for the emerging land market in urban China. Urban Studies 2005, 42(8), 1369–1390. [Google Scholar]
- Huang, Y. A room of one's own: housing consumption and residential crowding in transitional urban China. Environment and Planning A 2003, 35(4), 591–614. [Google Scholar]
- Sun, S. H.; Wang, Y. The institutional structure of a property market in inland China: Chongqing. Urban Studies 2003, 40(1), 91–112. [Google Scholar]
- Ding, C. Urban spatial development in the land policy reform era: evidence from Beijing. Urban Studies 2004, 41(10), 1889–1907. [Google Scholar]
- Xie, Y.; Batty, M.; Zhao, K. Simulating Emergent Urban Form Using Agent-Based Modeling: Desakota in the Suzhou-Wuxian Region in China. Annuals of Association of American Geographers 2007, 97(3), 477–495. [Google Scholar]
- Xie, Y.; Yu, M.; Tian, G.; Xing, X. Socio-economic driving forces of arable land conversion: a case study of Wuxian City, China. Global Environmental Change 2005, 15(3), 238–252. [Google Scholar]
- Xie, Y.; Yu, M.; Bai, Y.; Xing, X. Ecological Analysis of An Emerging Urban Landscape Pattern - Desakota: A Case Study in Suzhou, China. Landscape Ecology 2006, 21(8), 1297–1309. [Google Scholar]
- Gaubatz, P. China's Urban Transformation: Patterns and Processes of Morphological Change in Beijing, Shanghai and Guangzhou. Urban Studies 1999, 36(9), 1495–1521. [Google Scholar]
- Wu, F.; Yeh, A. G. O. Urban spatial structure in a transitional economy: the case of Guangzhou, China. Journal of the American Planning Association 1999, 65, 377–394. [Google Scholar]
- Wu, F. Place promotion in Shanghai, PRC. Cities 2000, 17(5), 349–361. [Google Scholar]
- Wu, F. The (post-)socialist entrepreneurial city as a state project: Shanghai's reglobalization in question. Urban Studies 2003, 40(9), 1673–1698. [Google Scholar]
- Yusuf, S.; Wu, W. Pathways to a world city: Shanghai rising in an era of globalization. Urban Studies 2002, 39(7), 1213–1240. [Google Scholar]
- Wu, W. Cultural strategies in Shanghai: Regenerating cosmopolitanism in an era of globalization. Progress in Planning 2004, 61(3), 159–180. [Google Scholar]
- Lin, G. C. S. Toward a post-Socialist city? Economic tertiarization and urban reformation in the Guangzhou Metropolis, China. Eurasian Geography and Economics 2004, 45(1), 18–44. [Google Scholar]
- Ma, L. J. C.; Wu, F. Restructuring the Chinese City: Diverse Processes and Reconstituted Spaces. In Restructuring the Chinese City; Ma, L.J.C., Wu, F., Eds.; Routledge: London, 2005; pp. 1–20. [Google Scholar]
- Anderson, J. R.; Hardy, E. E.; Roach, J. T.; Witmer, R. E. A land use and land cover classification system for use with remote sensor data. USGS Professional Paper. 1976, 964.
- Liu, J.; Liu, M.; Zhuang, D.; et al. Study on spatial pattern of land-use change in China during 1995-2000. Science in China (D) 2002, 46(4), 373–384. [Google Scholar]
- Liu, J.; Liu, M.; Deng, X.; et al. The land-use and land-cover change database and its relative studies in China. Journal of Geographical Sciences 2002, 12, 275–282. [Google Scholar]
- von Thünen, J.H. Der Isolierte Staat in Beziehung auf Landwirtshaft und Nationalökonomie; Rostock: Hamburg, 1825; in German. [Google Scholar]
- Burgess, E.W. The growth of the city: an introduction to a research project. In The City; Park, R.E., Burgess, R.W., McKenzie, R., Eds.; University of Chicago Press: Chicago, 1925; pp. 47–62. [Google Scholar]
- Christaller, W. Central Places in Southern Germany; Englewood Cliffs; Prentice Hall, 1933. [Google Scholar]
- Hoyt, H. The Structure and Growth of Residential Neighborhoods in American Cities; Federal Housing Administration: Washington, DC, 1939. [Google Scholar]
- Harris, C.D.; Ullman, E.L. The nature of cities. Annals of the American Academy of Political and Social Science 1945, 242, 7–17. [Google Scholar]
- Urban Sprawl: Causes, Consequences, and Policy Responses; Squires, G. D. (Ed.) The Urban Institute Press: Washington, DC, 2002.
- Sudhira, H. S.; Ramachandra, T. V.; Jagadish, K. S. Urban sprawl: metrics, dynamics and modelling using GIS. International Journal of Applied Earth Observation and Geoinformation 2004, 5(1), 29–39. [Google Scholar]
- Yang, G.; Gan, G. H.; Guo, T. Y. Land use dynamic change in Beijing and its forecast. Geo-Information Science 2005, 7(3), 108–112, in Chinese. [Google Scholar]
- Xu, Y.; Ma, G. X.; Shen, H. Q. An analysis on land use change and its economic driving force in Fengtai District of Beijing. Geographical Research 2005, 24(6), 860–868, in Chinese. [Google Scholar]
- Zhuang, D. F.; Deng, X. Z.; Zhan, J. Y.; Zhao, T. A study on the spatial distribution of land use change in Beijing. Geographical Research 2002, 21(6), 667–674, in Chinese. [Google Scholar]
© 2007 by MDPI ( http://www.mdpi.org). Reproduction is permitted for noncommercial purposes.