Voltammetric Determination of Carcinogenic Nitrobiphenyls at a Hanging Mercury Drop Electrode

Abstract
:Introduction
Experimental
Reagents
Apparatus
Procedures

Results and Discussion
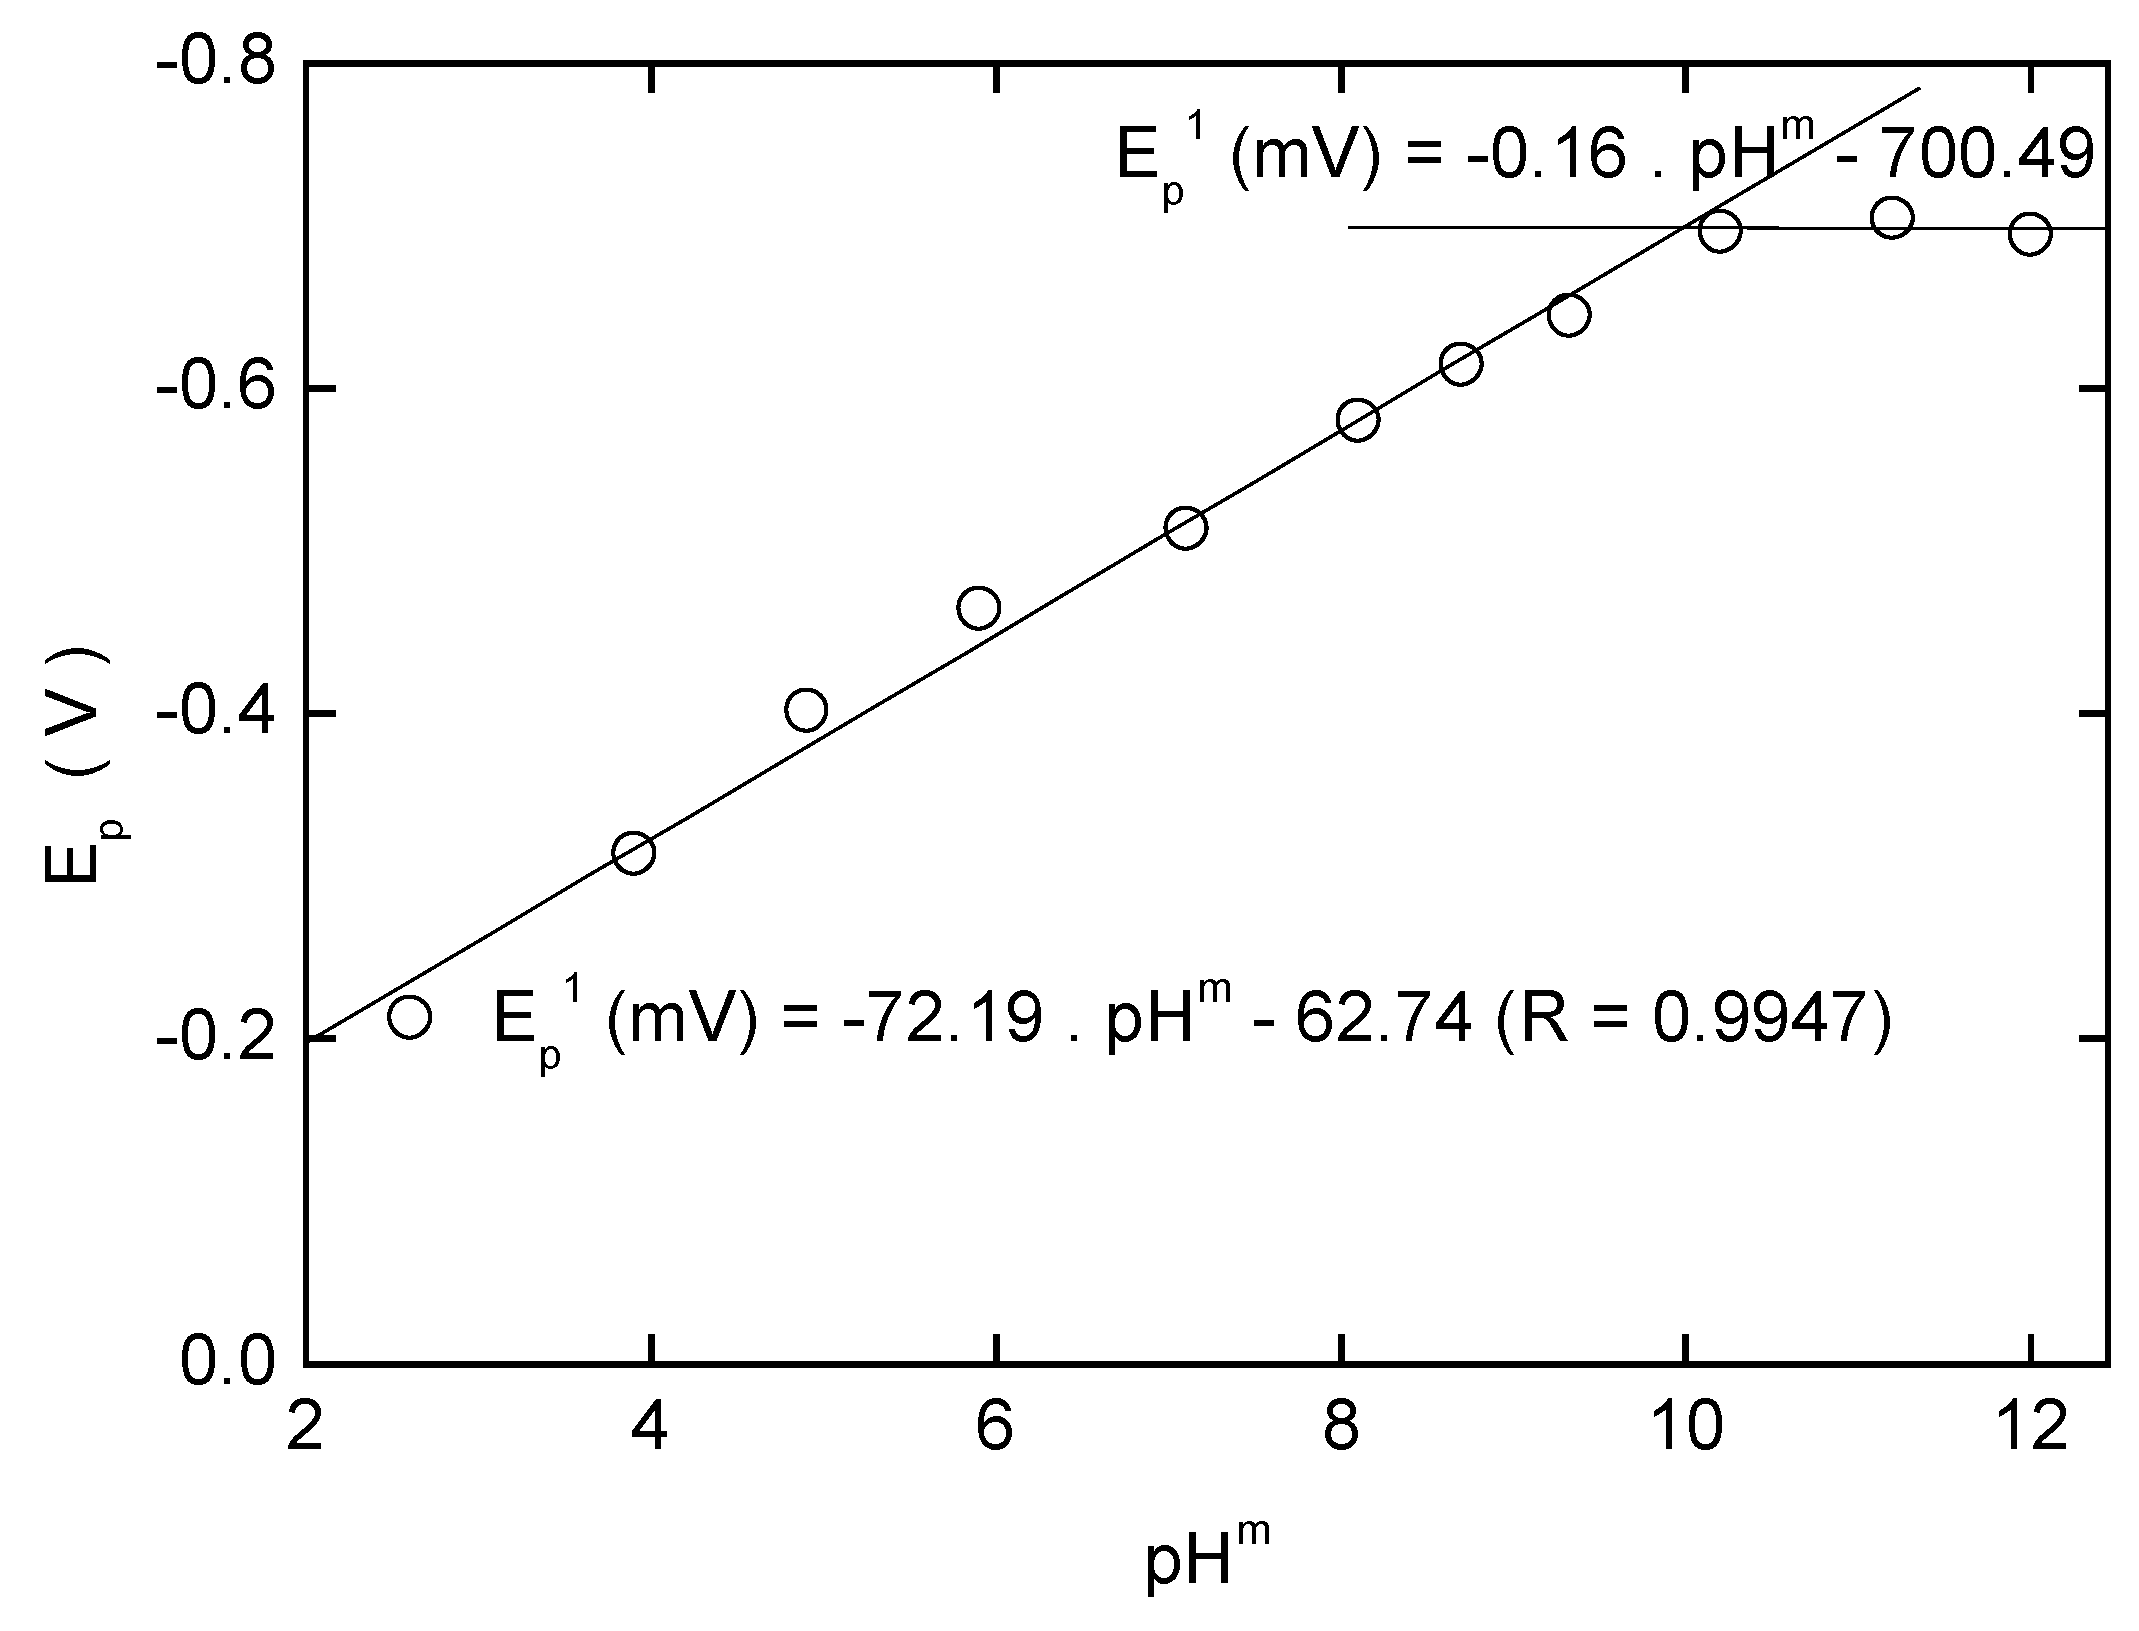
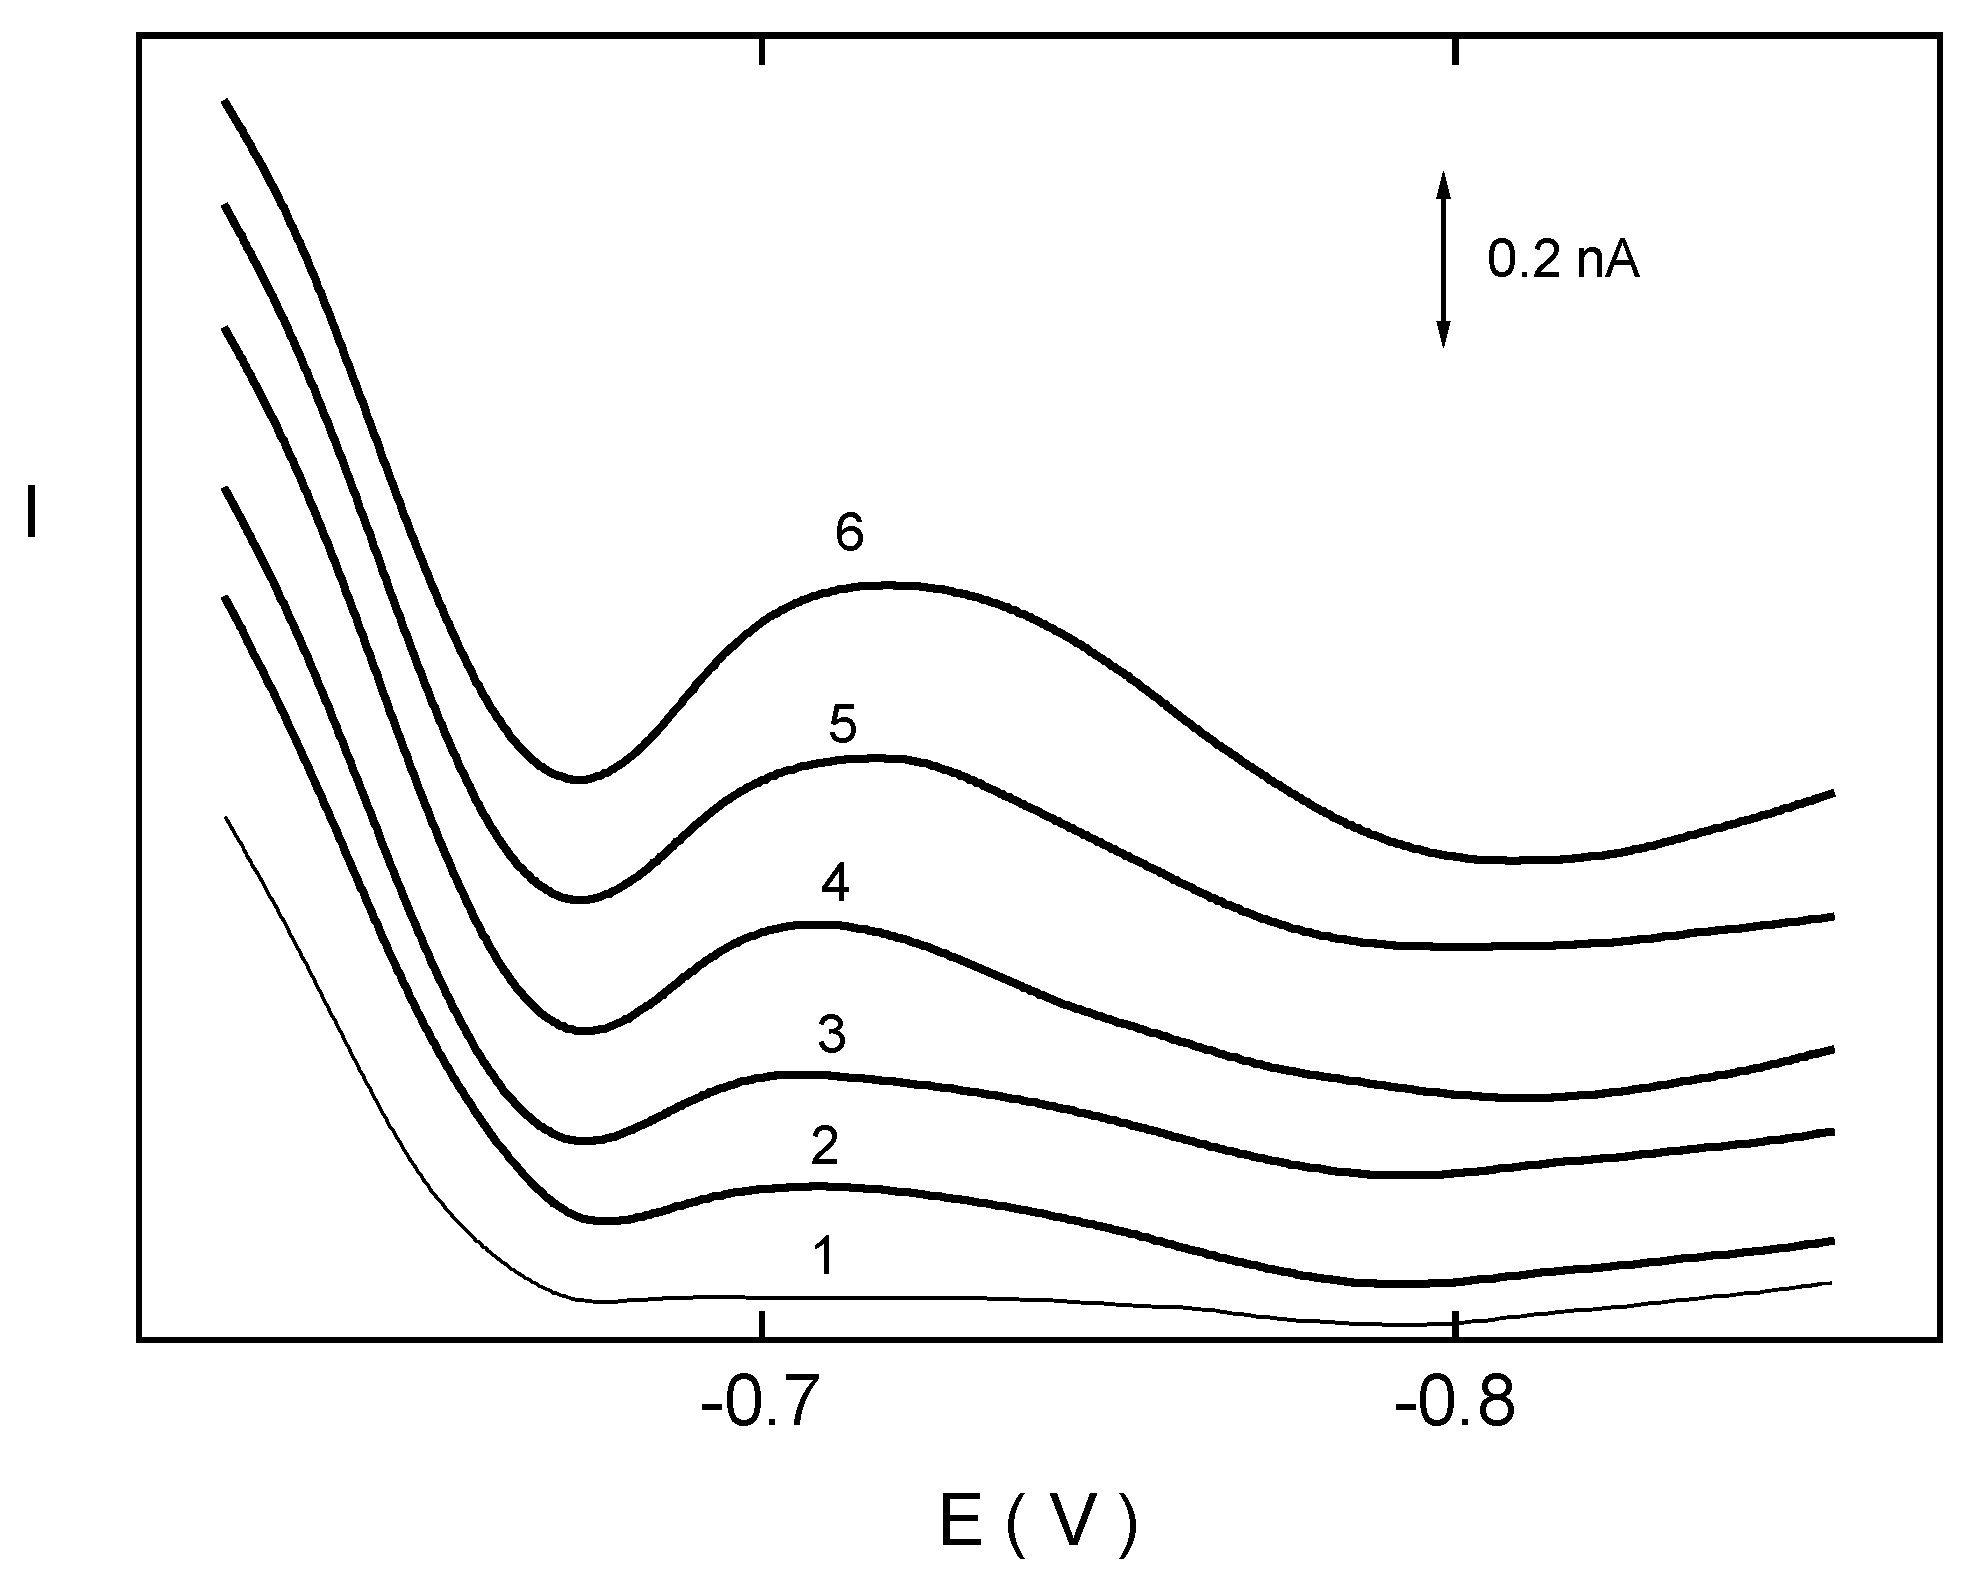
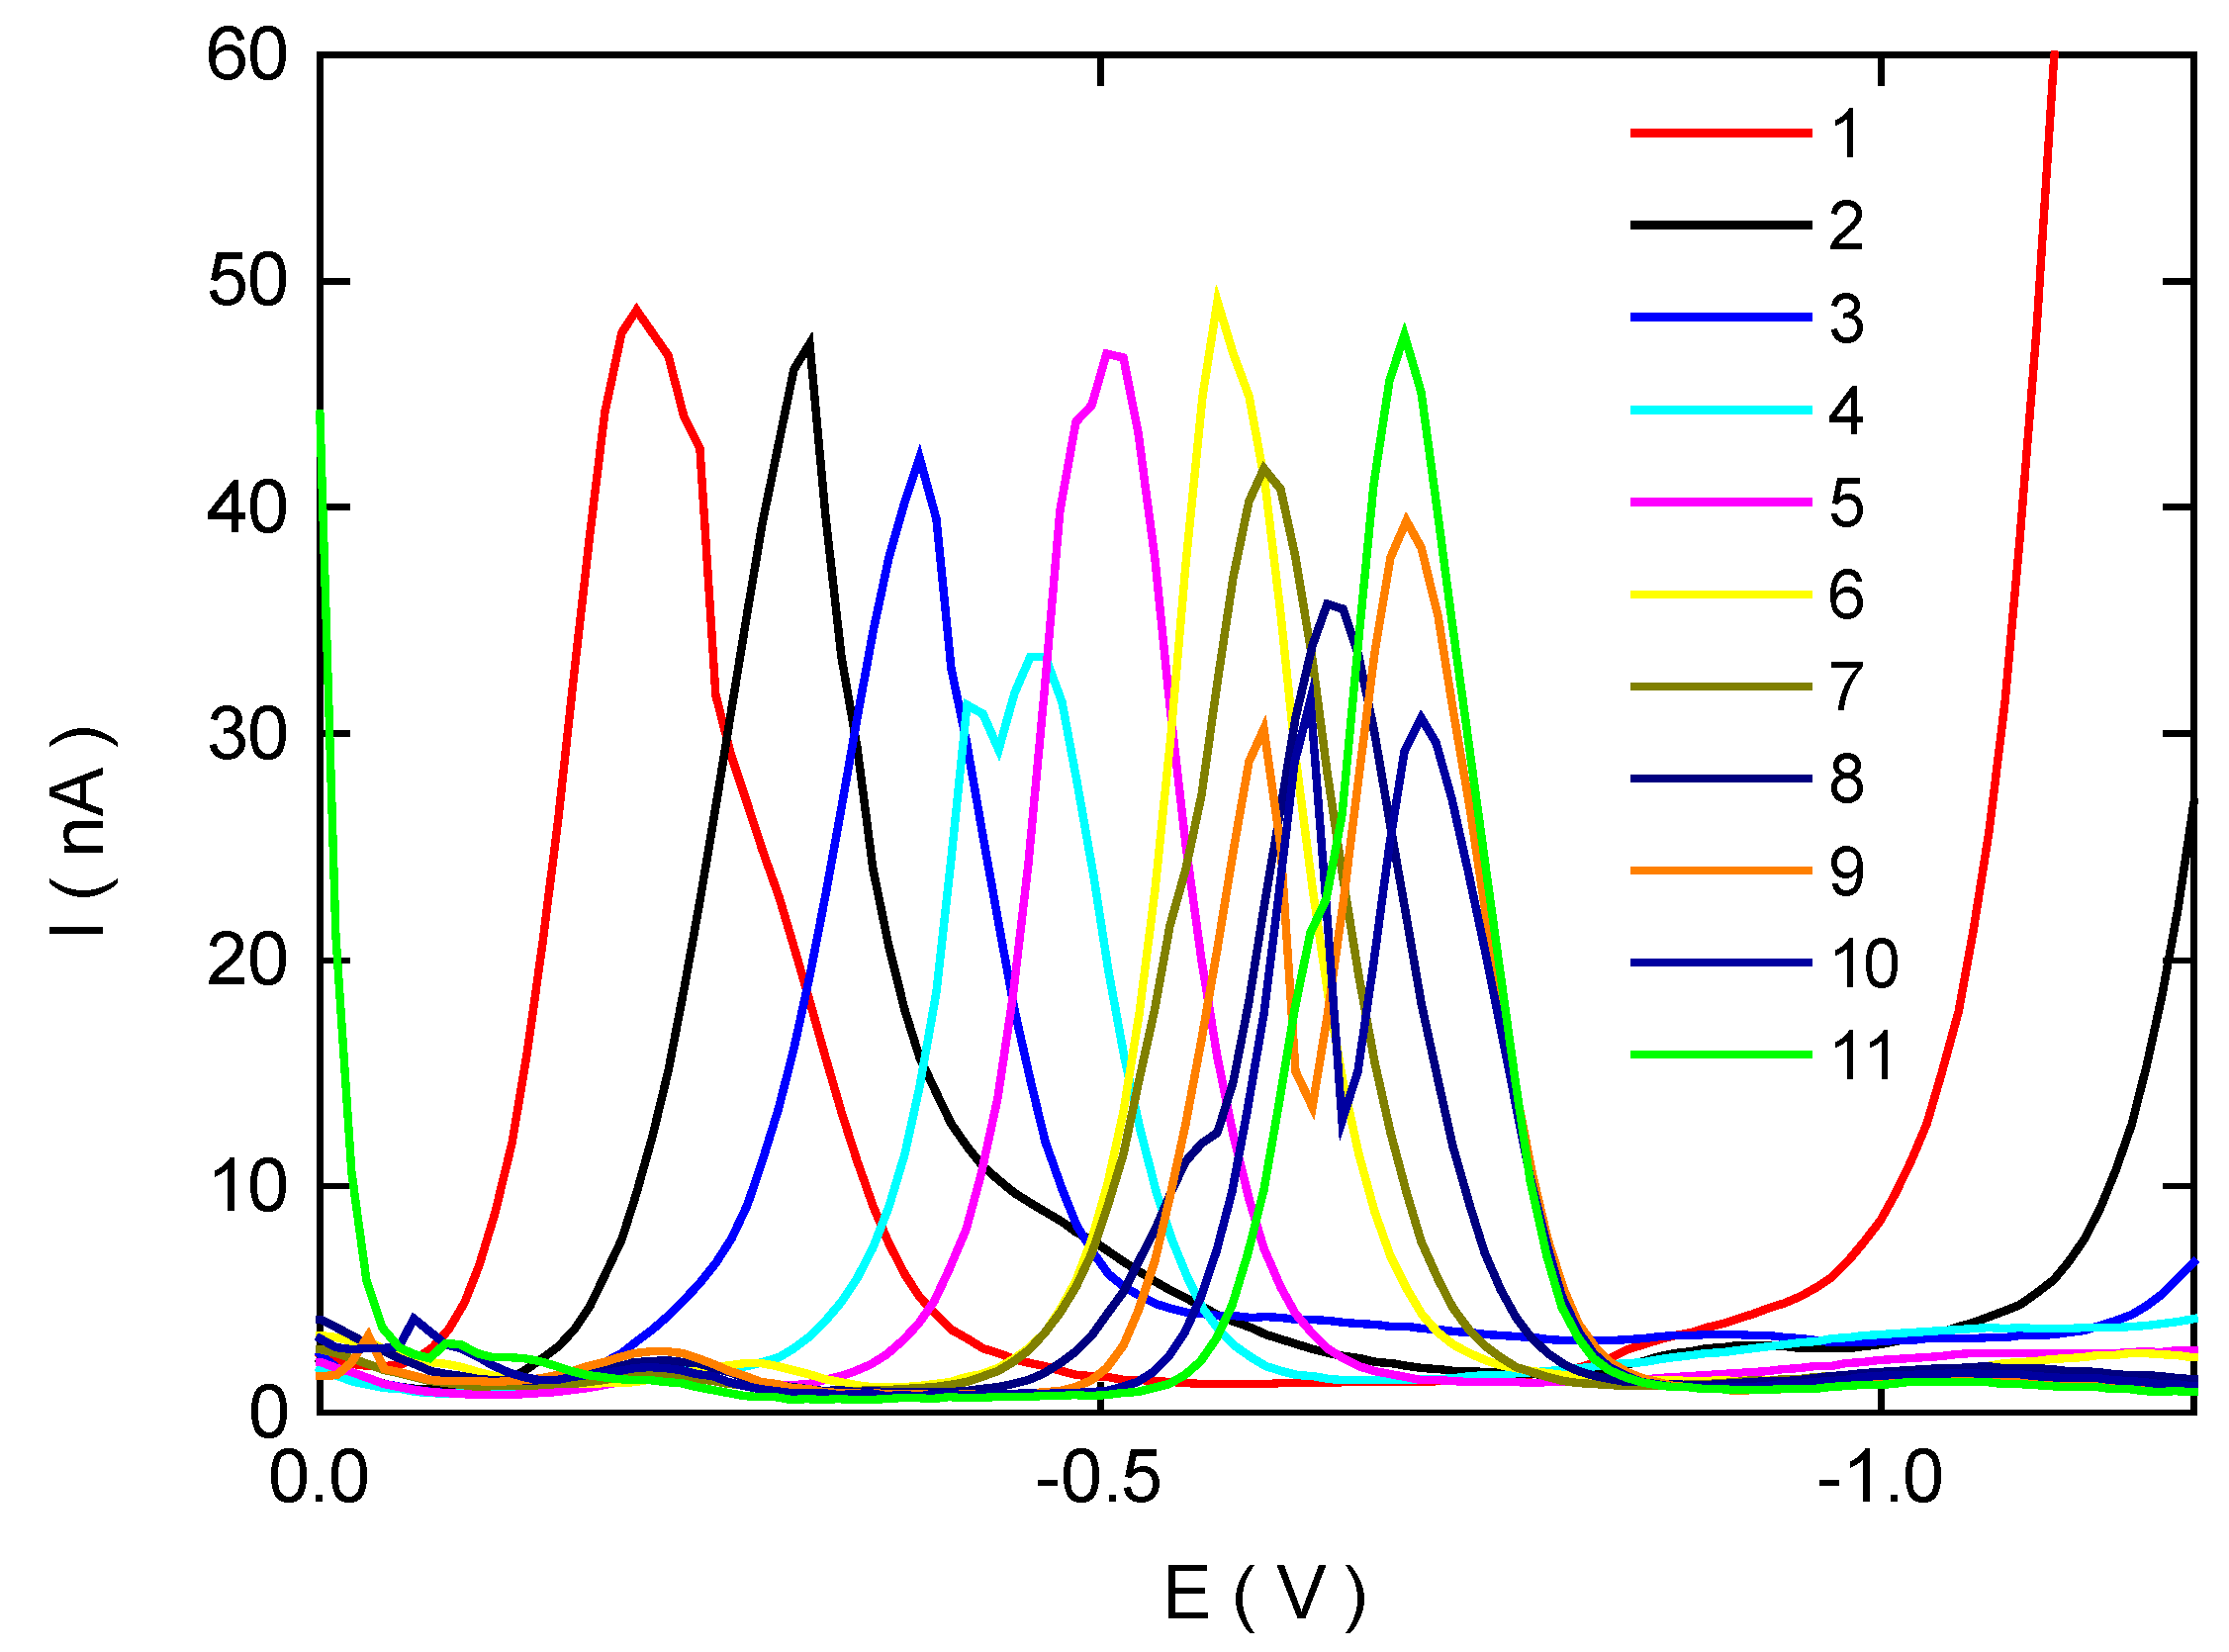
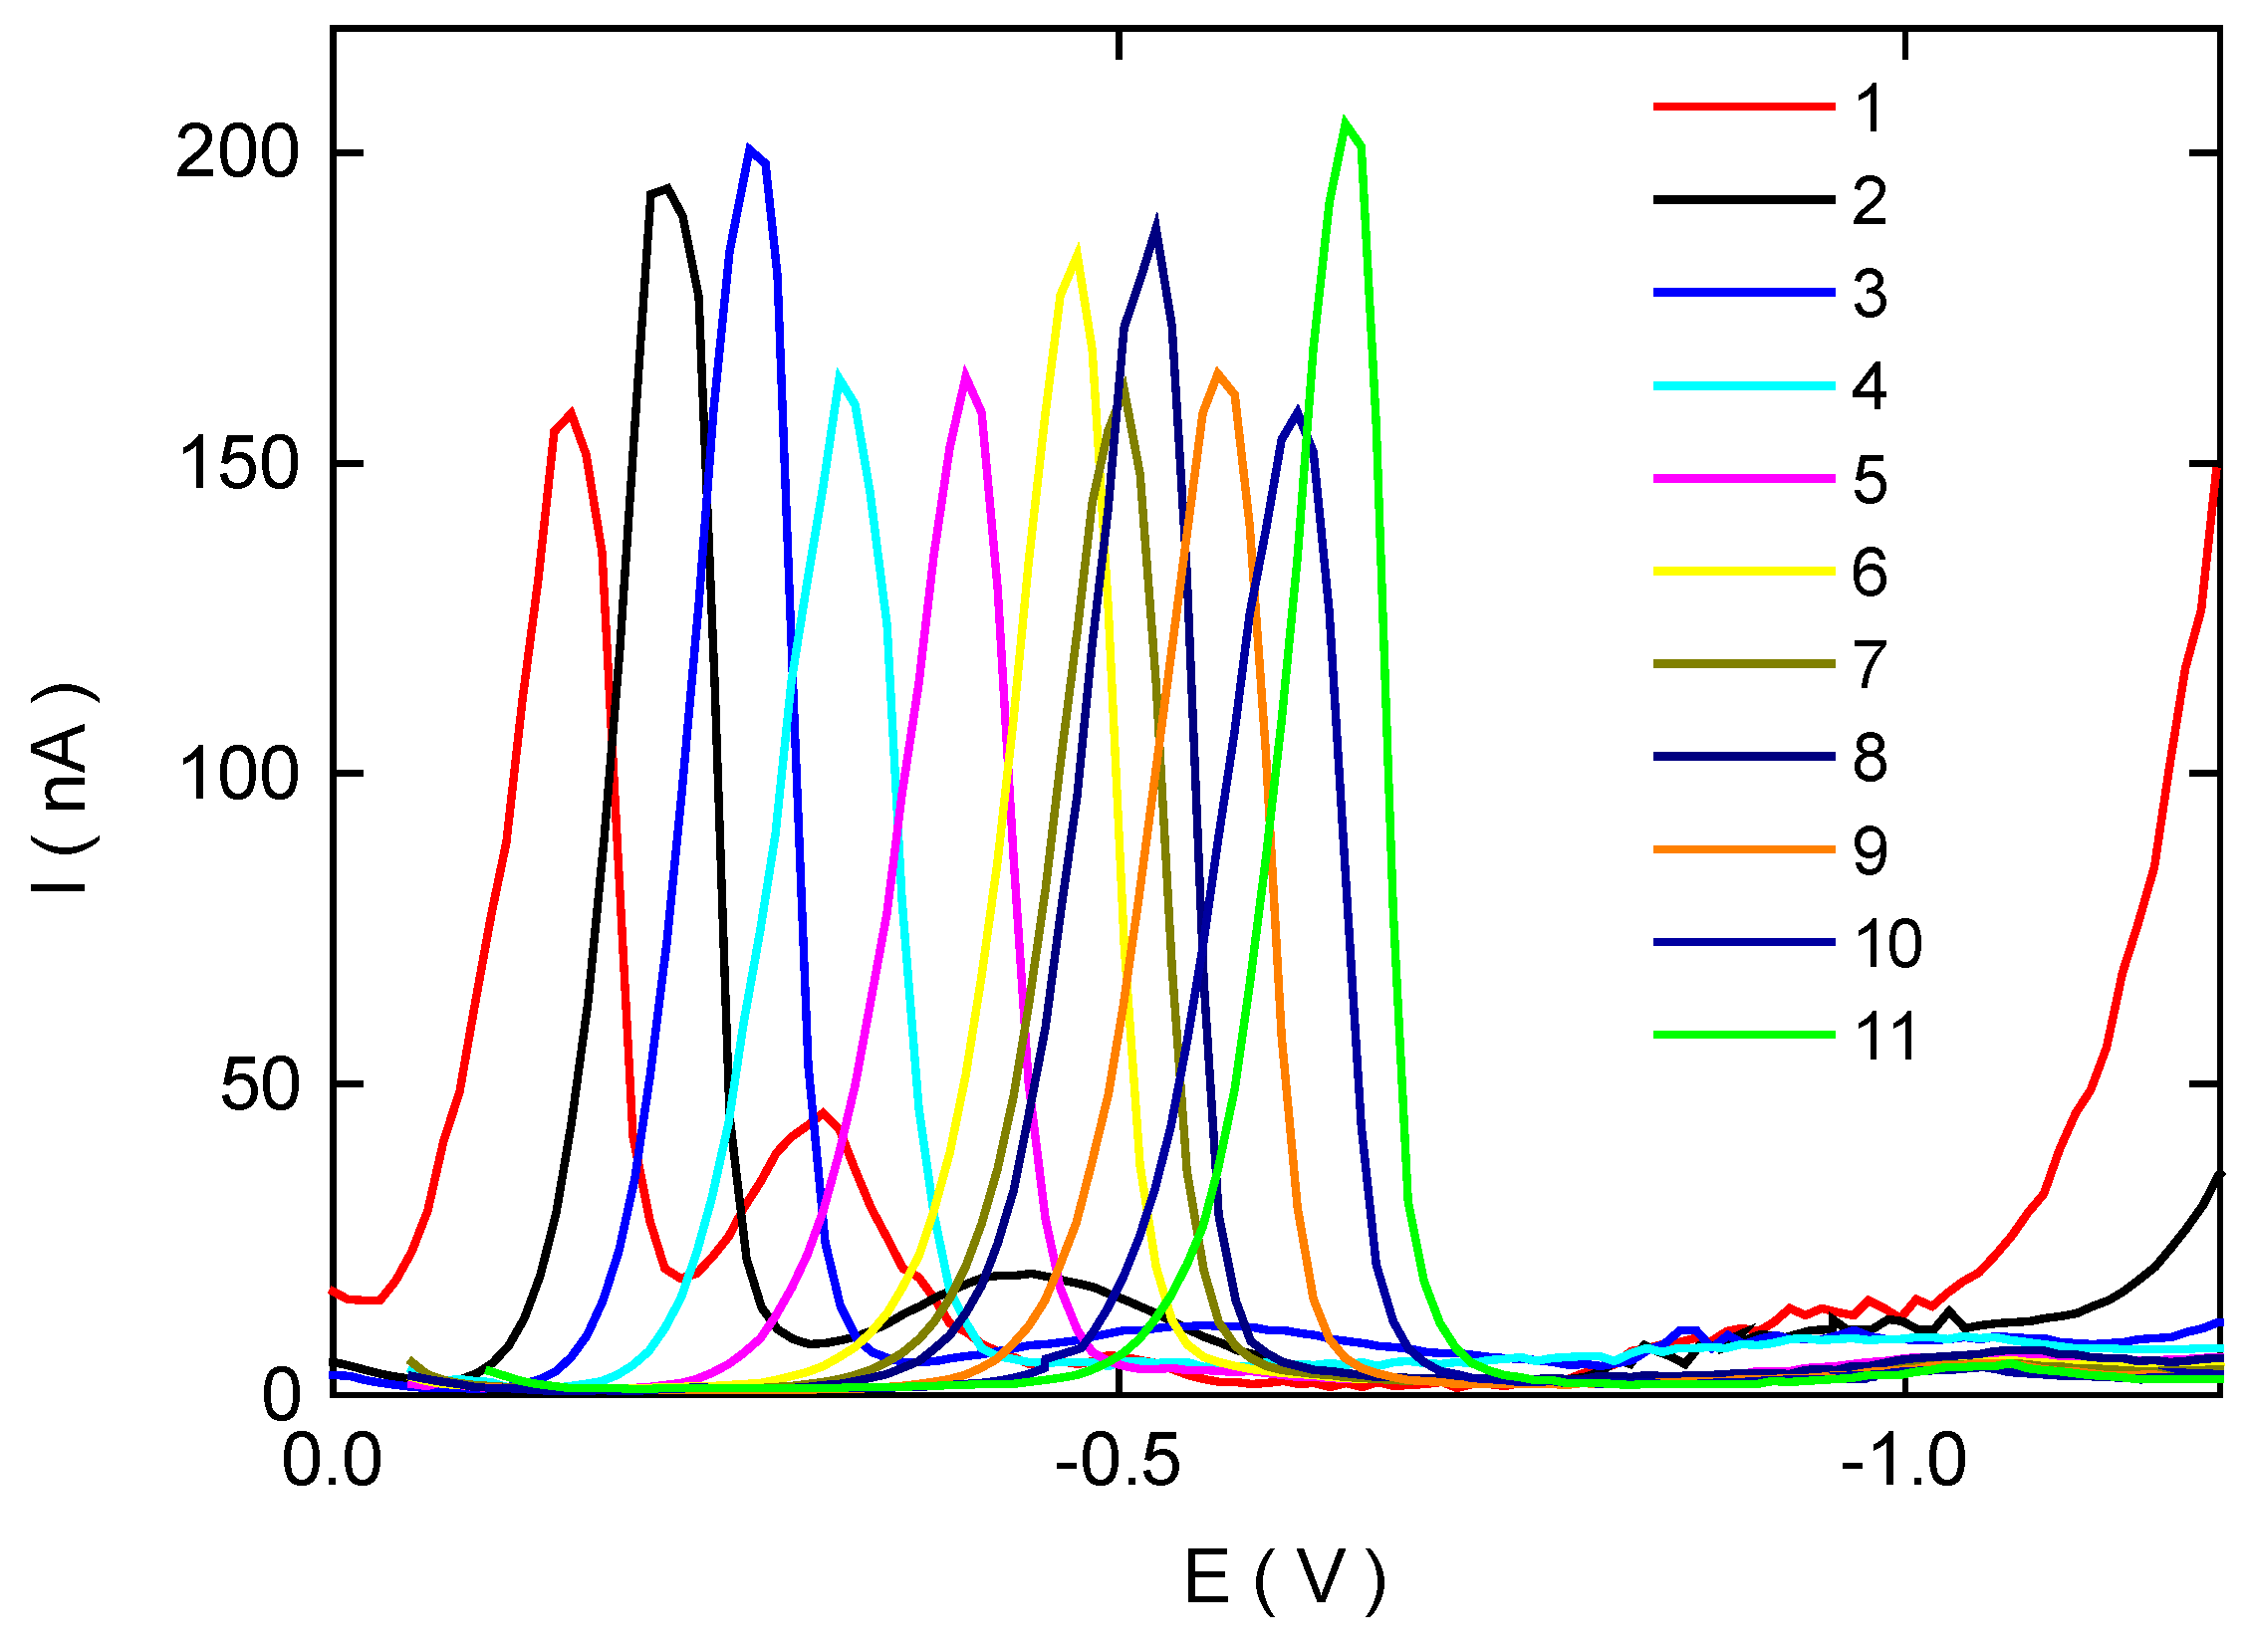
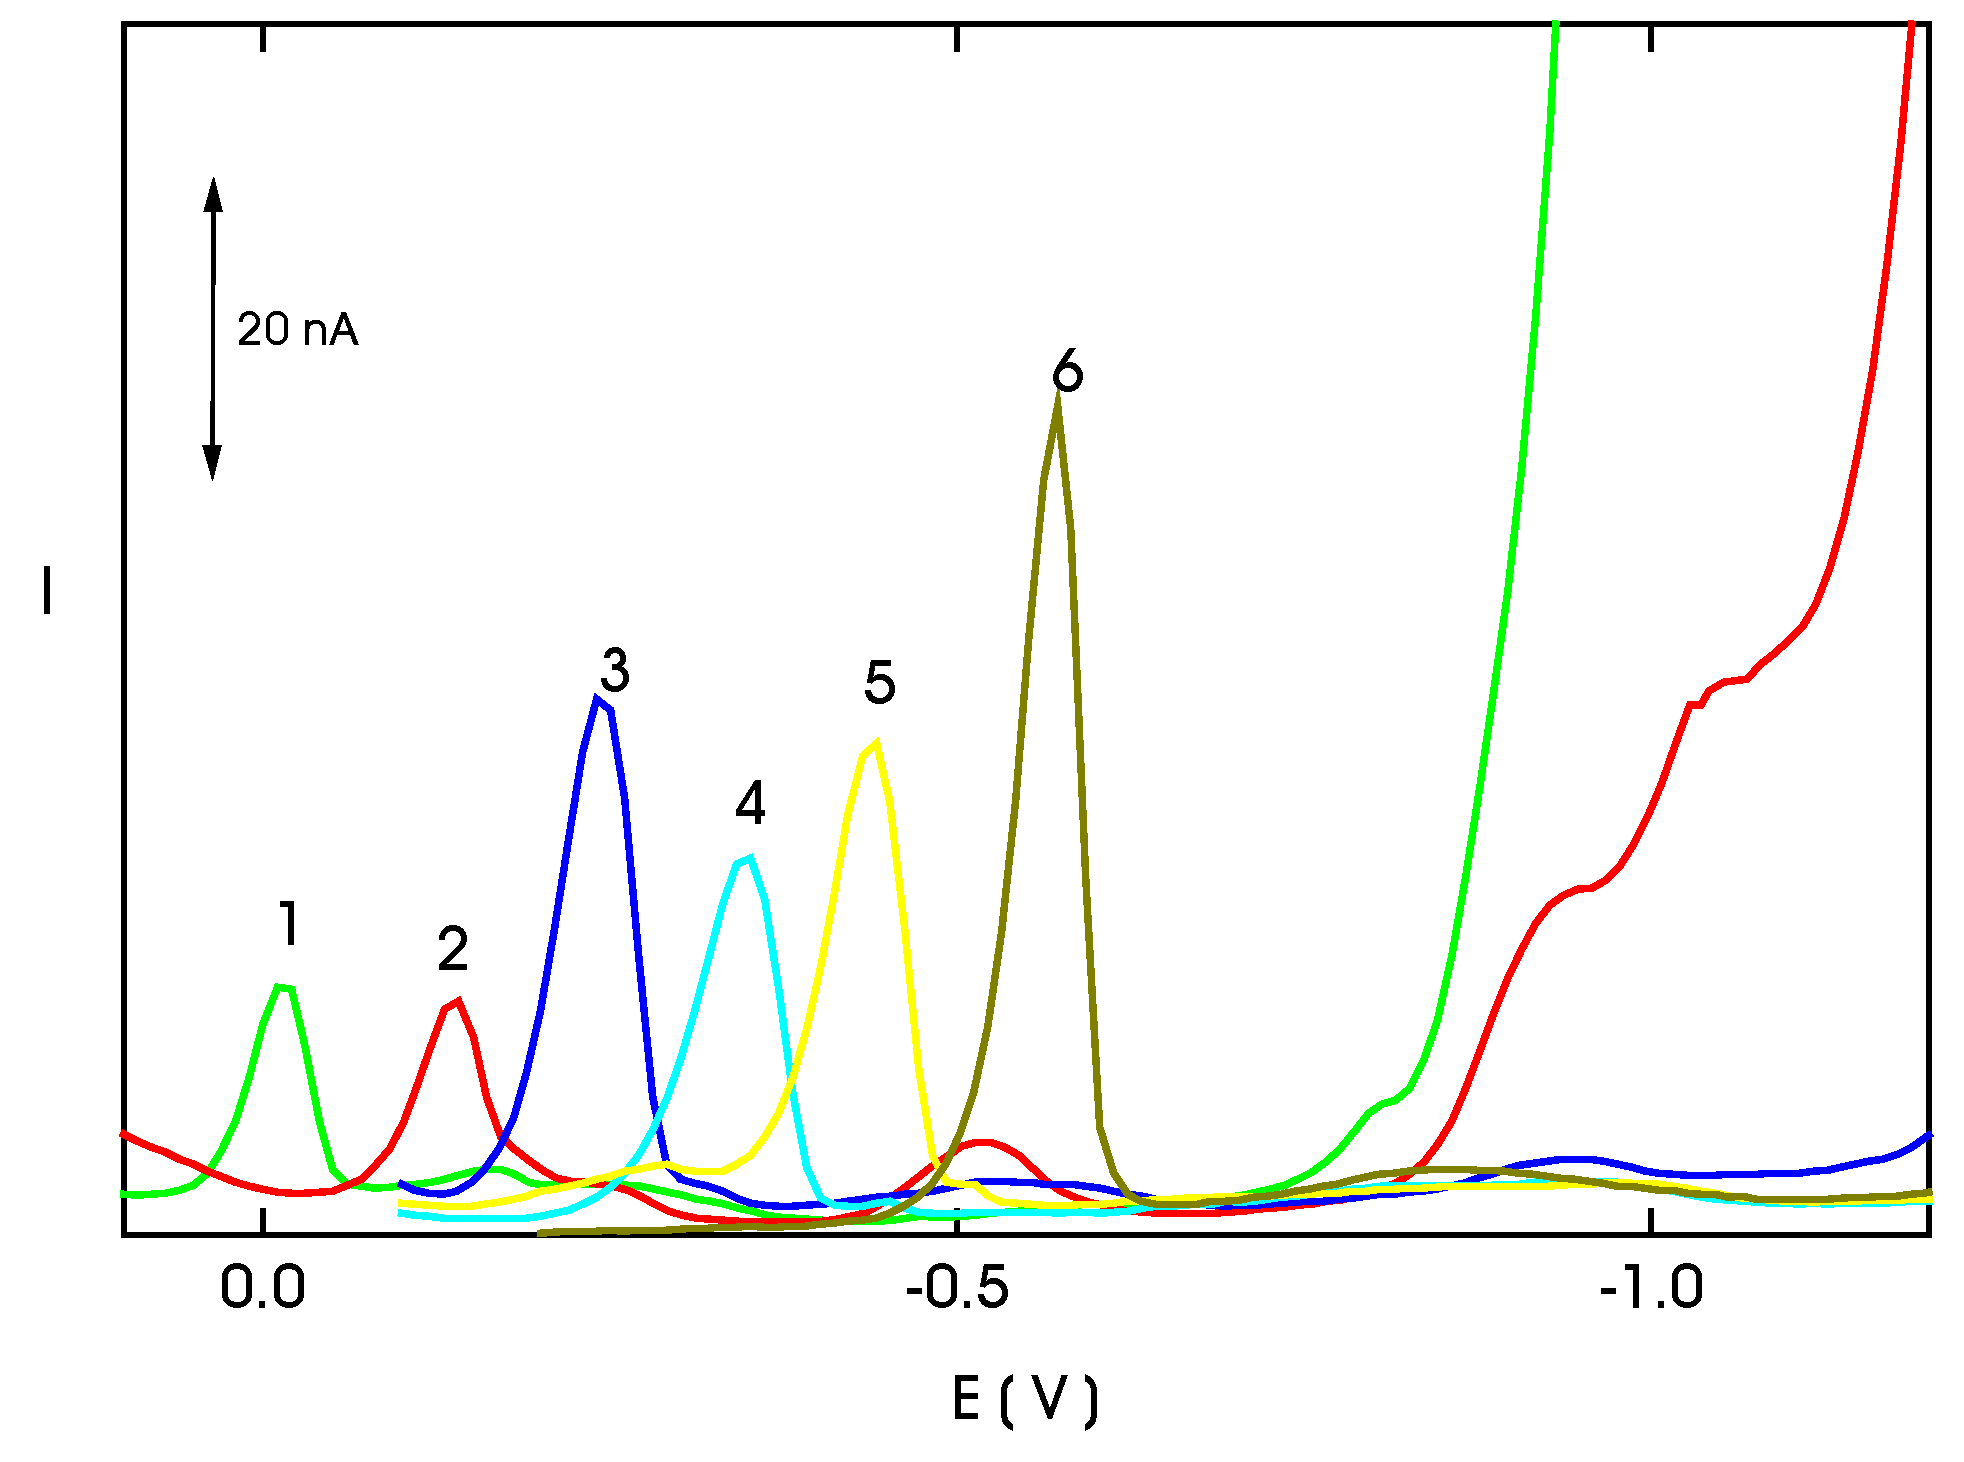
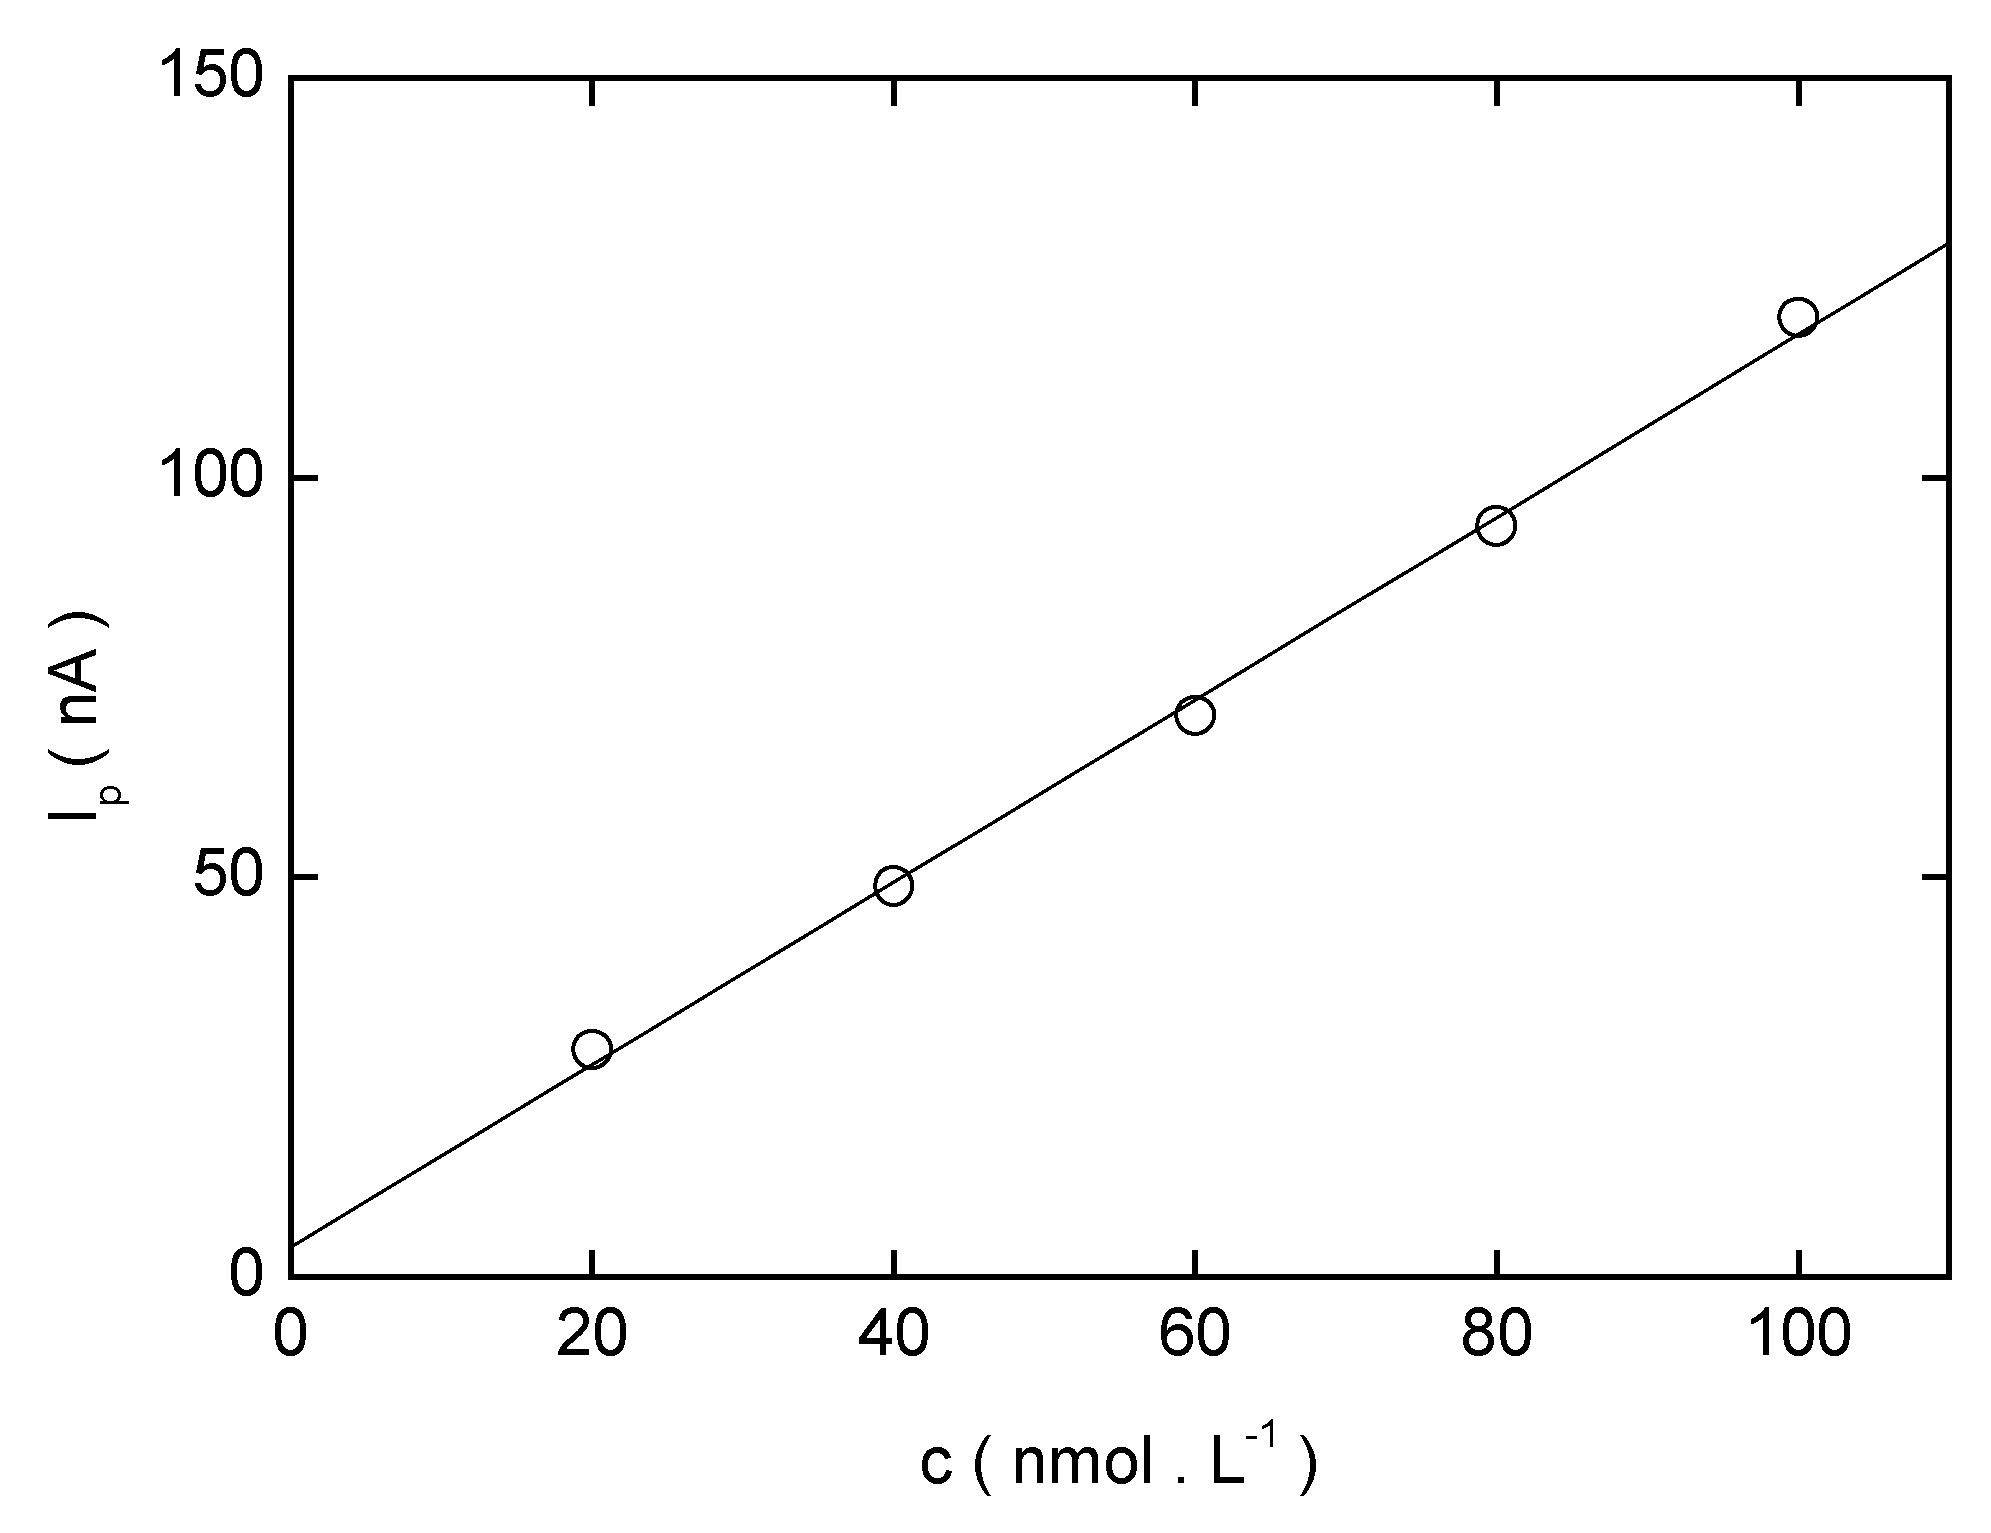
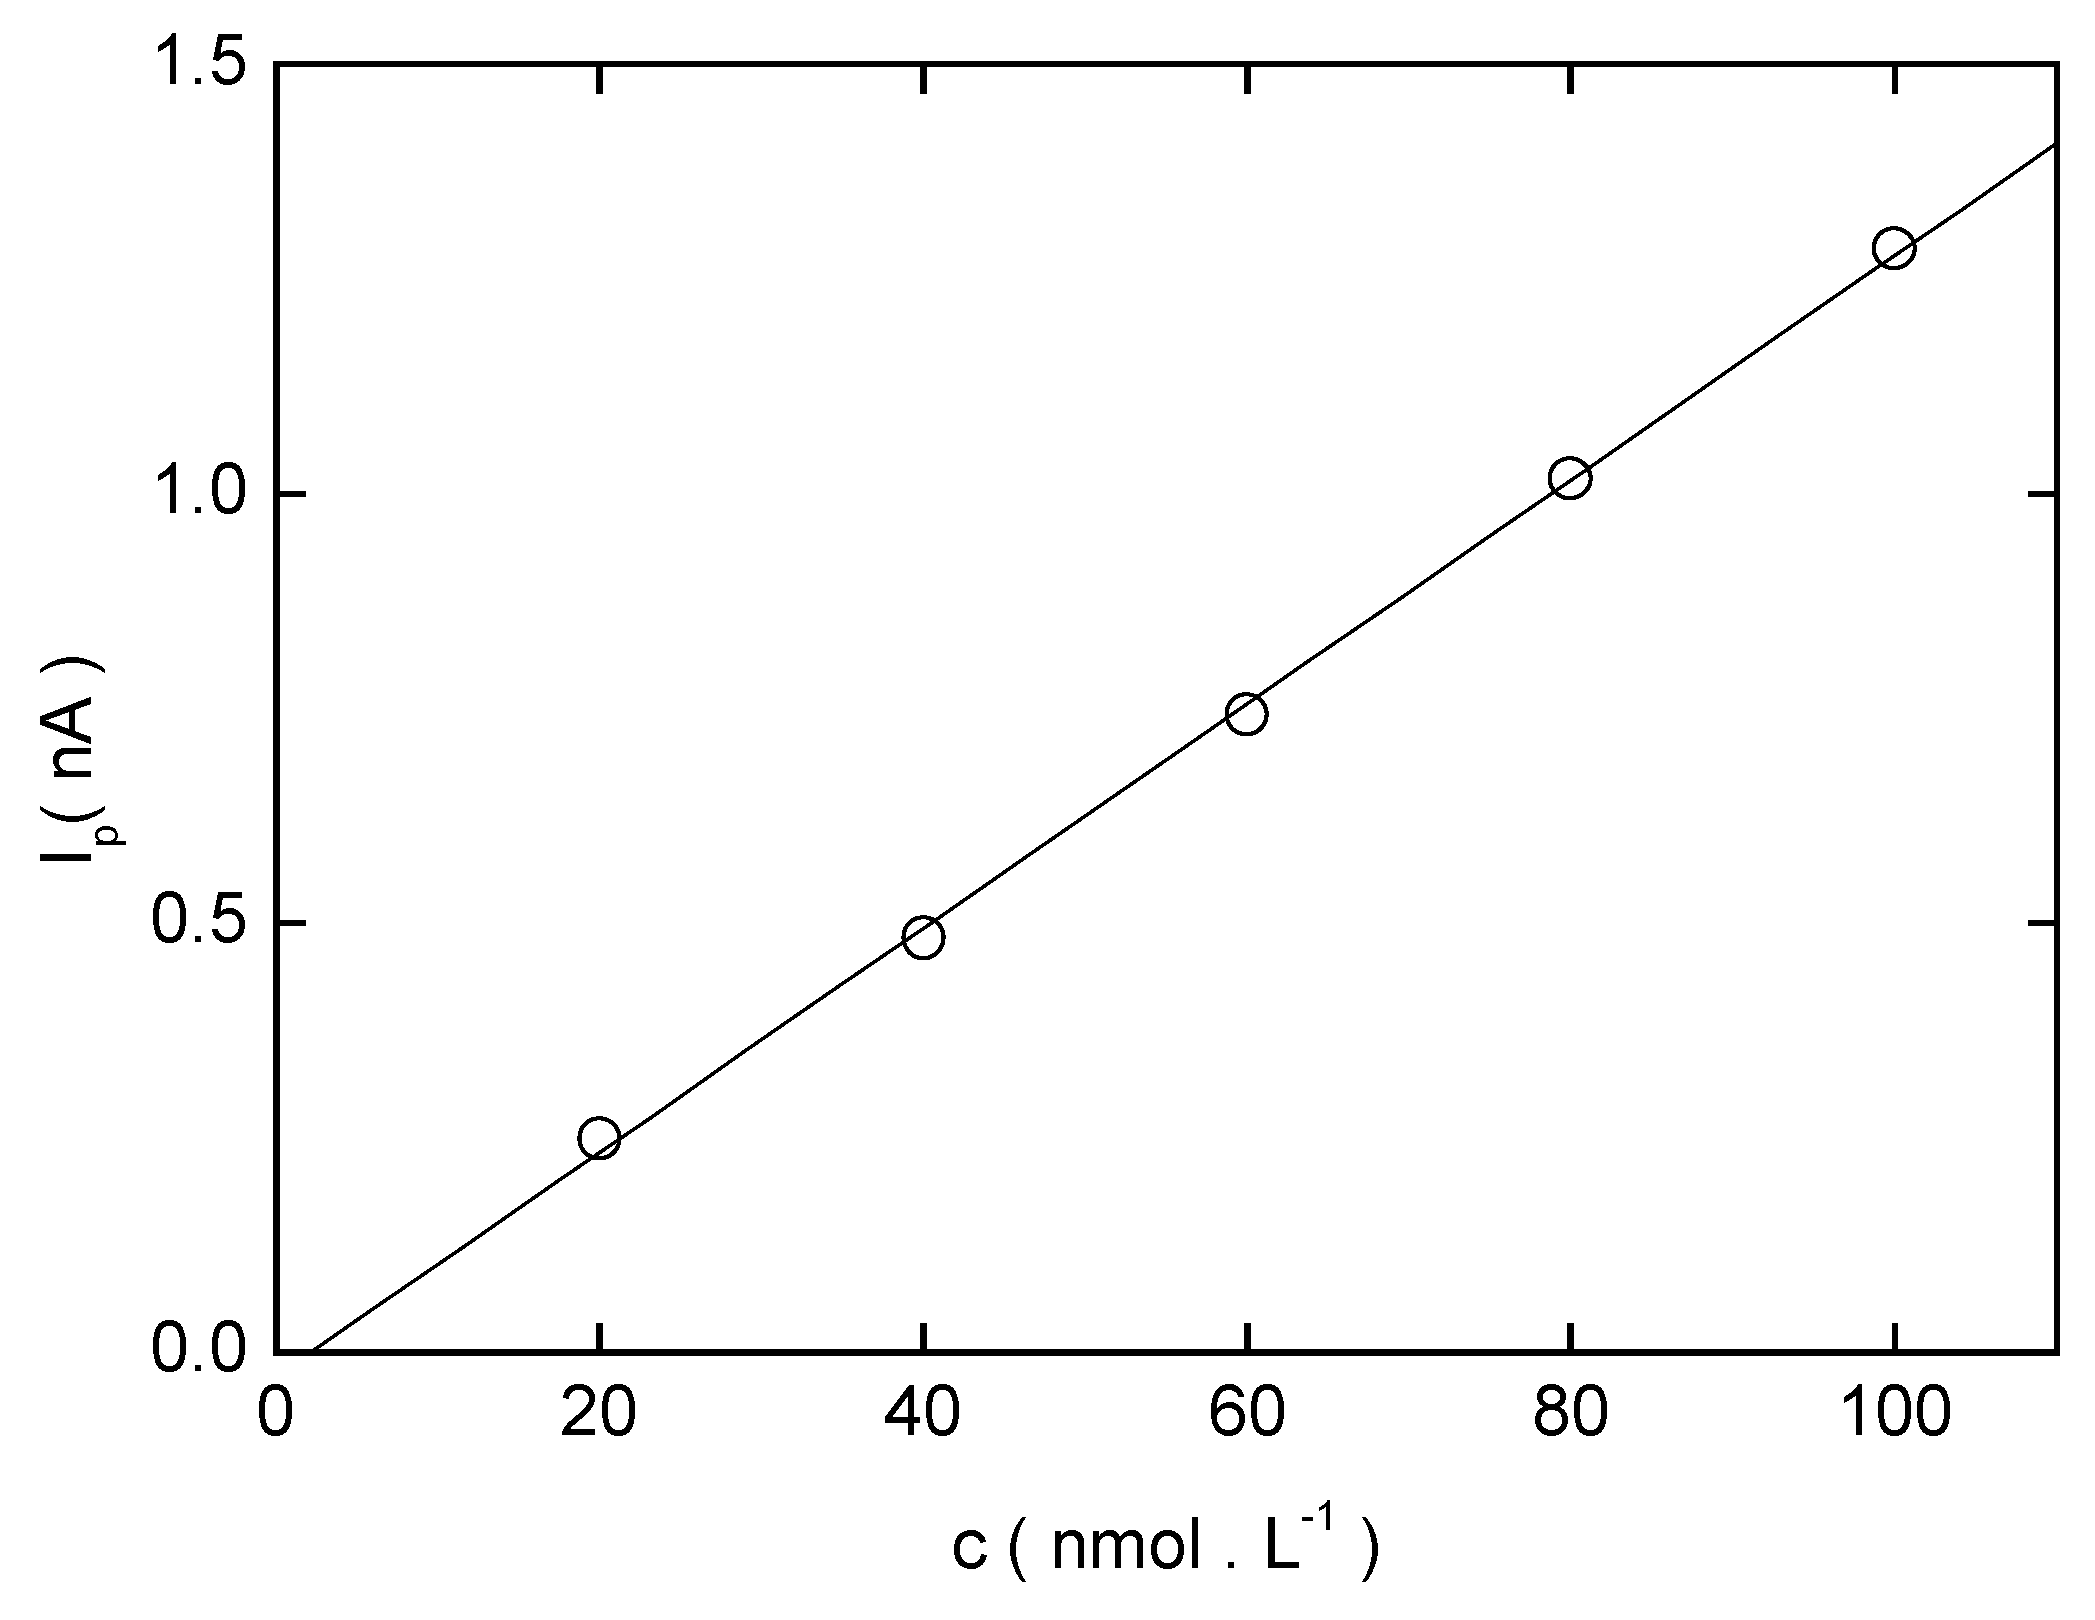
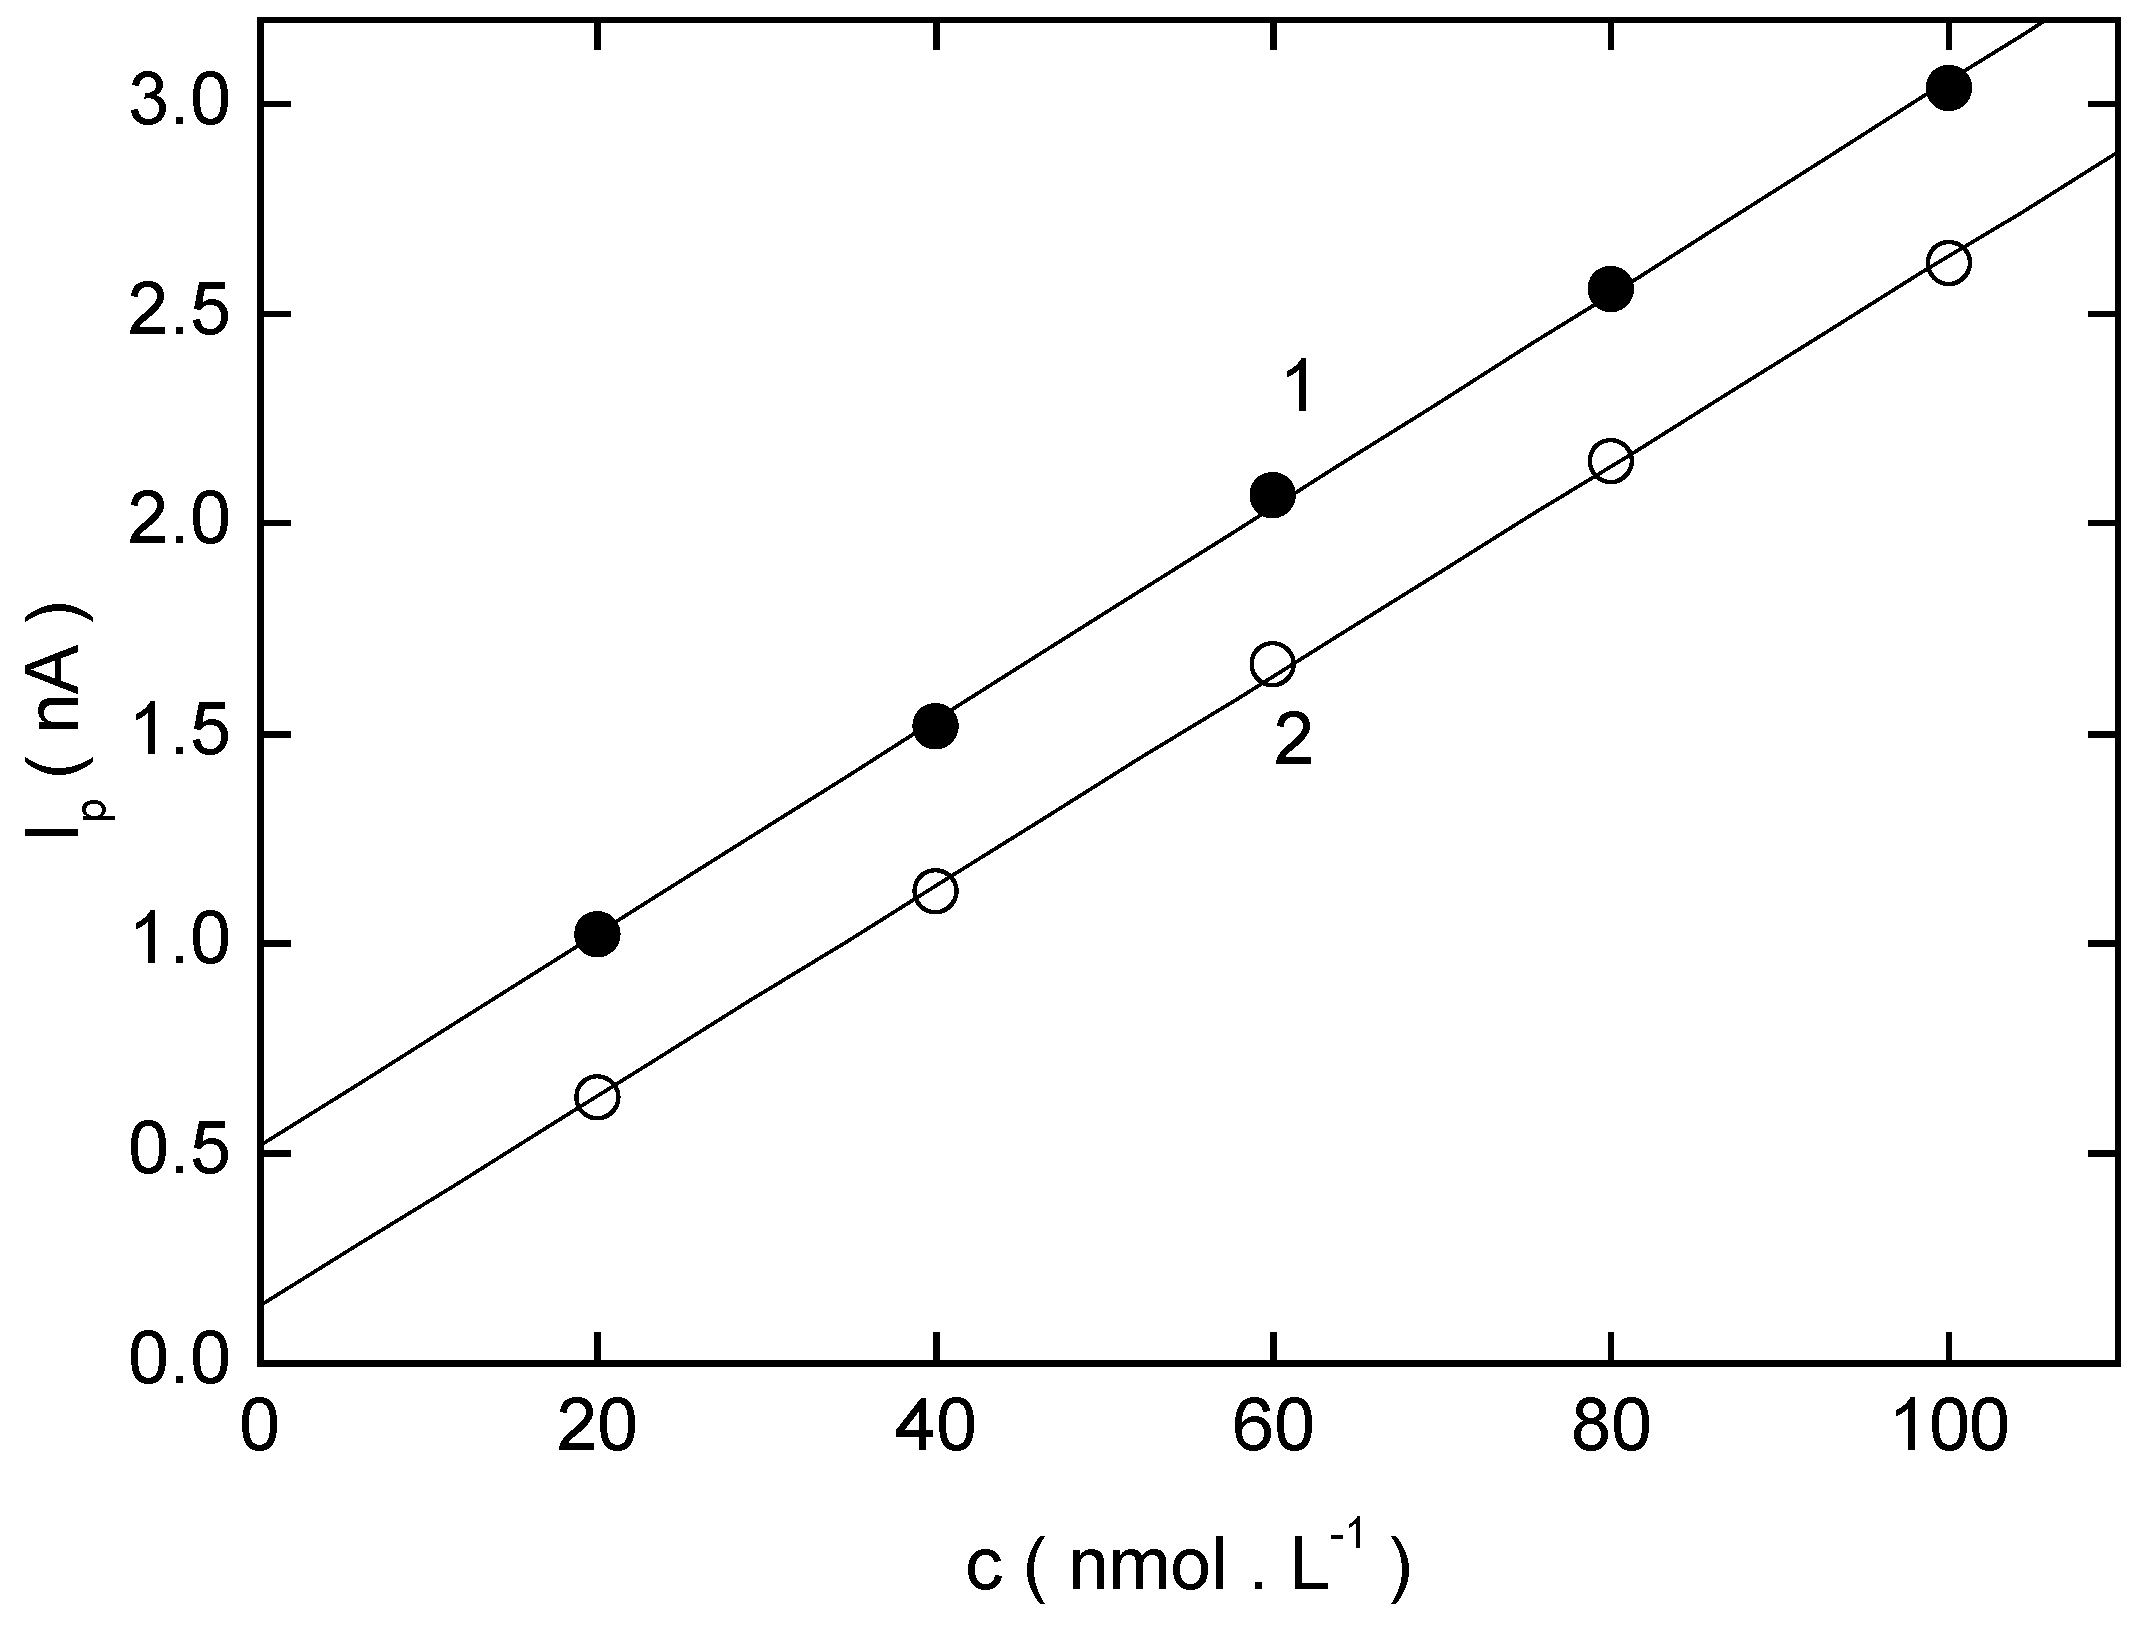
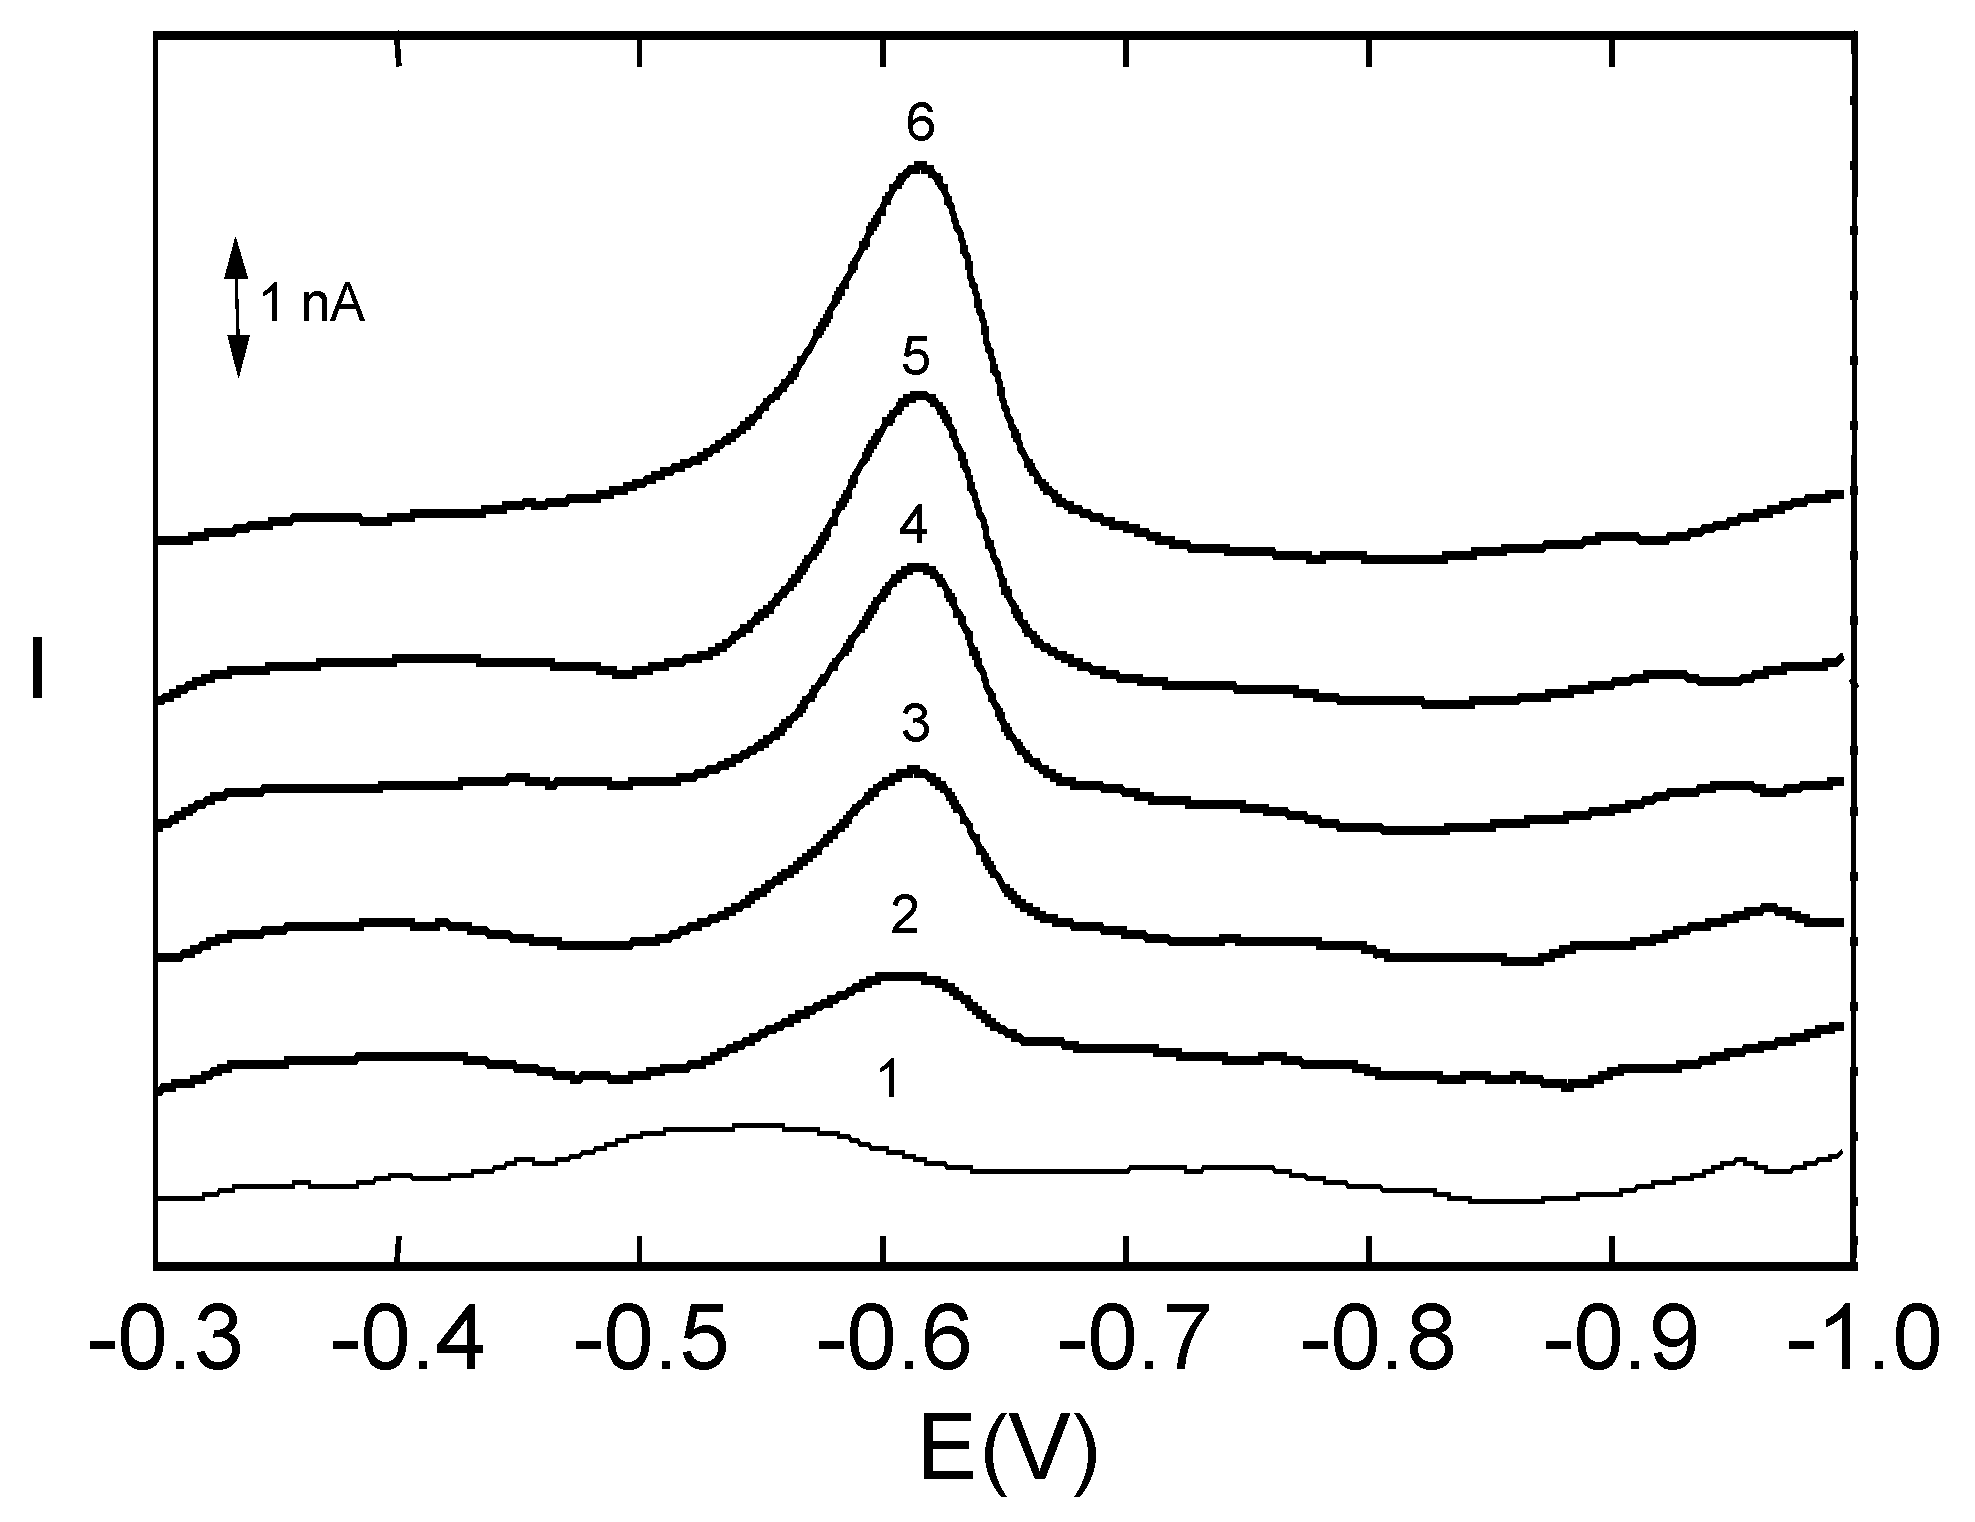
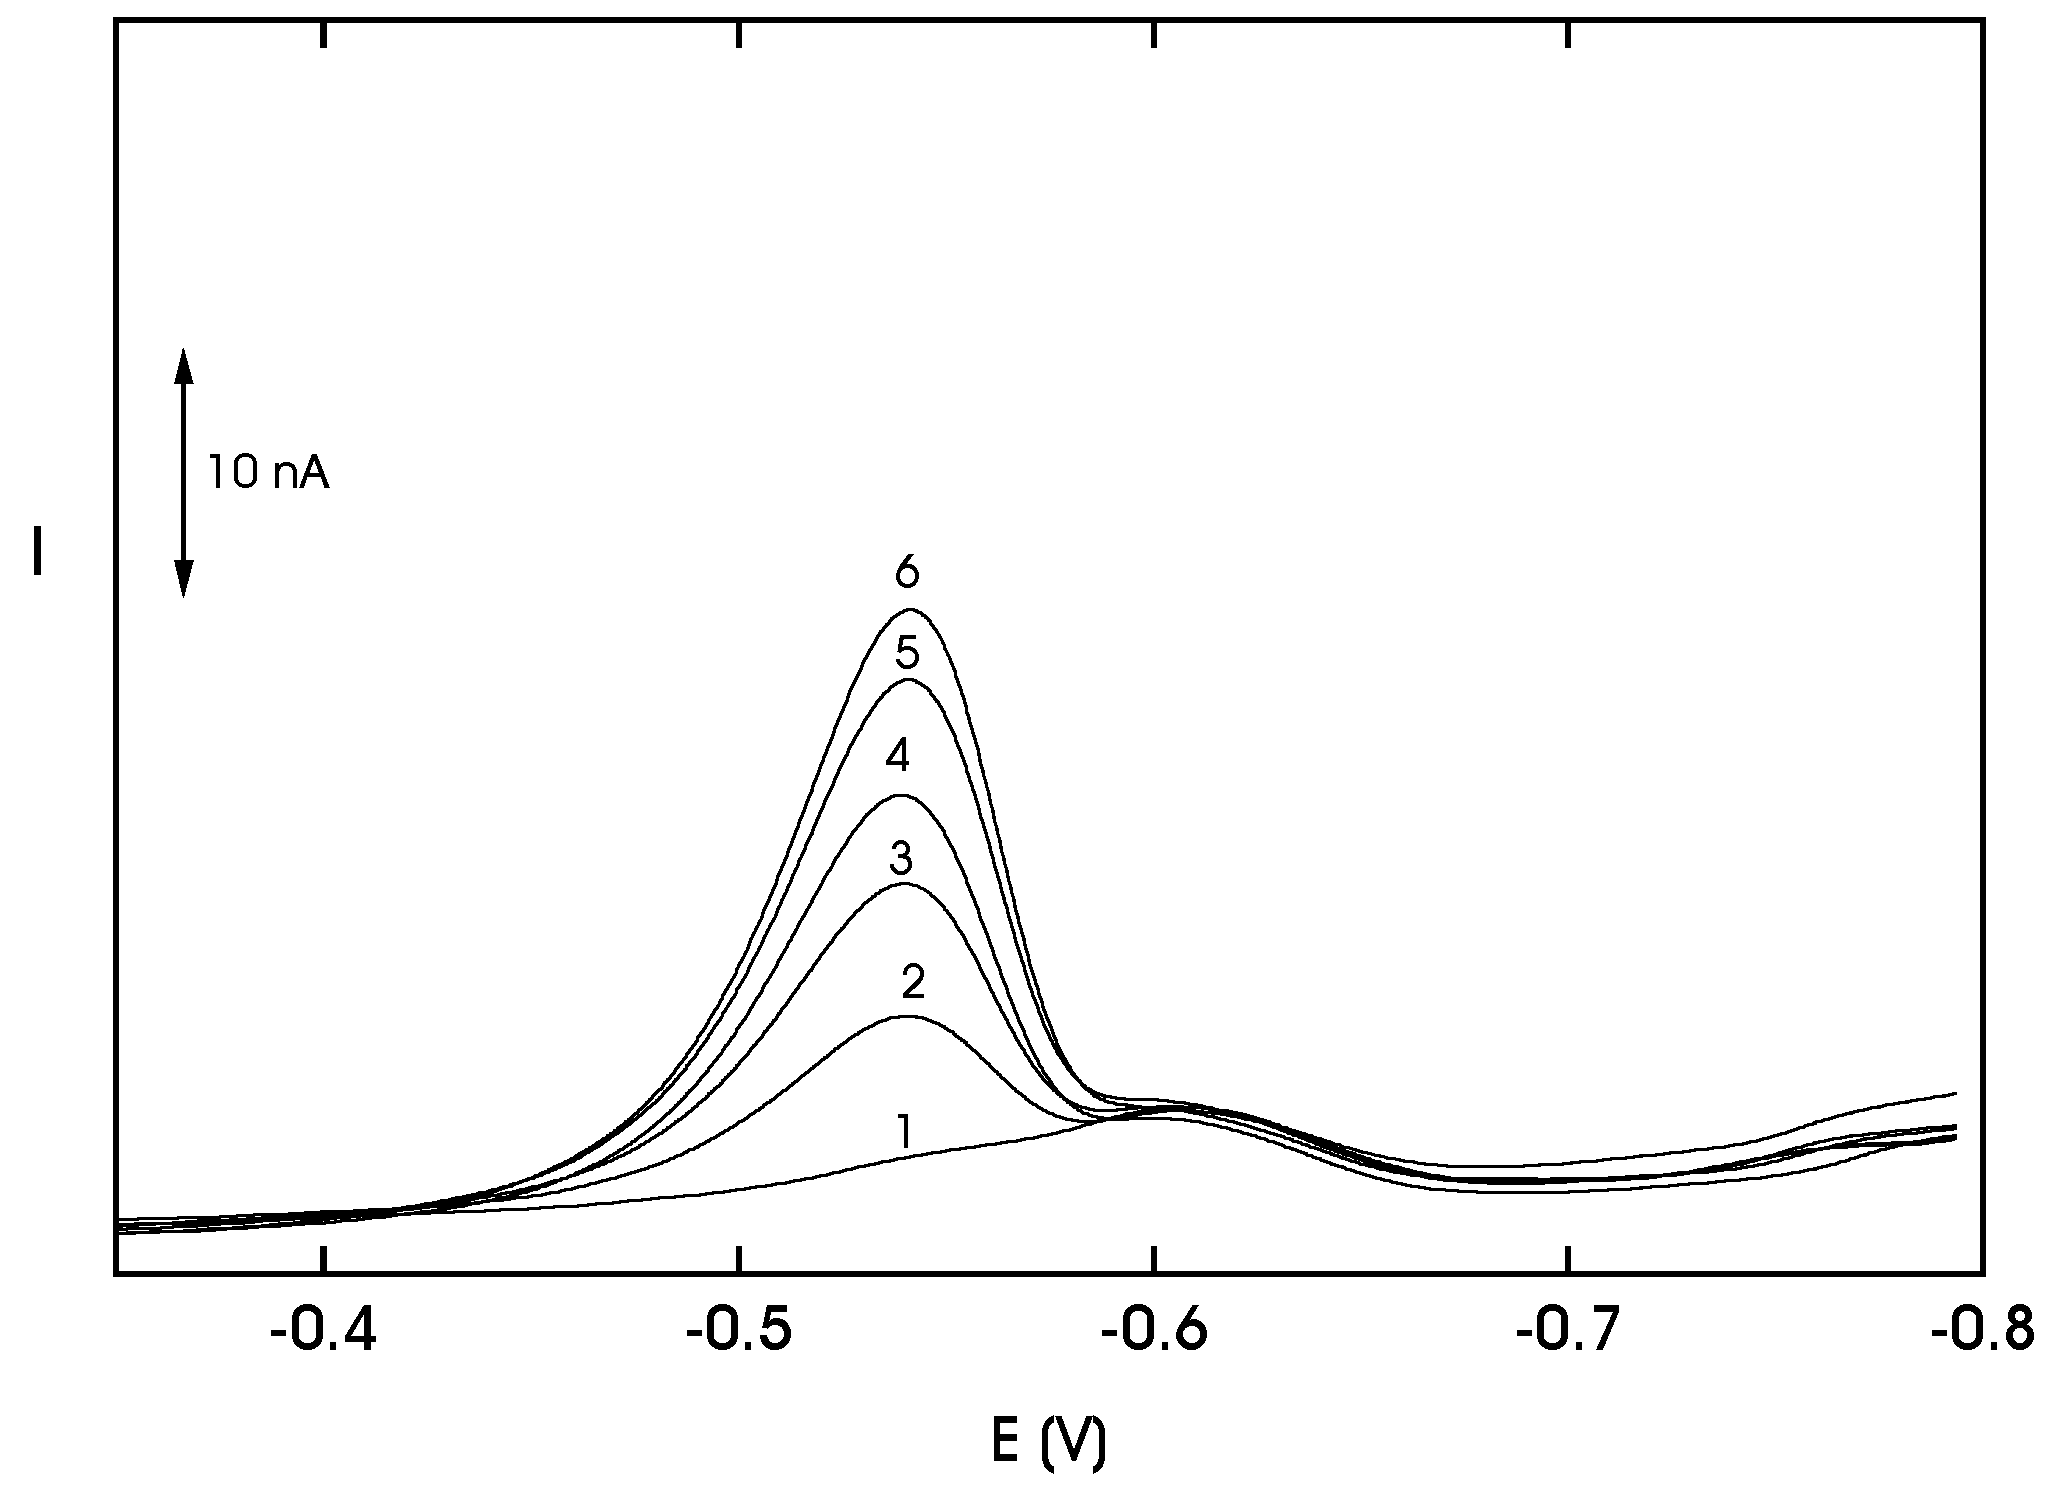
Differential Pulse Voltammetry of 2-Nitrobiphenyl at HMDE

| PHa | pHb | Ep 1(mV) | Ip 1(nA) | Ep 2(mV) | Ip 2(nA) |
|---|---|---|---|---|---|
| 2.0 | 2.6 | -213 | 46.7 | -- | -- |
| 3.0 | 4.0 | -314 | 45.9 | -- | -- |
| 4.0 | 4.9 | -402 | 39.6 | -- | -- |
| 5.0 | 5.9 | -465 | 31.5 | -415 | 28.5 |
| 6.0 | 7.1 | -514 | 45.2 | -- | -- |
| 7.0 | 8.1 | -580 | 47.9 | -- | -- |
| 8.0 | 8.7 | -615 | 40.8 | -- | -- |
| 9.0 | 9.3 | -645 | 35.1 | -- | -- |
| 10.0 | 10.2 | -696 | 38.5 | -605 | -18.5 |
| 11.0 | 11.2 | -705 | 29.4 | -634 | -29.4 |
| 12.0 | 12.0 | -695 | 46.5 | -- | -- |
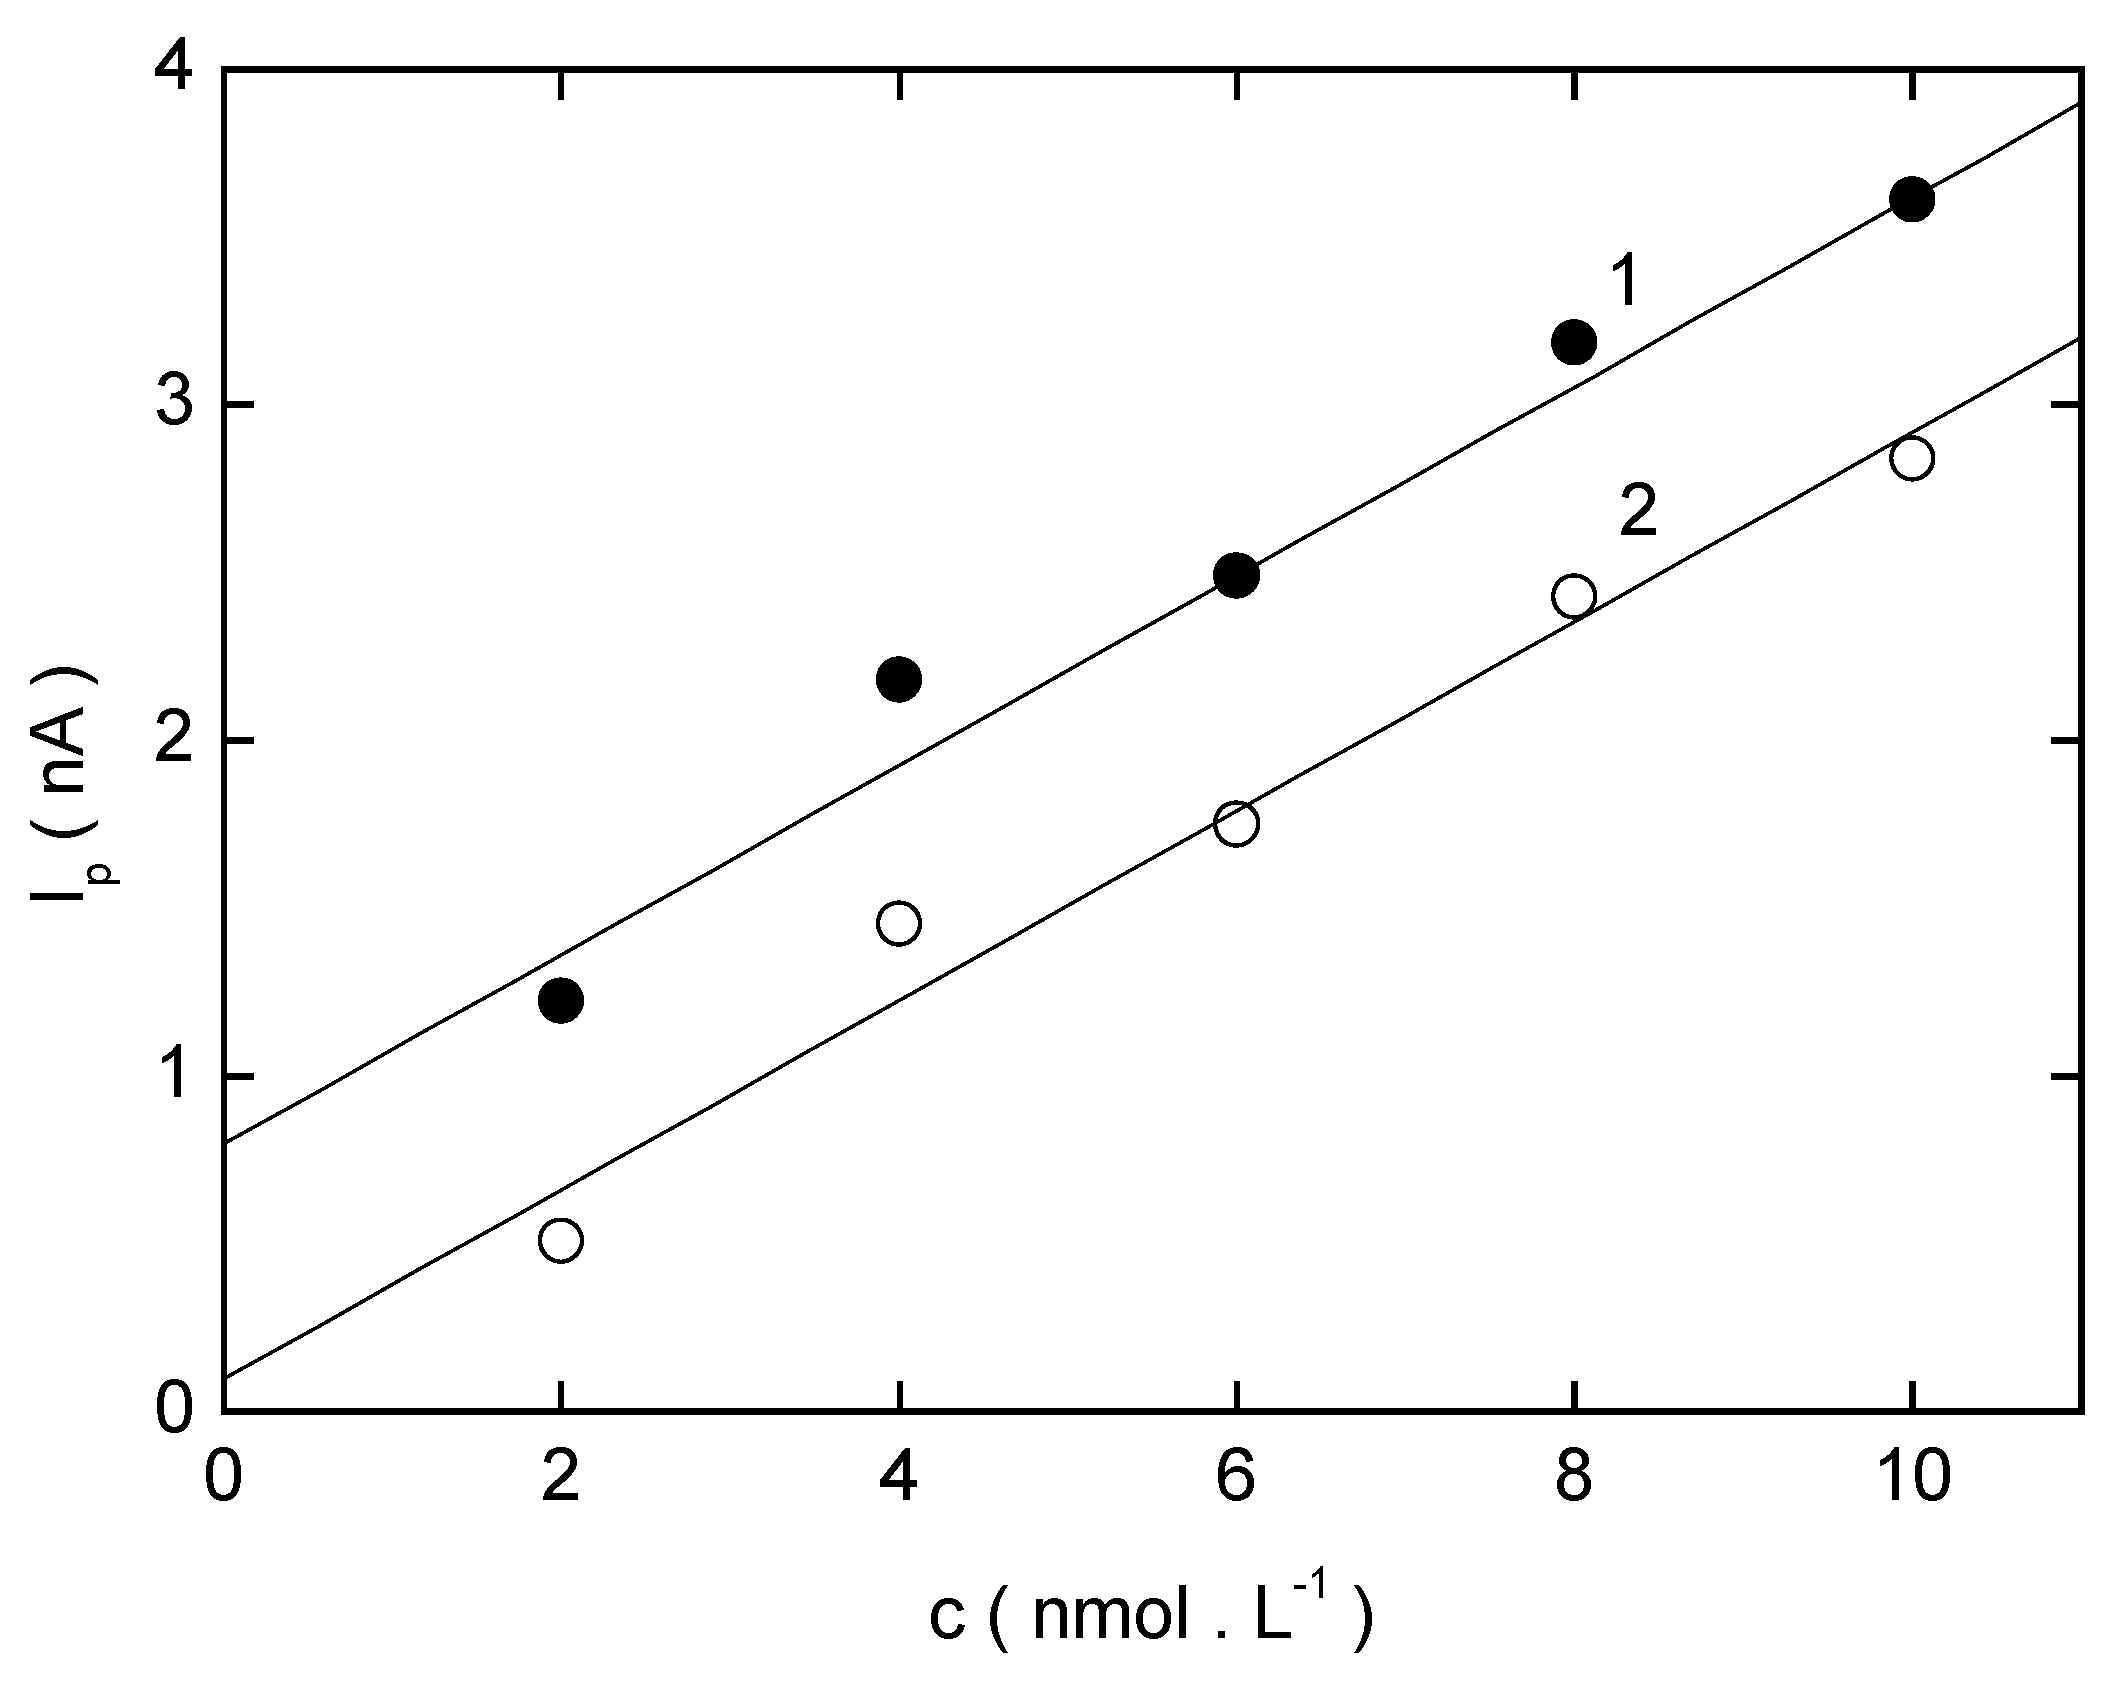
| c (mol·L−1) | Slope (mA mol−1 L) | Intercept (nA) | Correlation coefficient | L Q (mol·L−1) |
|---|---|---|---|---|
| (2-10) .10−6 | 5.3 | 0.5 | 0.9998 | ---- |
| (2-10) .10−7 | 5.3 | -0.1 | 0.9998 | ---- |
| (2-10) .10−8 | 4.8 | 0.0 | 0.9957 | 3.1 .10−8 |
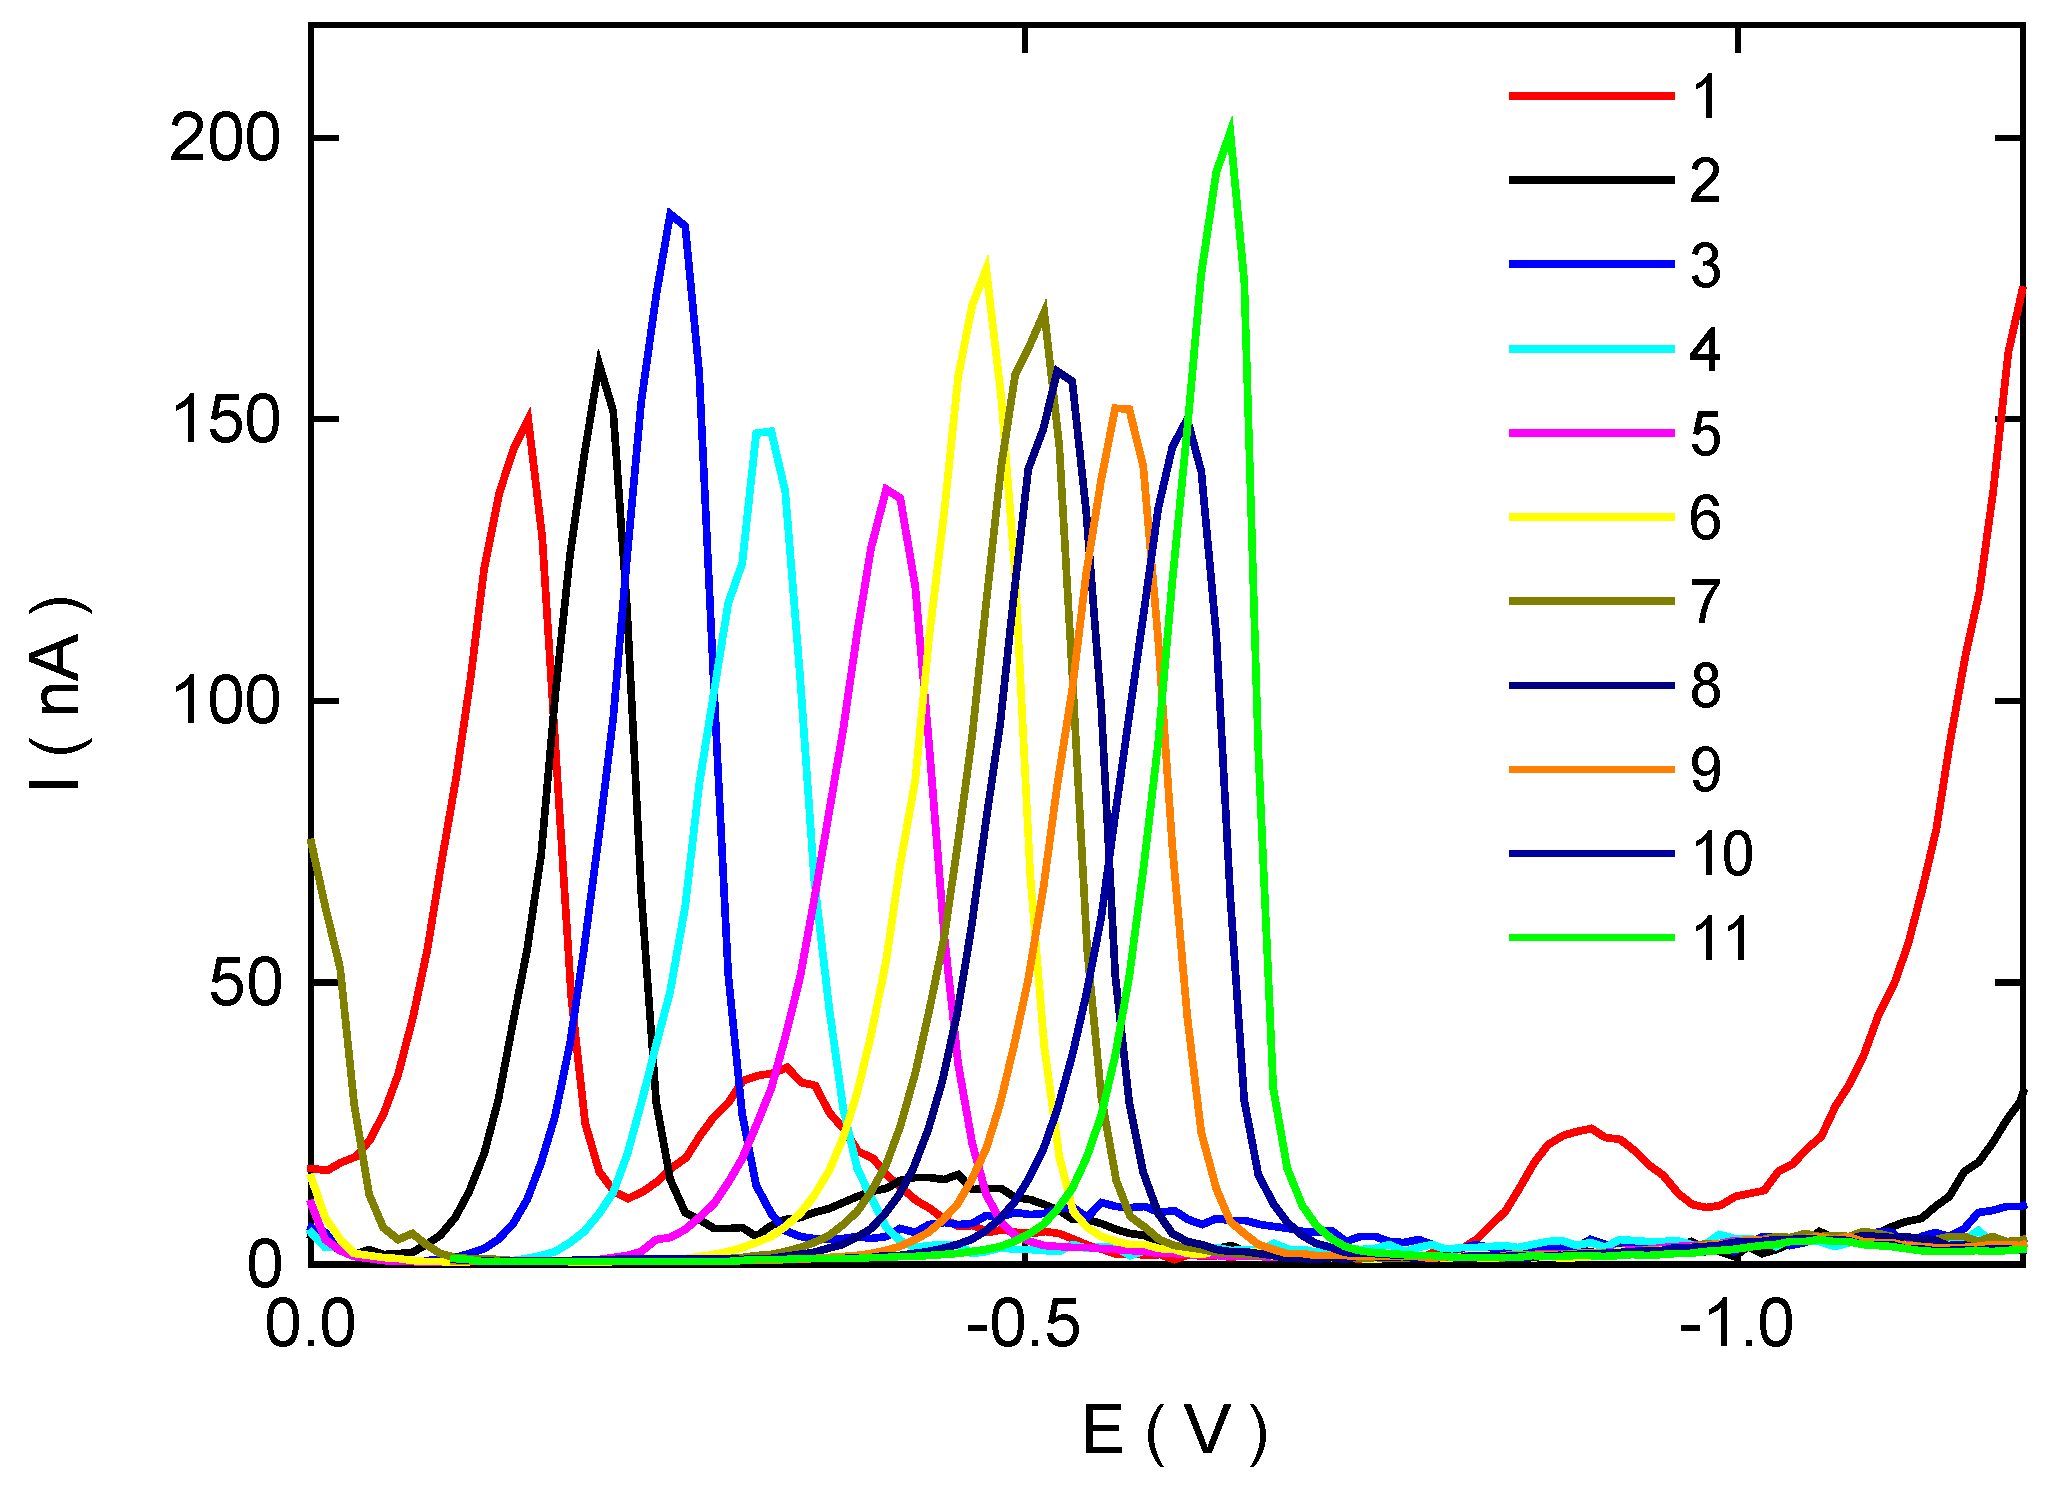
Differential Pulse Voltammetry of 3-Nitrobiphenyl at HMDE

| pHa | pHb | Ep 1(mV) | Ip 1(nA) | Ep 2(mV) | Ip 2(nA) |
|---|---|---|---|---|---|
| 2.0 | 2.6 | -92 | 133 | -323 | 26.5 |
| 3.0 | 4.0 | -151 | 156 | -433 | 12.1 |
| 4.0 | 4.9 | -202 | 183 | -554 | 6.2 |
| 5.0 | 5.9 | -272 | 146 | -- | -- |
| 6.0 | 7.1 | -380 | 137 | -- | -- |
| 7.0 | 8.1 | -423 | 176 | -- | -- |
| 8.0 | 8.7 | -464 | 168 | -- | -- |
| 9.0 | 9.3 | -473 | 158 | -- | -- |
| 10.0 | 10.2 | -563 | 151 | -- | -- |
| 11.0 | 11.2 | -614 | 149 | -- | -- |
| 12.0 | 12.0 | -644 | 200 | -- | -- |
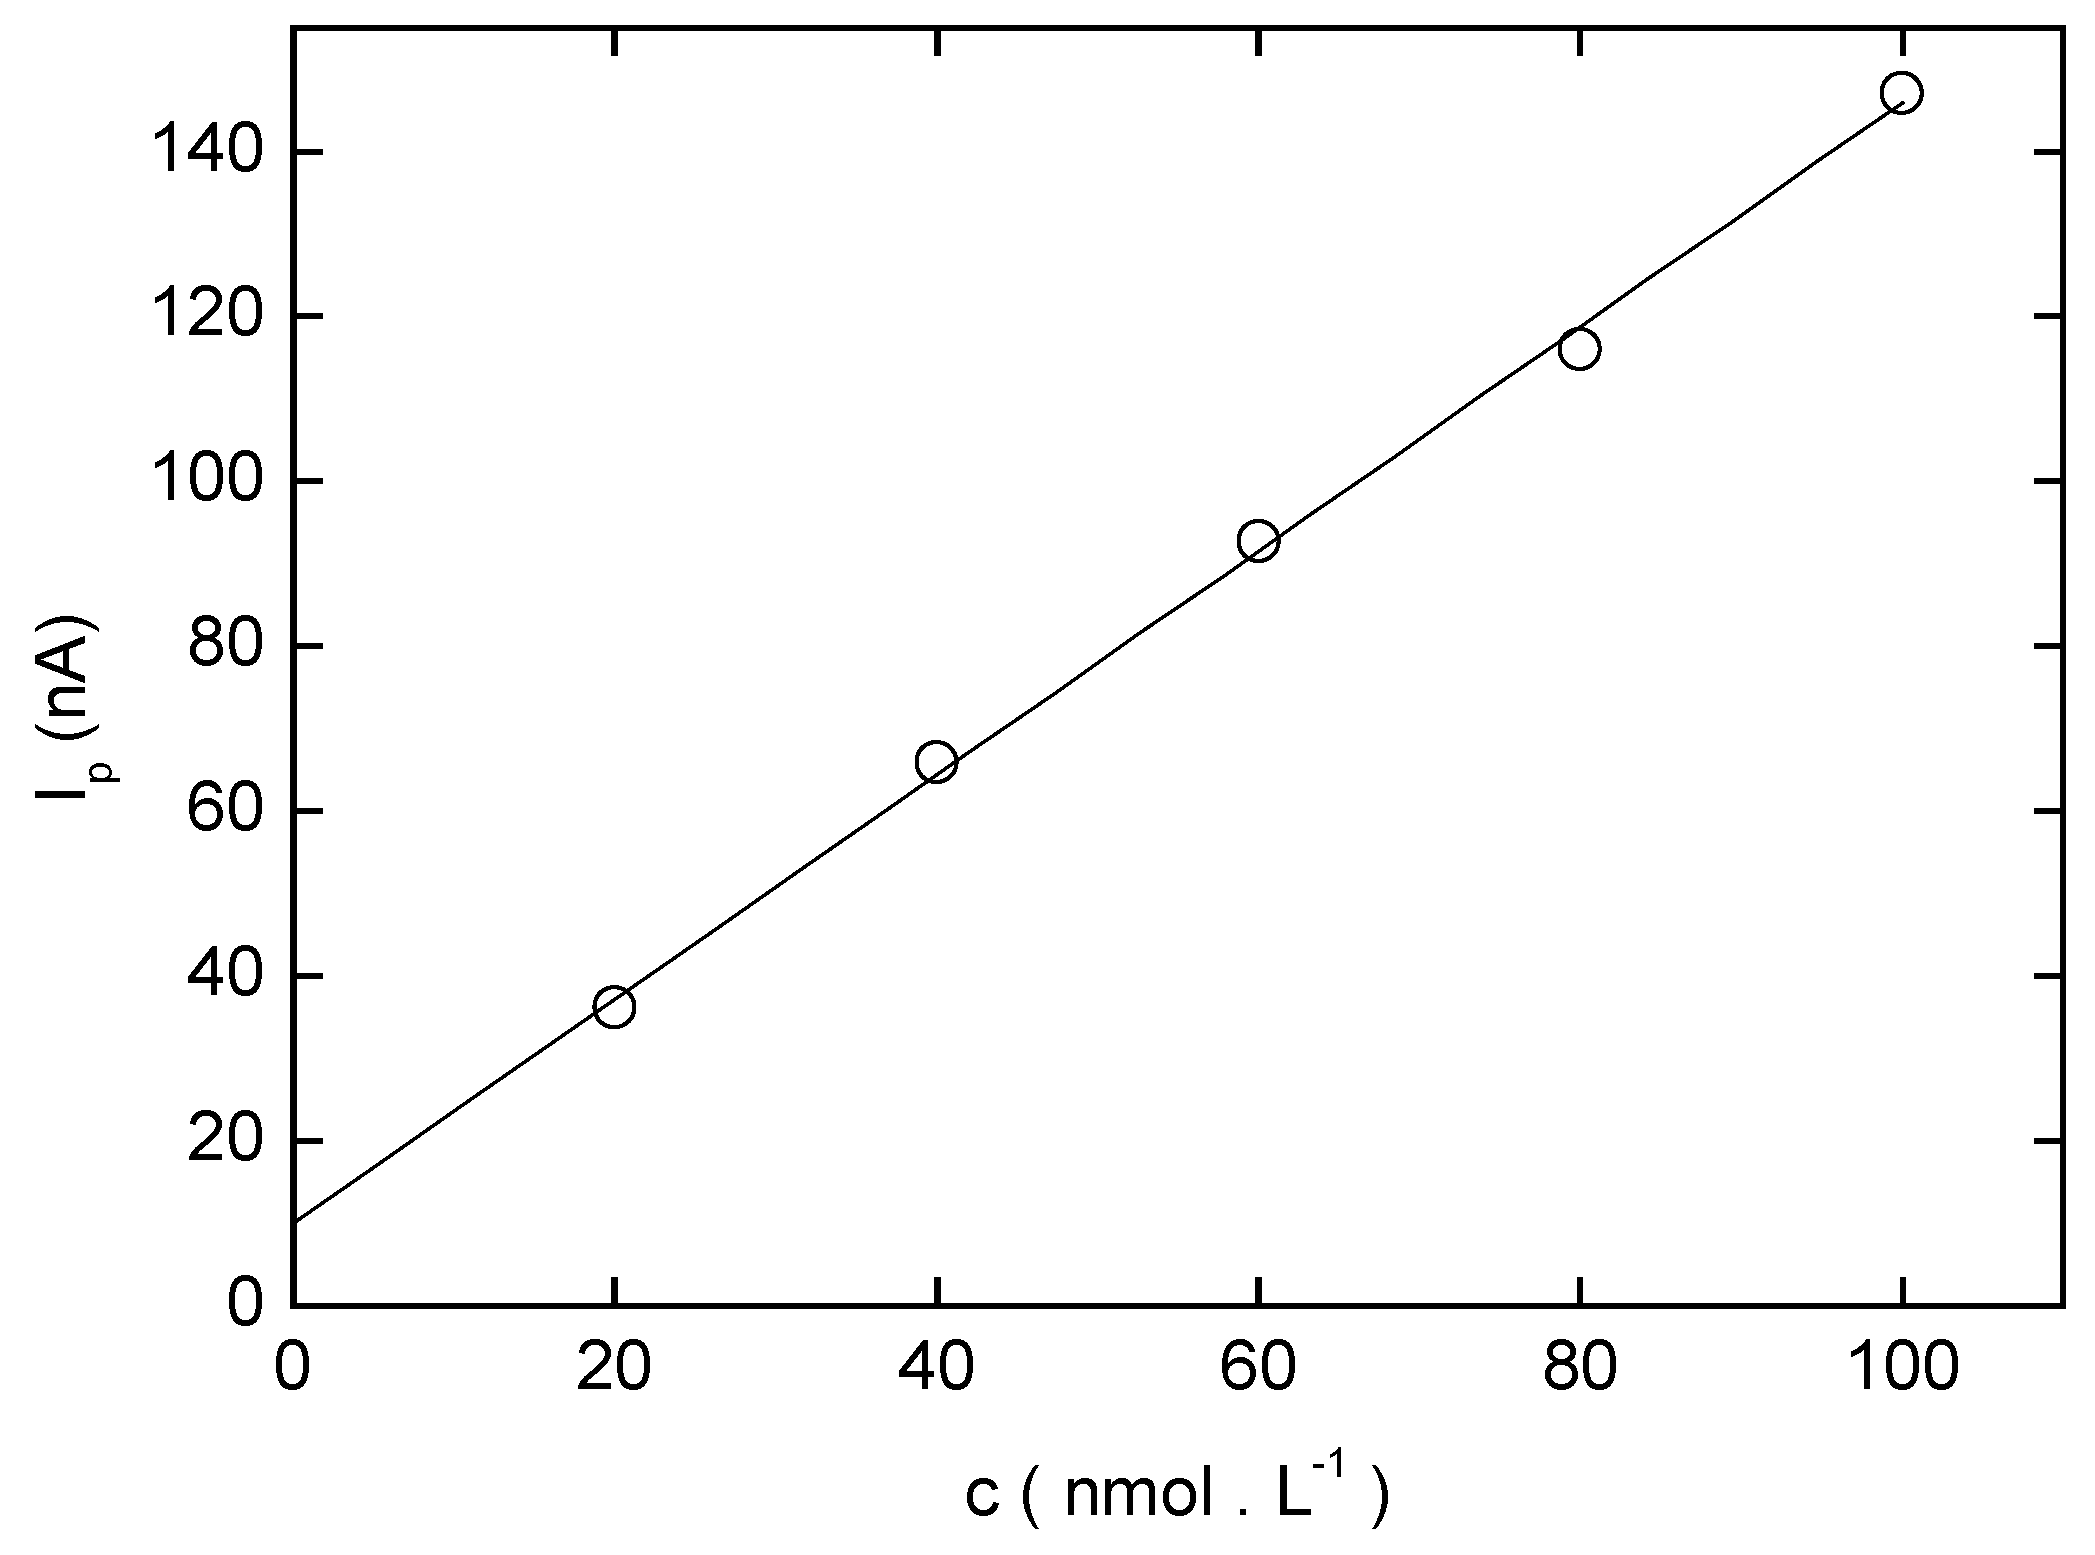
| c (mol L−1) | Slope (mA mol−1 L) | Intercept (nA) | Correlation coefficient | L Q (mol L−1) |
|---|---|---|---|---|
| (2-10) .10−6 | 20.8 | 6.9 | 0.9975 | ---- |
| (2-10) .10−7 | 24.8 | 0.1 | 0.9984 | ---- |
| (2-10) .10−8 | 24.9 | 0.1 | 0.9997 | 2.7.10−8 |

Differential Pulse Voltammetry of 4-Nitrobiphenyl at HMDE

| pHa | pHb | Ep 1(mV) | Ip 1(nA) | Ep 2(mV) | Ip 2(nA) |
|---|---|---|---|---|---|
| 2.0 | 2.6 | -151 | 139 | -312 | 32.3 |
| 3.0 | 4.0 | -223 | 195 | -444 | 13.3 |
| 4.0 | 4.9 | -273 | 200 | -555 | 6.1 |
| 5.0 | 5.9 | -322 | 160 | -- | -- |
| 6.0 | 7.1 | -403 | 162 | -- | -- |
| 7.0 | 8.1 | -473 | 182 | -- | -- |
| 8.0 | 8.7 | -503 | 160 | -- | -- |
| 9.0 | 9.3 | -523 | 186 | -- | -- |
| 10.0 | 10.2 | -563 | 163 | -- | -- |
| 11.0 | 11.2 | -614 | 157 | -- | -- |
| 12.0 | 12.0 | -644 | 203 | -- | -- |
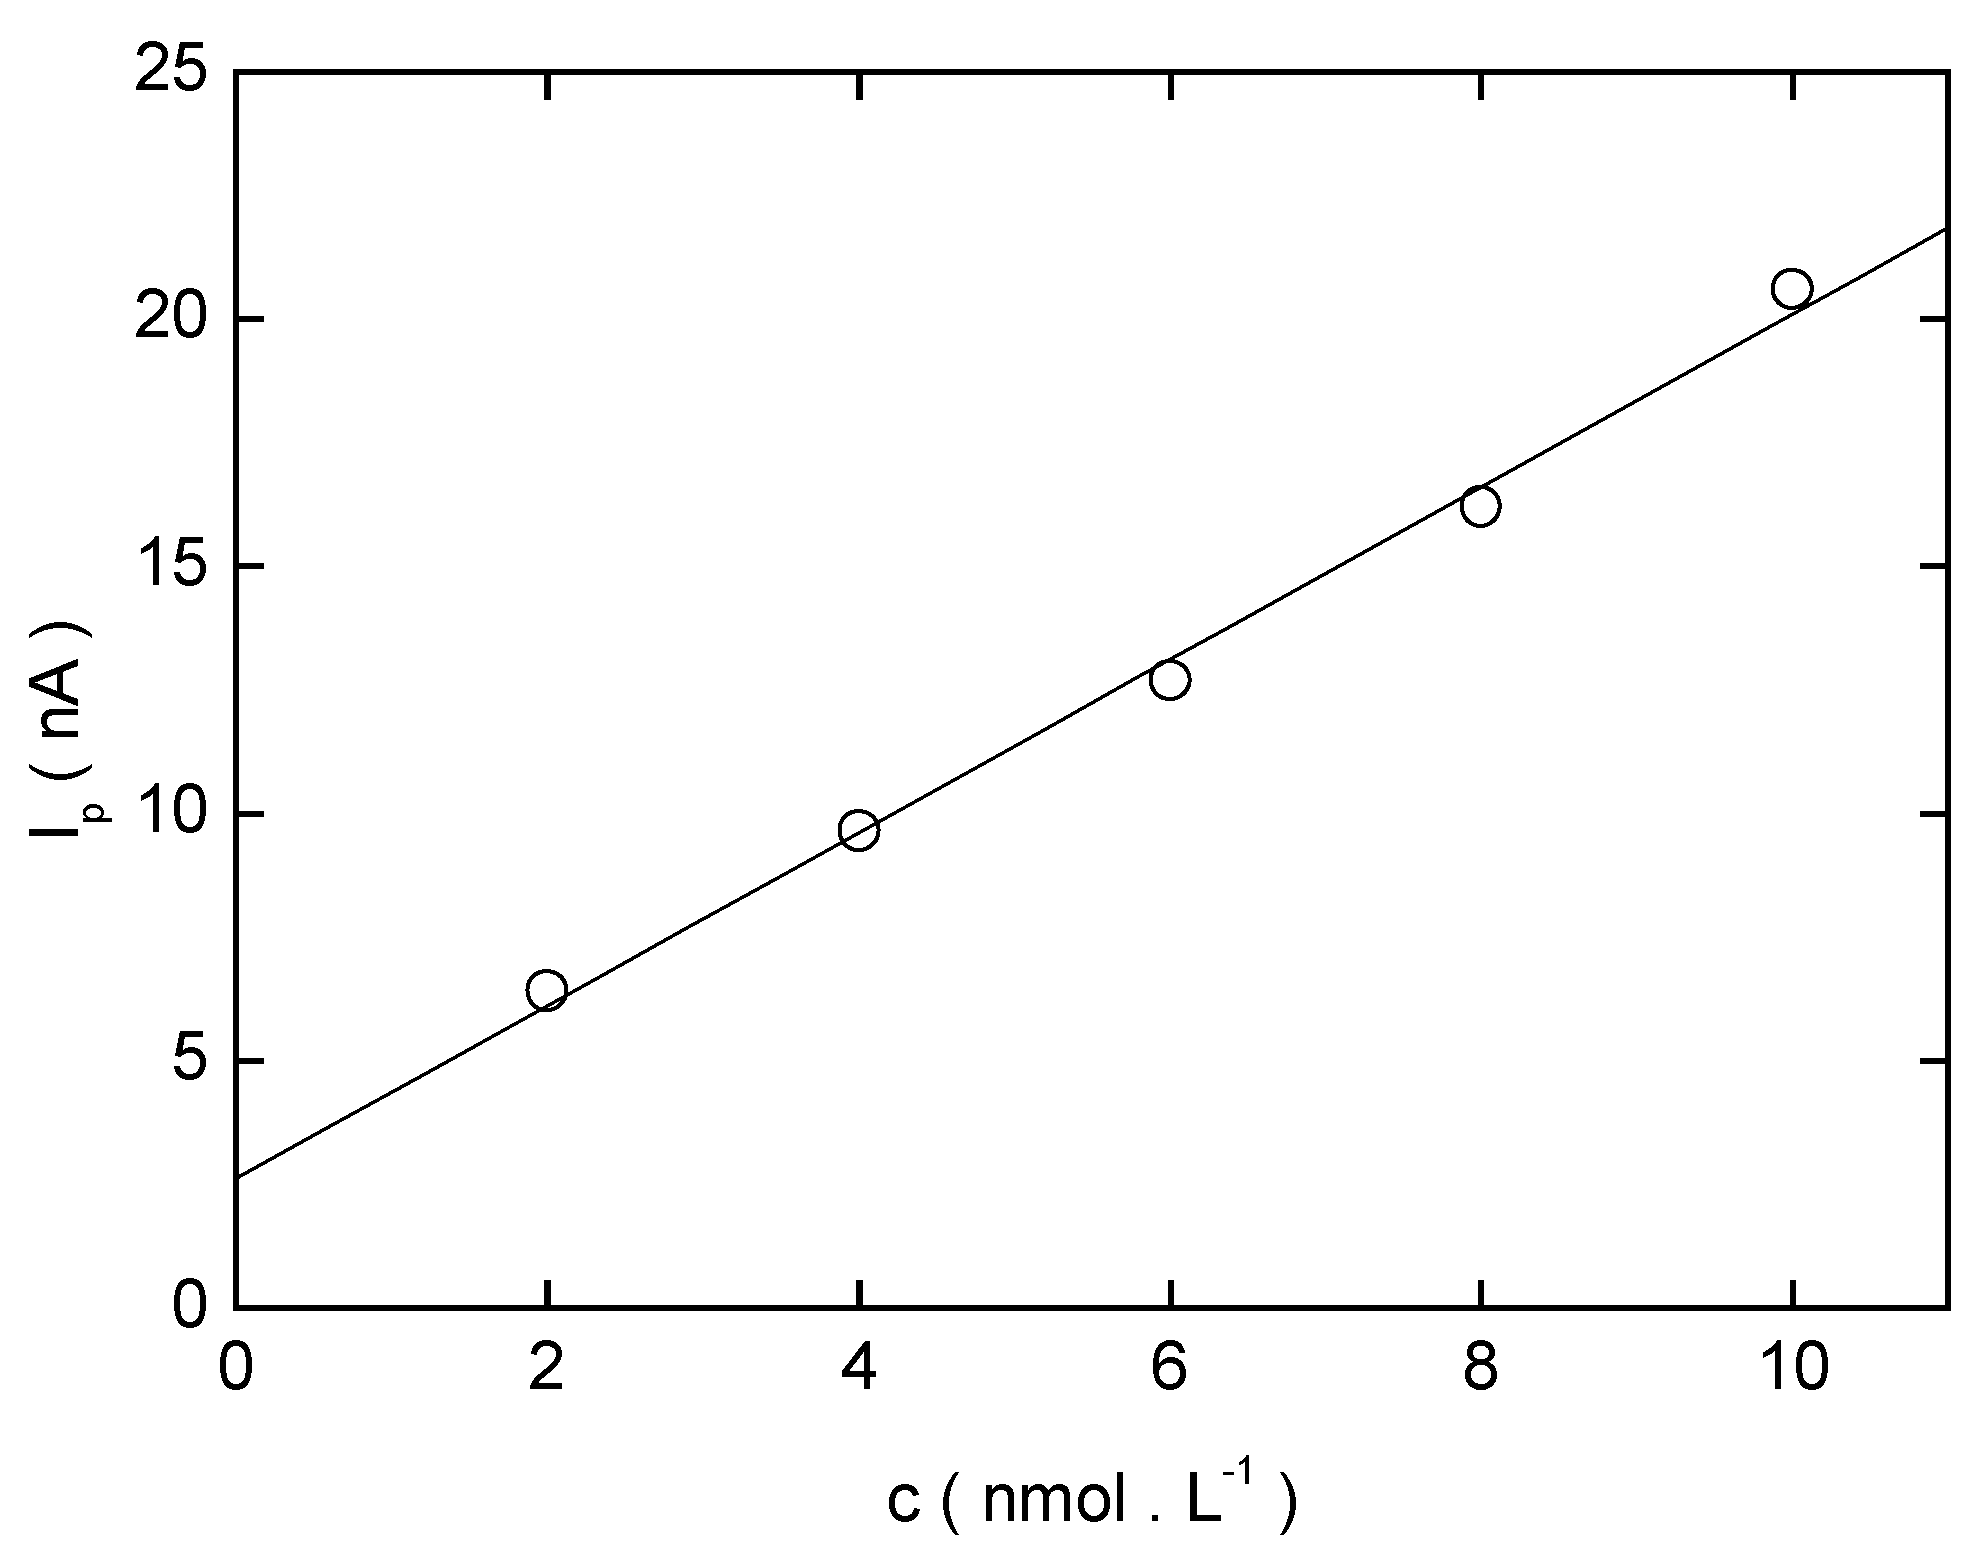
| c (mol L−1) | Slope (mA mol−1 L) | Intercept (nA) | Correlation coefficient | L Q (mol L−1) |
|---|---|---|---|---|
| (2-10) .10−6 | 21.1 | 10.9 | 0.9999 | ---- |
| (2-10) .10−7 | 24.4 | 1.4 | 0.9961 | ---- |
| (2-10) .10−8 | 25.8 | 0.1 | 0.9965 | 2.5.10−8 |

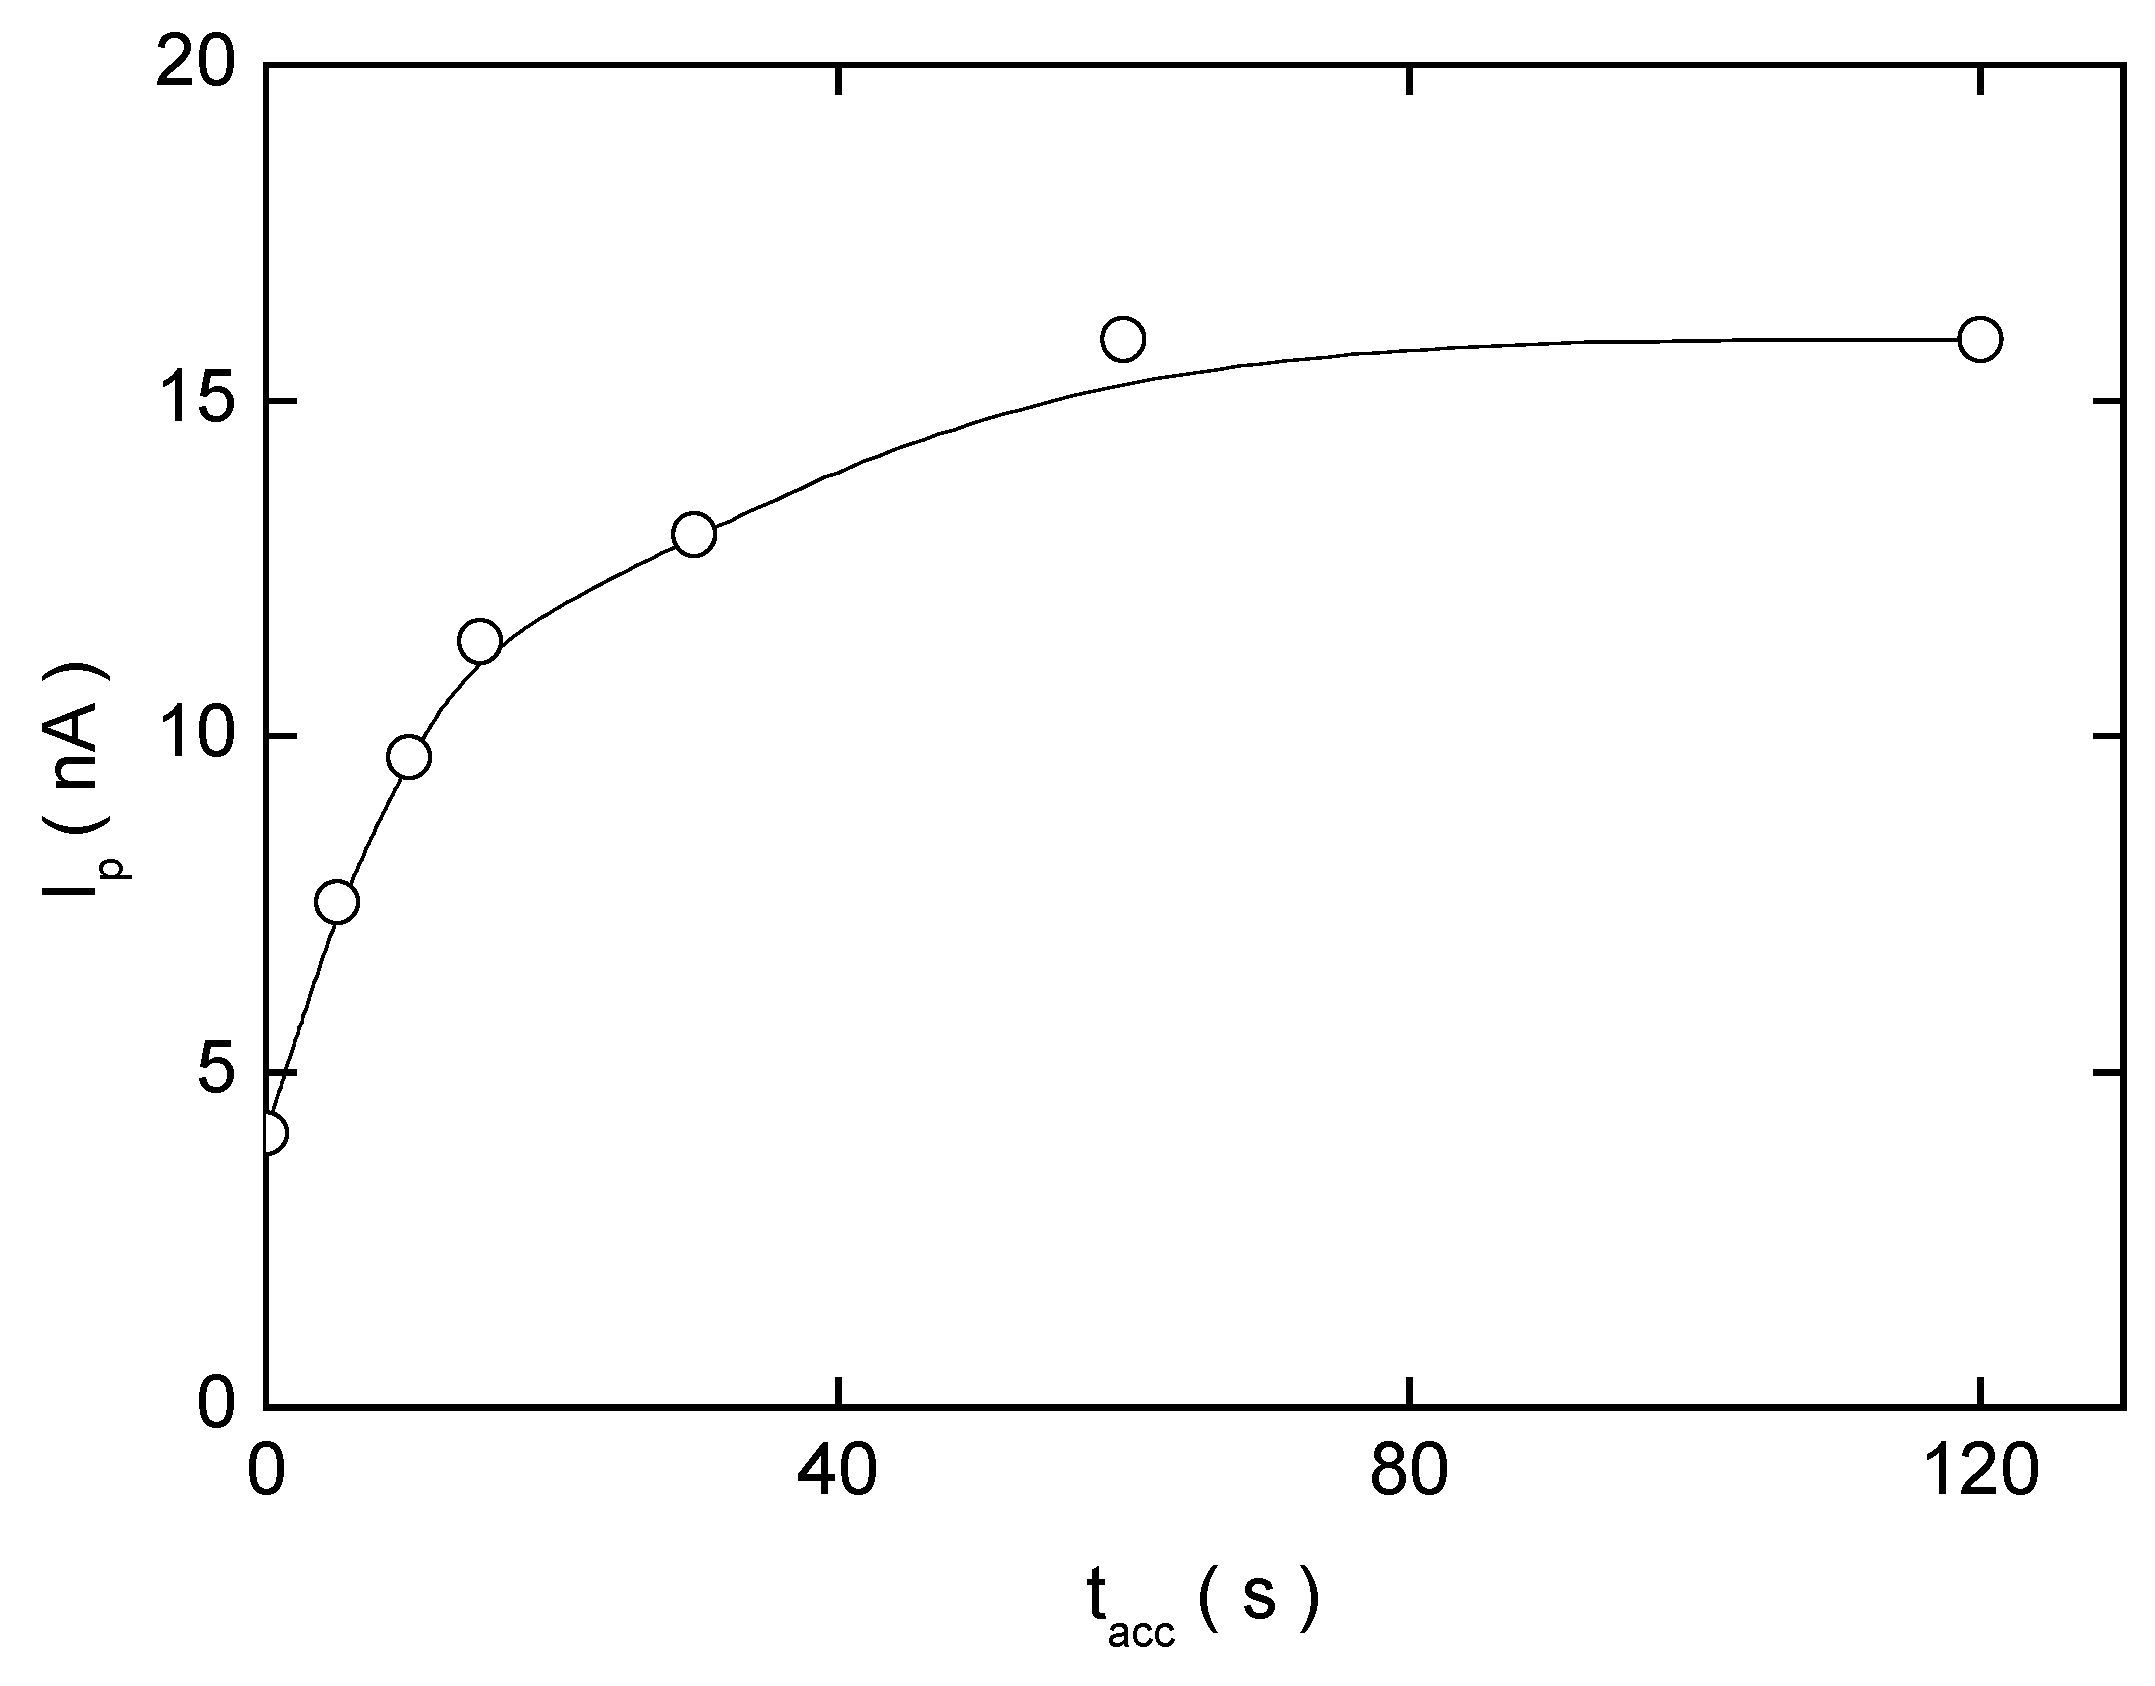
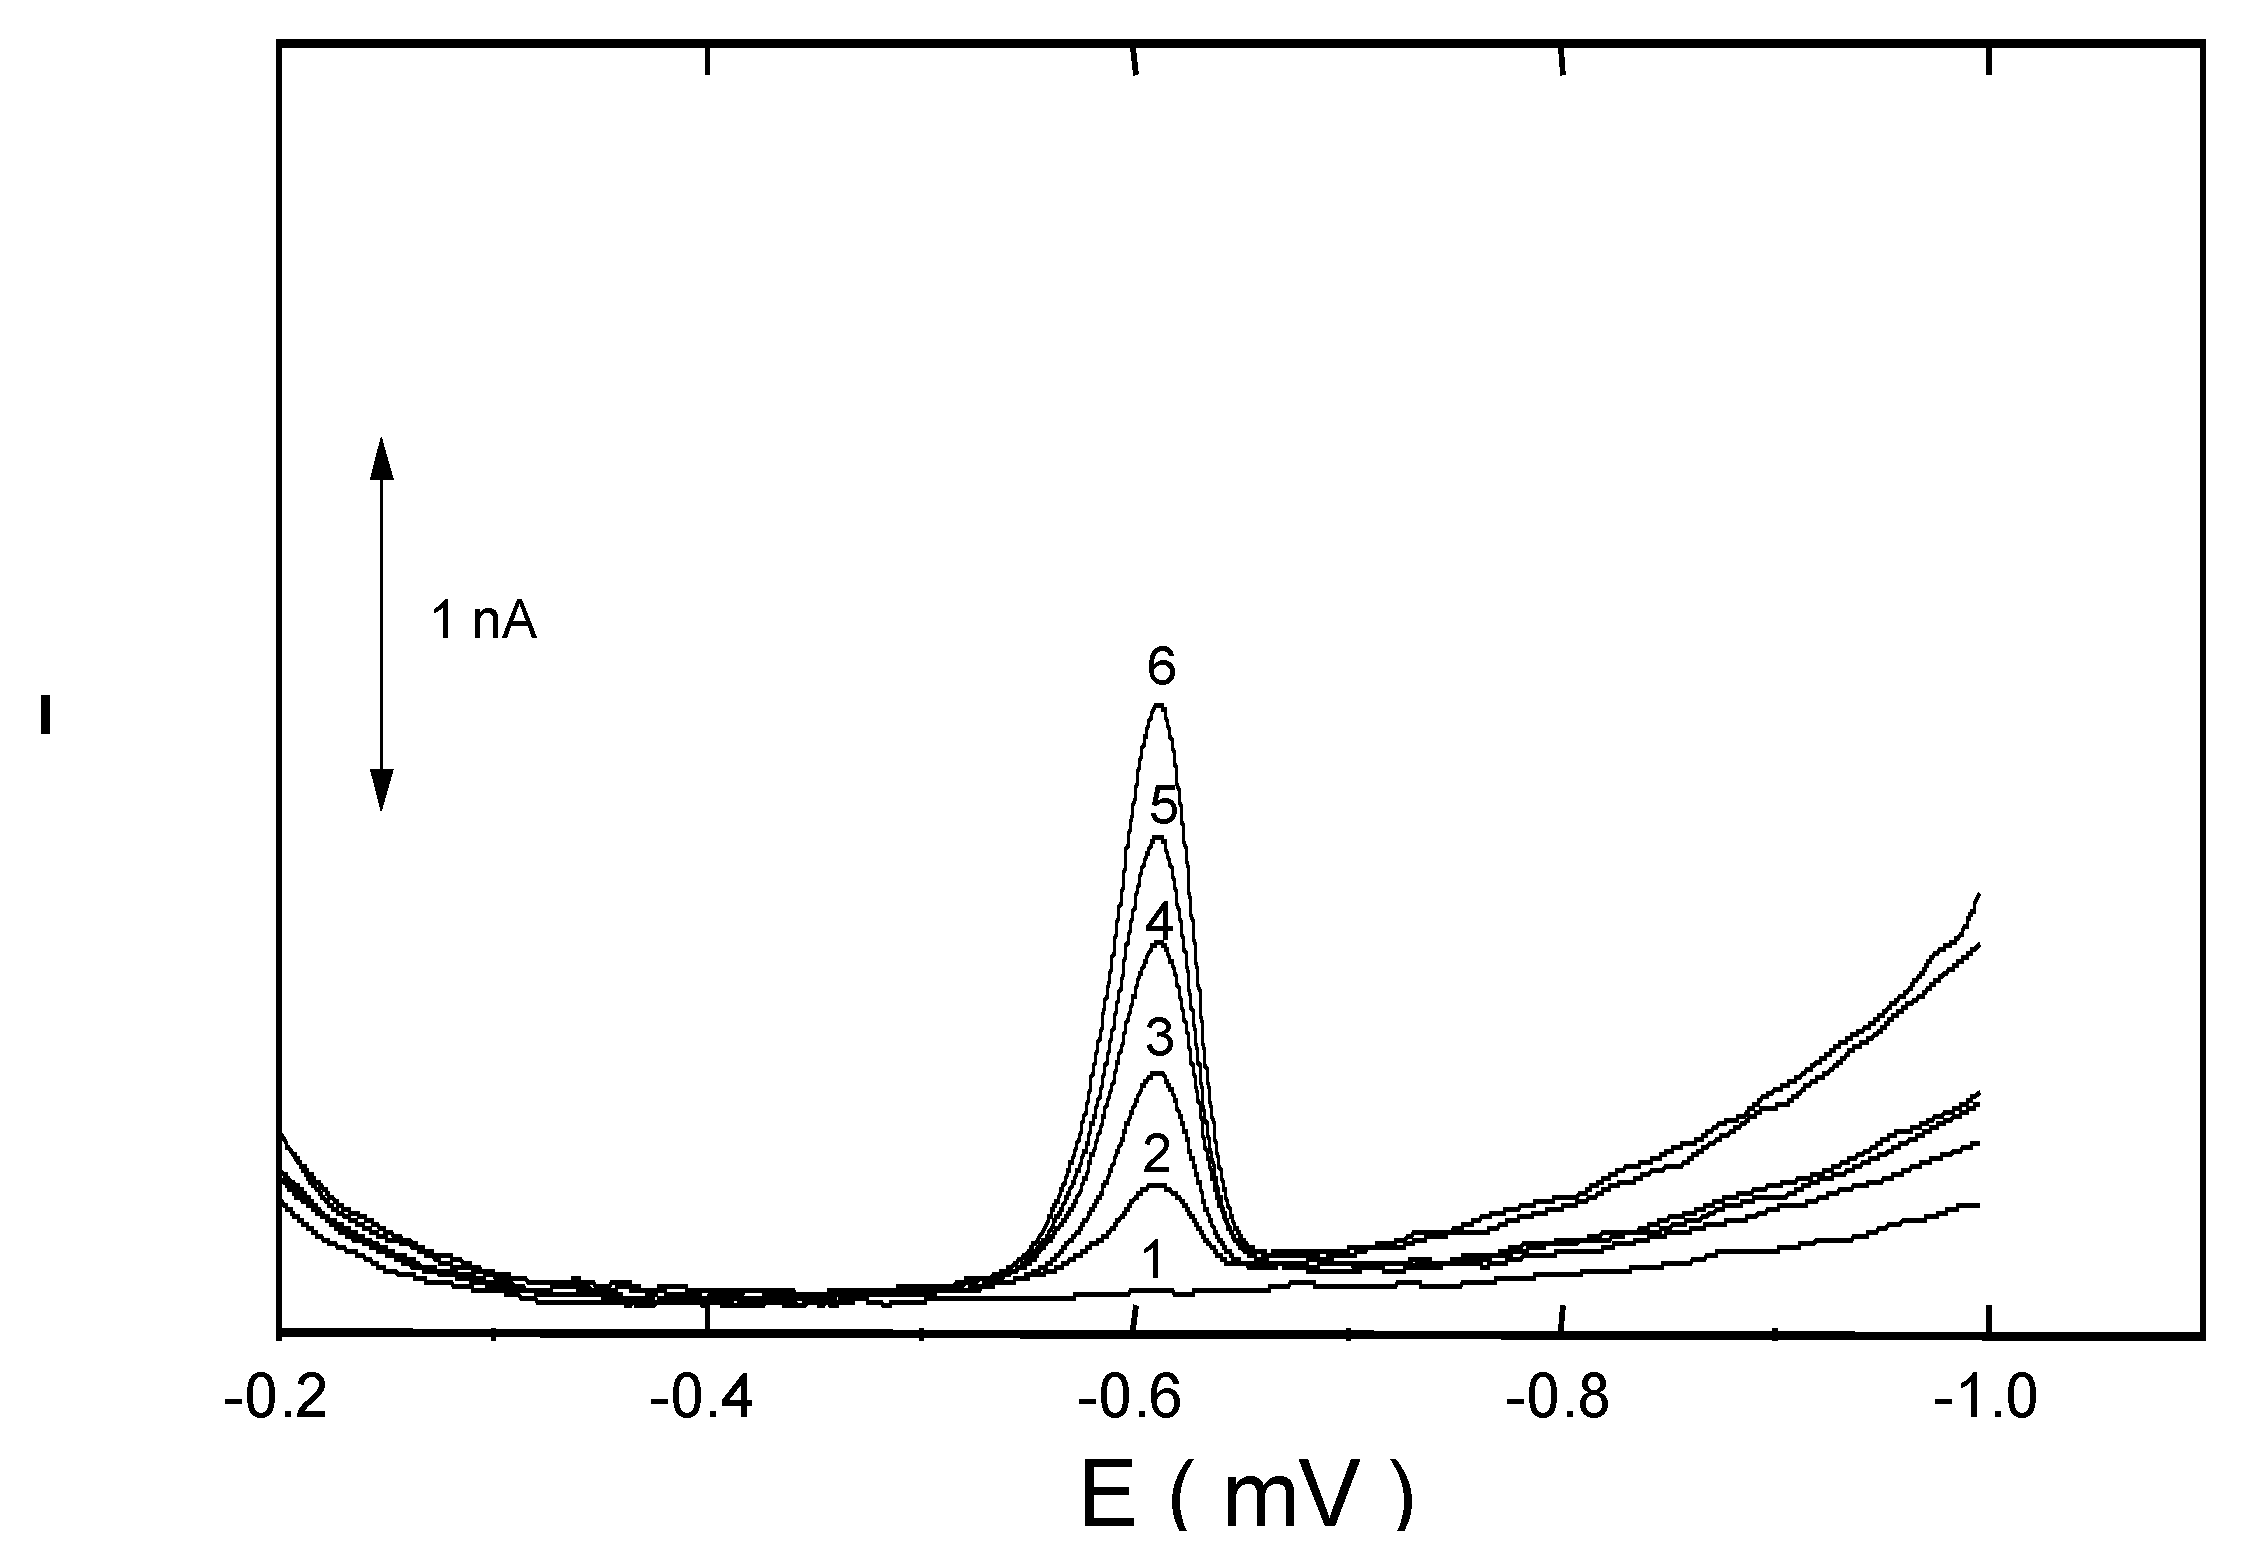
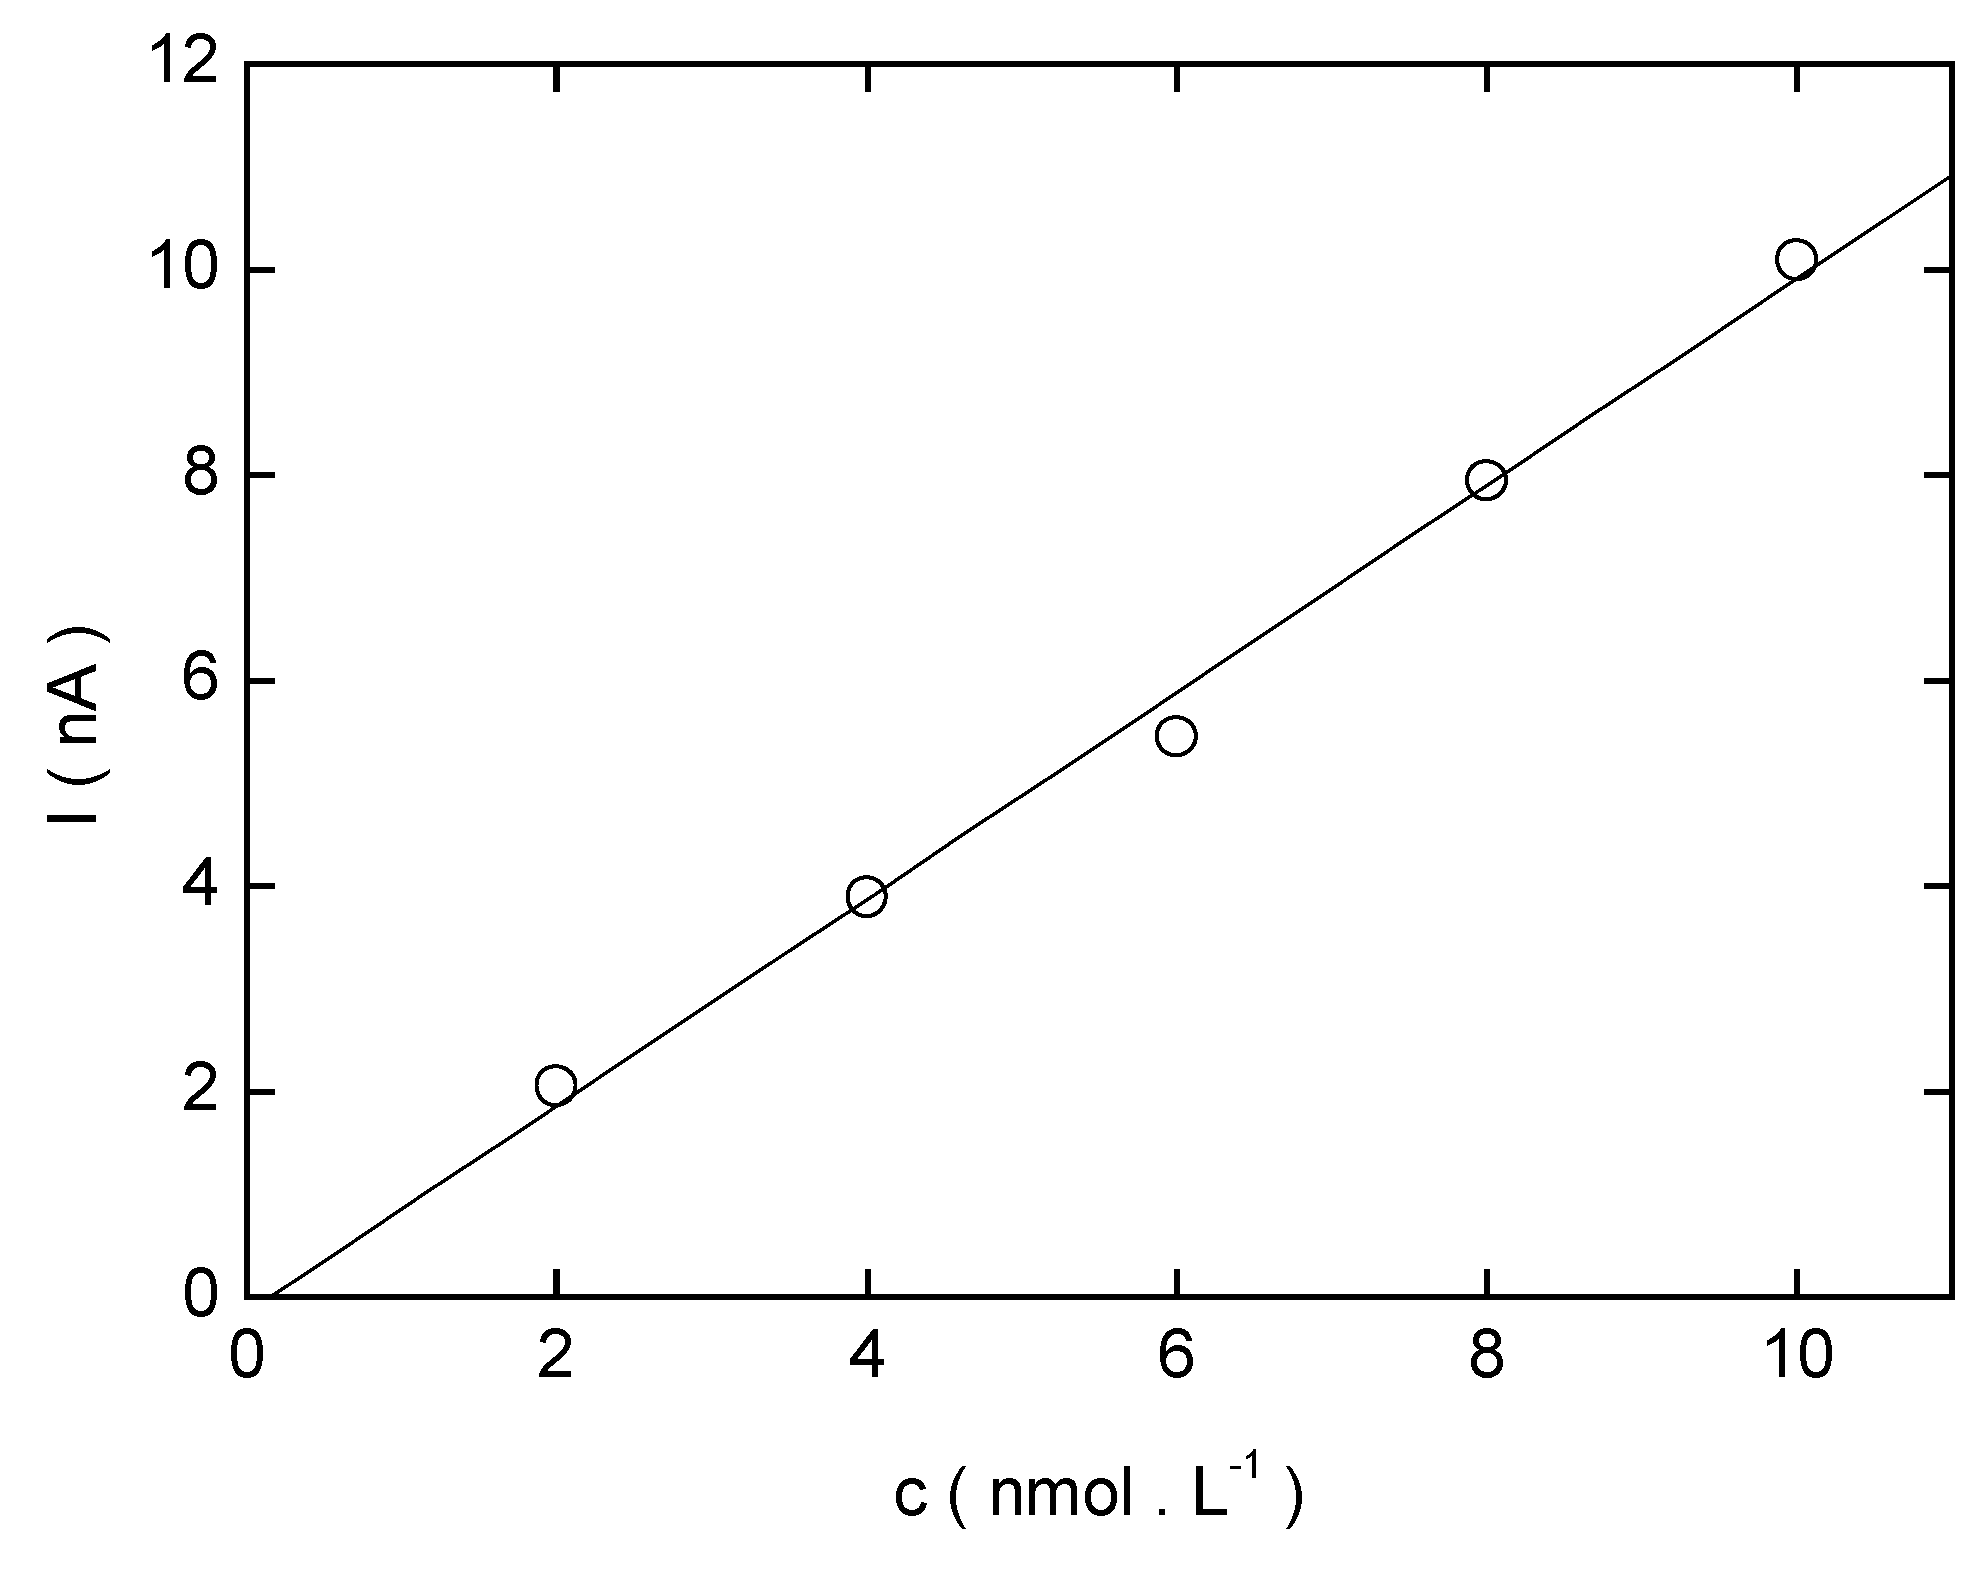
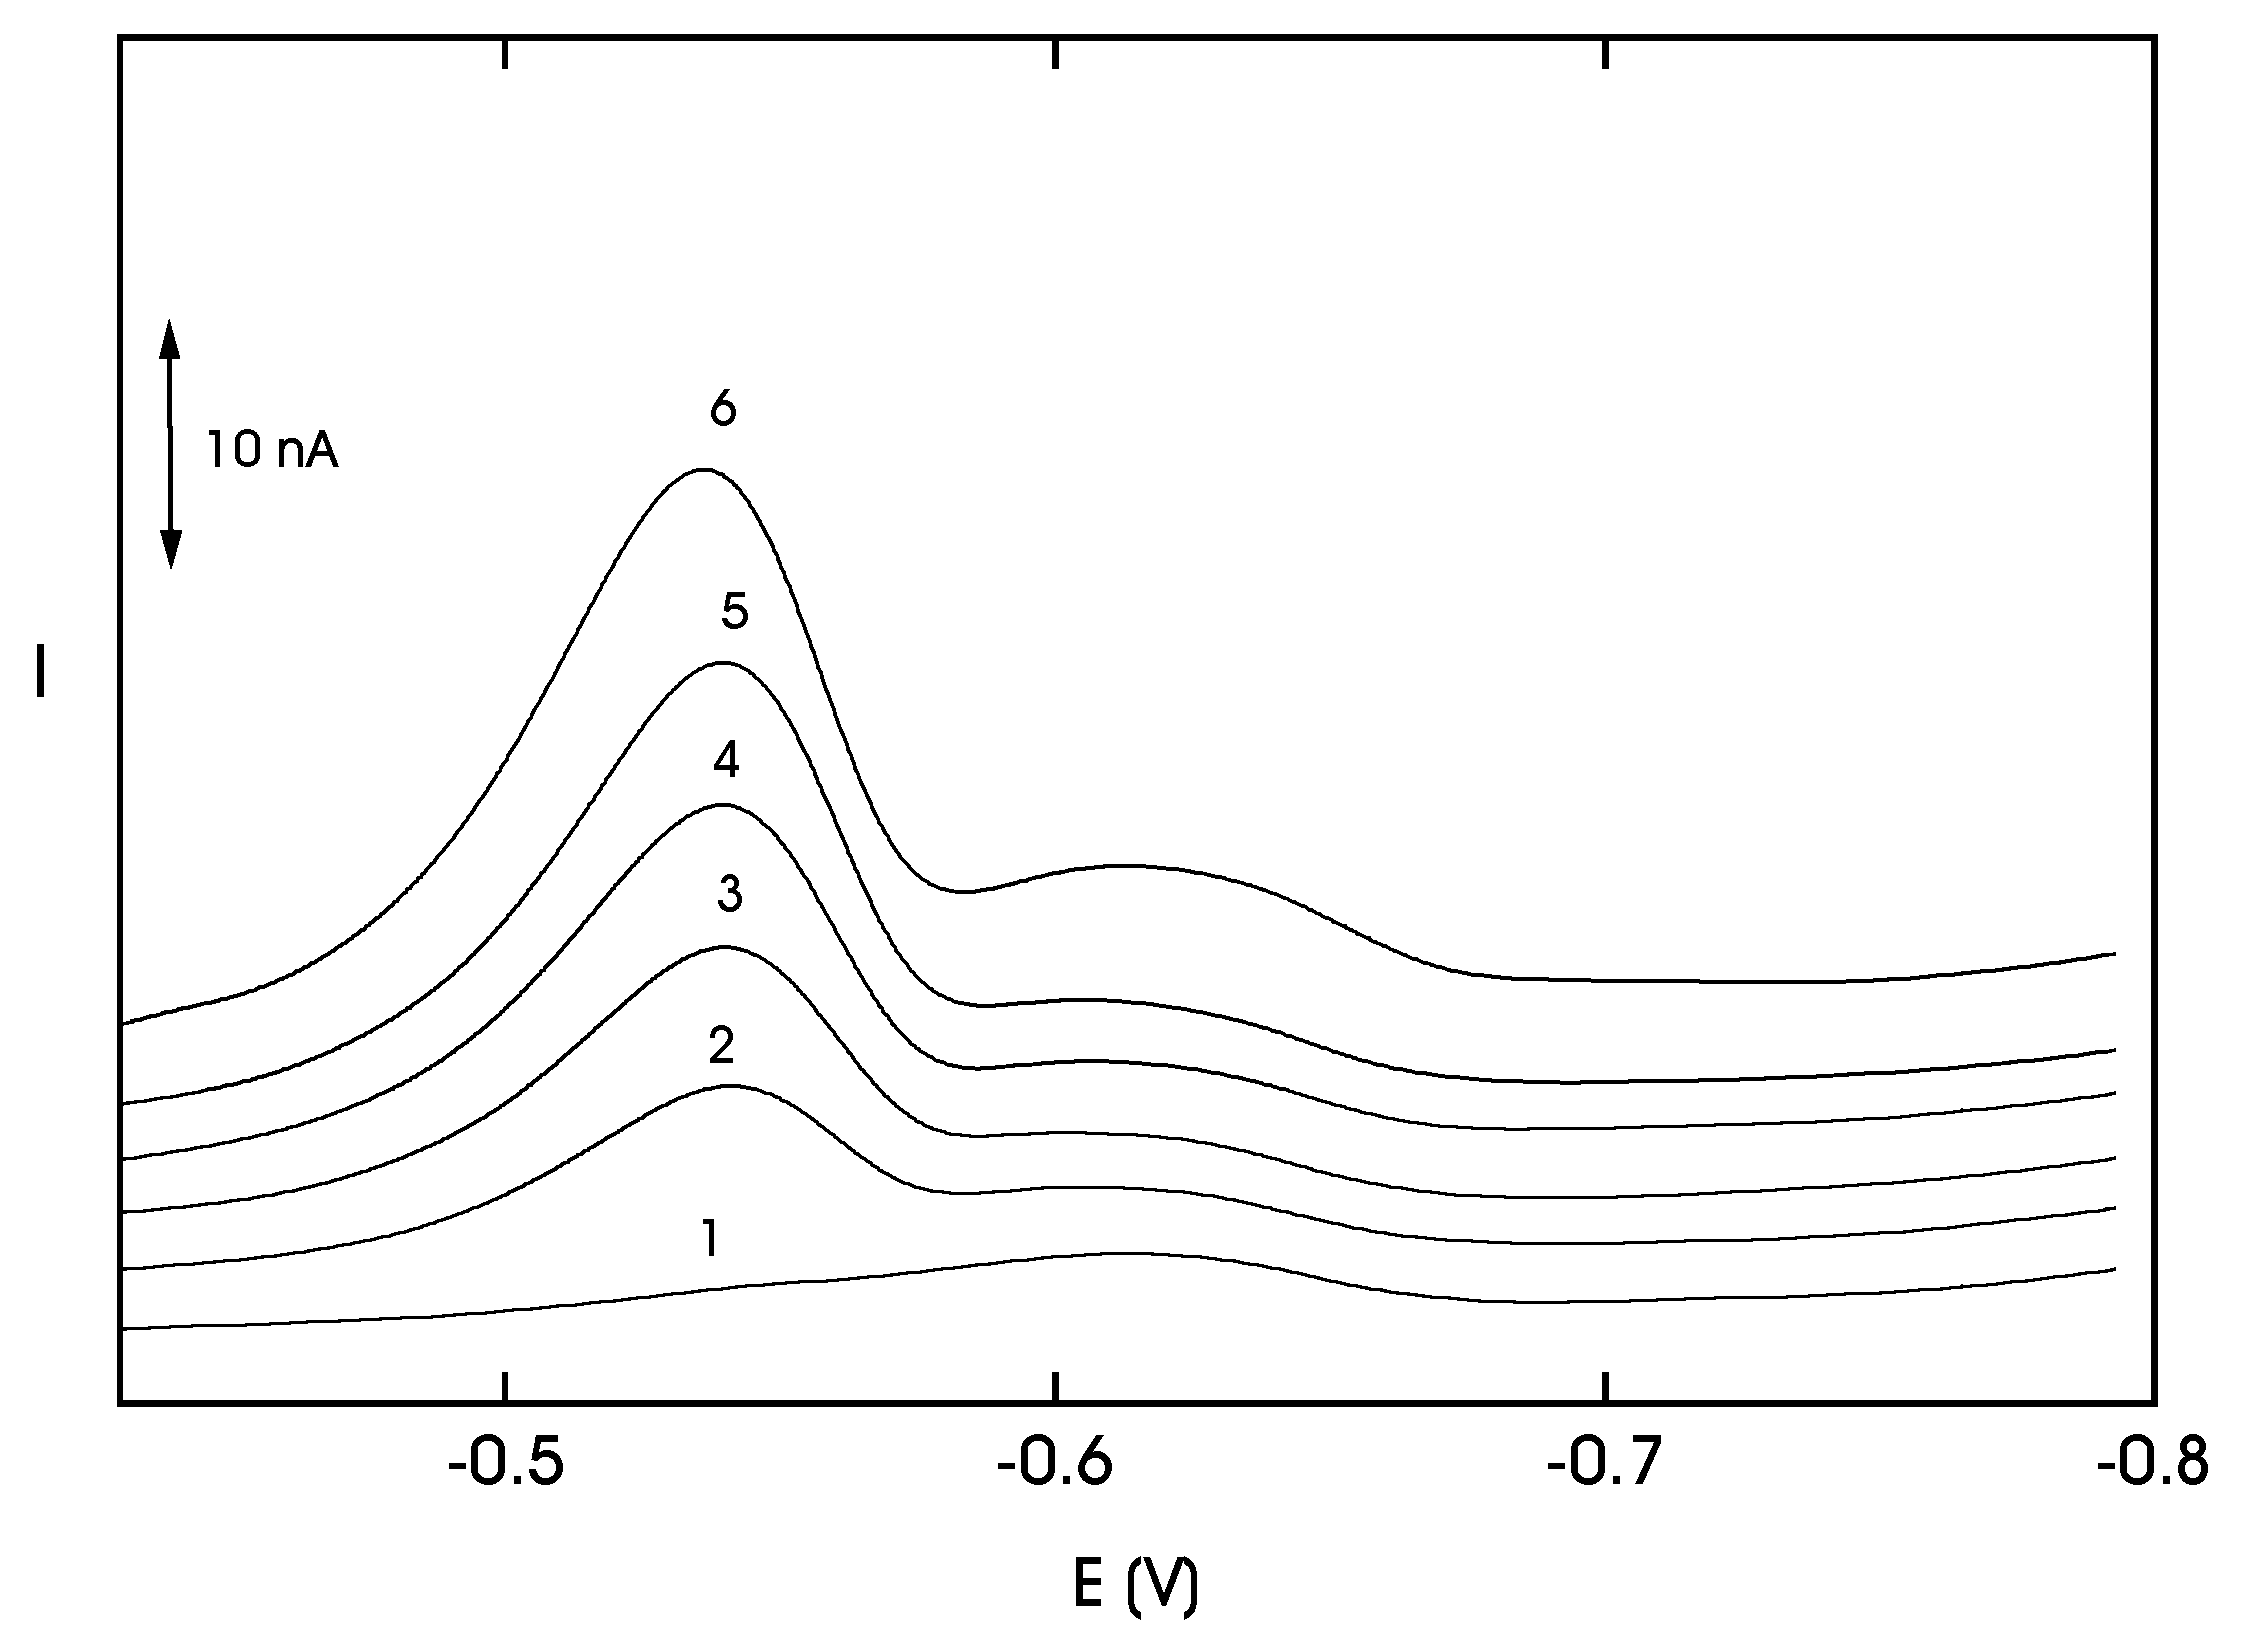
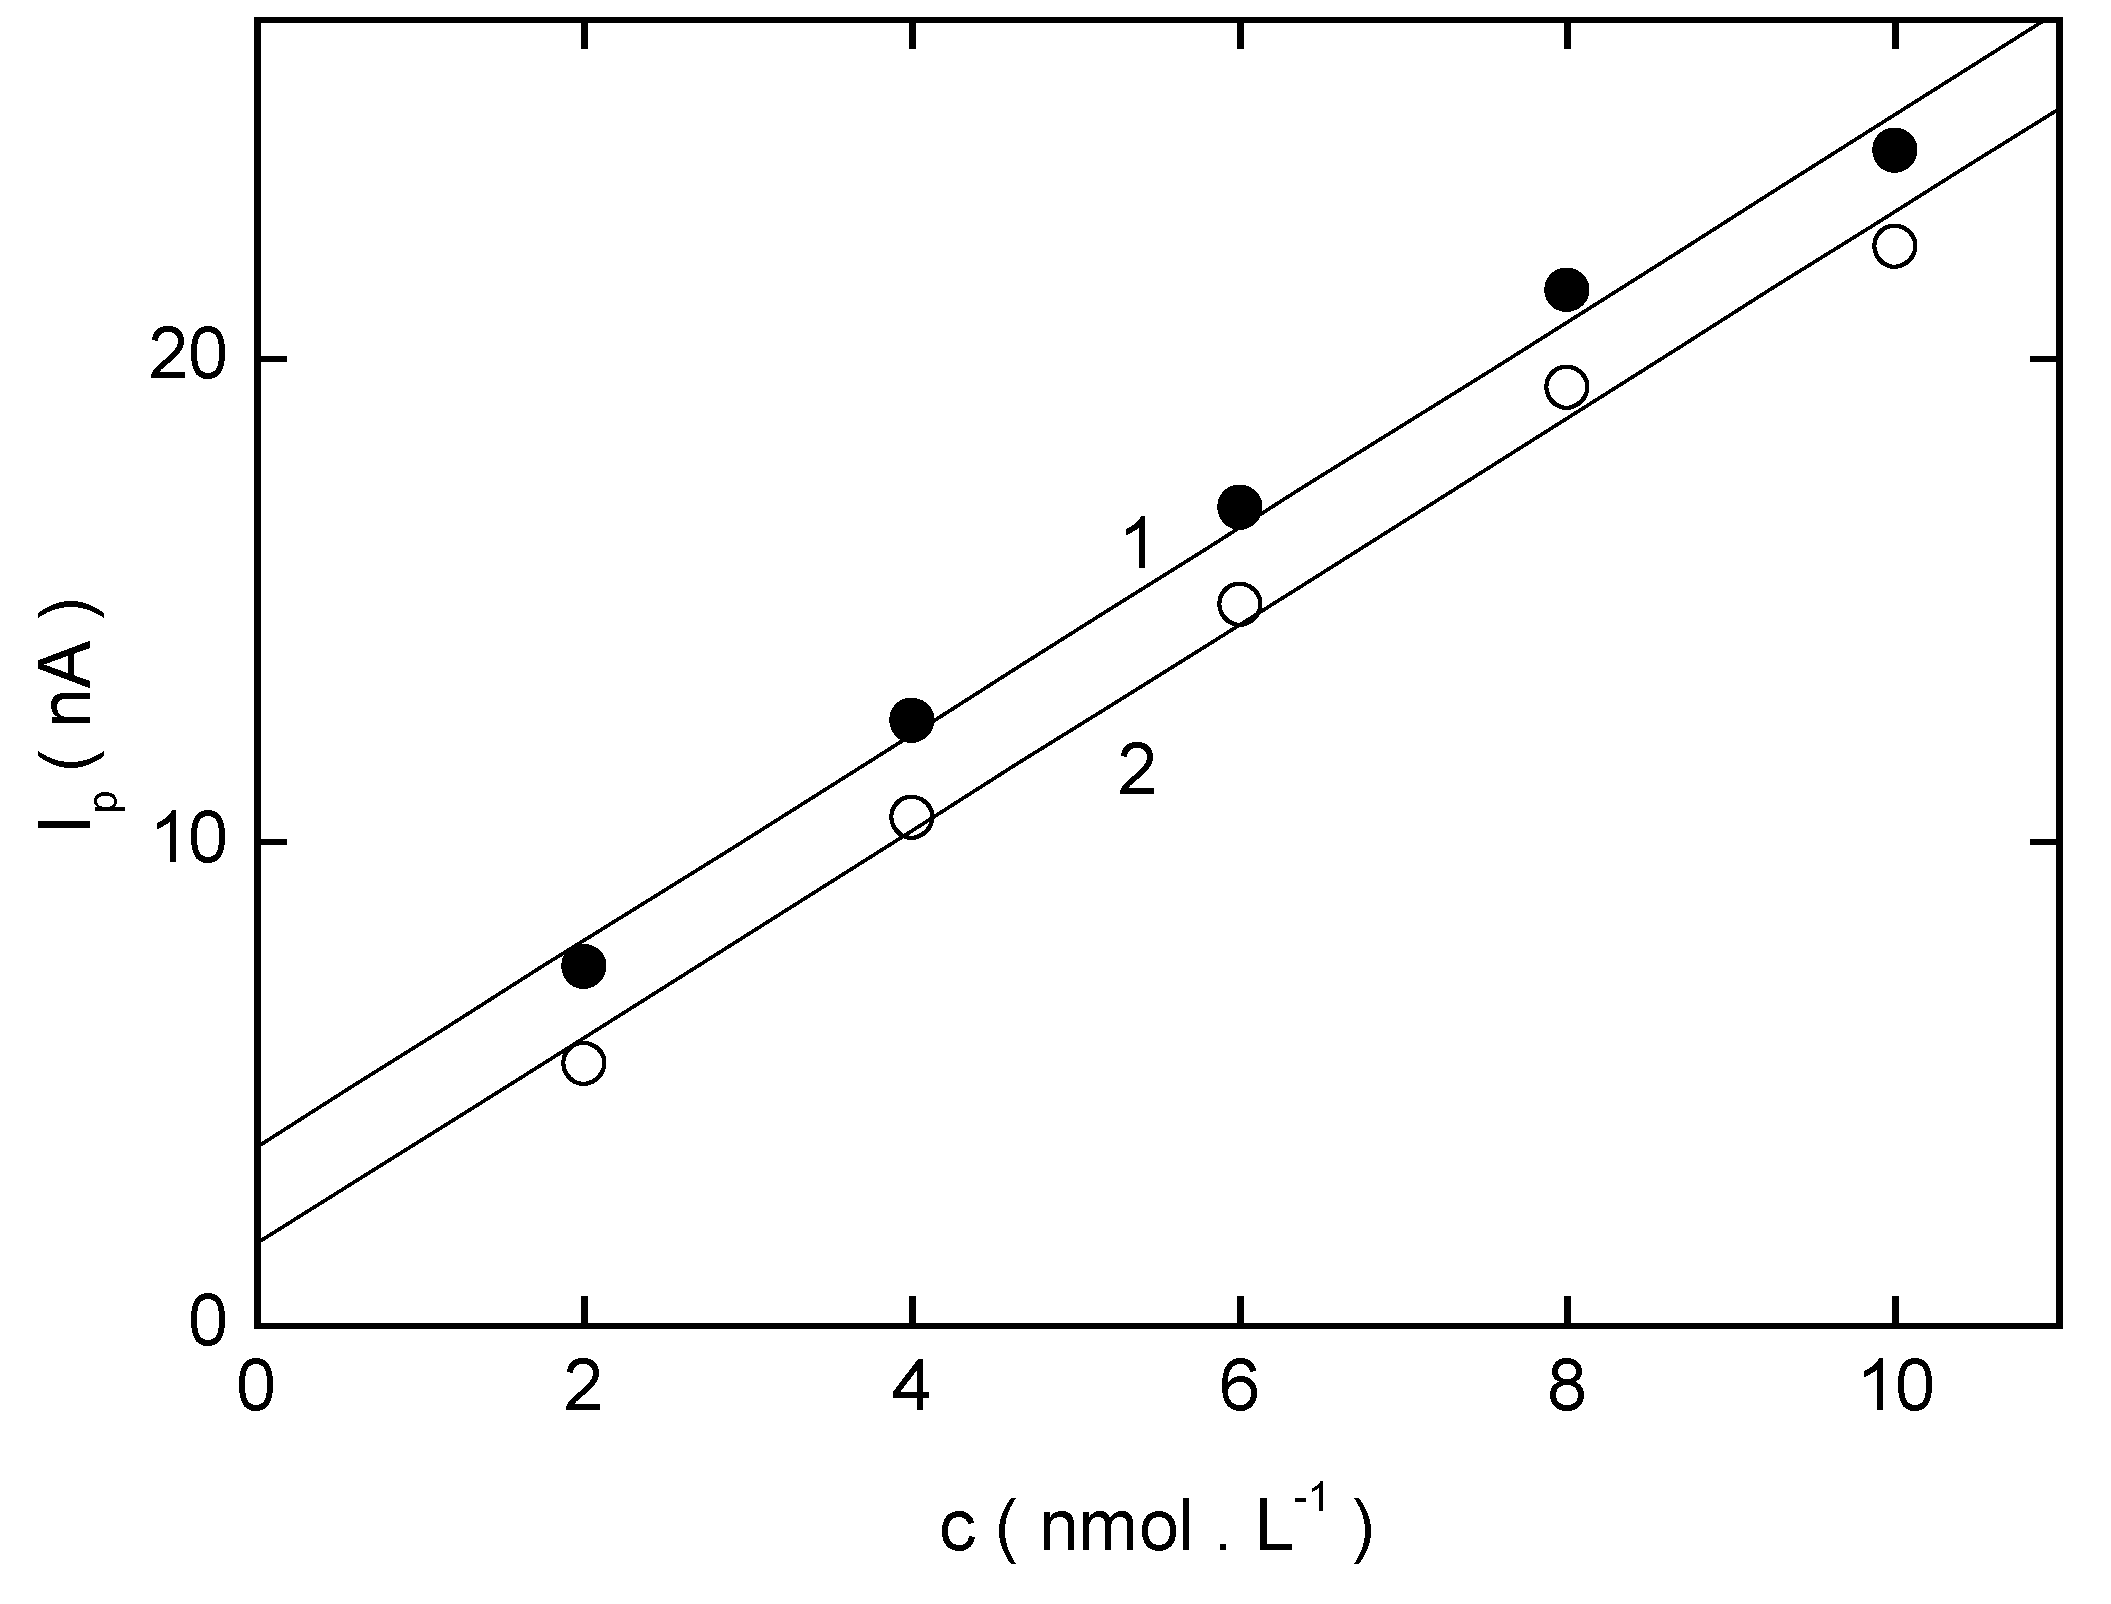
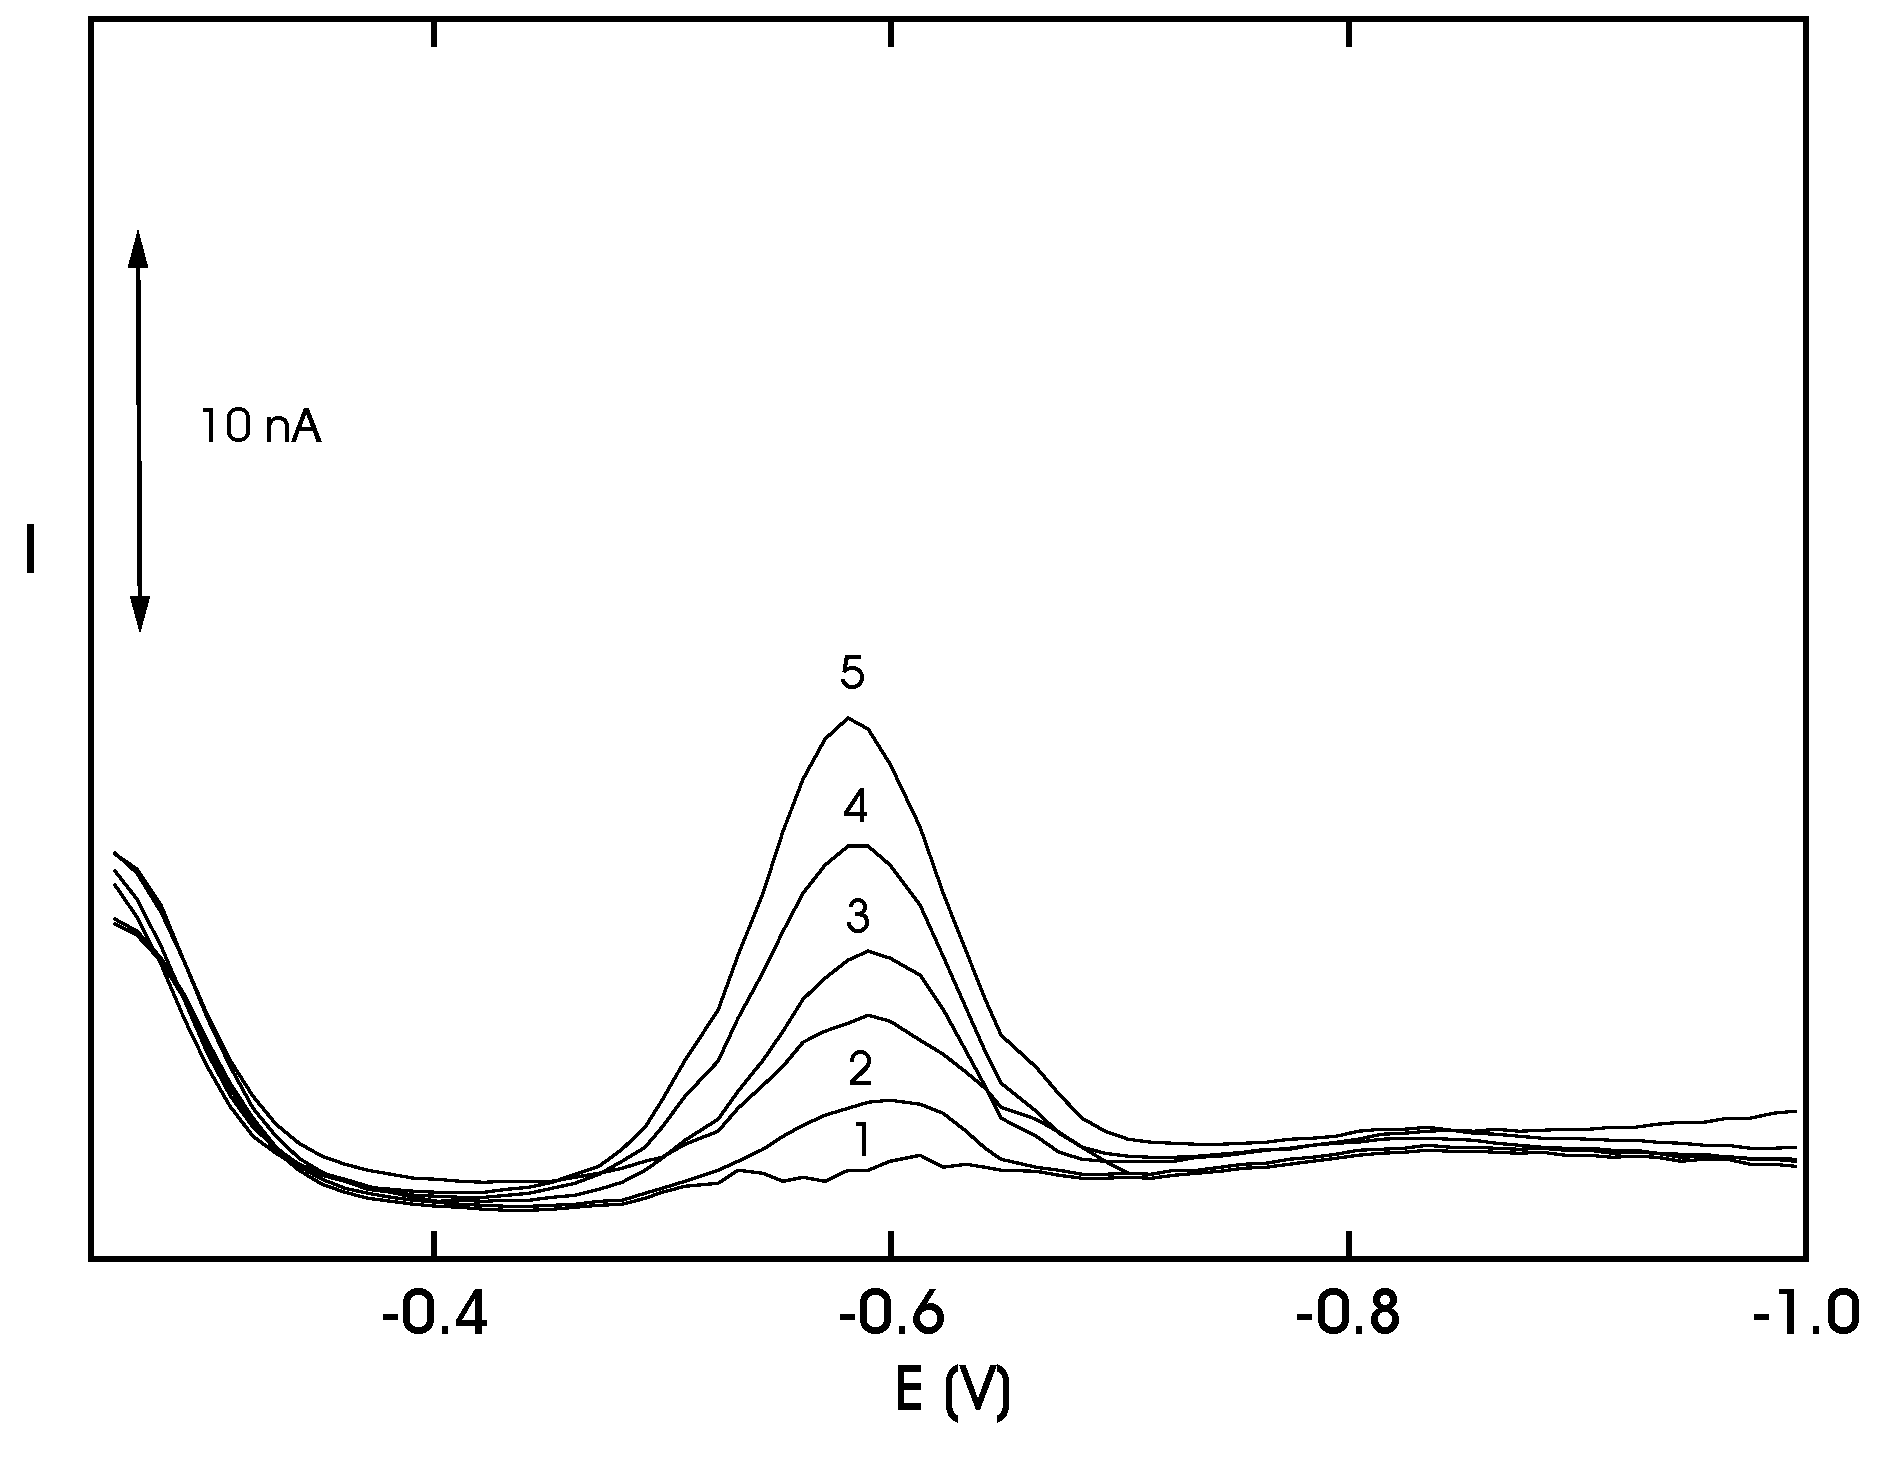
Adsorptive Stripping Voltammetry of 2-Nitrobiphenyl at HMDE


| pHm | Eacc(mV) | Ep(mV) | Ip(nA) | pHm | Eacc(mV) | Ep(mV) | Ip(nA) |
|---|---|---|---|---|---|---|---|
| 2.0 | 100 | -52 | 4.1 | 8.0 | -100 | -434 | 3.9 |
| 3.0 | 100 | -122 | 0.9 | 9.0 | -100 | -484 | 5.0 |
| 4.0 | 0 | -193 | 2.1 | 10.0 | -100 | -534 | 5.6 |
| 5.0 | 0 | -243 | 8.9 | 11.0 | -300 | -574 | 7.6 |
| 6.0 | 0 | -314 | 1.1 | 12.0 | -400 | -614 | 10.2 |
| 7.0 | -100 | -384 | 2.8 |
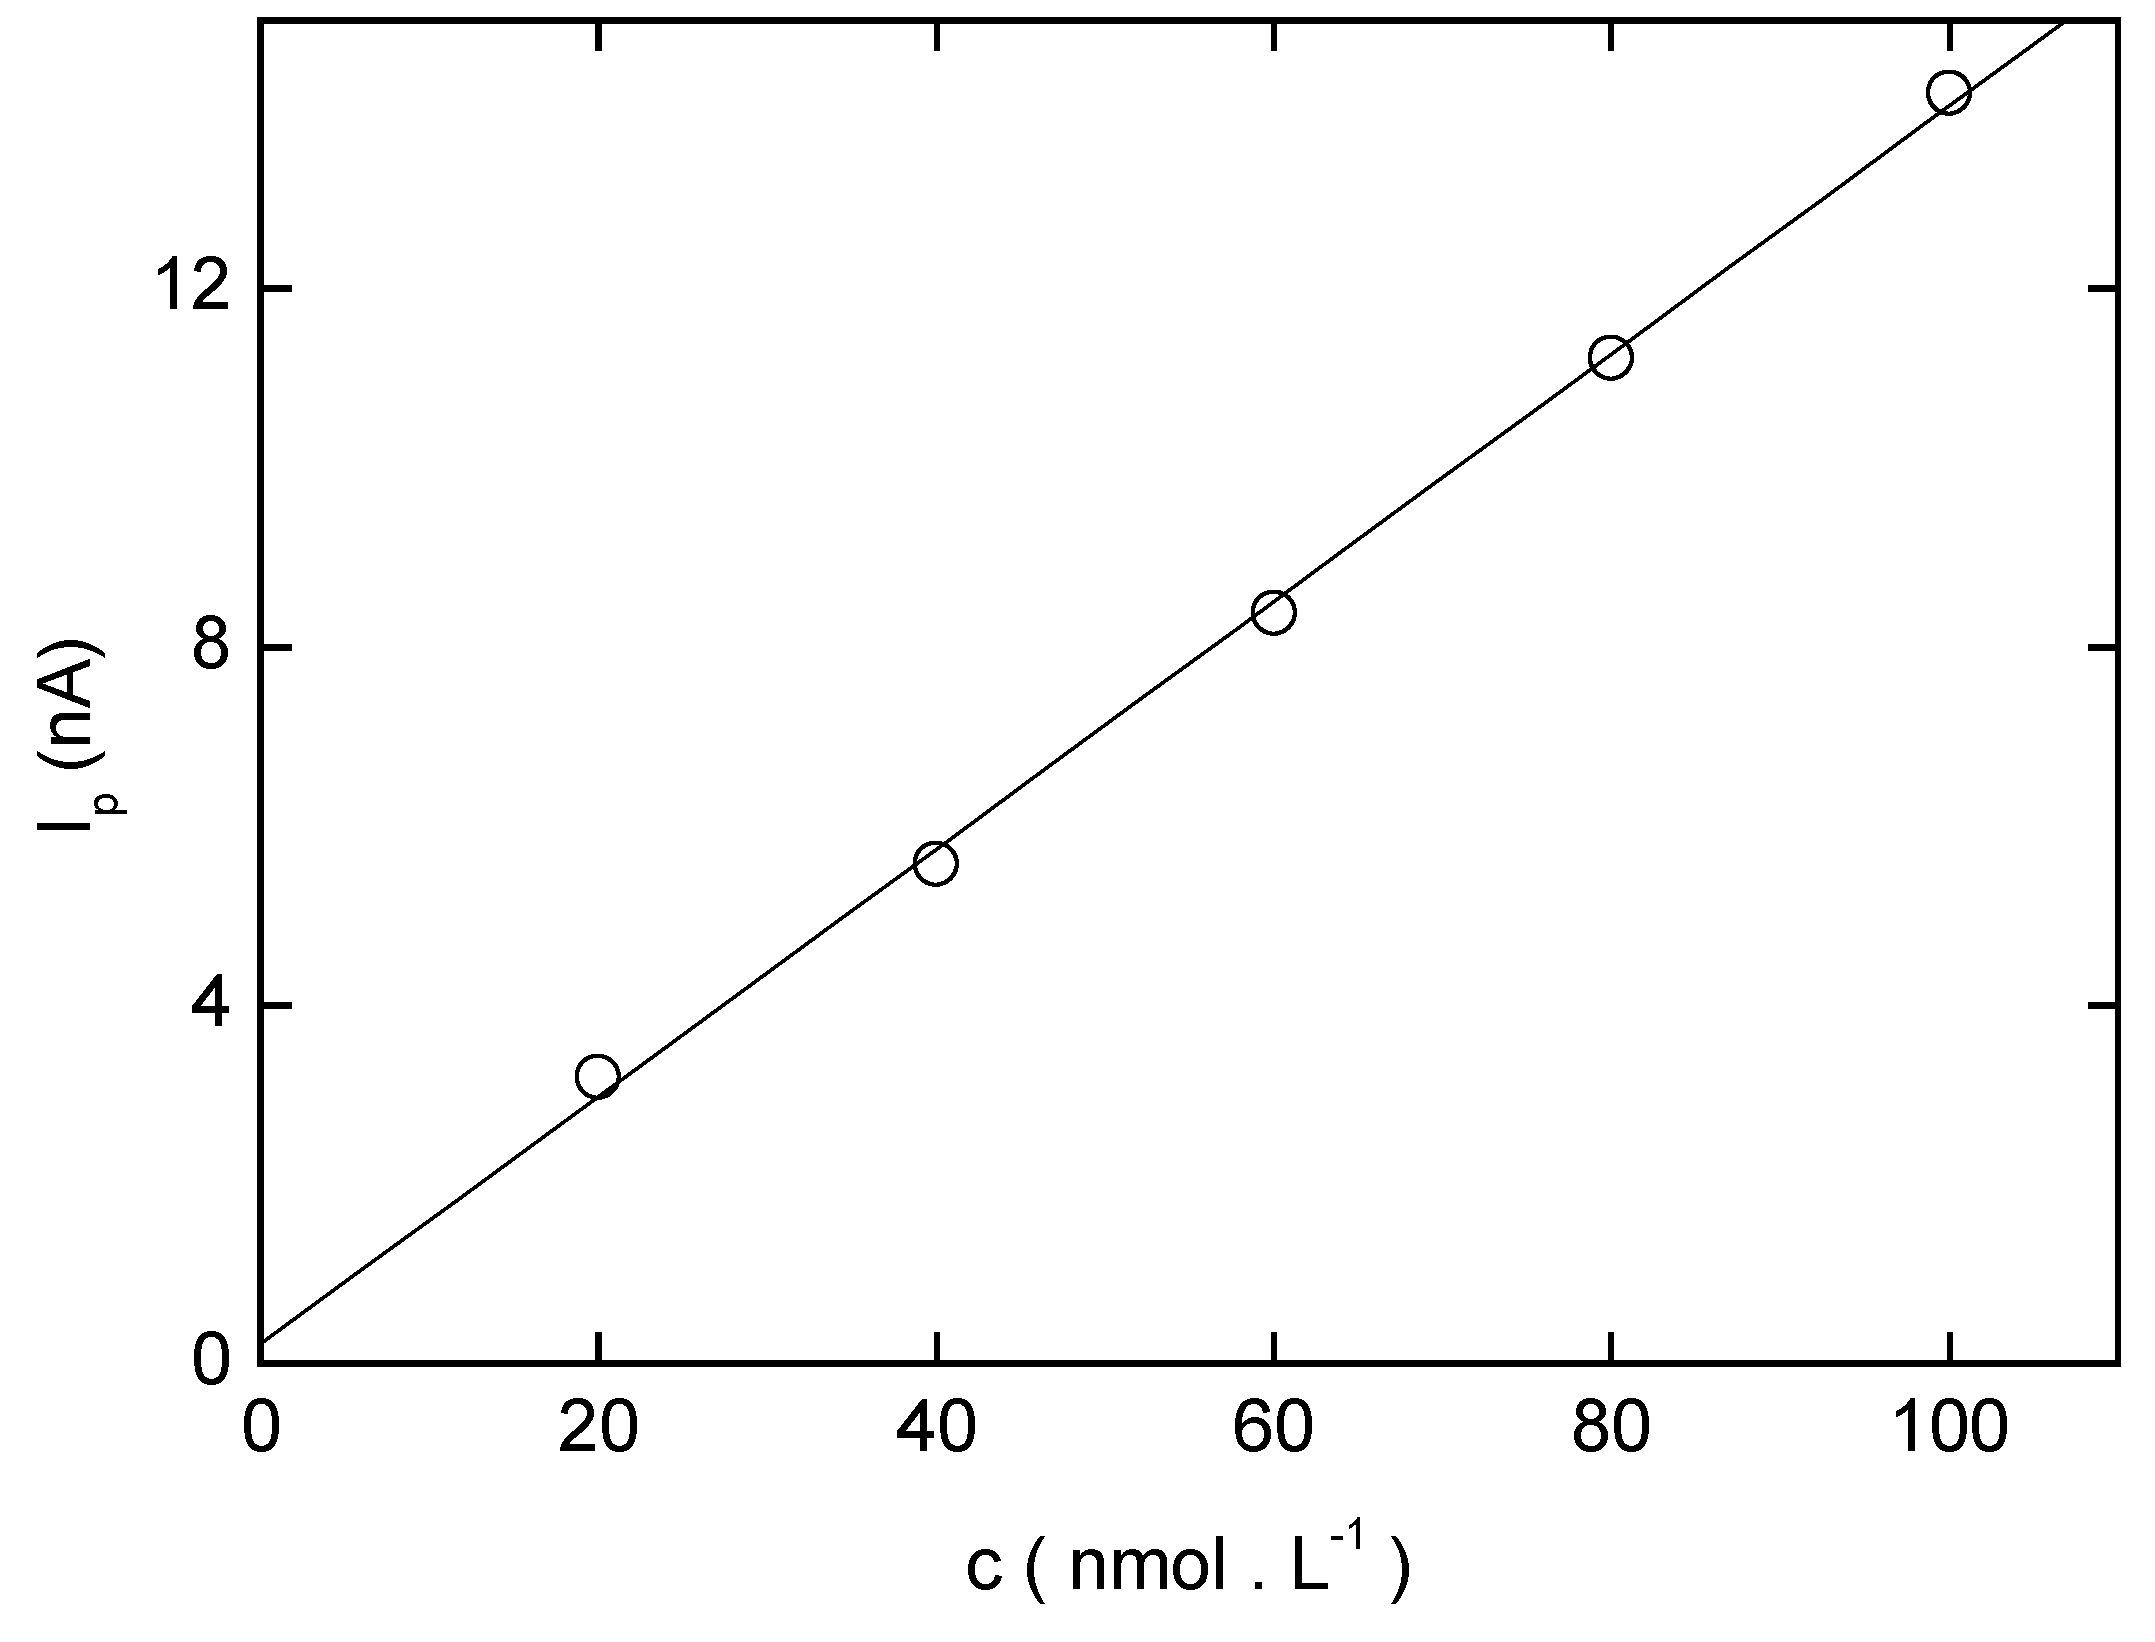
| c (mol L−1) | Slope (mA mol−1 L) | Intercept (nA) | Correlation coefficient | L Q (mol L−1) |
|---|---|---|---|---|
| (2-10) .10−8 a | 138.1 | 0.24 | 0.9991 | 2.2. 10−8 |
| (2-10) .10−9 b | 282.3 | 0.08 | 0.9842 | 2.9. 10−9 |
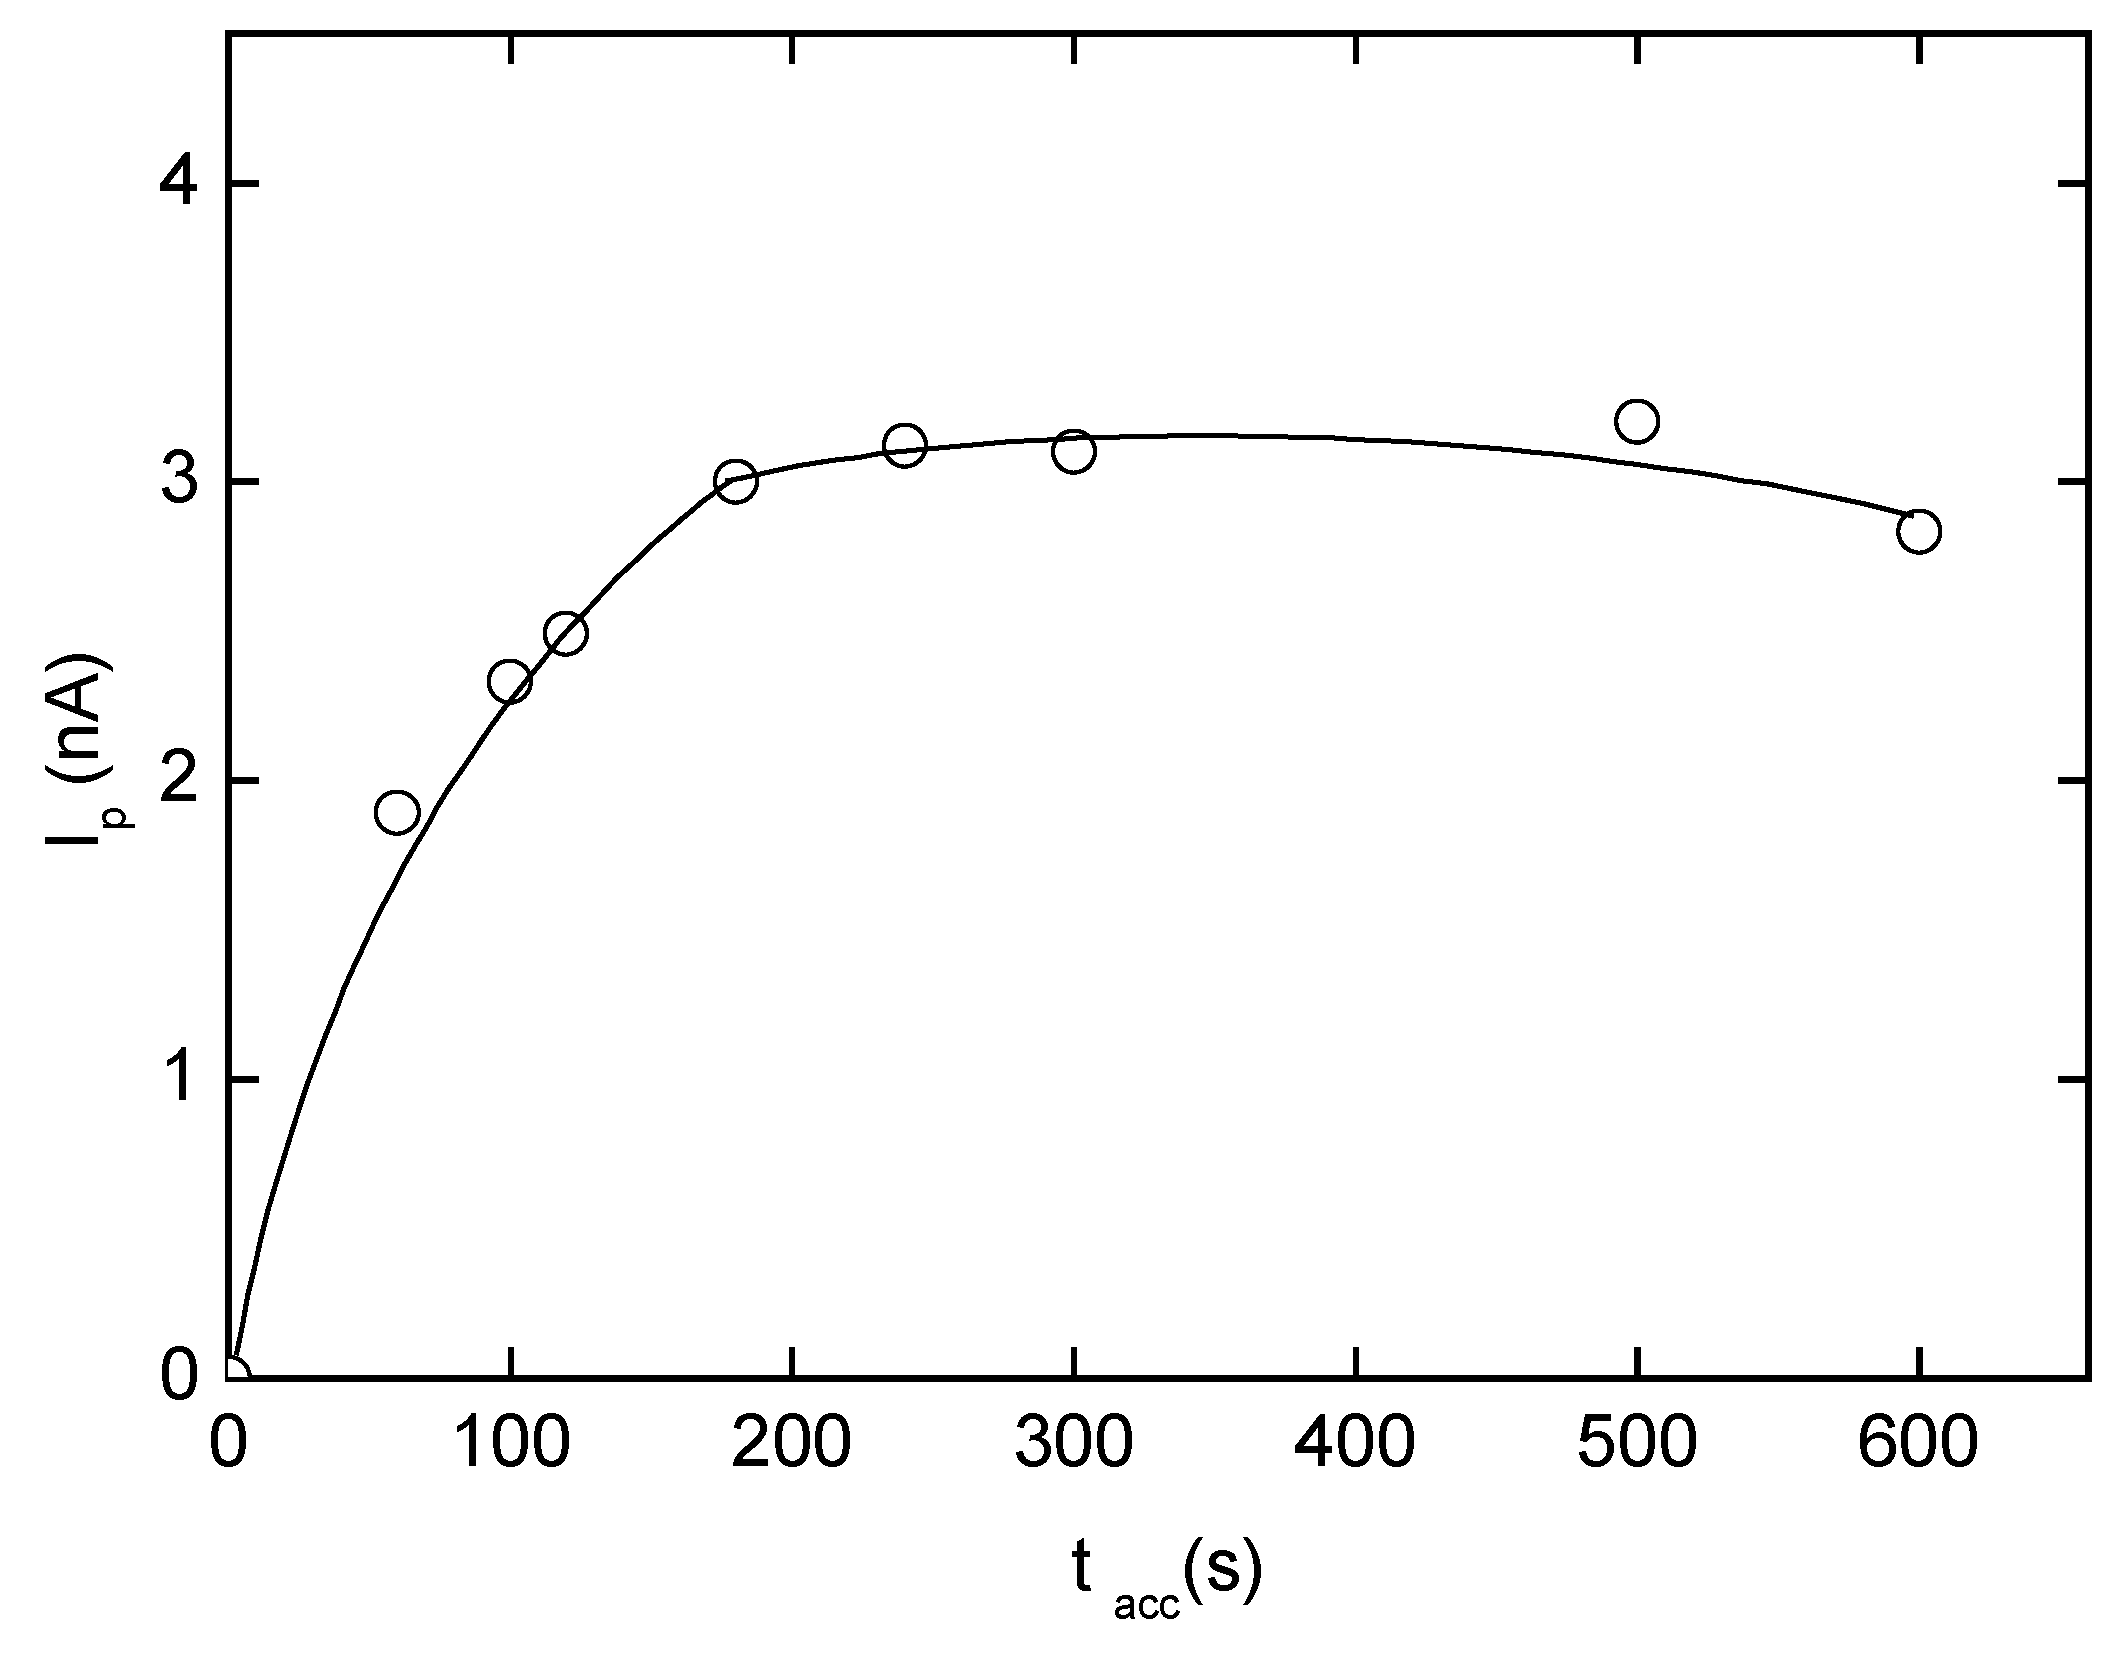
Adsorptive Stripping Voltammetry of 3-Nitrobiphenyl at HMDE


Adsorptive Stripping Voltammetry of 4-Nitrobiphenyl at HMDE
| c (mol L−1) | Slope (mA mol−1 L) | Intercept (nA) | Correlation coefficient | L Q (mol L−1) |
|---|---|---|---|---|
| (2-10) .10−8 a | 1.32 .109 | 10.3 | 0.9991 | 2.2. 10−8 |
| (2-10) .10−9 b | 2.39.109 | 2.64 | 0.9872 | 2.4. 10−9 |


| c (mol·L−1) | Slope (nA mol−1 L) | Intercept (nA) | Correlation coefficient | L Q (mol·L−1) |
|---|---|---|---|---|
| (2-10) .10−8 a | 1.27 · 109 | 0.51 | 0.9973 | ---- |
| (2-10) .10−9 b | 2.36 · 109 | 1.40 | 0.9876 | 3.3. 10−9 |
Analysis of Model Samples of Drinking Water


Conclusions
Acknowledgement
References
- Moreira, J.C.; Barek, J. Analysis of carcinogenic nitrated polycyclic aromatic hydrocarbons. Quimica Nova 1995, 18, 362–367. [Google Scholar]
- Jacob, J.; Karcher, W.; Belliardo, J.J.; Dumler, R.; Boenke, A. Review. Polycyclic aromatic compounds of environmental and occupational importance - their occurrence, toxicity and the development of high-purity certified reference materials. Part III. Fresenius J. Anal. Chem. 1991, 340, 755–767. [Google Scholar] [CrossRef]
- Cvačka, J.; Barek, J.; Fogg, A.G.; Moreira, J.C.; Zima, J. Review. HPLC of nitrated polycyclic aromatic hydrocarbons. Analyst. 1998, 123, 9–18. [Google Scholar]
- Wang, J. Electroanalytical Chemistry; Bard, A.J., Ed.; Dekker: New York, 1989; Vol.16, pp. 1–88. [Google Scholar]
- Kalvoda, R. Instrumentation in Analytical Chemistry; Zýka, J., Ed.; Horwood: London, 1994; p. 54. [Google Scholar]
- Kemula, W.; Kublik, Z. Application of the steady hanging mercury electrode to the oscillopo-larographic investigations. Roczn. Chem. 1956, 30, 1005–1008. [Google Scholar]
- Barek, J.; Fogg, A.G.; Muck, A.; Zima, J. Polarography and Voltammetry at Mercury Electrodes. Crit. Rev. Anal. Chem. 2001, 31(4), 291–309. [Google Scholar] [CrossRef]
- Barek, J.; Cvačka, J.; Muck, A.; Quaiserová, V.; Zima, J. Polarographic and Voltammetric Determination of Nitro and Amino Derivatives of Polycyclic Aromatic Hydrocarbons. Electroanalysis 2001, 13, 1369–1375. [Google Scholar] [CrossRef]
- Kemula, W.; Krygowski, T.M. Encyclopedia of the Electrochemistry of the Elements-Organic Section; Bard, A.J., Lund, H., Eds.; Dekker: New York, 1979; Vol.13, p. 77. [Google Scholar]
- http://www.cdc.gov/niosh/npg/npgd0451.html October 9, 2002.
- Štěpán, R. DiplomaThesis. Faculty of Science; Charles University: Prague, 2001; pp. 10–87. [Google Scholar]
- Oppenhelmer, L.; Cappizi, T.P.; Weppelman, R.M.; Metha, H. Determing the lowest limit of reliable assay measurement. Anal. Chem. 1983, 55, 638–643. [Google Scholar] [CrossRef]
- Schwartz, L.M. Lowest limit of reliable assay measurement with nonlinear calibration. Anal. Chem. 1983, 55, 1424–1426. [Google Scholar] [CrossRef]
- Ebel, S.; Kamm, U. Statistical definition of the limit of determination. Fresenius Z. Anal. Chem. 1984, 318, 293–294. [Google Scholar] [CrossRef]
- Sample Availability: Available from the authors.
© 2003 by MDPI (http://www.mdpi.net). Reproduction is permitted for noncommercial purposes.
Share and Cite
Štěpán, R.; Barek, J.; Mejstřík, V.; Zima, J. Voltammetric Determination of Carcinogenic Nitrobiphenyls at a Hanging Mercury Drop Electrode. Sensors 2003, 3, 43-60. https://doi.org/10.3390/s30300043
Štěpán R, Barek J, Mejstřík V, Zima J. Voltammetric Determination of Carcinogenic Nitrobiphenyls at a Hanging Mercury Drop Electrode. Sensors. 2003; 3(3):43-60. https://doi.org/10.3390/s30300043
Chicago/Turabian StyleŠtěpán, Radek, Jiří Barek, Viktor Mejstřík, and Jiří Zima. 2003. "Voltammetric Determination of Carcinogenic Nitrobiphenyls at a Hanging Mercury Drop Electrode" Sensors 3, no. 3: 43-60. https://doi.org/10.3390/s30300043
APA StyleŠtěpán, R., Barek, J., Mejstřík, V., & Zima, J. (2003). Voltammetric Determination of Carcinogenic Nitrobiphenyls at a Hanging Mercury Drop Electrode. Sensors, 3(3), 43-60. https://doi.org/10.3390/s30300043