
A Practical Cardiovascular Health Assessment for Manual Wheelchair Users During the 6-Minute Push Test †


Abstract
1. Introduction
2. Materials and Methods
2.1. Participants
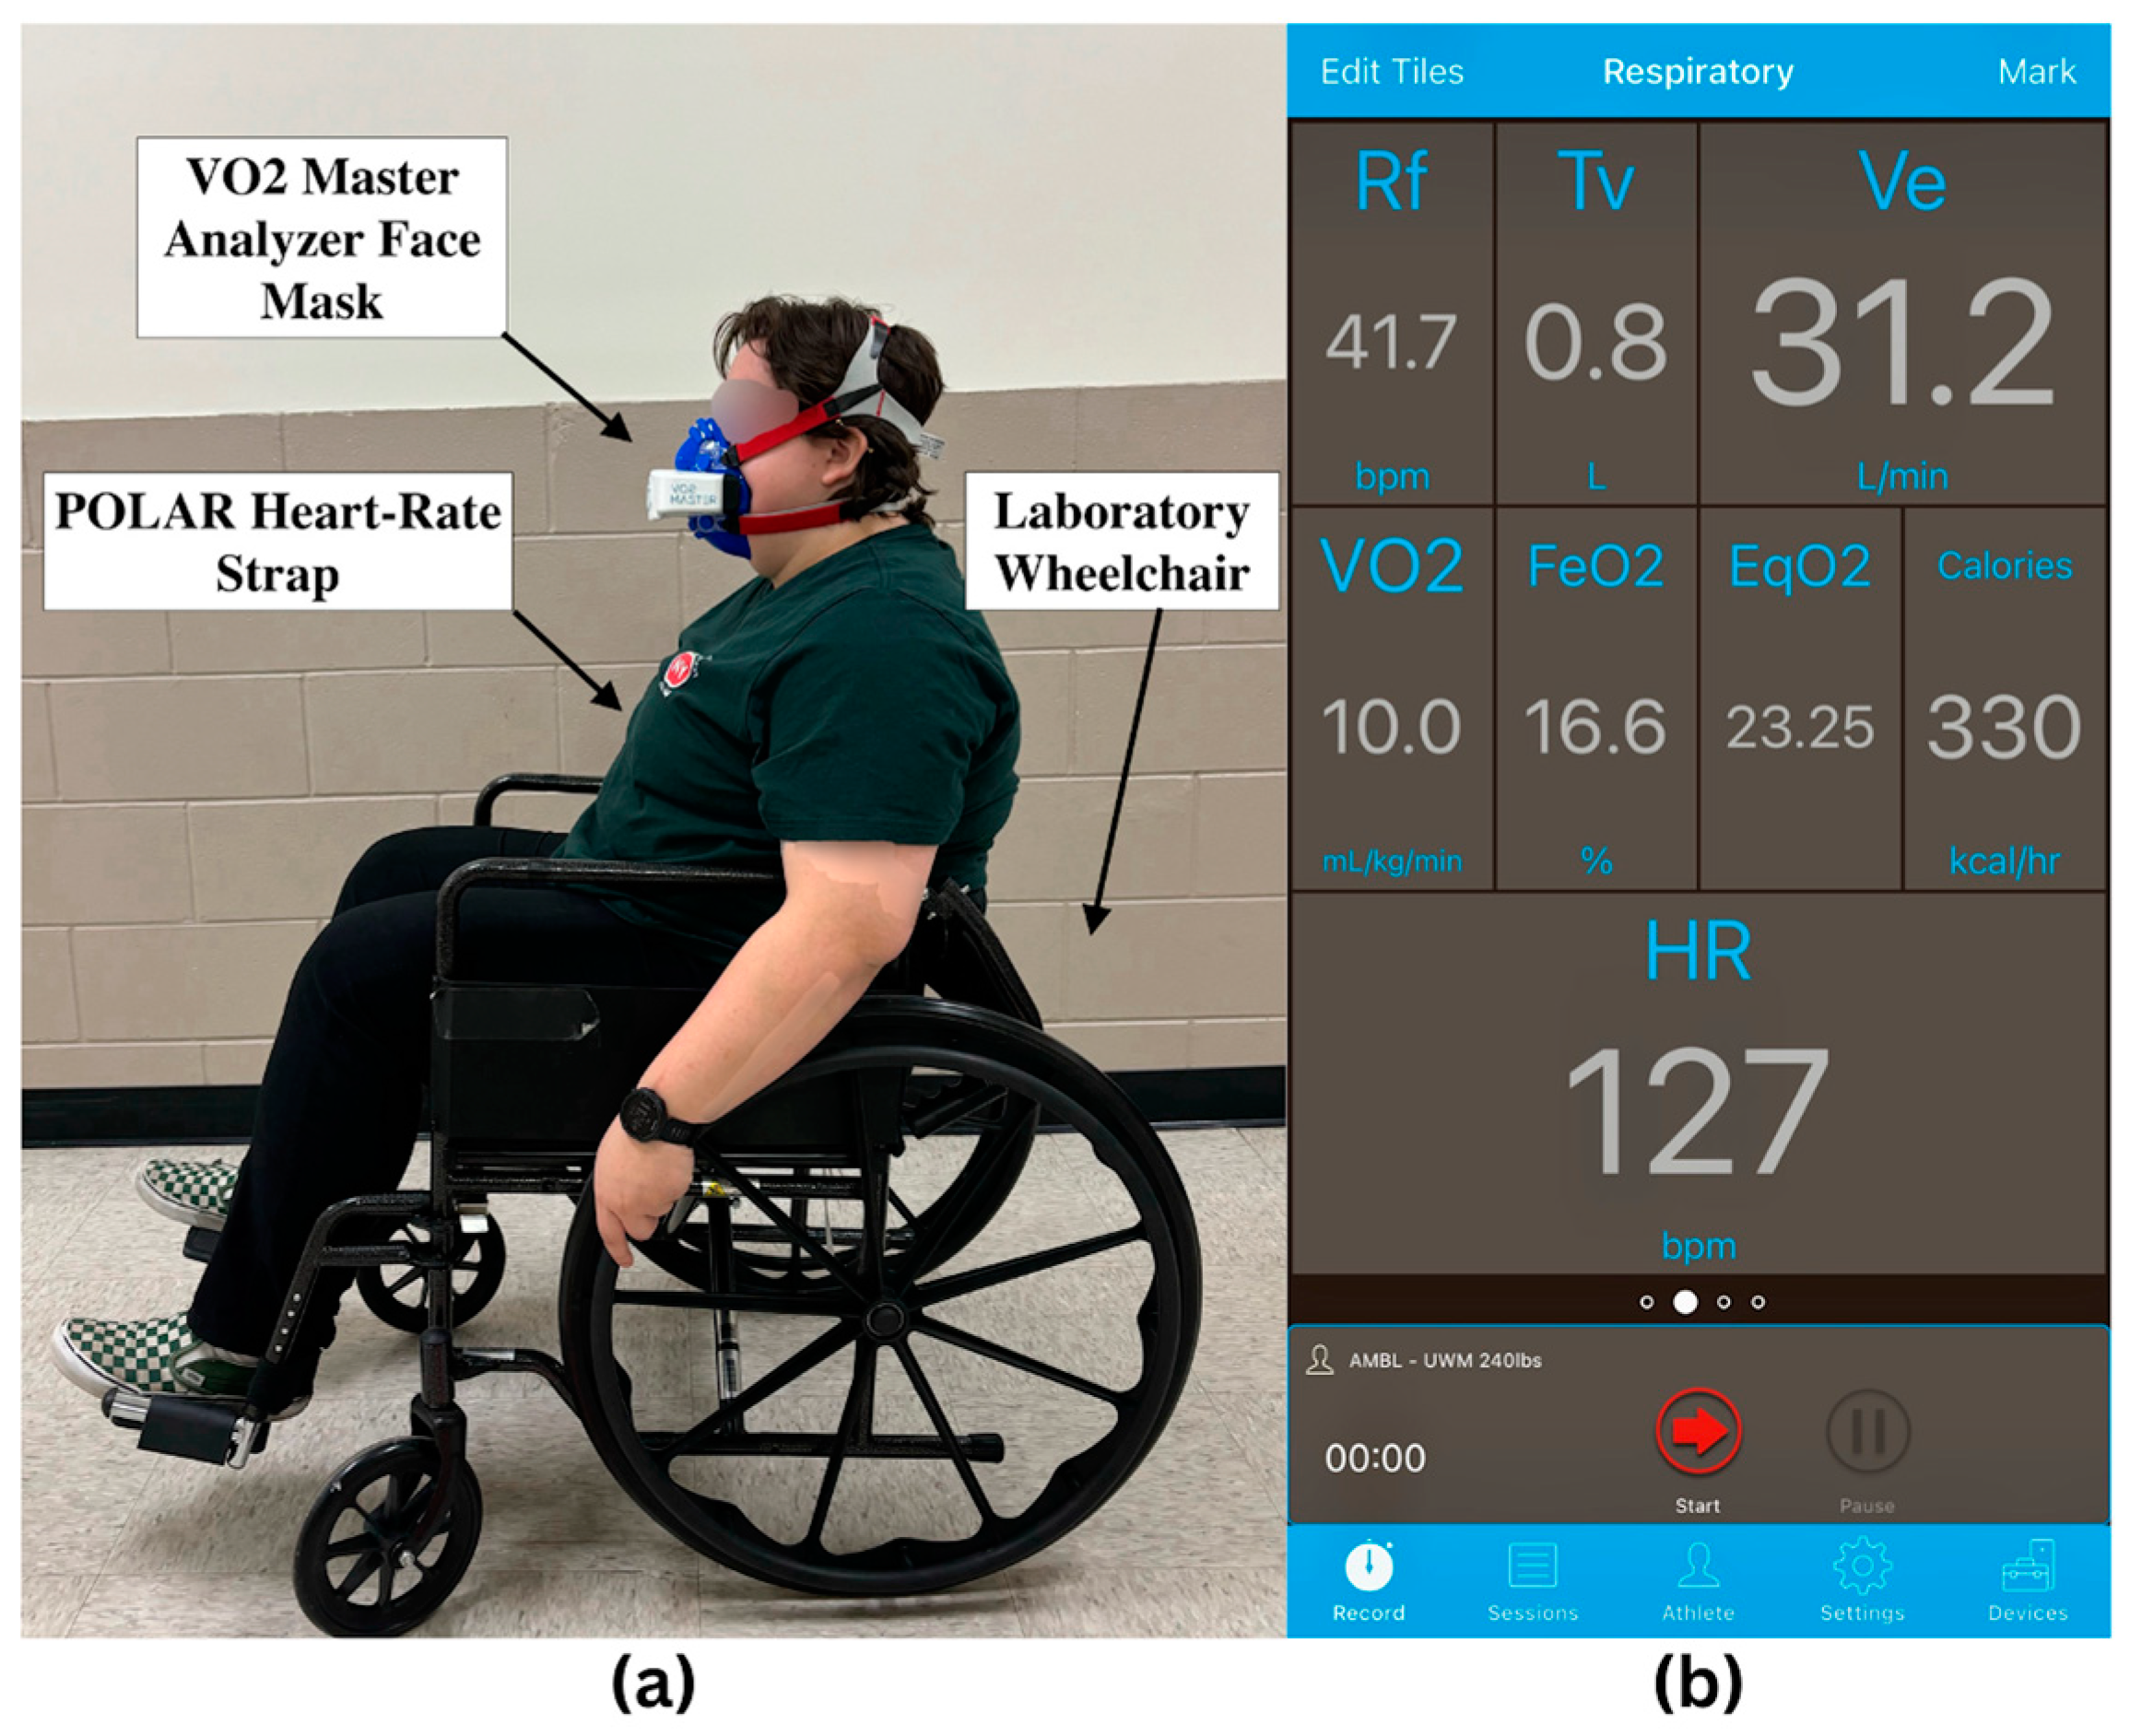
2.2. VO2 Tracking
2.3. Heart Rate Monitoring
2.4. Subjective Exertion Assessment
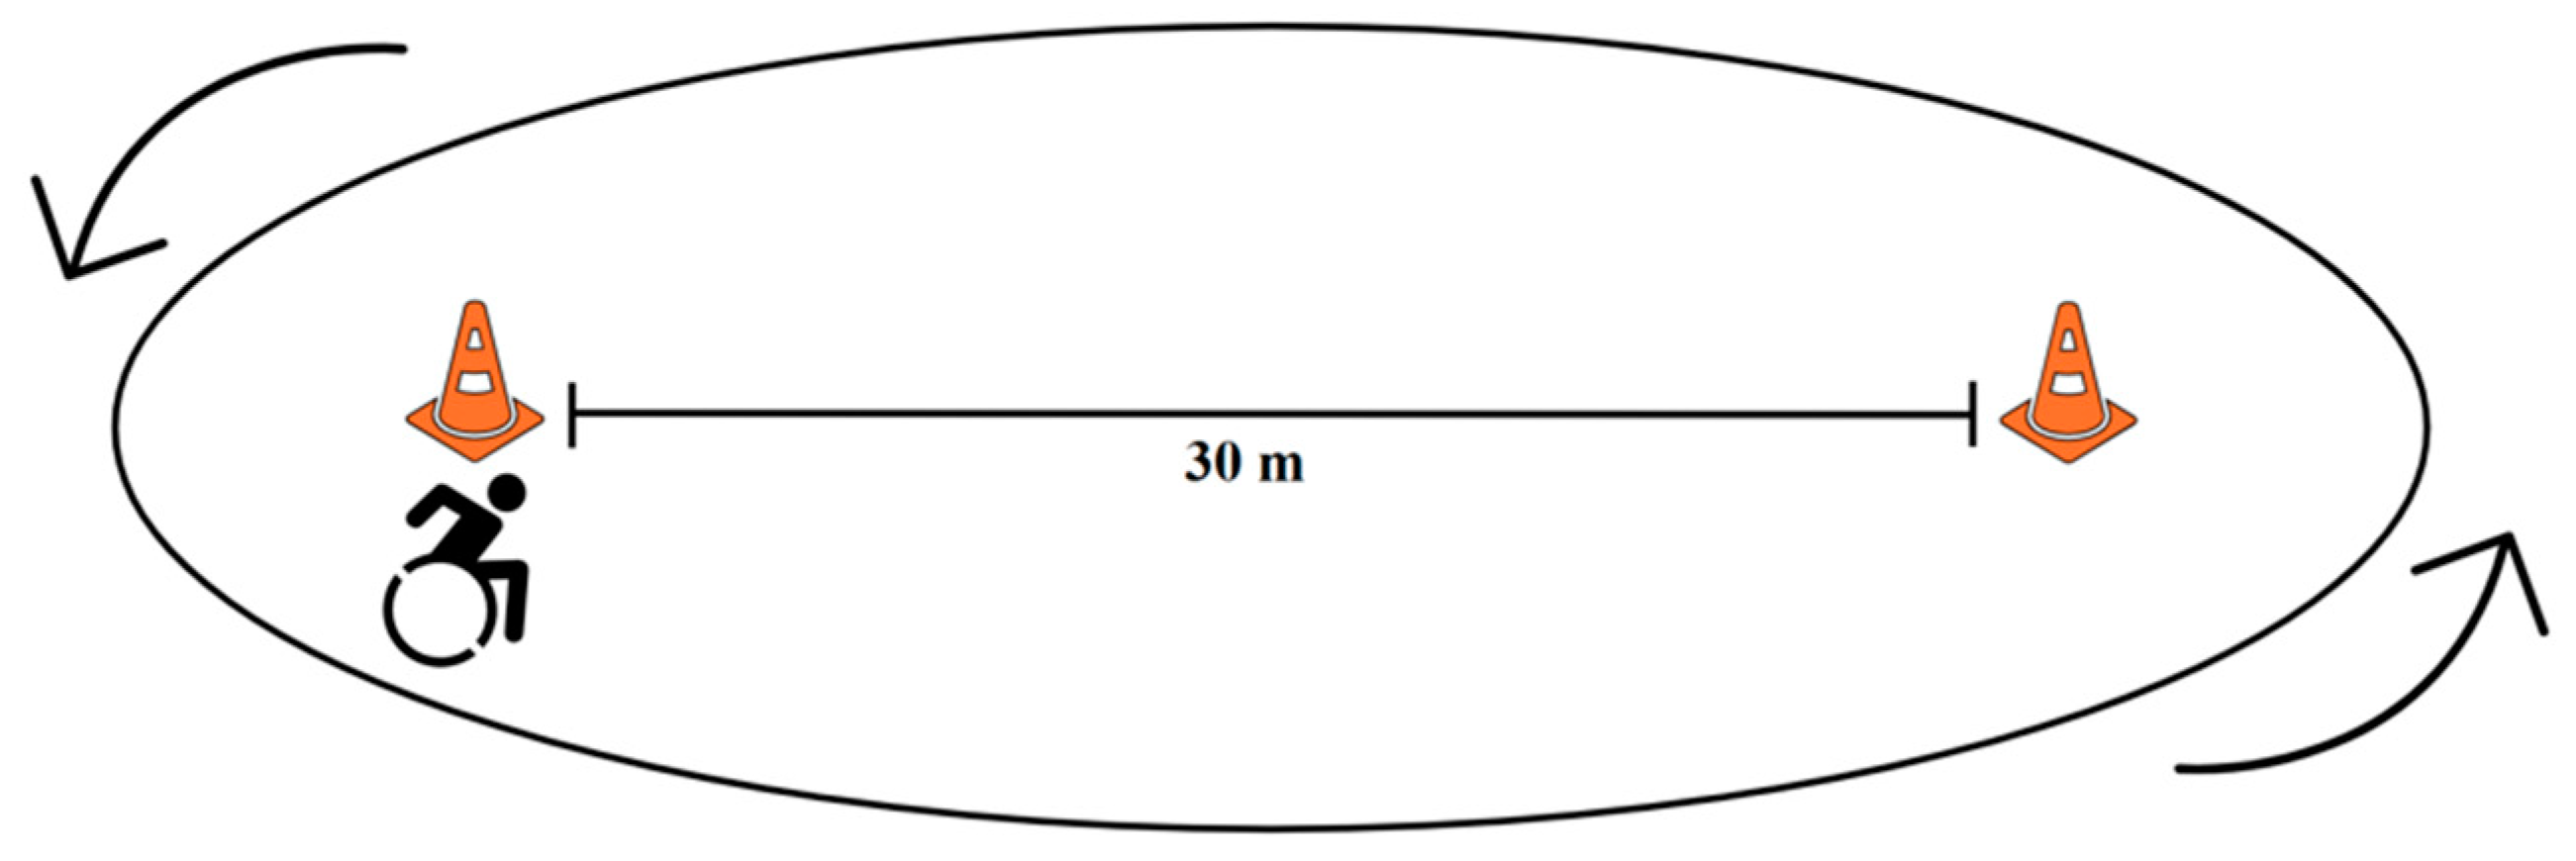
2.5. Study Protocol
2.6. Data Processing
2.7. Statistical Analysis
3. Results
Statistical Analysis
- Model 1: Distance alone predicted 41.6% of the variance (R2 = 0.416, adjusted R2 = 0.394, F(1,26) = 18.55, p < 0.001), with the following equation:
- Model 2: Including max heart rate improved the prediction to 56.1% of the variance (R2 = 0.561, adjusted R2 = 0.526, F(2,25) = 16.00, p < 0.001), with the following equation:
- Model 1: Distance alone predicted 55.0% of the variance (R2 = 0.550, adjusted R2 = 0.513, F(1,12) = 14.69, p = 0.002) with the following equation:
- Model 2: Adding max heart rate improved the model, predicting 70.9% of the variance (R2 = 0.709, adjusted R2 = 0.656, F(2,11) = 14.69, p = 0.032 for the added value), with the following equation:
4. Discussion
5. Conclusions
Author Contributions
Funding
Institutional Review Board Statement
Informed Consent Statement
Data Availability Statement
Acknowledgments
Conflicts of Interest
Abbreviations
| 6MPT | 6-Minute Push Test |
| VO2max | Maximal Oxygen Consumption |
| HR | Heart Rate |
| RPE | Rated Perceived Exertion |
| BMI | Body Mass Index |
| SPSS | Statistical Package for the Social Sciences |
| IRB | Institutional Review Board |
References
- Nie, Q.; Rice, L.A.; Sosnoff, J.J.; Shen, S.; Rogers, W.A. Understanding Wheelchair Use in Older Adults from the National Health and Aging Trends Study. Arch. Phys. Med. Rehabil. 2024, 105, 514–524. [Google Scholar] [CrossRef] [PubMed]
- Li, Y.; Li, F.M.; Carrington, P. Breaking the “Inescapable” Cycle of Pain: Supporting Wheelchair Users’ Upper Extremity Health Awareness and Management with Tracking Technologies. In Proceedings of the 2023 CHI Conference on Human Factors in Computing Systems, Association for Computing Machinery, New York, NY, USA, 19 April 2023; pp. 1–17. [Google Scholar]
- Dunstan, D.W.; Dogra, S.; Carter, S.E.; Owen, N. Sit Less and Move More for Cardiovascular Health: Emerging Insights and Opportunities. Nat. Rev. Cardiol. 2021, 18, 637–648. [Google Scholar] [CrossRef] [PubMed]
- Lavis, T.D.; Scelza, W.M.; Bockenek, W.L. Cardiovascular Health and Fitness in Persons with Spinal Cord Injury. Phys. Med. Rehabil. Clin. North Am. 2007, 18, 317–331. [Google Scholar] [CrossRef] [PubMed]
- Fasipe, G.; Goršič, M.; Rahman, M.H.; Rammer, J. Community Mobility and Participation Assessment of Manual Wheelchair Users: A Review of Current Techniques and Challenges. Front. Hum. Neurosci. 2024, 17, 1331395. [Google Scholar] [CrossRef]
- Warburton, D.E.; Nicol, C.W.; Bredin, S.S. Health Benefits of Physical Activity: The Evidence. Can. Med. Assoc. J. 2006, 174, 801. [Google Scholar] [CrossRef]
- Martin Ginis, K.A.; Jörgensen, S.; Stapleton, J. Exercise and Sport for Persons with Spinal Cord Injury. Pm&r 2012, 4, 894–900. [Google Scholar] [CrossRef]
- Van der Westhuizen, L.; Mothabeng, D.J.; Nkwenika, T.M. The Relationship between Physical Fitness and Community Participation in People with Spinal Cord Injury. South Afr. J. Physiother. 2017, 73, 354. [Google Scholar] [CrossRef]
- Damen, K.M.S.; Takken, T.; de Groot, J.F.; Backx, F.J.G.; Radder, B.; Roos, I.C.P.M.; Bloemen, M.A.T. 6-Minute Push Test in Youth Who Have Spina Bifida and Who Self-Propel a Wheelchair: Reliability and Physiologic Response. Phys. Ther. 2020, 100, 1852–1861. [Google Scholar] [CrossRef]
- Nabi, T.; Rafiq, N.; Qayoom, O. Assessment of Cardiovascular Fitness [VO2max] among Medical Students by Queens College Step Test. Int. J. Biomed. Adv. Res. 2015, 6, 418–421. [Google Scholar]
- Grant, C.C.; Murray, C.; Janse Van Rensburg, D.C.; Fletcher, L. A Comparison between Heart Rate and Heart Rate Variability as Indicators of Cardiac Health and Fitness. Front. Physiol. 2013, 4, 65494. [Google Scholar] [CrossRef]
- Astorino, T.A.; Allen, R.P.; Roberson, D.W.; Jurancich, M. Effect of High-Intensity Interval Training on Cardiovascular Function, O2max, and Muscular Force. J. Strength Cond. Res. 2012, 26, 138. [Google Scholar] [CrossRef]
- Buttar, K.; Saboo, N.; Kacker, S. A Review: Maximal Oxygen Uptake (VO2max) and Its Estimation Methods. Int. J. Phys. Educ. Sports Health 2019, 6, 24–32. [Google Scholar]
- Lee, J.; Zhang, X.L. Physiological Determinants of VO2max and the Methods to Evaluate It: A Critical Review. Sci. Sports 2021, 36, 259–271. [Google Scholar] [CrossRef]
- Skinner, J.S.; Gaskill, S.E.; Rankinen, T.; Leon, A.S.; Rao, D.C.; Wilmore, J.H.; Bouchard, C. Heart Rate versus %VO2max: Age, Sex, Race, Initial Fitness, and Training Response—HERITAGE. Med. Sci. Sports Exerc. 2003, 35, 1908–1913. [Google Scholar] [CrossRef]
- Matabuena, M.; Vidal, J.C.; Hayes, P.R.; Huelin Trillo, F. A 6-Minute Sub-Maximal Run Test to Predict VO2max. J. Sports Sci. 2018, 36, 2531–2536. [Google Scholar] [CrossRef]
- Eaton, T.; Young, P.; Milne, D.; Wells, A.U. Six-Minute Walk, Maximal Exercise Tests. Am. J. Respir. Crit. Care Med. 2005, 171, 1150–1157. [Google Scholar] [CrossRef] [PubMed]
- Jalili, M.; Nazem, F.; Sazvar, A.; Ranjbar, K. Prediction of Maximal Oxygen Uptake by Six-Minute Walk Test and Body Mass Index in Healthy Boys. J. Pediatr. 2018, 200, 155–159. [Google Scholar] [CrossRef]
- Beaverson, J.; Beaudreau, L.; Filkowski, J.; Robinson, C.A.; Matsuda, P.N.; Shumway-Cook, A. Assessing Factors Impacting Community Mobility After Stroke. J. Neurol. Phys. Ther. 2005, 29, 203. [Google Scholar] [CrossRef]
- RehabMeasures Database. 6 Minute Push Test. Available online: https://www.sralab.org/rehabilitation-measures/6-minute-push-test (accessed on 17 November 2024).
- Baattaiah, B.A.; Murray, D.; Cowan, R.E.; Groah, S.L.; Liungberg, I.H.; Rounds, A.K.; Guccione, A.A.; Keyser, R.E. Association of Six Minute Push Test Distance and Measures of Cardiorespiratory Fitness in Spinal Cord Injury: 1472 Board #147 1 June 9: 00 AM–10: 30 AM. Med. Sci. Sports Exerc. 2017, 49, 409. [Google Scholar] [CrossRef]
- Cowan, R.E.; Callahan, M.K.; Nash, M.S. The 6-Min Push Test Is Reliable and Predicts Low Fitness in Spinal Cord Injury. Med. Sci. Sports Exerc. 2012, 44, 1993–2000. [Google Scholar] [CrossRef]
- Solanki, R.; Chaudhari, P.; Bhise, A. Cardio Respiratory Fitness Testing in Spinal Cord Injury Patients Using 6 Minute Push Test. Heal. J. 2017, 7, 60–63. [Google Scholar]
- Verschuren, O.; Ketelaar, M.; De Groot, J.; Vila Nova, F.; Takken, T. Reproducibility of Two Functional Field Exercise Tests for Children with Cerebral Palsy Who Self-Propel a Manual Wheelchair. Dev. Med. Child Neurol. 2013, 55, 185–190. [Google Scholar] [CrossRef] [PubMed]
- Peterson, M.J.; Pieper, C.F.; Morey, M.C. Accuracy of VO2max Prediction Equations in Older Adults. Med. Sci. Sports Exerc. 2003, 35, 145–149. [Google Scholar] [CrossRef] [PubMed]
- Midgley, A.W.; Earle, K.; McNaughton, L.R.; Siegler, J.C.; Clough, P.; Earle, F. Exercise Tolerance during VO2max Testing Is a Multifactorial Psychobiological Phenomenon. Res. Sports Med. 2017, 25, 480–494. [Google Scholar] [CrossRef]
- Adelman, M.R.; Goršič, M.; McClatchey, G.; Rammer, J.R. Cardiovascular Assessment of Manual Wheelchair Users With 6-Minute Push Test: VO2 Formula. In Proceedings of the IEEE International Conference on Rehabilitation Robotics (ICORR), Chicago, IL, USA, 12–16 May 2025. [Google Scholar]
- Mayo Clinic Staff. Exercise Intensity: How to Measure It. Available online: https://www.mayoclinic.org/healthy-lifestyle/fitness/in-depth/exercise-intensity/art-20046887 (accessed on 22 February 2025).
- Elgaddal, N.; Kramarow, E.A.; Reuben, C. Physical Activity among Adults Aged 18 and over: United States, 2020. NCHS Data Briefs 2022, 443, 1–8. [Google Scholar]
- Skinner, J.S.; Hutsler, R.; Bergsteinová, V.; Buskirk, E.R. The Validity and Reliability of a Rating Scale of Perceived Exertion. Med. Sci. Sports 1973, 5, 94–96. [Google Scholar]
- Lamb, K.L.; Eston, R.G.; Corns, D. Reliability of Ratings of Perceived Exertion during Progressive Treadmill Exercise. Br. J. Sports Med. 1999, 33, 336–339. [Google Scholar] [CrossRef]
- Borg Scale—RPE. Available online: https://exercise.trekeducation.org/assessment/borg-scale-rpe/ (accessed on 22 February 2025).
- Fasipe, G.; Goršič, M.; Zabre, E.V.; Rammer, J.R. Inertial Measurement Unit and Heart Rate Monitoring to Assess Cardiovascular Fitness of Manual Wheelchair Users during the Six-Minute Push Test. Sensors 2024, 24, 4172. [Google Scholar] [CrossRef]
- Bychkovska, O.; Pattanakuhar, S.; Arora, M.; Postma, K.; Strøm, V.; Joseph, C.; Tederko, P.; Gemperli, A. Gender Differences in Patient Experience among Persons with Spinal Cord Injury: A Comparison across 22 Countries. Disabil. Health J. 2024, 17, 101642. [Google Scholar] [CrossRef]
- Shields, M. Use of Wheelchairs and Other Mobility Support Devices—EBSCOhost. Available online: https://openurl.ebsco.com/contentitem/gcd:13269308?sid=ebsco:plink:crawler&id=ebsco:gcd:13269308 (accessed on 26 February 2025).


| Gender | Age (years) | Height (cm) | Weight (kg) | BMI | ||
|---|---|---|---|---|---|---|
| Female | Male | |||||
| Novice | 8 | 6 | 27 (8) | 169 (8) | 75 (13) | 27 (5) |
| Expert | 3 | 11 | 34 (13) | 177 (12) | 93 (27) | 30 (9) |
| Total | 11 | 17 | 31 (11) | 173 (11) | 84 (23) | 28 (7) |
| Resting HR (bpm) | Max HR (bpm) | VO2max (mL/kg/min) | Laps Completed | Total Distance (m) | RPE [1,2,3,4,5,6,7,8,9,10] | |
|---|---|---|---|---|---|---|
| Novice | 71 (12) | 154 (30) | 20 (6) | 17 (4) | 500 (113) | 5 (2) |
| Expert | 34 (13) | 78 (17) | 141 (33) | 24 (9) | 744 (204) | 6 (2) |
| Total | 75 (15) | 148 (32) | 22 (8) | 23 (8) | 622 (204) | 6 (2) |
Disclaimer/Publisher’s Note: The statements, opinions and data contained in all publications are solely those of the individual author(s) and contributor(s) and not of MDPI and/or the editor(s). MDPI and/or the editor(s) disclaim responsibility for any injury to people or property resulting from any ideas, methods, instructions or products referred to in the content. |
© 2025 by the authors. Licensee MDPI, Basel, Switzerland. This article is an open access article distributed under the terms and conditions of the Creative Commons Attribution (CC BY) license (https://creativecommons.org/licenses/by/4.0/).
Share and Cite
Goršič, M.; Adelman, M.R.; McClatchey, G.; Rammer, J.R. A Practical Cardiovascular Health Assessment for Manual Wheelchair Users During the 6-Minute Push Test. Sensors 2025, 25, 2313. https://doi.org/10.3390/s25072313
Goršič M, Adelman MR, McClatchey G, Rammer JR. A Practical Cardiovascular Health Assessment for Manual Wheelchair Users During the 6-Minute Push Test. Sensors. 2025; 25(7):2313. https://doi.org/10.3390/s25072313
Chicago/Turabian StyleGoršič, Maja, Madisyn R. Adelman, Grace McClatchey, and Jacob R. Rammer. 2025. "A Practical Cardiovascular Health Assessment for Manual Wheelchair Users During the 6-Minute Push Test" Sensors 25, no. 7: 2313. https://doi.org/10.3390/s25072313
APA StyleGoršič, M., Adelman, M. R., McClatchey, G., & Rammer, J. R. (2025). A Practical Cardiovascular Health Assessment for Manual Wheelchair Users During the 6-Minute Push Test. Sensors, 25(7), 2313. https://doi.org/10.3390/s25072313