1. Introduction
Musculoskeletal disorders (MSDs) represent 60% of the work-related health problems in the European Union [
1]. The sixth wave of the European Working Conditions Survey revealed that, in 2015, 54% of the Portuguese working population suffered from one or more MSDs in the previous 12 months [
1]. Despite the economy’s advances towards automation, many jobs still consist of risky and physically demanding tasks [
2]. Working in regular or sustained awkward postures constitutes a risk factor for developing work-related musculoskeletal disorder (WRMSDs) [
3]. Their consequences are associated with work-limiting pain that decreases psychological health, job satisfaction, and productivity, and it may lead to worker absenteeism or even early retirement [
1,
3]. MSDs were responsible for 60% of permanent work incapacity [
4] and, in 2015, 53% of the workers with WRMSDs reported work absences [
1]. The total costs of WRMSDs are estimated at up to 2% of the gross domestic product of the European Union (EUR 240 billion) [
4].
Agriculture and construction are the leading activity sectors in WRMSDs’ reports, with prevalences up to, respectively, 60% (for backache) and 54% (for upper limbs) [
1]. Regarding the agriculture sector, harvesting workers reported a WRMSDs’ prevalence of 86% during one year [
5]. In 2015, among the construction sector’s workers, excessive effort from lifting and lowering caused 30% of the WRMSDs, while pushing, pulling, holding, carrying, and catching were responsible for 37% [
6]. Particularly, bricklayers spend 93% of their working time bending, twisting, and performing repetitive motions [
6].
Taking proper preventive measures can lower the risk of WRMSDs. Indeed, MSDs have proven to be less frequent when an ergonomic risk analysis that leads to the adoption of interventions is conducted [
7].
There are a variety of tools available for WRMSDs’ risk assessment. The most used ones are based on observation, conducted by an expert. However, most ergonomic tools are based on sampled snapshot assessments of the postures sustained by the worker throughout their work shift. These methods are very time-consuming, depend on the ergonomist’s experience, and disregard the impact of previous postures on the actual risk [
8]. Furthermore, since typical ergonomic assessment tools are based on the ergonomists’ observations, they were designed to be practical and easy to apply, resulting in simple methods that, by themselves, do not convey an explanatory risk analysis. For an objective and reliable ergonomic assessment, sensor-based measurements are required [
3]. Nonetheless, these direct methods can acquire a substantial amount of data, and providing too much information can make the analysis cumbersome. Intuitive and expeditious manners are required to display sensor-based information.
Every job consists of a series of tasks with a certain goal [
9], whose accomplishment requires a series of postures. By decomposing the work tasks into postures, a more detailed risk assessment is possible. For example, one can determine the critical points that need to be modified in the task [
9] and can assess each posture class separately, providing greater comprehensibility and allowing the improvement in ergonomics [
9], while considering productivity and the task goal. Withal, determining those postures’ occurrences is challenging since a manual recording, by the worker or the ergonomist, of the sequence of postures is neither practical nor feasible. Lately, automated posture recognition has been gaining importance in context-aware systems in several domains, such as health and ambient assisted living [
10]. These methods facilitate continuous monitoring and can be a solution. Artificial Intelligence (AI) solutions are more appropriate than other automated approaches (e.g., finite-state machines) for activity or posture recognition, due to the considerable complexity associated with the number of body segments involved and intra- and inter-subject variability. AI models encompass traditional Machine Learning (ML) algorithms, which primarily depend on domain knowledge to wisely design features [
11,
12]. Deep Learning (DL) is a type of ML, in which features are automatically extracted in multiple layers of the learning models, deep neural networks, fed with raw input data [
13]. Particularly, DL approaches have become more used, and they have outperformed ML in many applications, overcoming the ML’s limitation of handcrafted feature extraction [
13,
14]. Furthermore, DL’s ability to automatically learn high-level and meaningful features from high-dimensional data leads to high recognition rates, making it particularly suitable for learning complex patterns from data in intricate tasks like posture recognition.
Considering all this, there is a need for a holistic digital tool that facilitates ergonomists’ work and workers’ understanding of the posture risk, empowering them with a detailed, comprehensive, and understandable risk analysis. Hence, this manuscript aims to develop a framework that objectively assesses and quantifies the ergonomics of workers’ postures. It expeditiously provides information about the ergonomic risk the worker is exposed to and the impact of the postures’ accumulation. This information can be used by the workers, managers, and ergonomists to identify the risk source and possibly redesign tasks or re-educate postural habits, and, thus, prevent musculoskeletal disorders. The identification of the postures responsible for increasing the ergonomic risk takes advantage of DL models, due to their ability to recognise human movements continuously and automatically, without the need to manually define the movement features.
This study aims to answer the following research questions:
How can the accumulation of postural ergonomics risk over time be quantified?
How can ergonomic risk be associated with the specific postures that lead to it?
Can an ergonomic assessment tool be simultaneously easy to use and comprehensive for end users?
The main contributions of this work are:
The automation, using wearable sensors, of two ergonomic tools, one for agriculture and physically hazardous works.
The delineation of posture risk levels through an ergonomic index that takes into account the impact of previous postures on the actual ergonomic risk.
The identification of which postures lead to the highest ergonomic risk in the addressed activity sectors, based on the collected inertial data, by combining the posture recognition outputs with the computed ergonomic scores.
An easy-to-use graphical user interface (GUI) that presents an intuitive and comprehensive posture assessment, validated by ergonomists.
The paper is organised as follows:
Section 2 explores how the previous literature studies implemented systems for posture assessment based on Inertial Measurement Units (IMUs);
Section 3 proposes the overall framework for a holistic ergonomic assessment;
Section 4 describes the methodology used to acquire and process the inertial data;
Section 5 presents the results;
Section 6 discusses them; and
Section 7 summarises the main conclusions and prospects future work.
4. Materials and Methods
Data acquisition was conducted inside a laboratory in the School of Engineering of the University of Minho, in alignment with the ethical procedures of the Ethics Committee in Life and Health Sciences (CEICVS 147/2021), following the standard set by the declaration of Helsinki and the Oviedo Convention.
4.1. Participants
A total of 13 subjects (9 males and 4 females; age: 24.3 ± 1.9 years old) from the academic community of the University of Minho accepted to participate in the data acquisition. Very physically distinct participants (body mass: 67.0 ± 11.7 kg; body height: 172.2 ± 11.4 cm; hip height: 95.8 ± 8.0 cm; arm span: 170.4 ± 12.6 cm) were selected to obtain a dataset that considers the possible variability associated with the physical stature in posture execution. Also, the subjects were selected based on the following inclusion criteria: healthy, without clinical history or evidence of motor injuries.
4.2. Hardware Setup
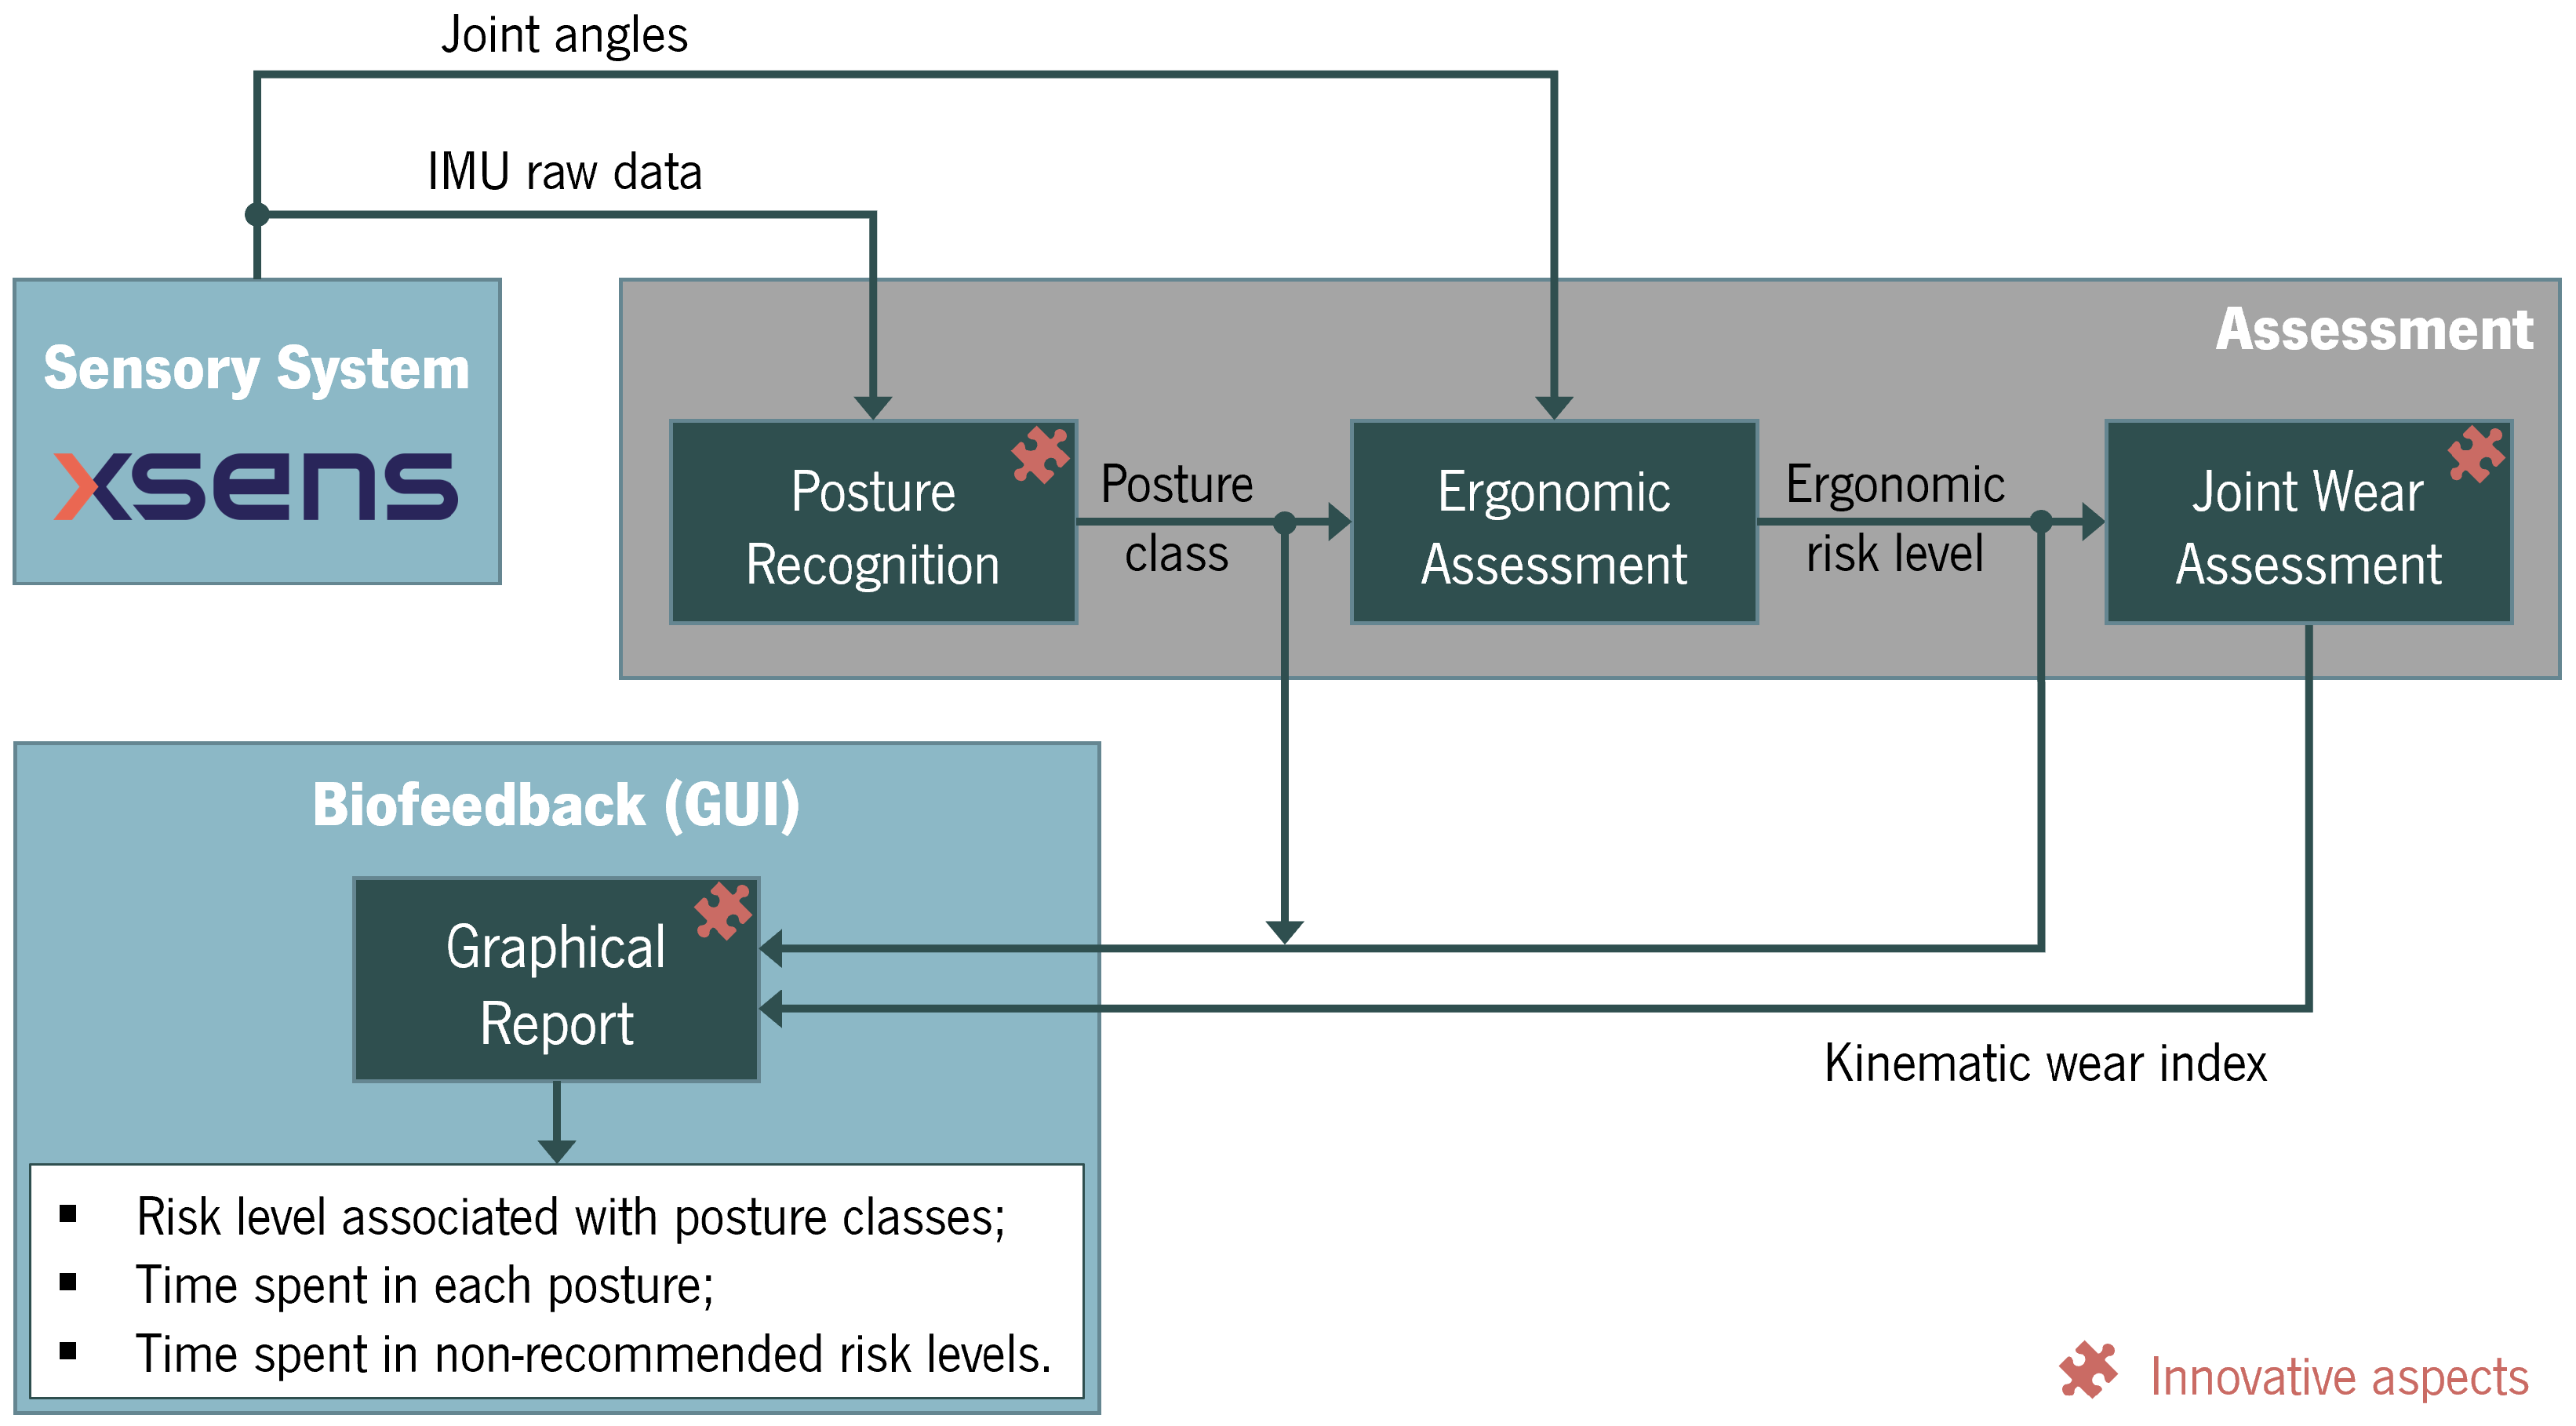
The participants were instrumented with two full-body inertial MoCap systems from Xsens MTw Awinda (Movella Inc., Henderson, NV, USA), a state-of-the-art system. The first one was connected to software Xsens MT Manager 2022.0 (Movella Inc., Henderson, NV, USA), which provided the input for the posture recognition module (raw acceleration and angular velocity). The second system was connected to proprietary software Xsens MVN Analyze 2021.0 (Movella Inc., Henderson, NV, USA) to provide the joint angles to the ergonomic assessment module. Only seven body locations—sternum, right shoulder, right forearm, left forearm, left upper leg, right lower leg, and left foot—were selected, as these were demonstrated to be the most statistically relevant in our previous study [
37]. The two sets of IMUs were stacked with tape. The second one was placed on the bottom, closer to the body. The sensors were placed, following the manufacturer’s guidelines (
https://base.xsens.com/s/article/Sensor-Placement-in-Xsens-Awinda-System, accessed on 13 March 2023), over bony landmarks and tightened with straps. The sampling frequency was set to 20 Hz, respecting the Nyquist theorem, since, in our previous work [
37], we verified that the signals’ frequencies in the spectrum lay below 5 Hz. The literature also reports the human movement frequencies to be mostly between 0.3 and 3.5 Hz, with a maximum of 10 Hz [
45]. Moreover, 20 Hz was shown to be optimal for activity recognition [
46].
4.3. Protocol
After the participants’ instrumentation, their anthropometric data were collected to adjust the biomechanical model from Xsens MVN Analyze software for them. The ground truth sensory system was calibrated in N-pose (neutral posture), performing the necessary repetitions until achieving good calibration quality. The other system’s IMUs were turned on after that, to avoid interference.
The participants were instructed to perform two task circuits that replicated real worksites in the agriculture and construction sectors. The protocol was explained without imposing a way to perform each posture. Moreover, participants were told to carry out the tasks at their own pace, since they were not actual workers, and fixed time constraints could induce mental stress.
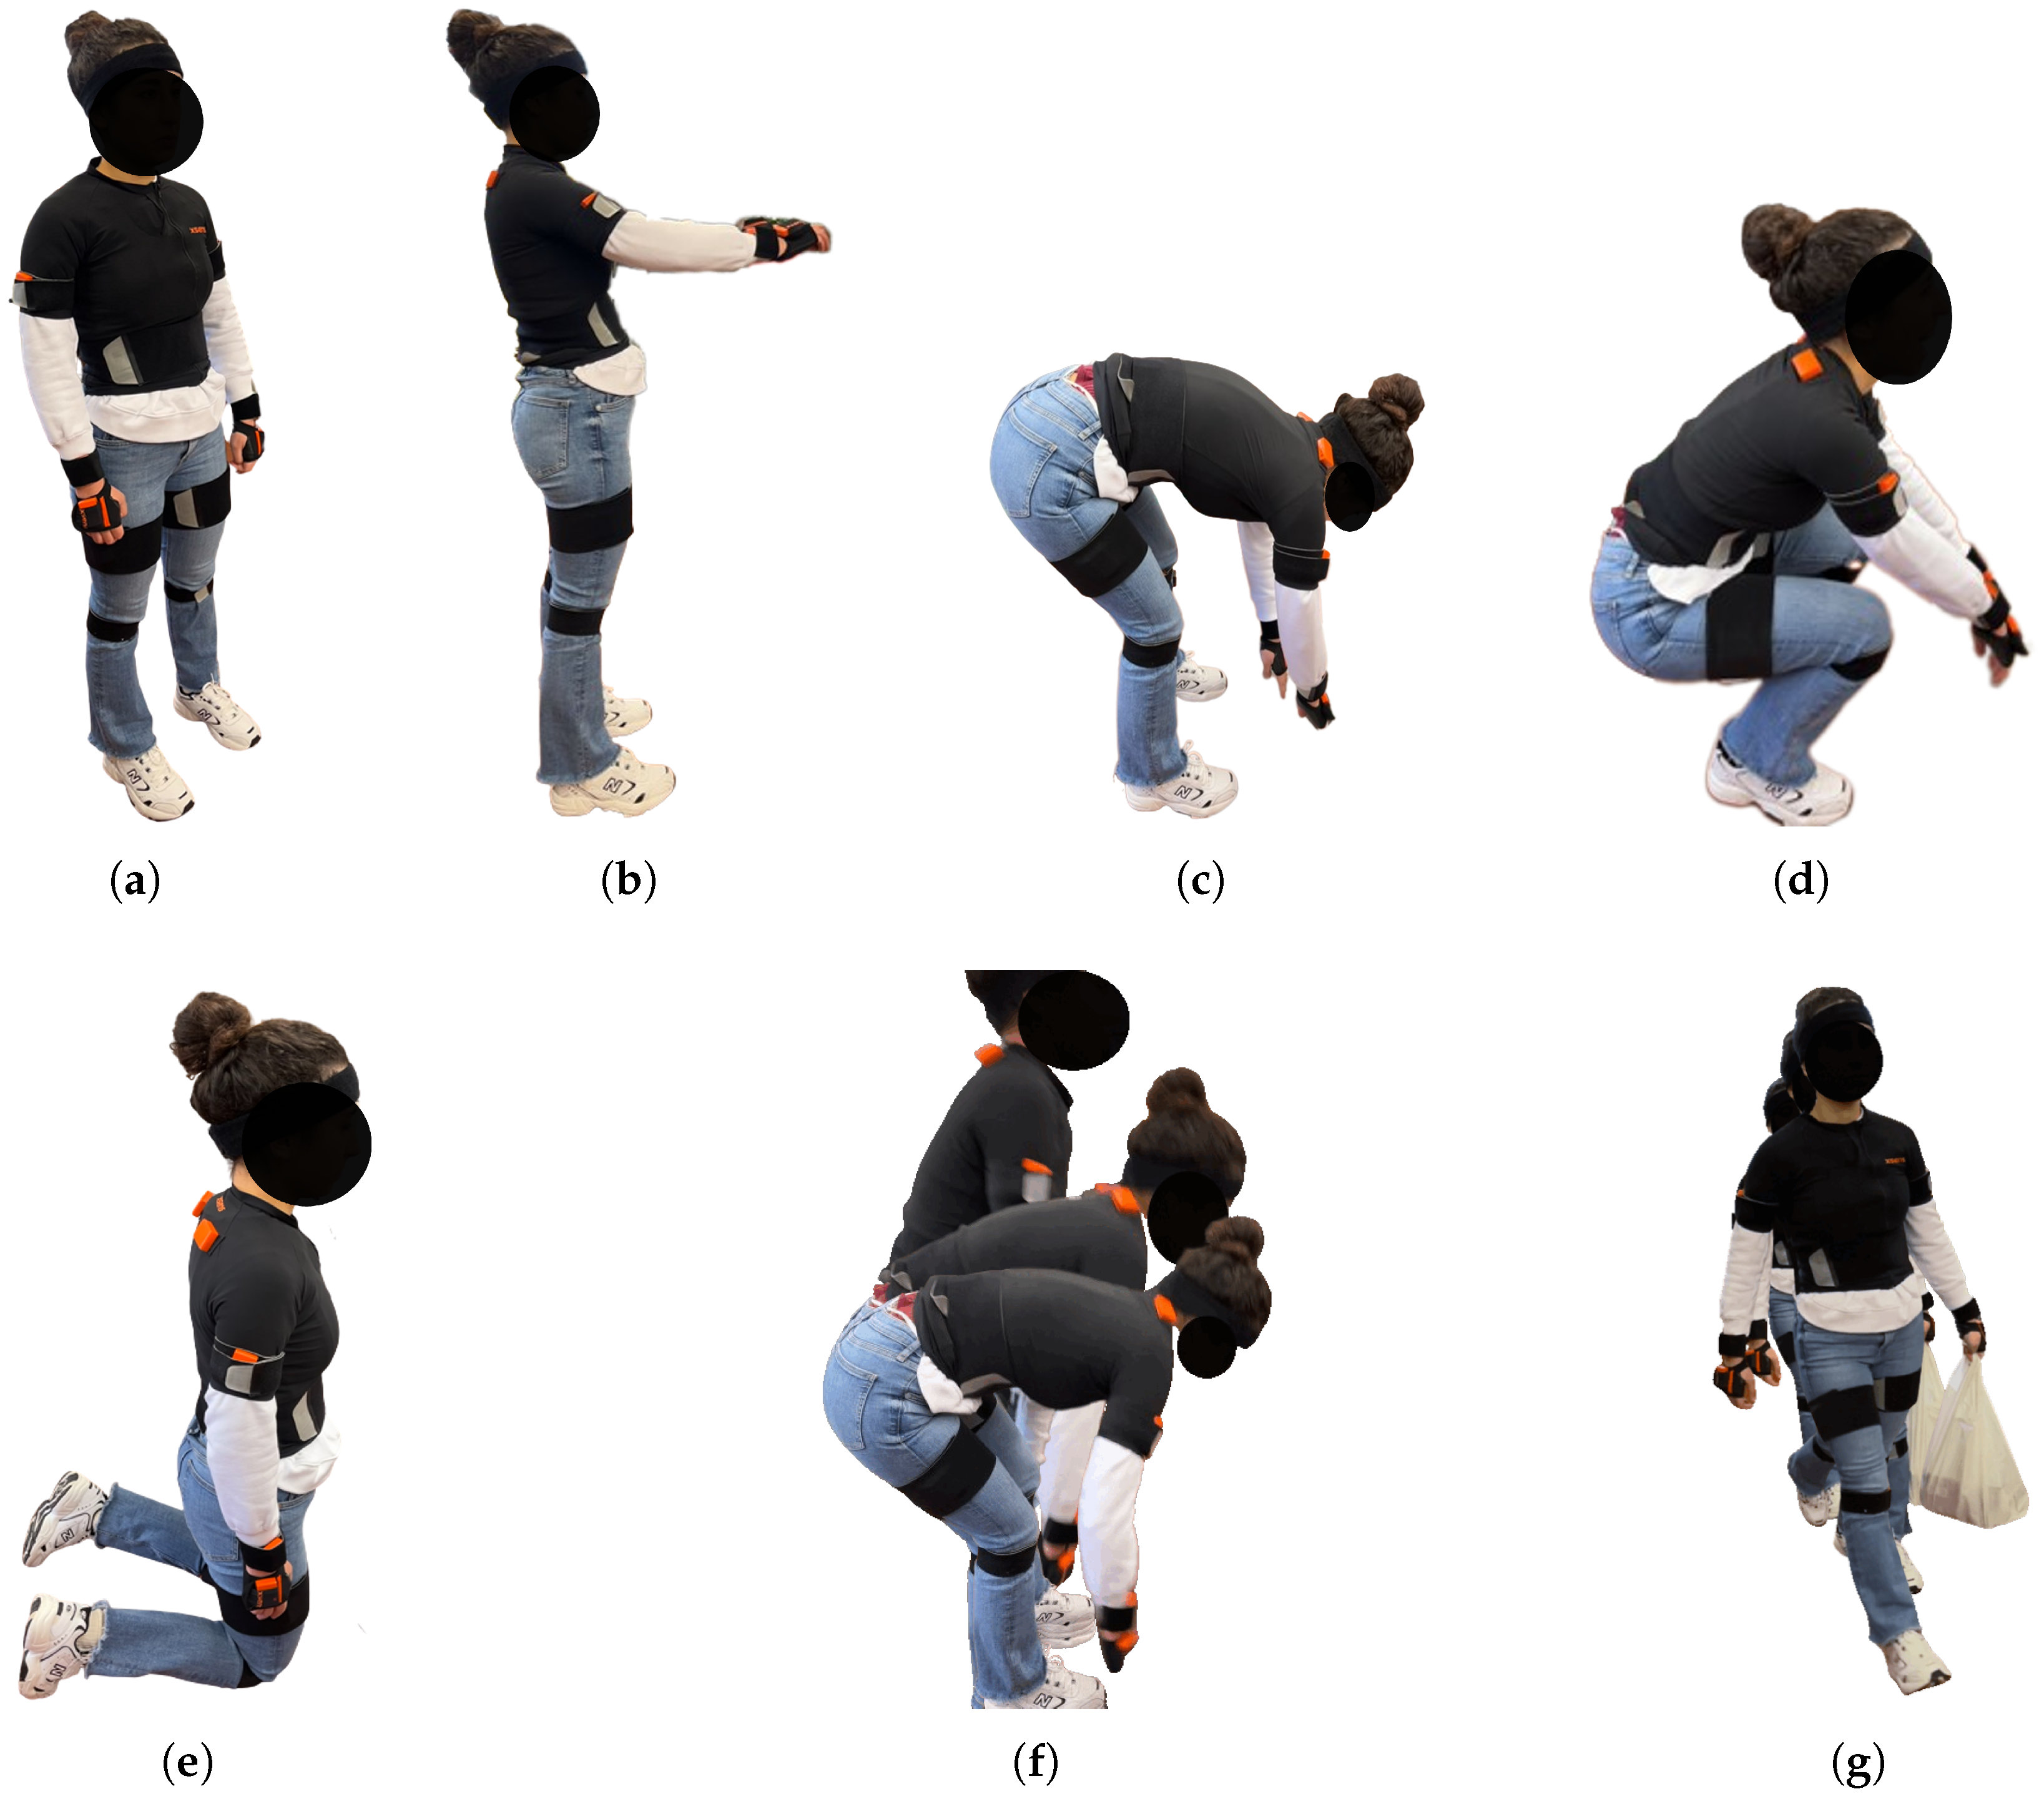
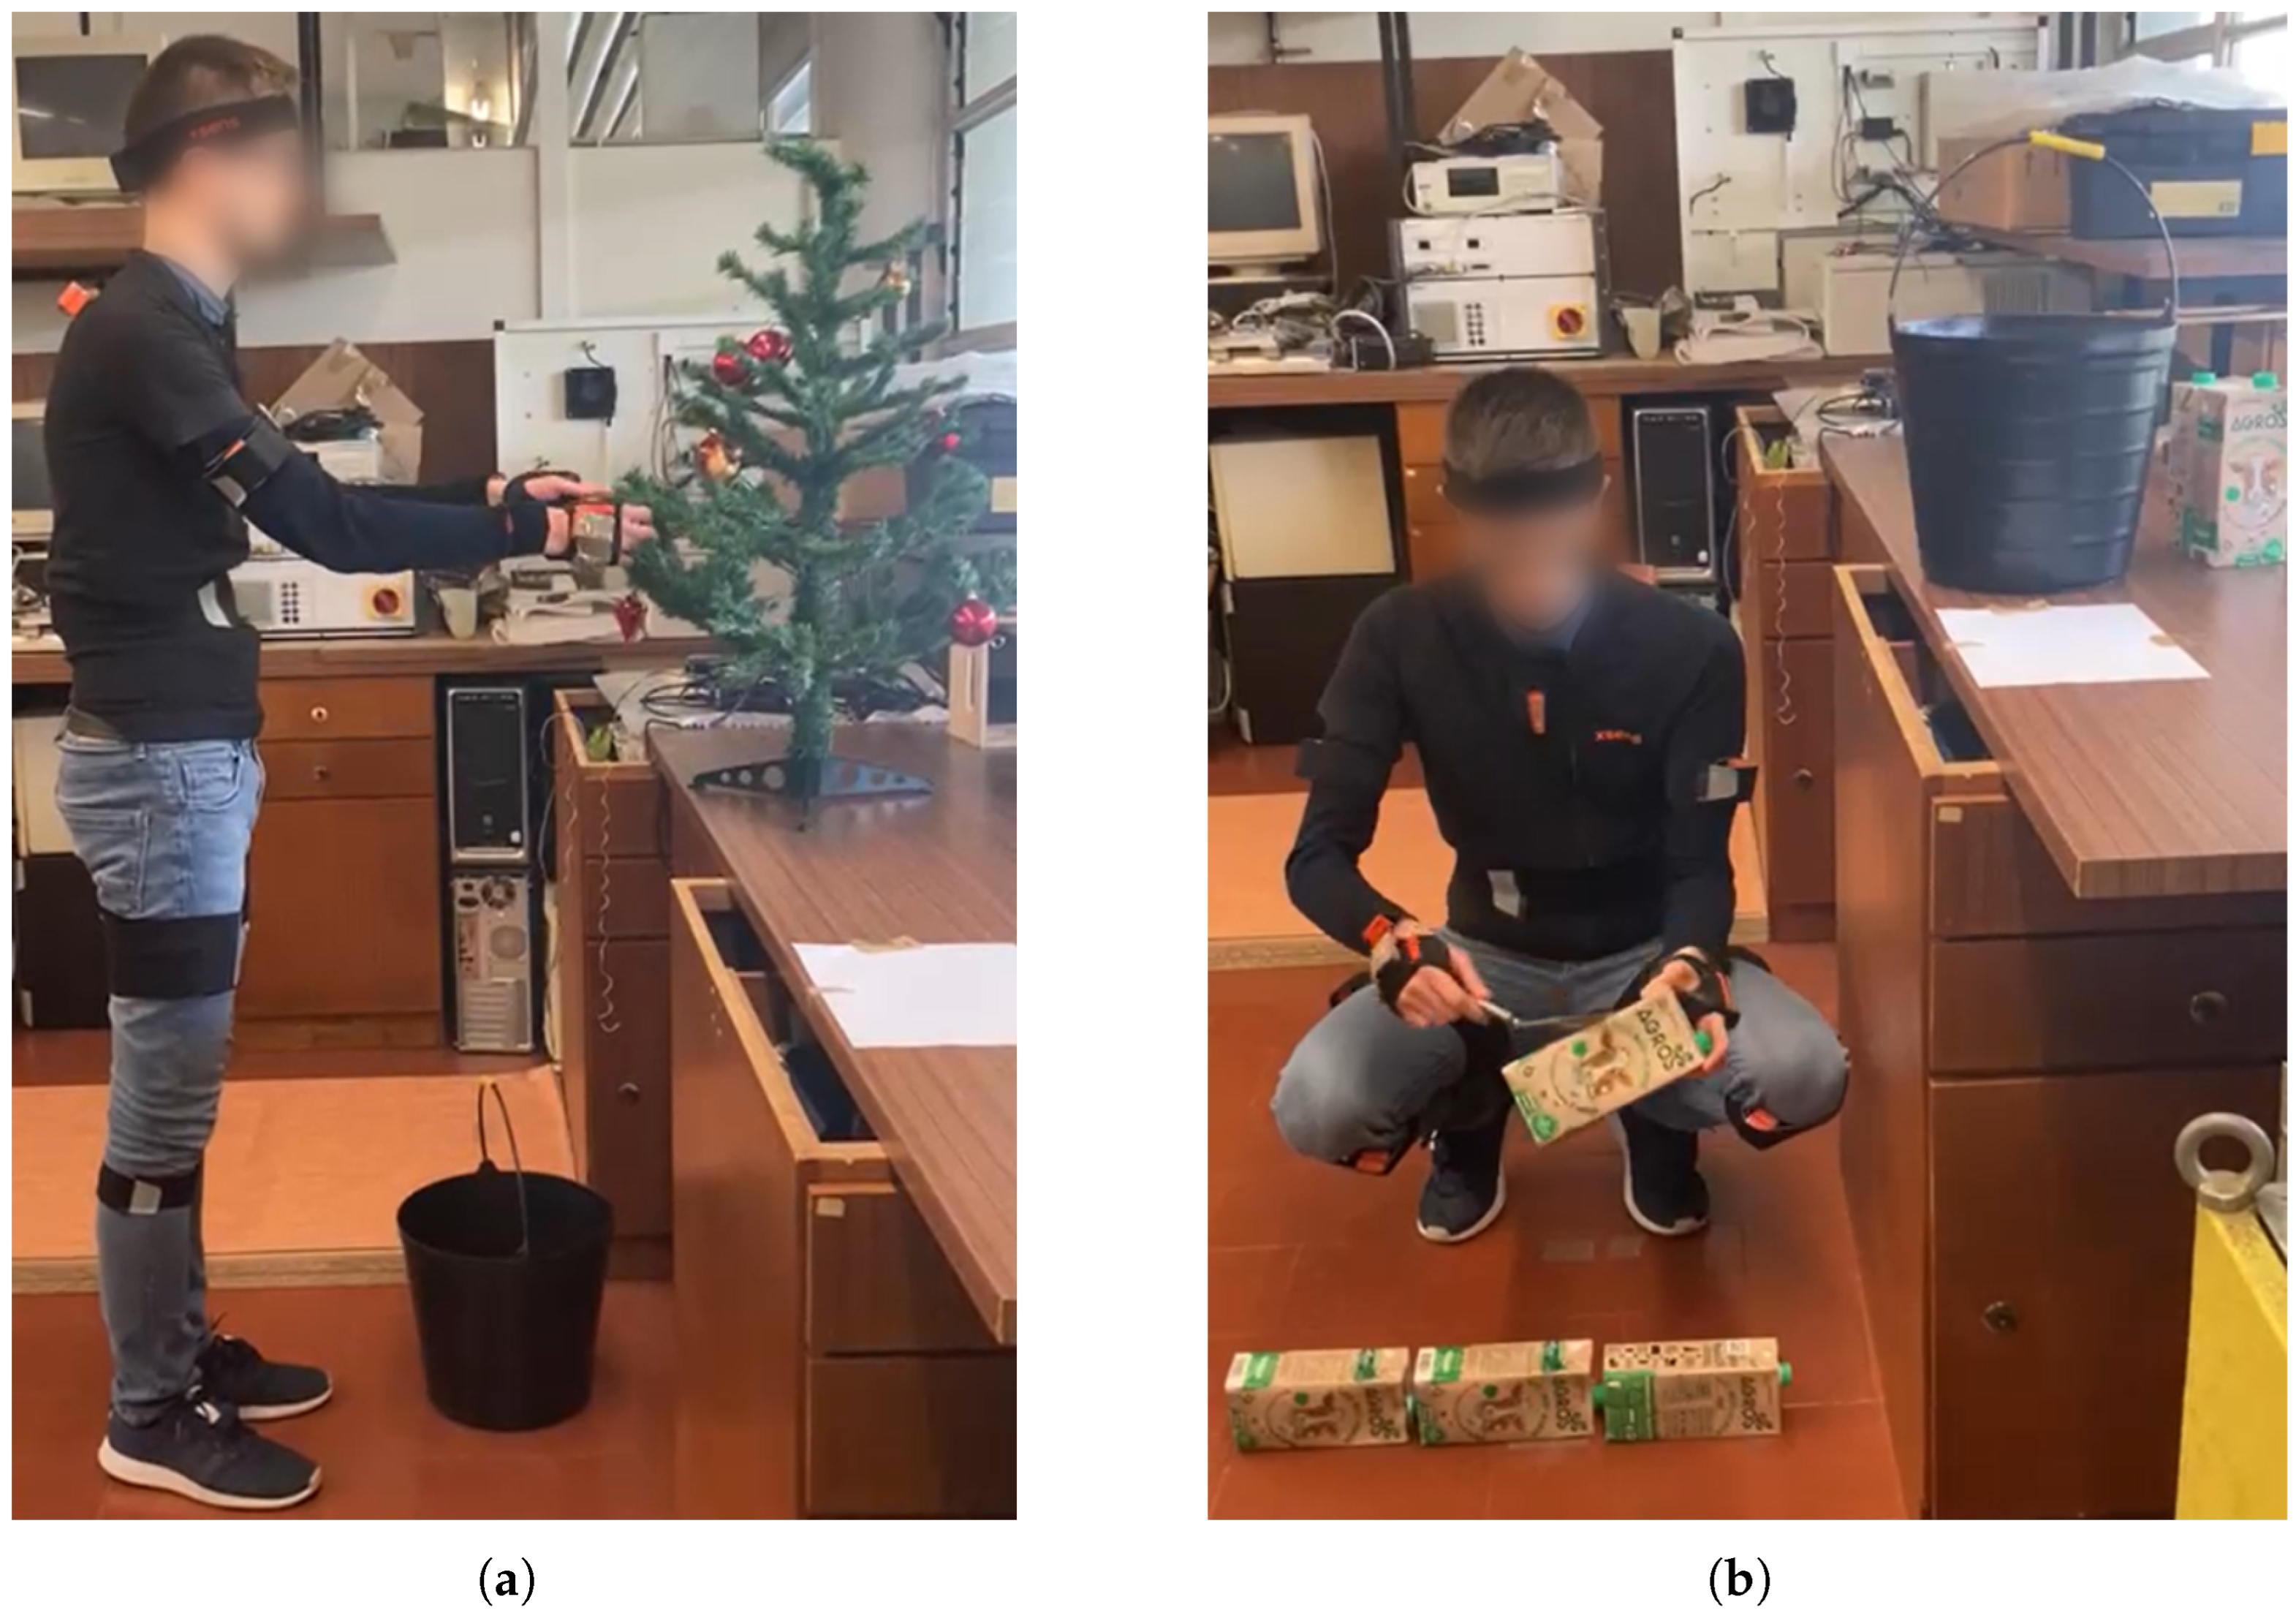
One of the tasks replicated an agriculture task—harvesting and transporting crops. The subjects were to pick a total of 12 Christmas baubles (simulating fruits) from an artificial tree at a height of 90 to 180 cm and put them into a bucket on the floor, one by one, at three sites during each trial, transporting the bucket between each of the harvest sites, located 2.5 m apart. A frame of one trial is presented in
Figure 4a.
A construction task circuit was also performed. Mimicking bricklaying, it consisted of carrying a bucket with six milk cartons (simulating bricks) for 4.5 m, from a starting point to the work site, located one subject-foot from a 90-cm-high workbench, on top of which the subject should place a bucket, and a sheet of paper acted as a mortar tray. The subjects had to stack the milk cartons in two vertical layers to simulate the construction of a wall. With a trowel, the subject simulated spreading mortar on the floor before starting a new layer and on the sides of each milk carton, as shown in
Figure 4b.
4.4. Framework Implementation
The whole pipeline was implemented using Pytorch and Pytorch Lightning libraries in a Python environment. We used a personal laptop with the following specifications: GPU: 1× Nvidia GeForce GTX 1050; CPU: Intel(R) Core(TM) i7-7700HQ @ 2.80GHz (4 core, 8 threads); RAM: 16 GB.
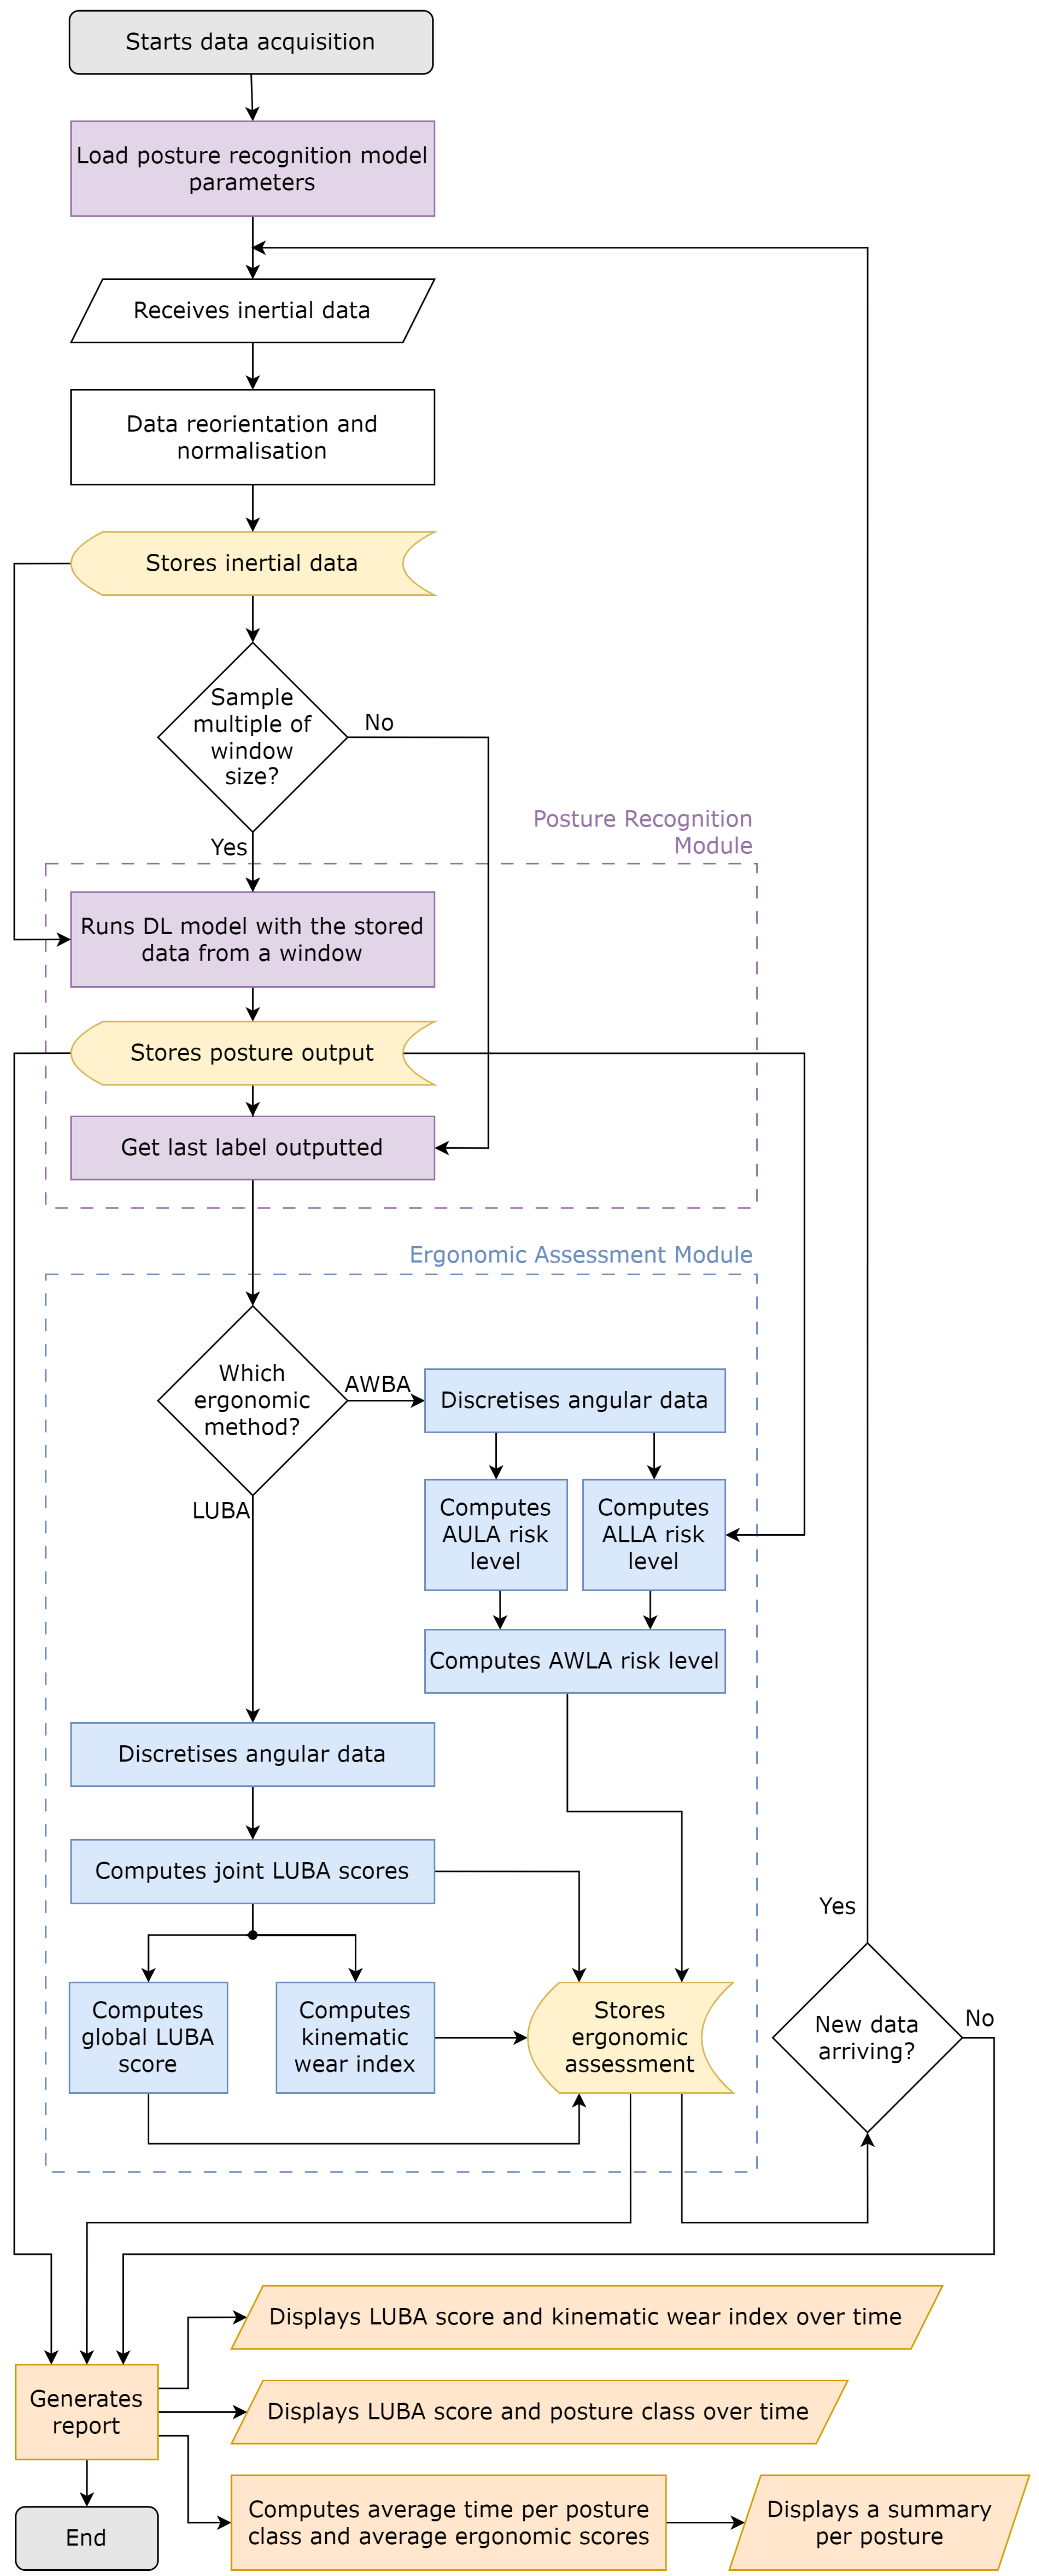
The flowchart of the proposed framework is depicted in
Figure A1 (
Appendix A). Although the proposal is to receive the data one sample at a time (real-time) to allow the future integration of haptic biofeedback cues, which is within the scope of this manuscript, the modules were executed offline, and the data were loaded and processed all together. Note that, with the LUBA ergonomic assessment, the posture class is only needed for generating the report, while, with AWBA, it is also needed for calculating the risk. Both the posture recognition and the ergonomic assessment modules use the data at 20 Hz, but, while the former treats the data in time windows 1 s in size (no overlap), the ergonomic assessment metrics are calculated for each sample.
Figure A2 (in
Appendix A) shows one of the pages of the developed framework’s GUI, where the user can upload the data acquired by the wearable sensors and select the type of analysis from the ones mentioned in
Section 3.4.
4.5. Data Preprocessing
The collected data underwent the same preprocessing steps for the DL model development, as described in [
37].
The raw acceleration and angular velocity were reoriented so that all sensors share the same orientation, with all axes aligned with a reference frame. The original orientation of each IMU was assumed to be the same for all subjects. This is considered reasonable since their instrumentation was verified at the beginning of each trial, and whenever a slippage occurred, the trial was stopped, discarded, and repeated.
To minimise bias in the neural network for posture recognition, as different sensors may have distinct ranges and sensitivities [
47], MinMax normalisation between 0 and 1 was applied to the data. The data were normalised feature-wise using the extreme values of the training set, as the DL model was also trained with data normalised within this range.
4.6. Report Usability Assessment
To assess ErgoReport’s usefulness and usability, ergonomists were invited for an online interview where we presented the system’s goal and the use cases. A demonstration of how to use the GUI, with some example trials, was conducted.
At the end, the ergonomists were asked to fill out a 7-point Likert scale questionnaire (1: strongly disagree; 7: strongly agree). This custom questionnaire addresses three main aspects of the report—its usefulness, ease of use, and usability—and was adapted from the following three different questionnaires: Perceived Usefulness and Ease of Use (PUEU) [
48], Interface Usability Instrument (INUIT) [
49], and Software Usability Measurement Inventory (SUMI) [
50]. With this custom questionnaire, new specific directions for improvement can be pointed out by ergonomists, who are end users.
7. Conclusions and Future Work
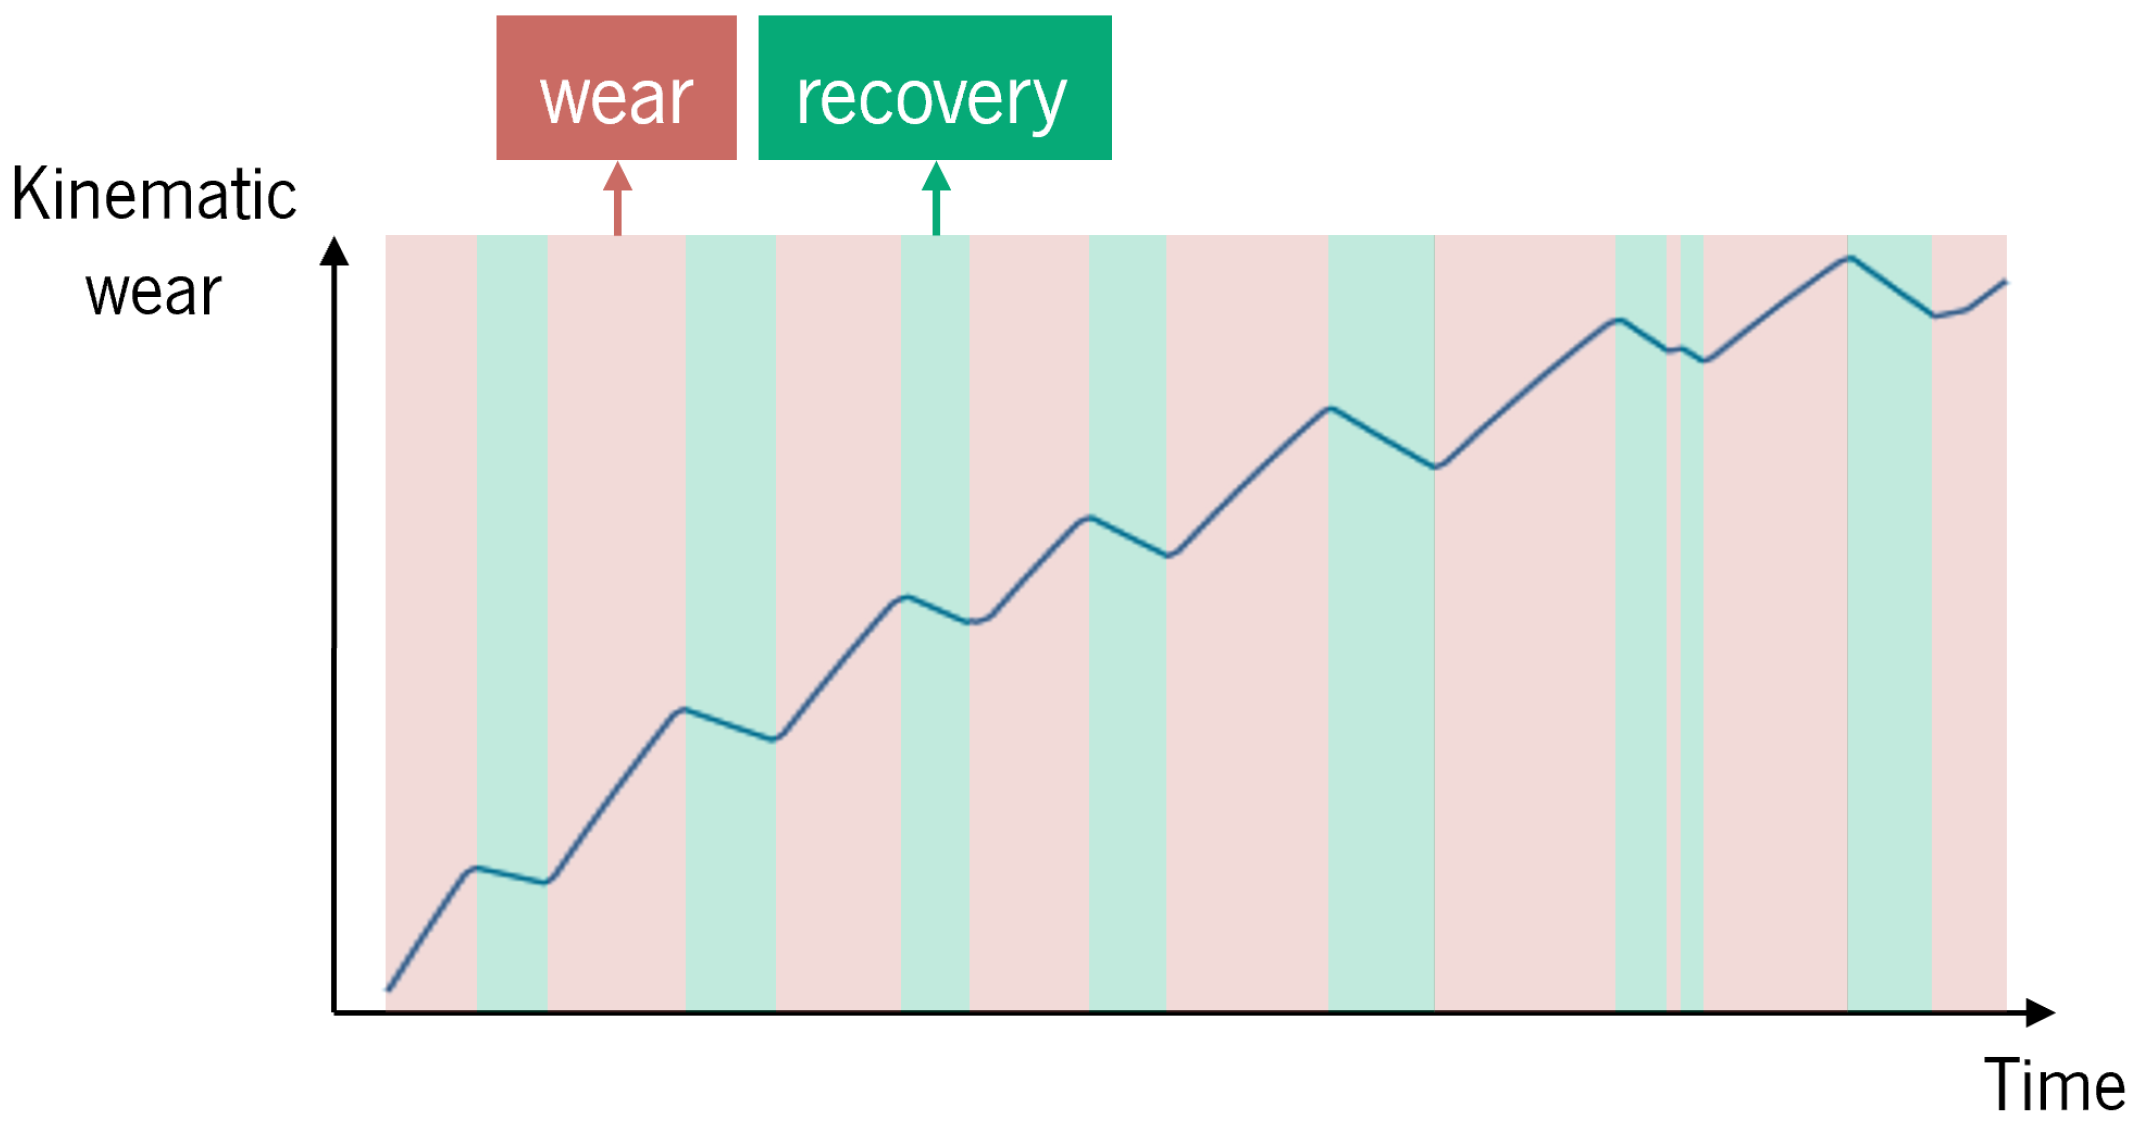
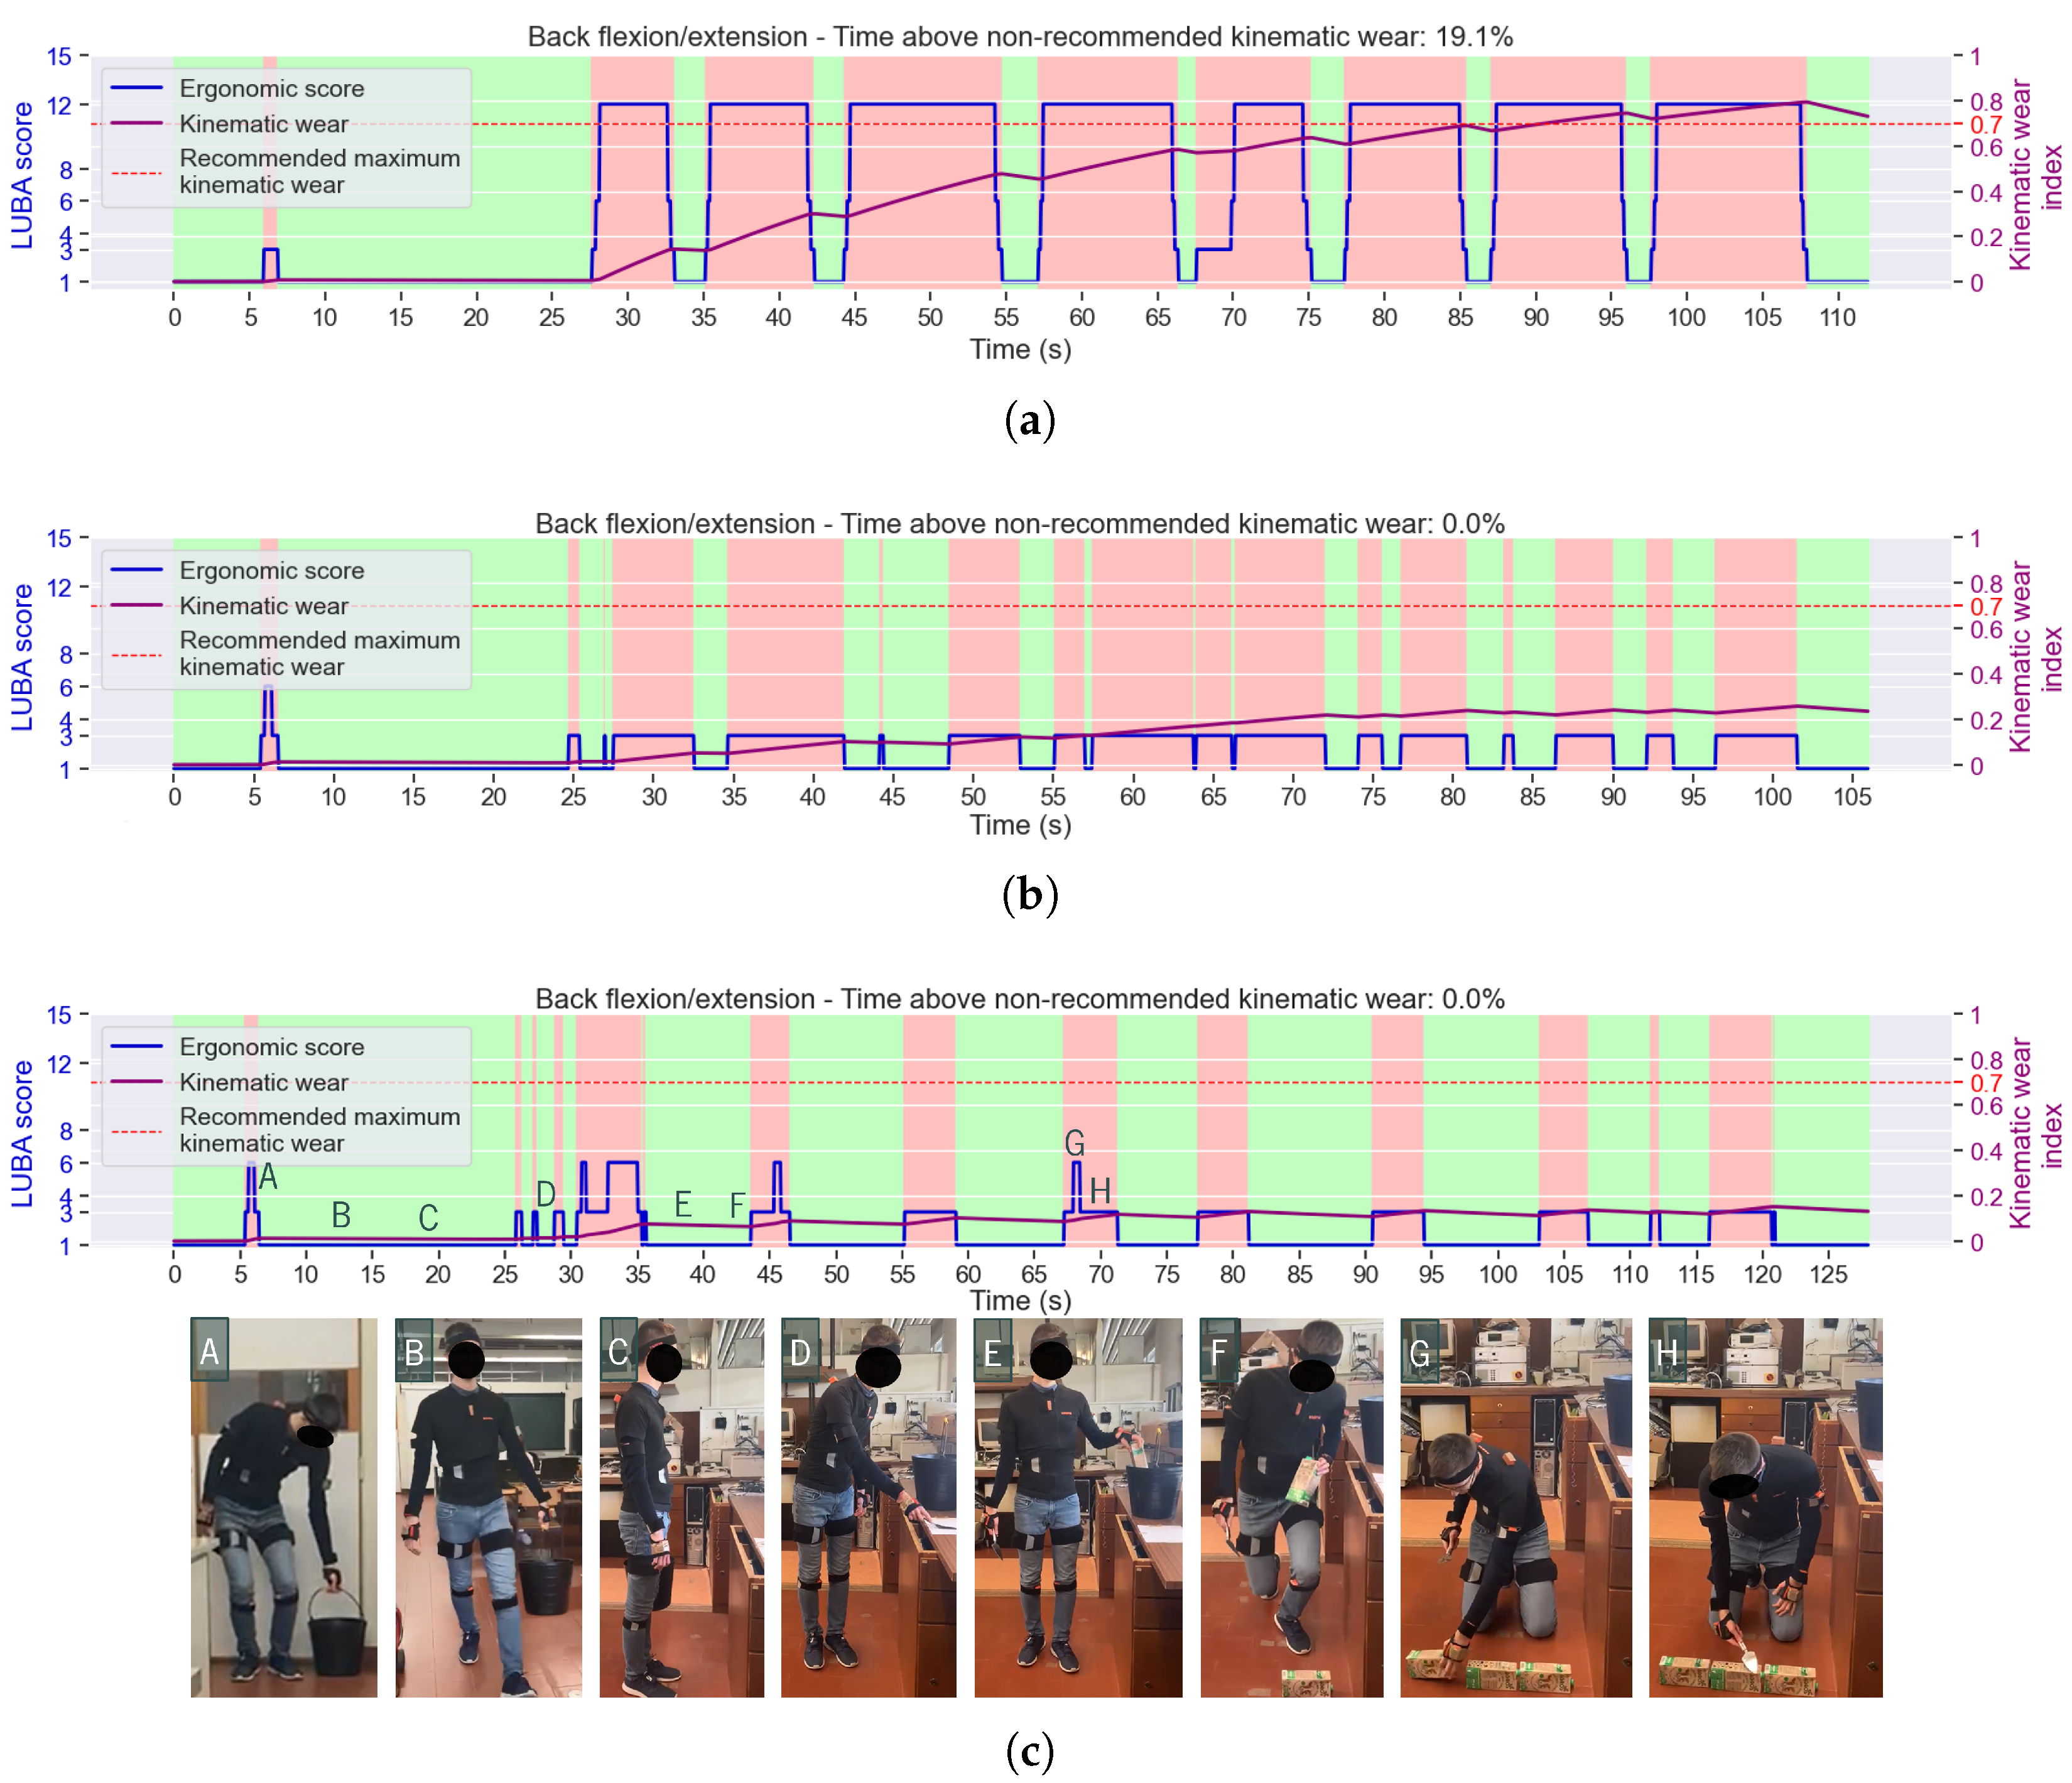
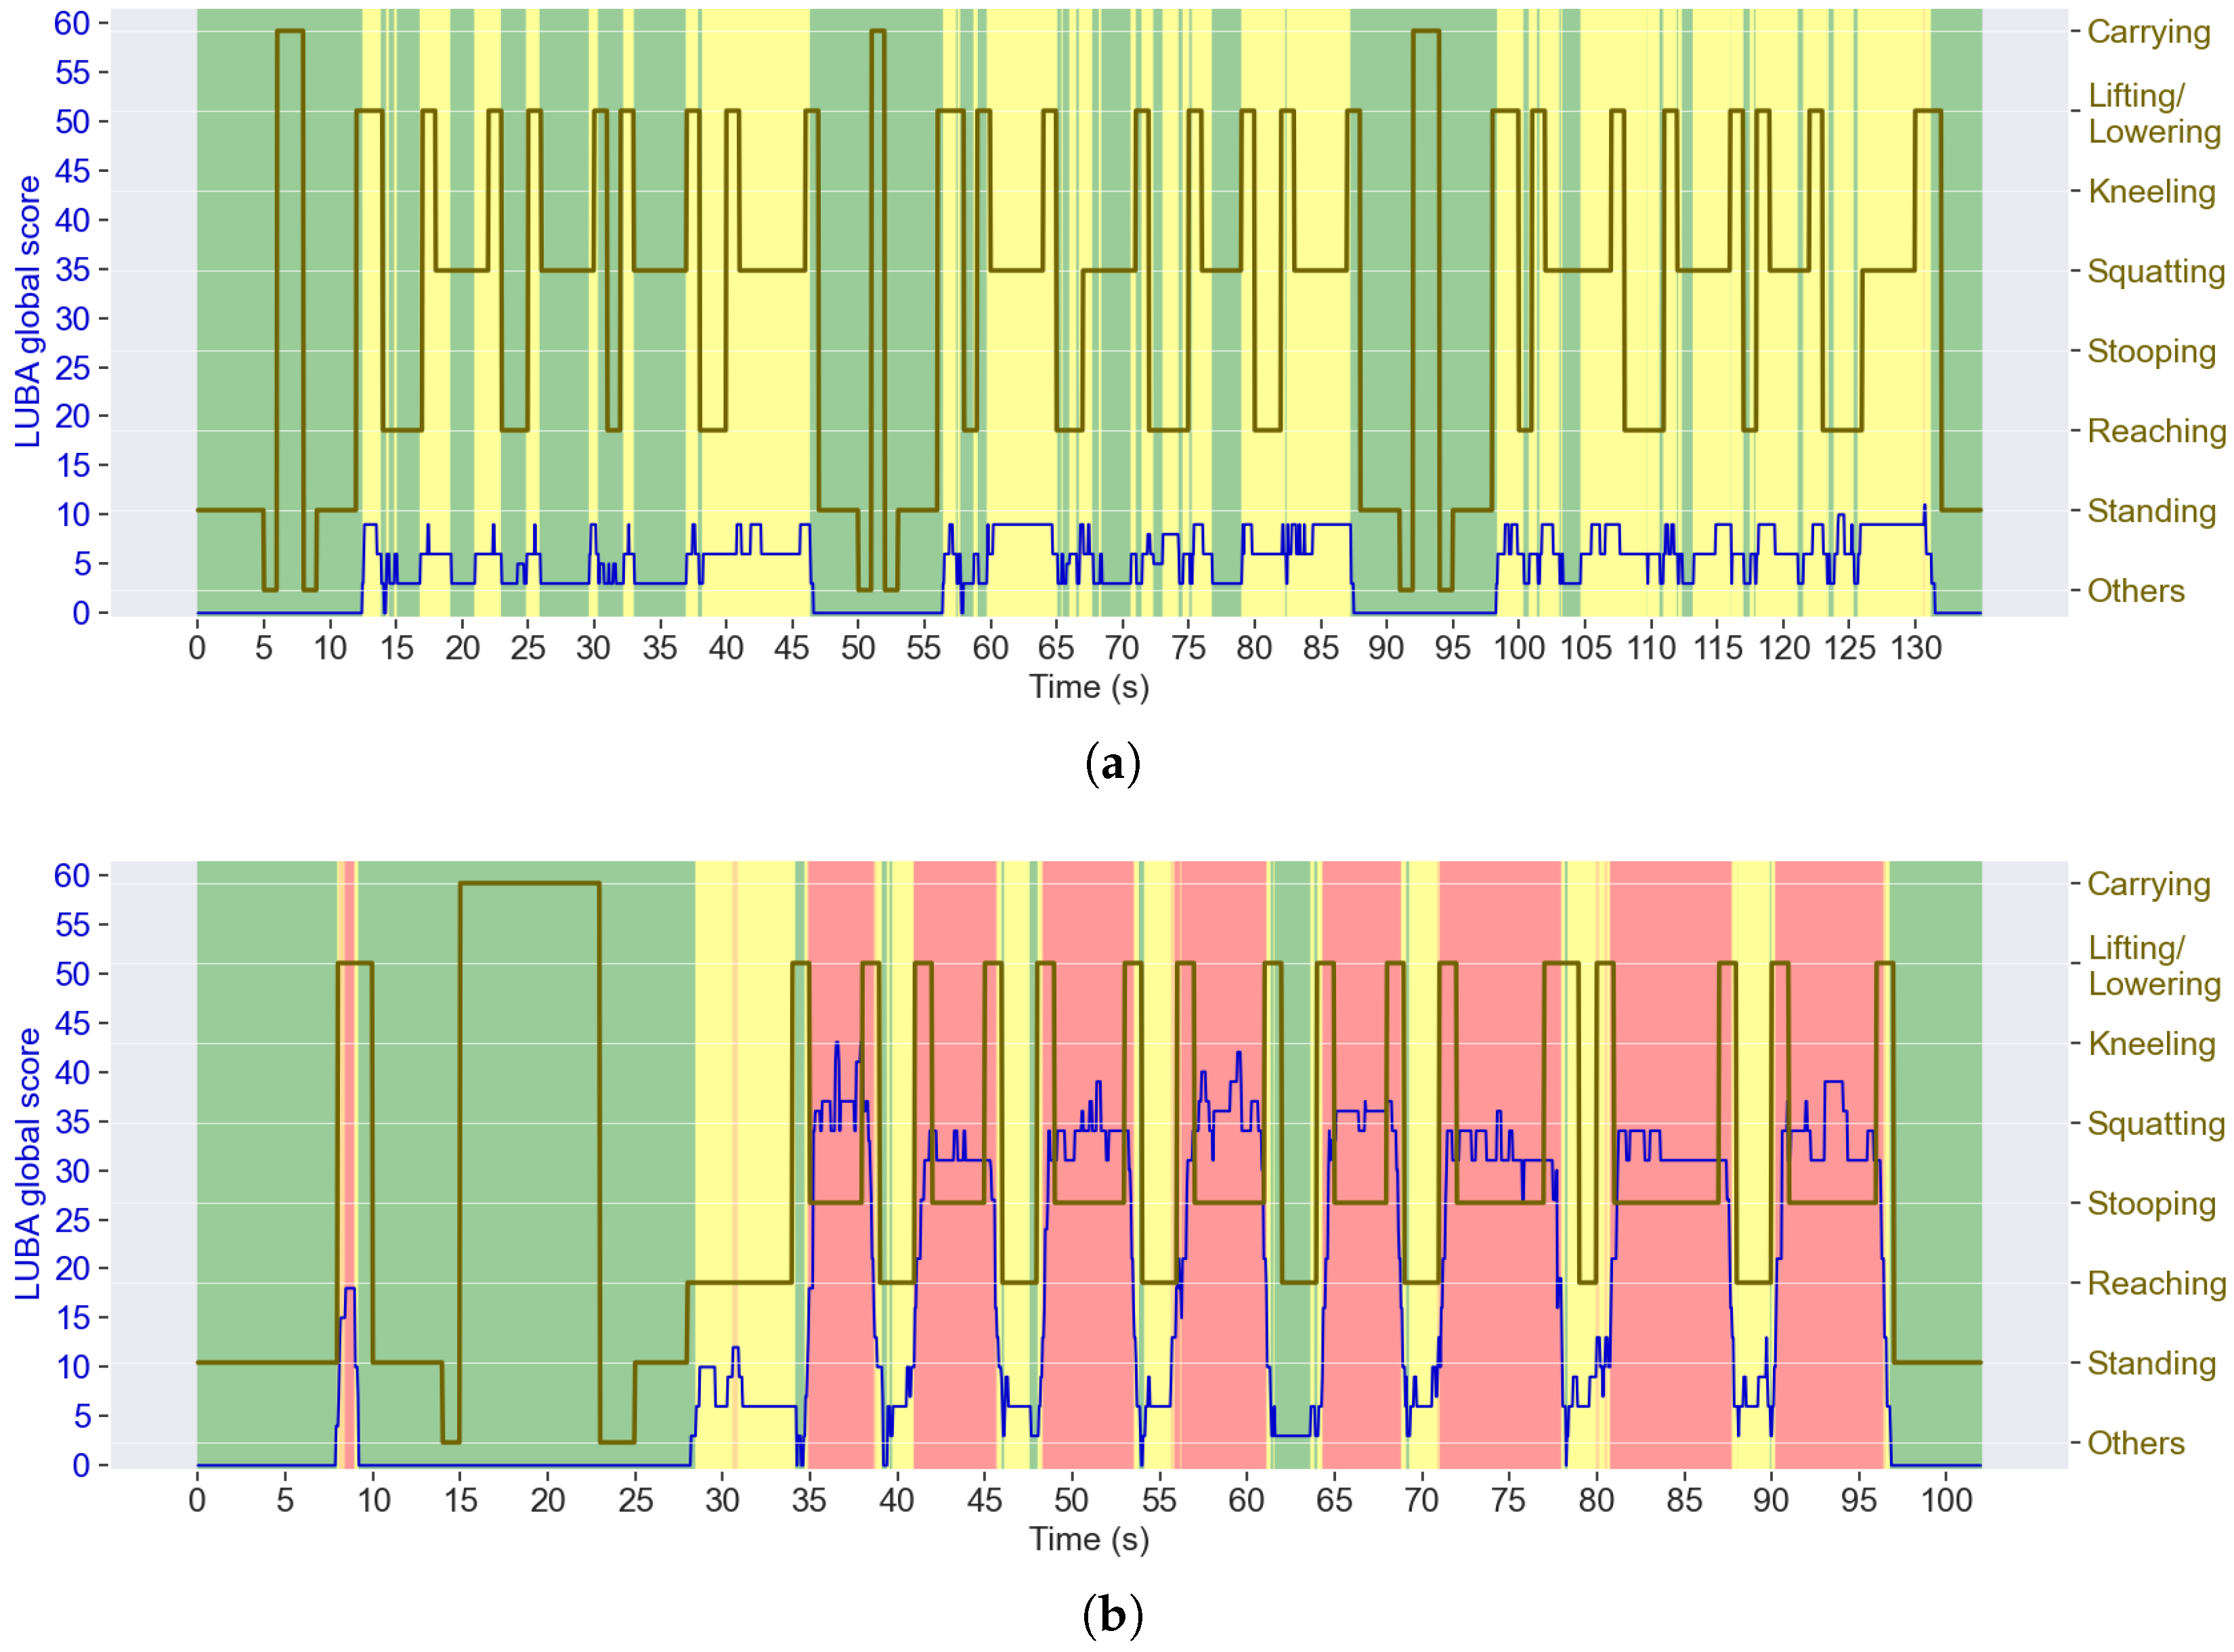
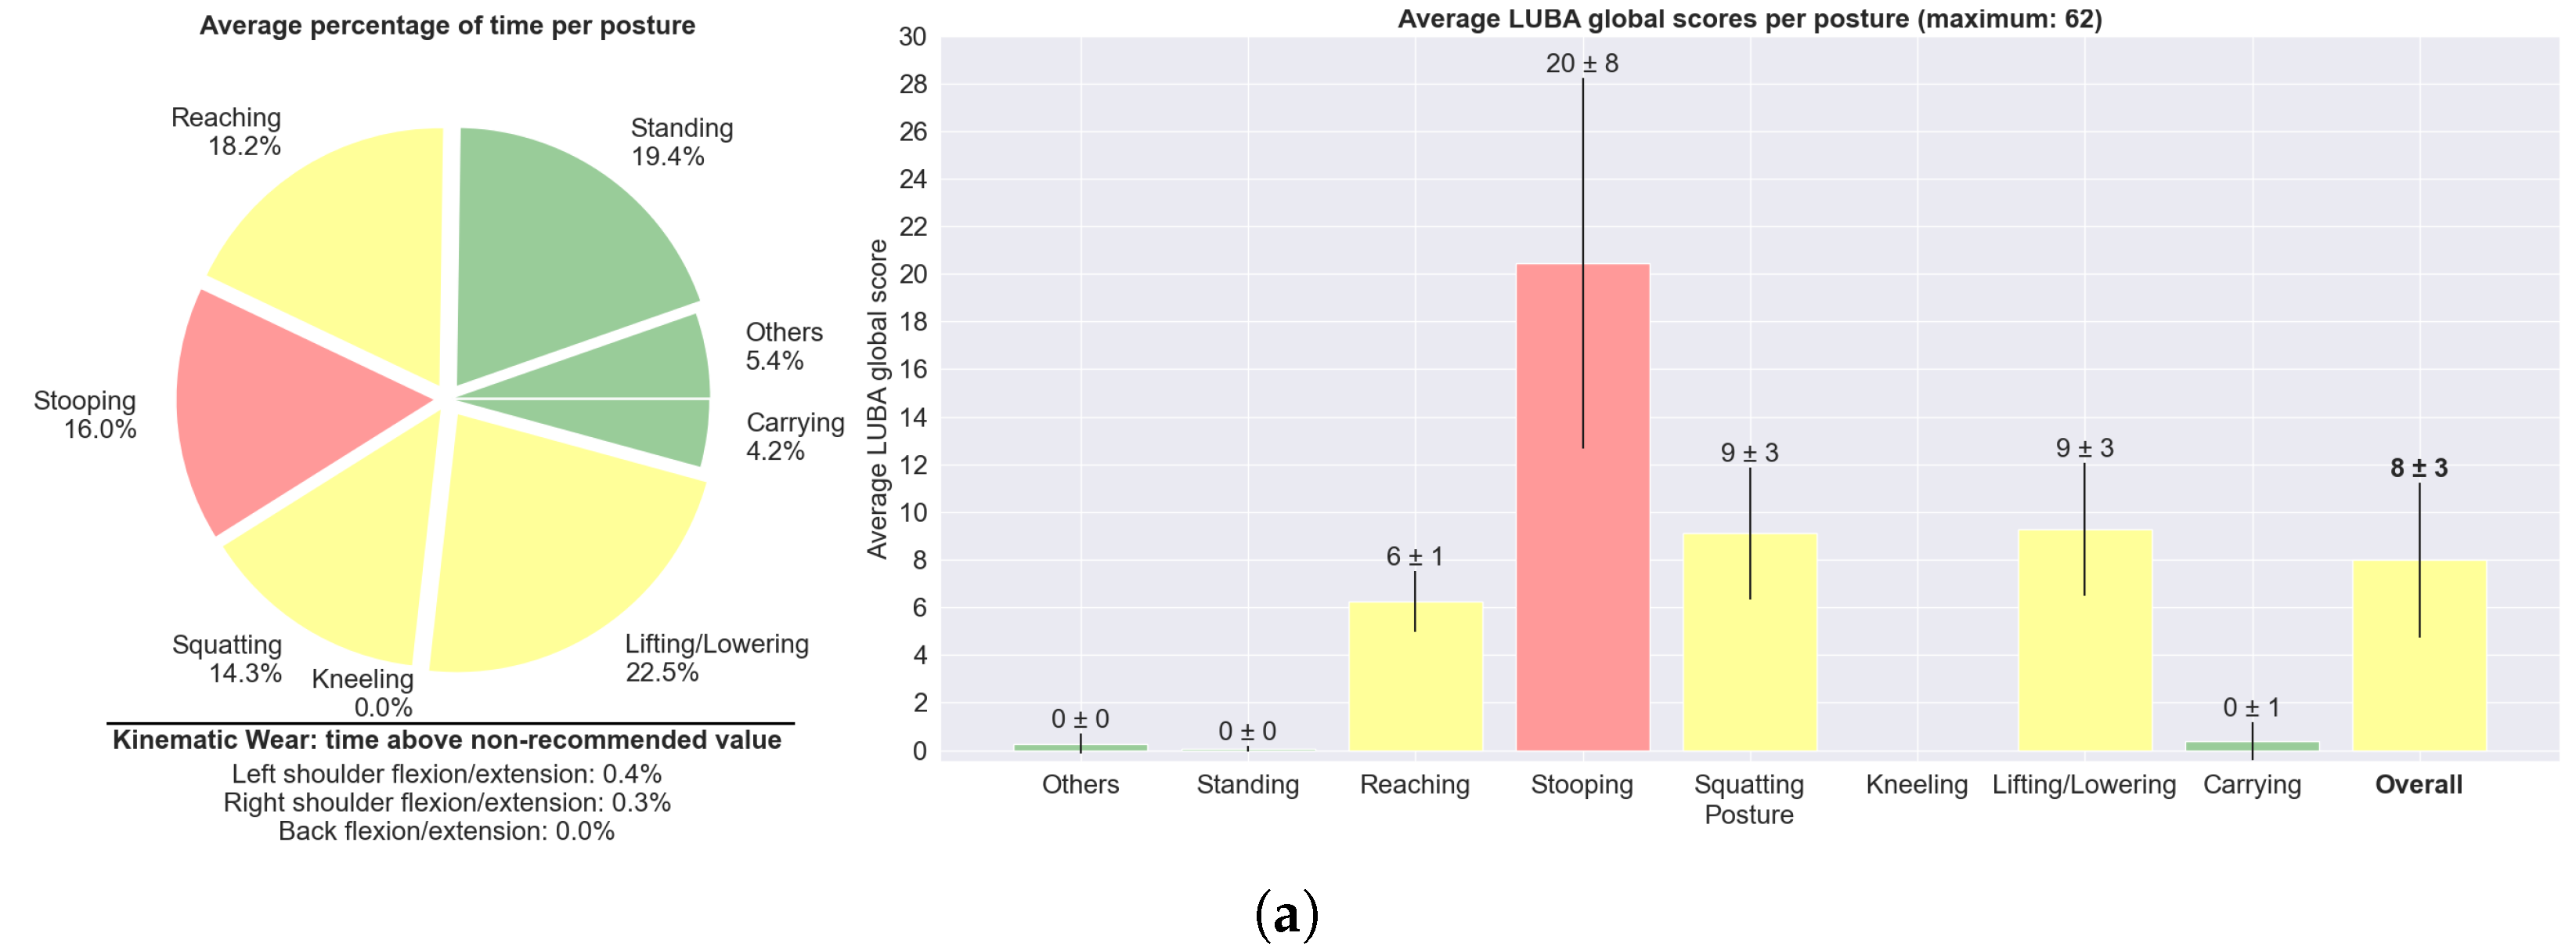
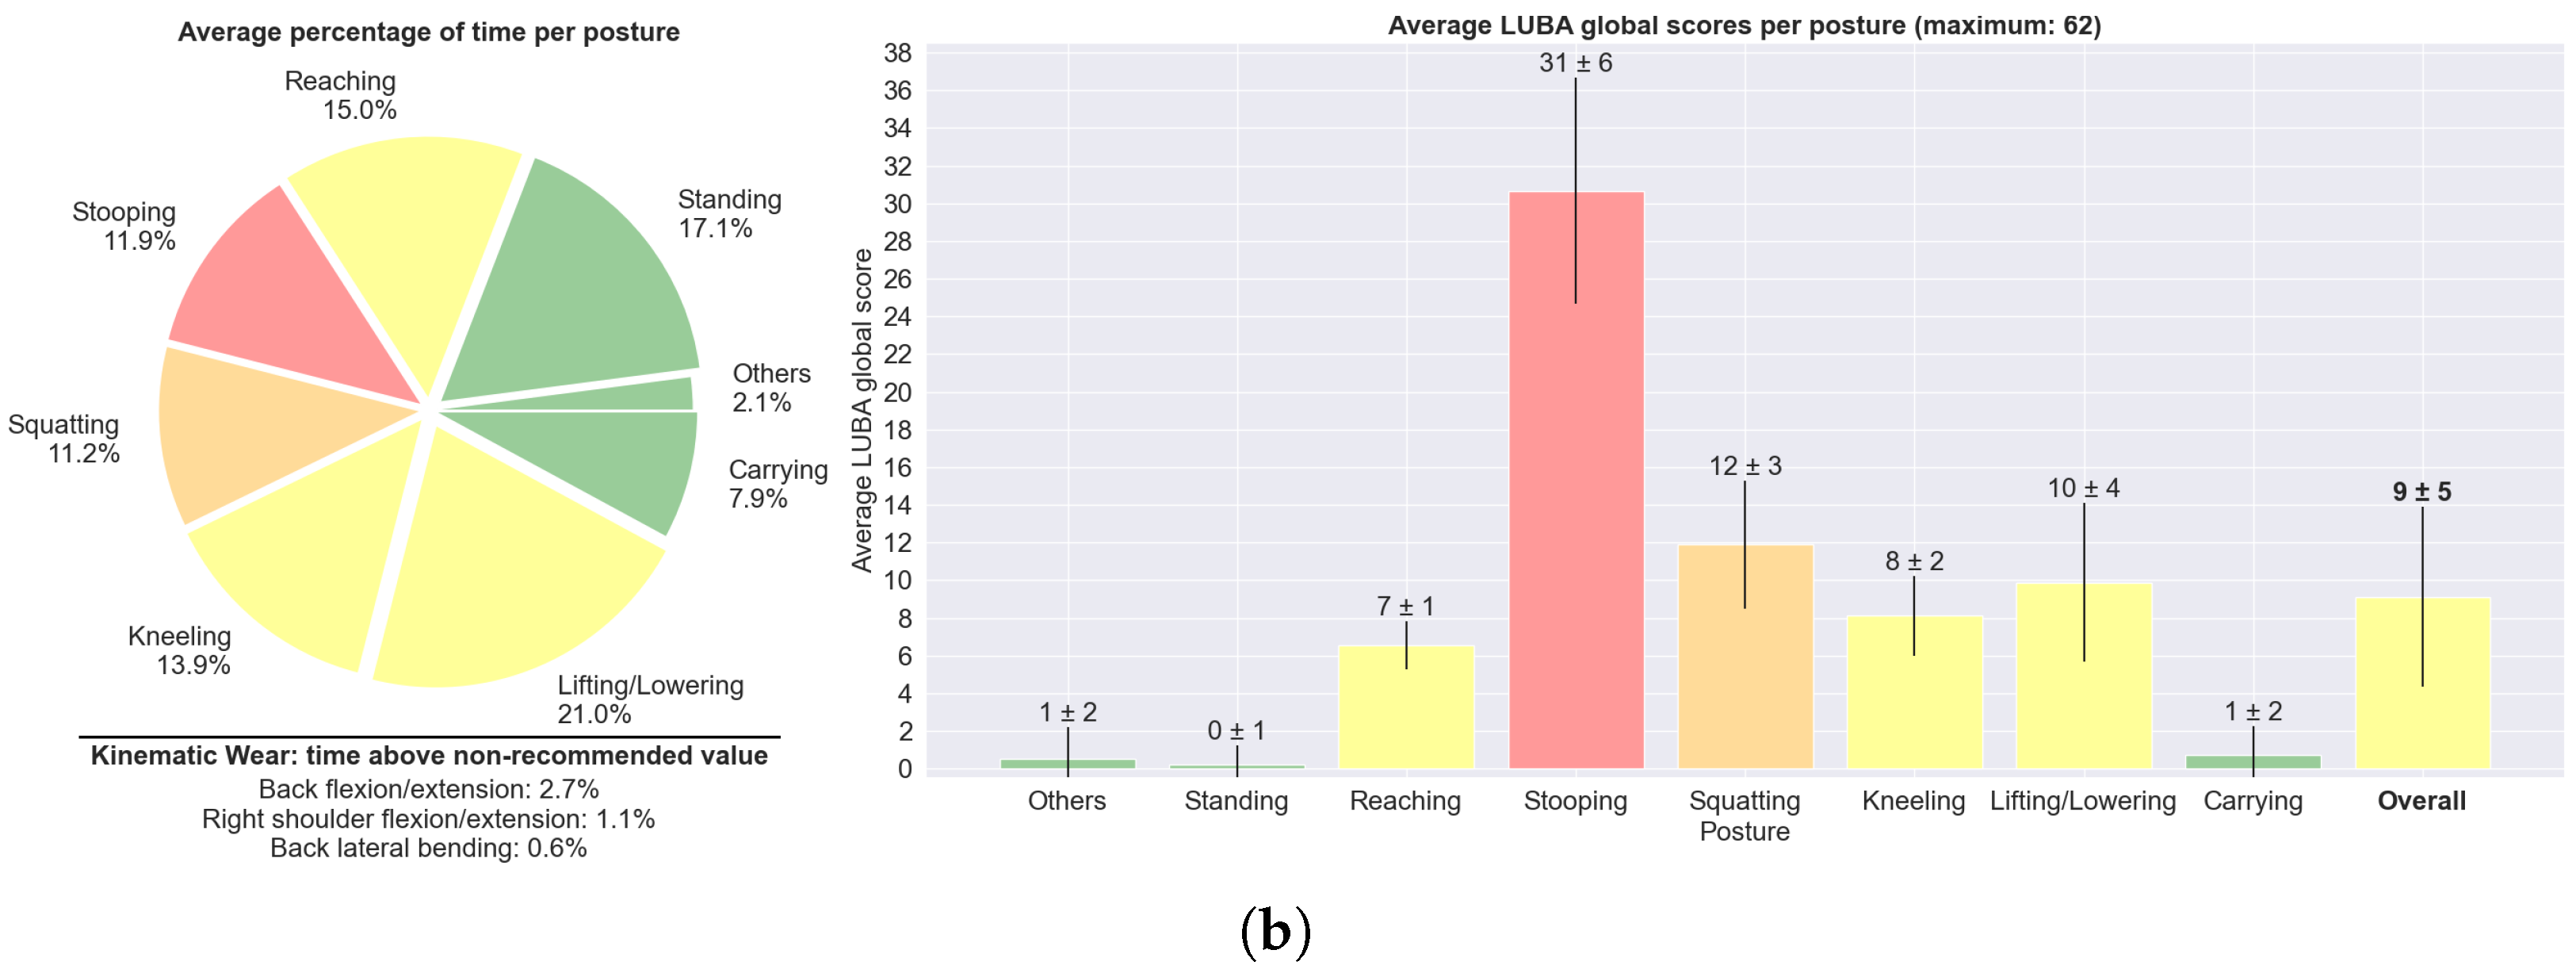
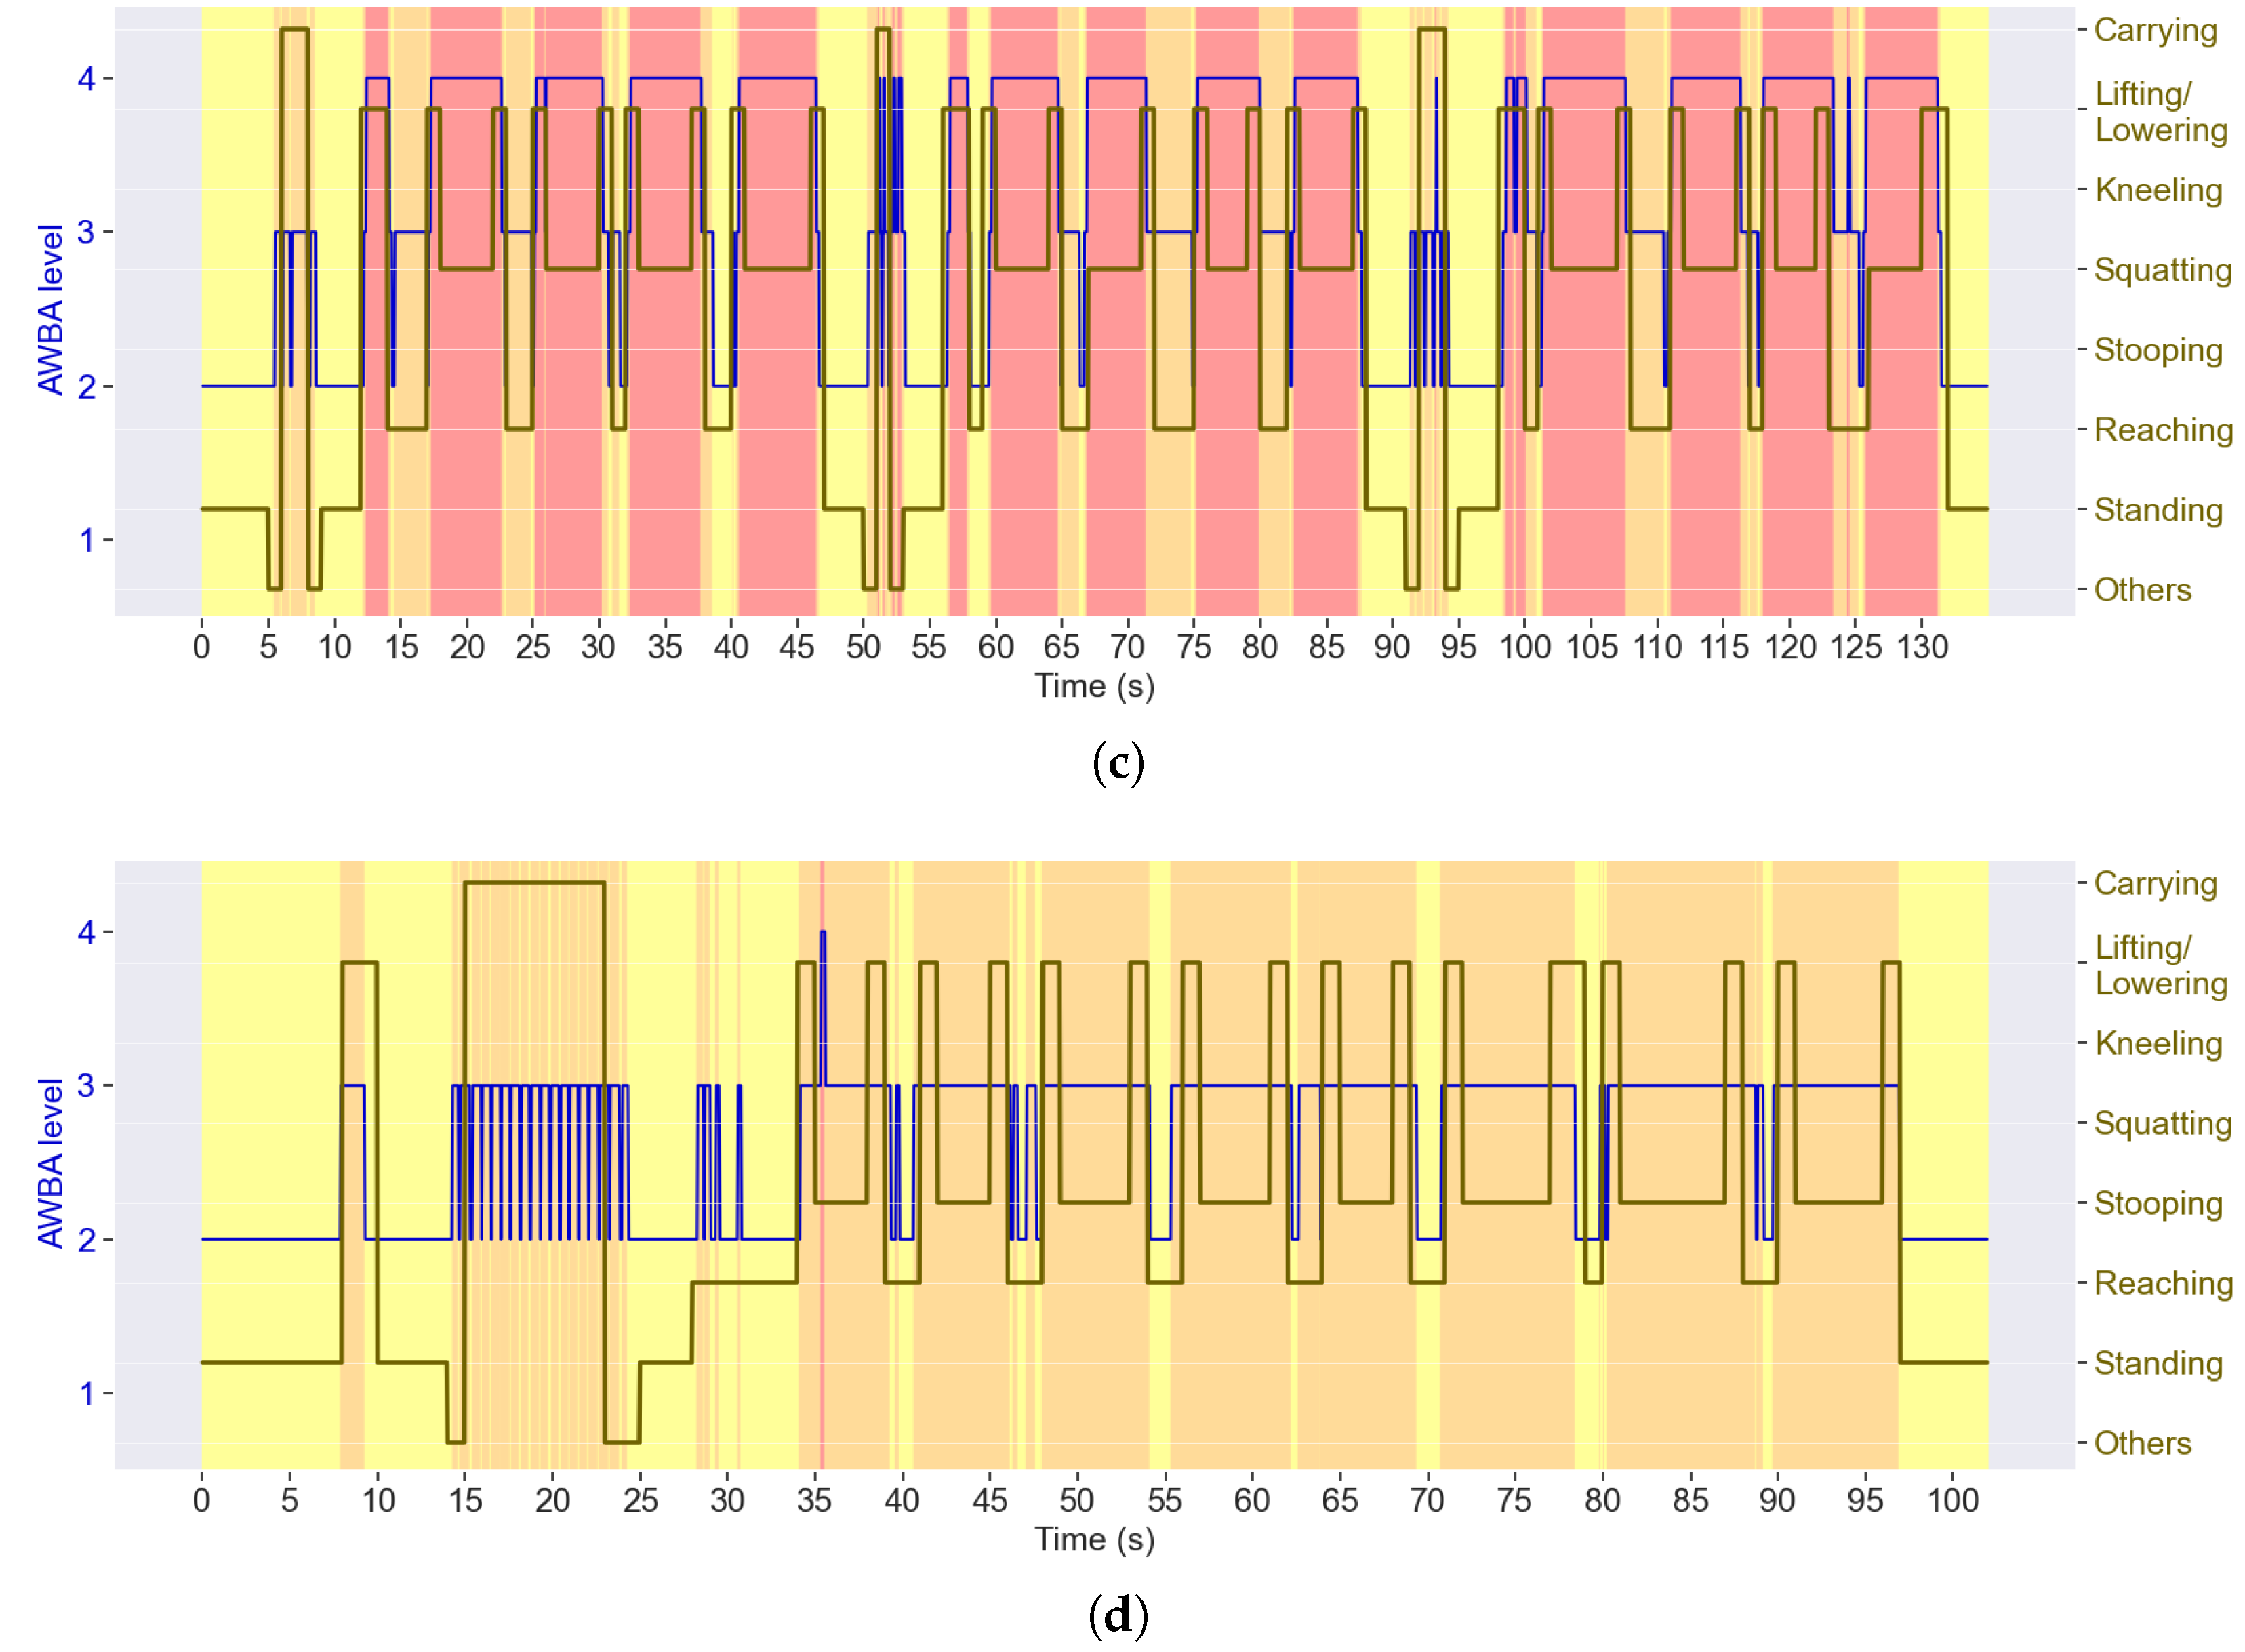
Motivated by the enormous impact of WRMSDs, this manuscript addressed one of their most relevant causes—hazardous postures. Focusing on the two activity sectors with the highest WRMSDs’ prevalence, we developed a valuable tool for providing a more targeted analysis of the underlying causes of high ergonomic risk and demonstrating the applicability of DL-based posture recognition to complement a postural ergonomic assessment. With ergonomists’ validation, within this framework, two ergonomic methods were automated based on inertial data as follows: the agriculture-specific AWBA, to assess the back, shoulders, elbows, and knees in the sagittal plane; and the standard ergonomic method LUBA, to assess the upper-body joints in the sagittal, coronal, and axial planes. In order to take into account previous postures’ impact on joint stress, a kinematic wear index was computed for the various joint motions. With regard to this, two situations were distinguished as follows: when the LUBA score is not the lowest, the joint kinematic wear index increases—and its rate of increase is greater when the risk is greater—representing the accumulation of posture hazards over time; contrariwise, for the minimum global score, the joint recovers and the kinematic wear index decreases. In a GUI, this index was plotted over time to show its evolution, and for each time step, the computed ergonomic score was associated with the posture class (recognised by the DL model), also enabling the assessment of the average risk of each posture and the overall risk of the entire tasks, with graphs. With these data, the user can understand which posture classes are the most hazardous. This GUI was evaluated by ergonomists, who considered it useful in expediting their work and easy to use. Concurrently, they provided relevant feedback towards an effective application of such a tool.
However, this study also has some limitations that need to be addressed in the future. The presented system was validated with volunteers simulating agriculture and construction activities, but an experimental protocol with workers in their real workplaces should be carried out. The kinematic wear index inspired by muscle fatigue behaviour should be validated with EMG, by associating the monitored joints with the corresponding muscles. A user-specific risk assessment is intended to be performed, considering the psychosocial and individual factors which most influence WRMSDs’ development. The drafted biofeedback strategy should be implemented in real time with vibrotactile cues, which could be triggered considering the accumulated joint stress, by using a kinematic wear threshold. Regarding the visual report, ergonomists’ suggestions to improve comprehensibility will be followed. The commercial MoCap system used is intended to be replaced by the team’s low-cost upper-body smart garment, Ergowear [
51], implementing sensor fusion algorithms to estimate the joint angles.
