
Wave-Net: A Marine Raft Aquaculture Area Extraction Framework Based on Feature Aggregation and Feature Dispersion for Synthetic Aperture Radar Images


Abstract
1. Introduction
- (1)
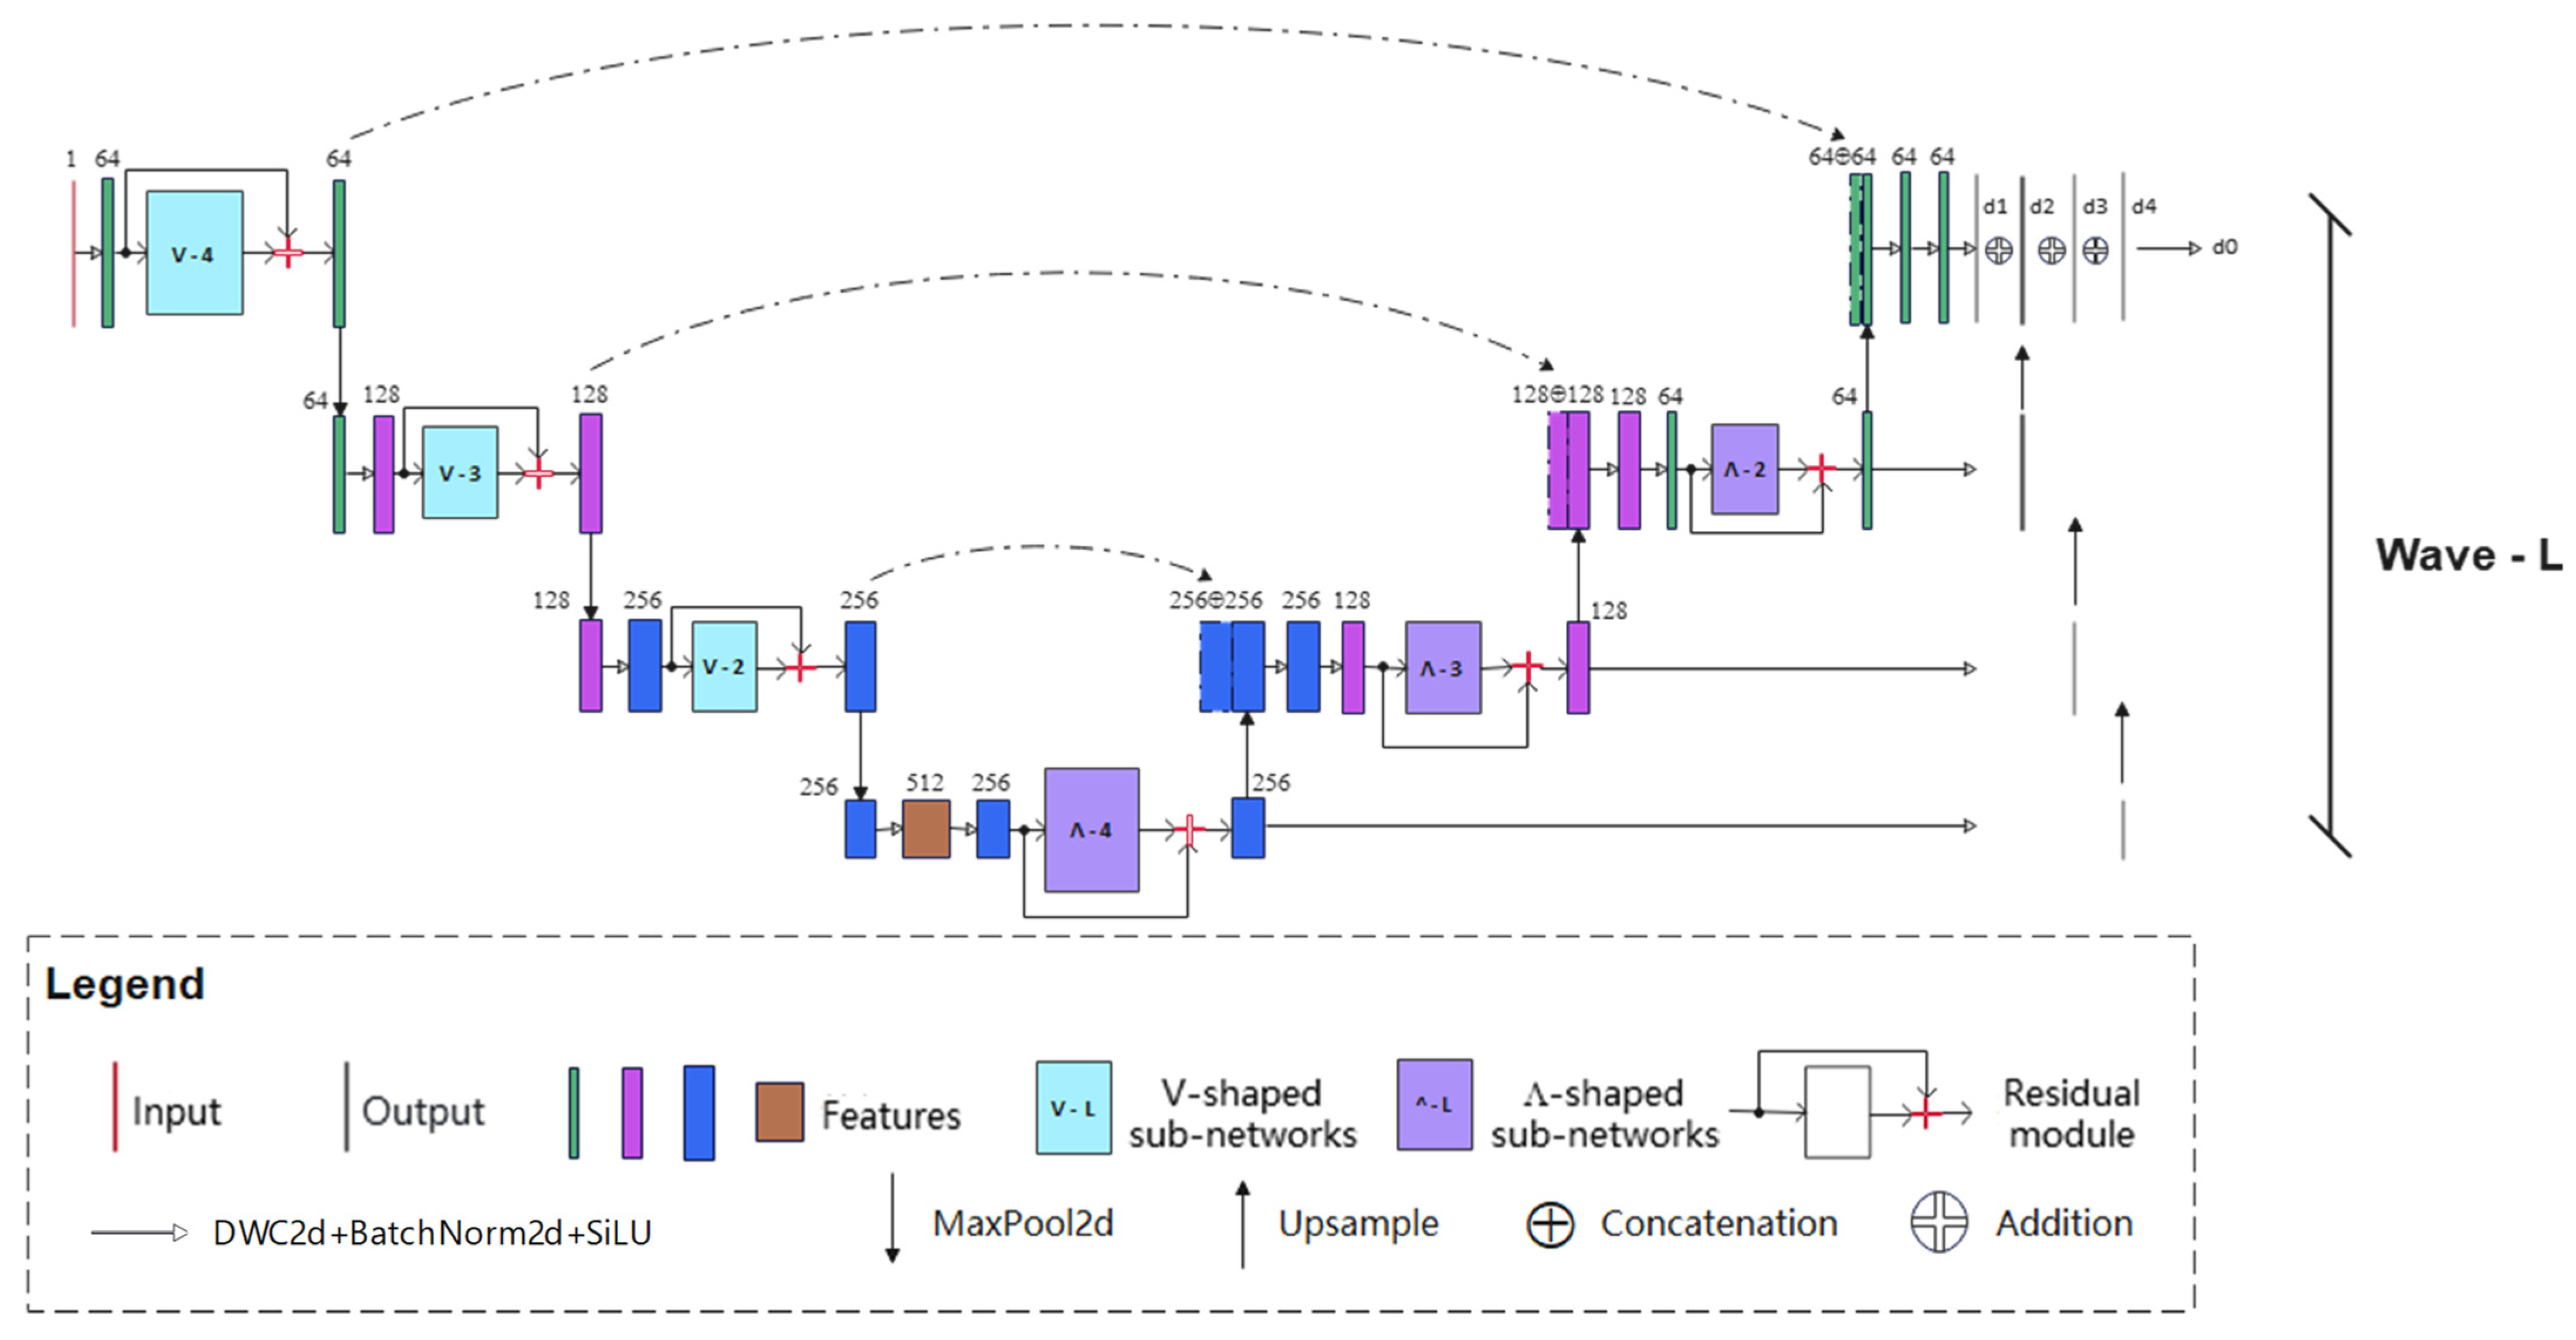
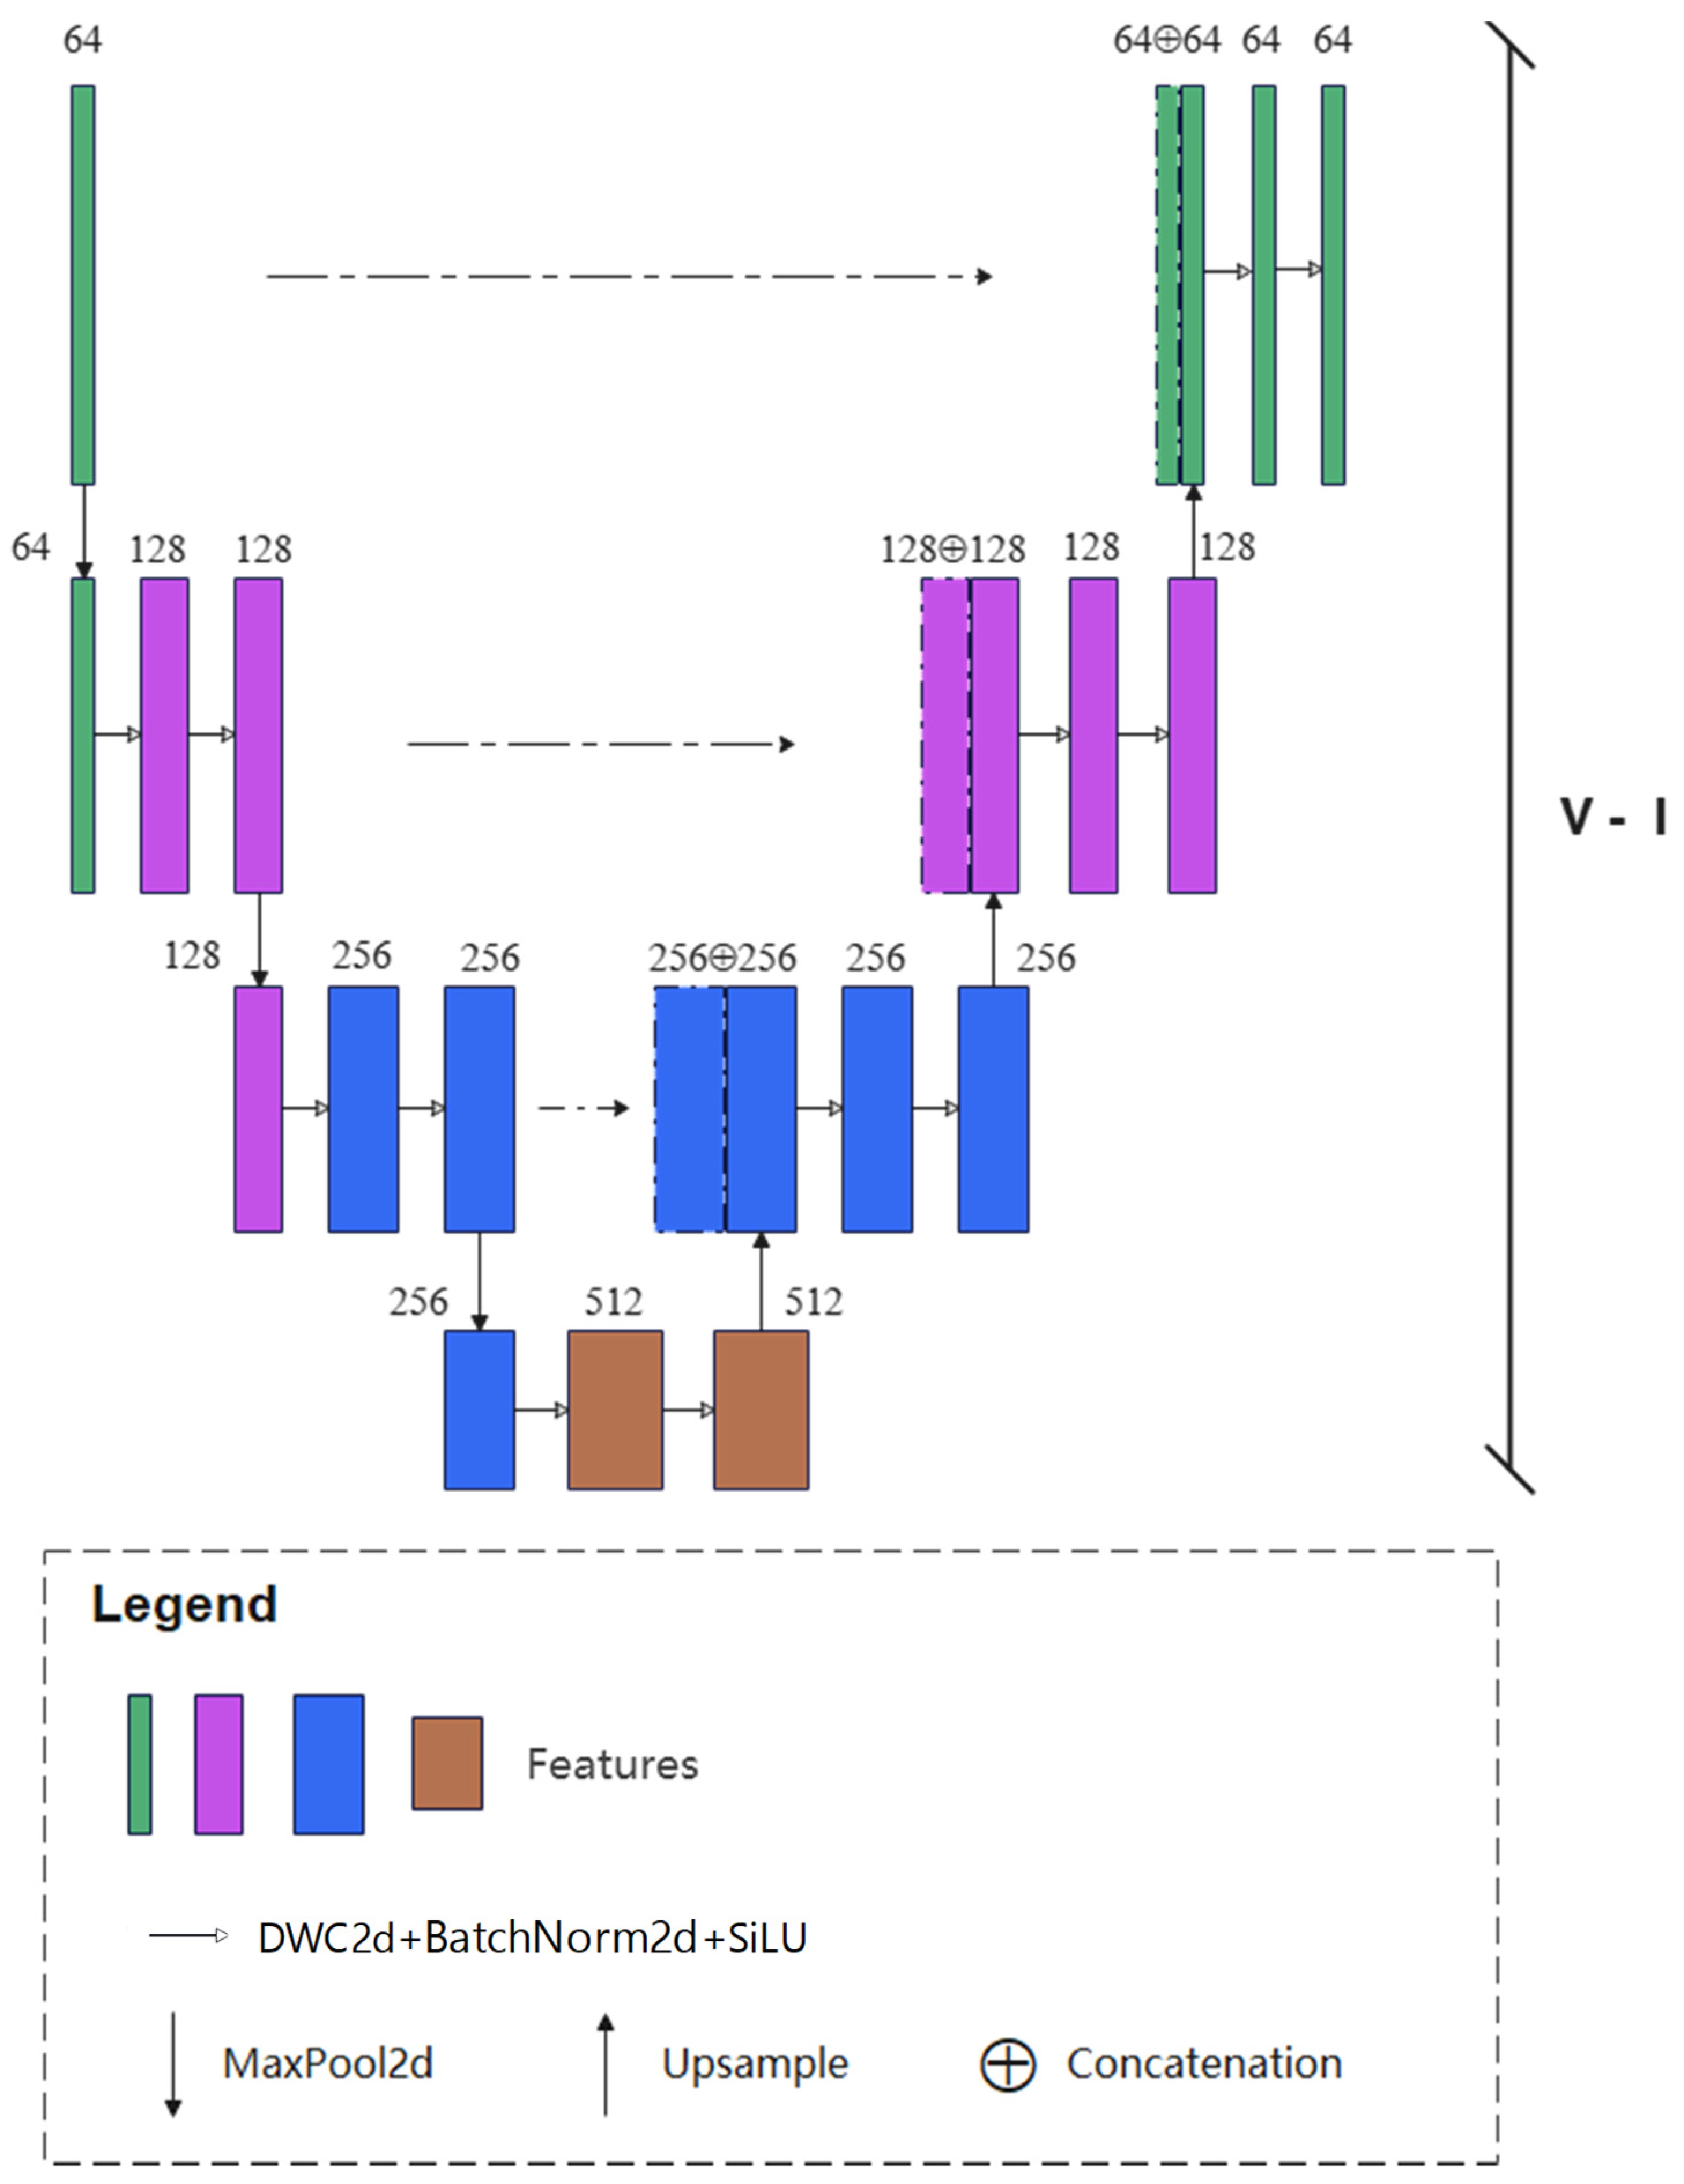
- A feature aggregation part, which contains multiple asymmetric V-shaped subnetworks, was designed to represent the global and local features. It accurately extracts the boundaries of raft aquaculture areas.
- (2)
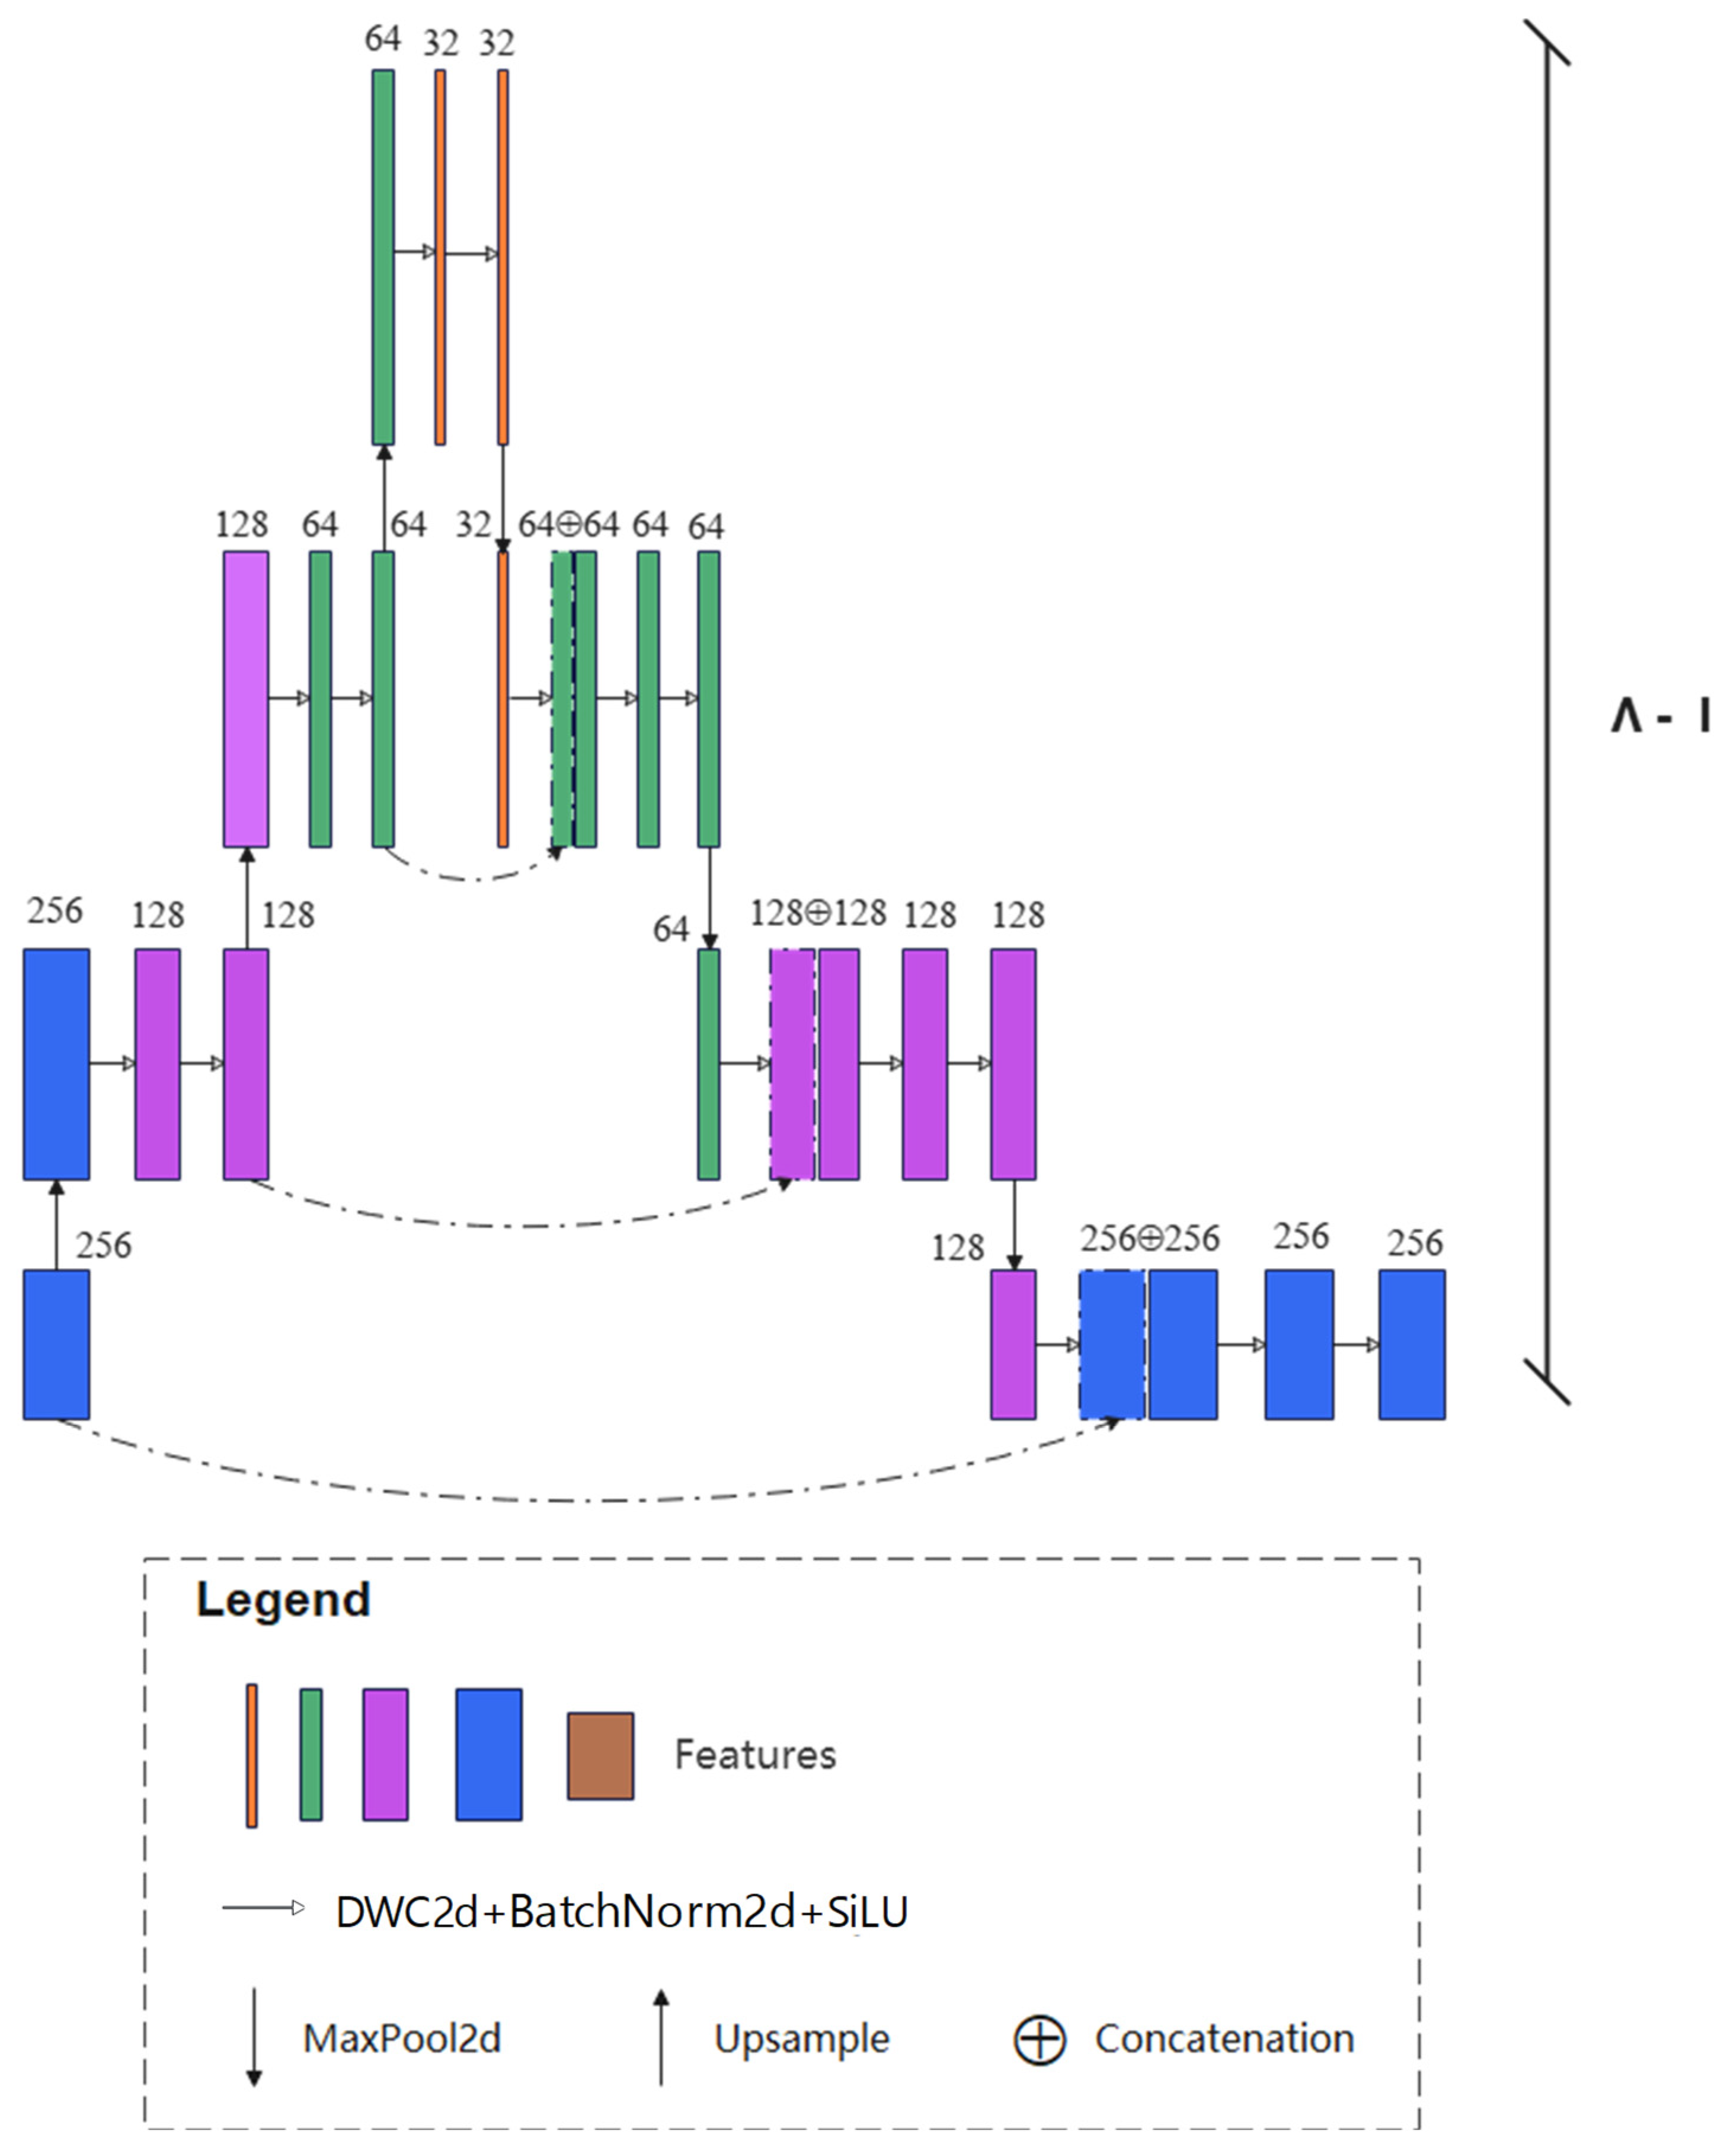
- A feature dispersion part, which contains multiple asymmetric Ʌ-shaped subnetworks, was designed to refine the boundaries of the raft aquaculture areas. The number of Ʌ-shaped subnetworks is the same as the number of V-shaped subnetworks used to construct the encoder-decoder architecture, which makes full use of the multi-scale information of raft aquaculture areas.
2. Data and Methods
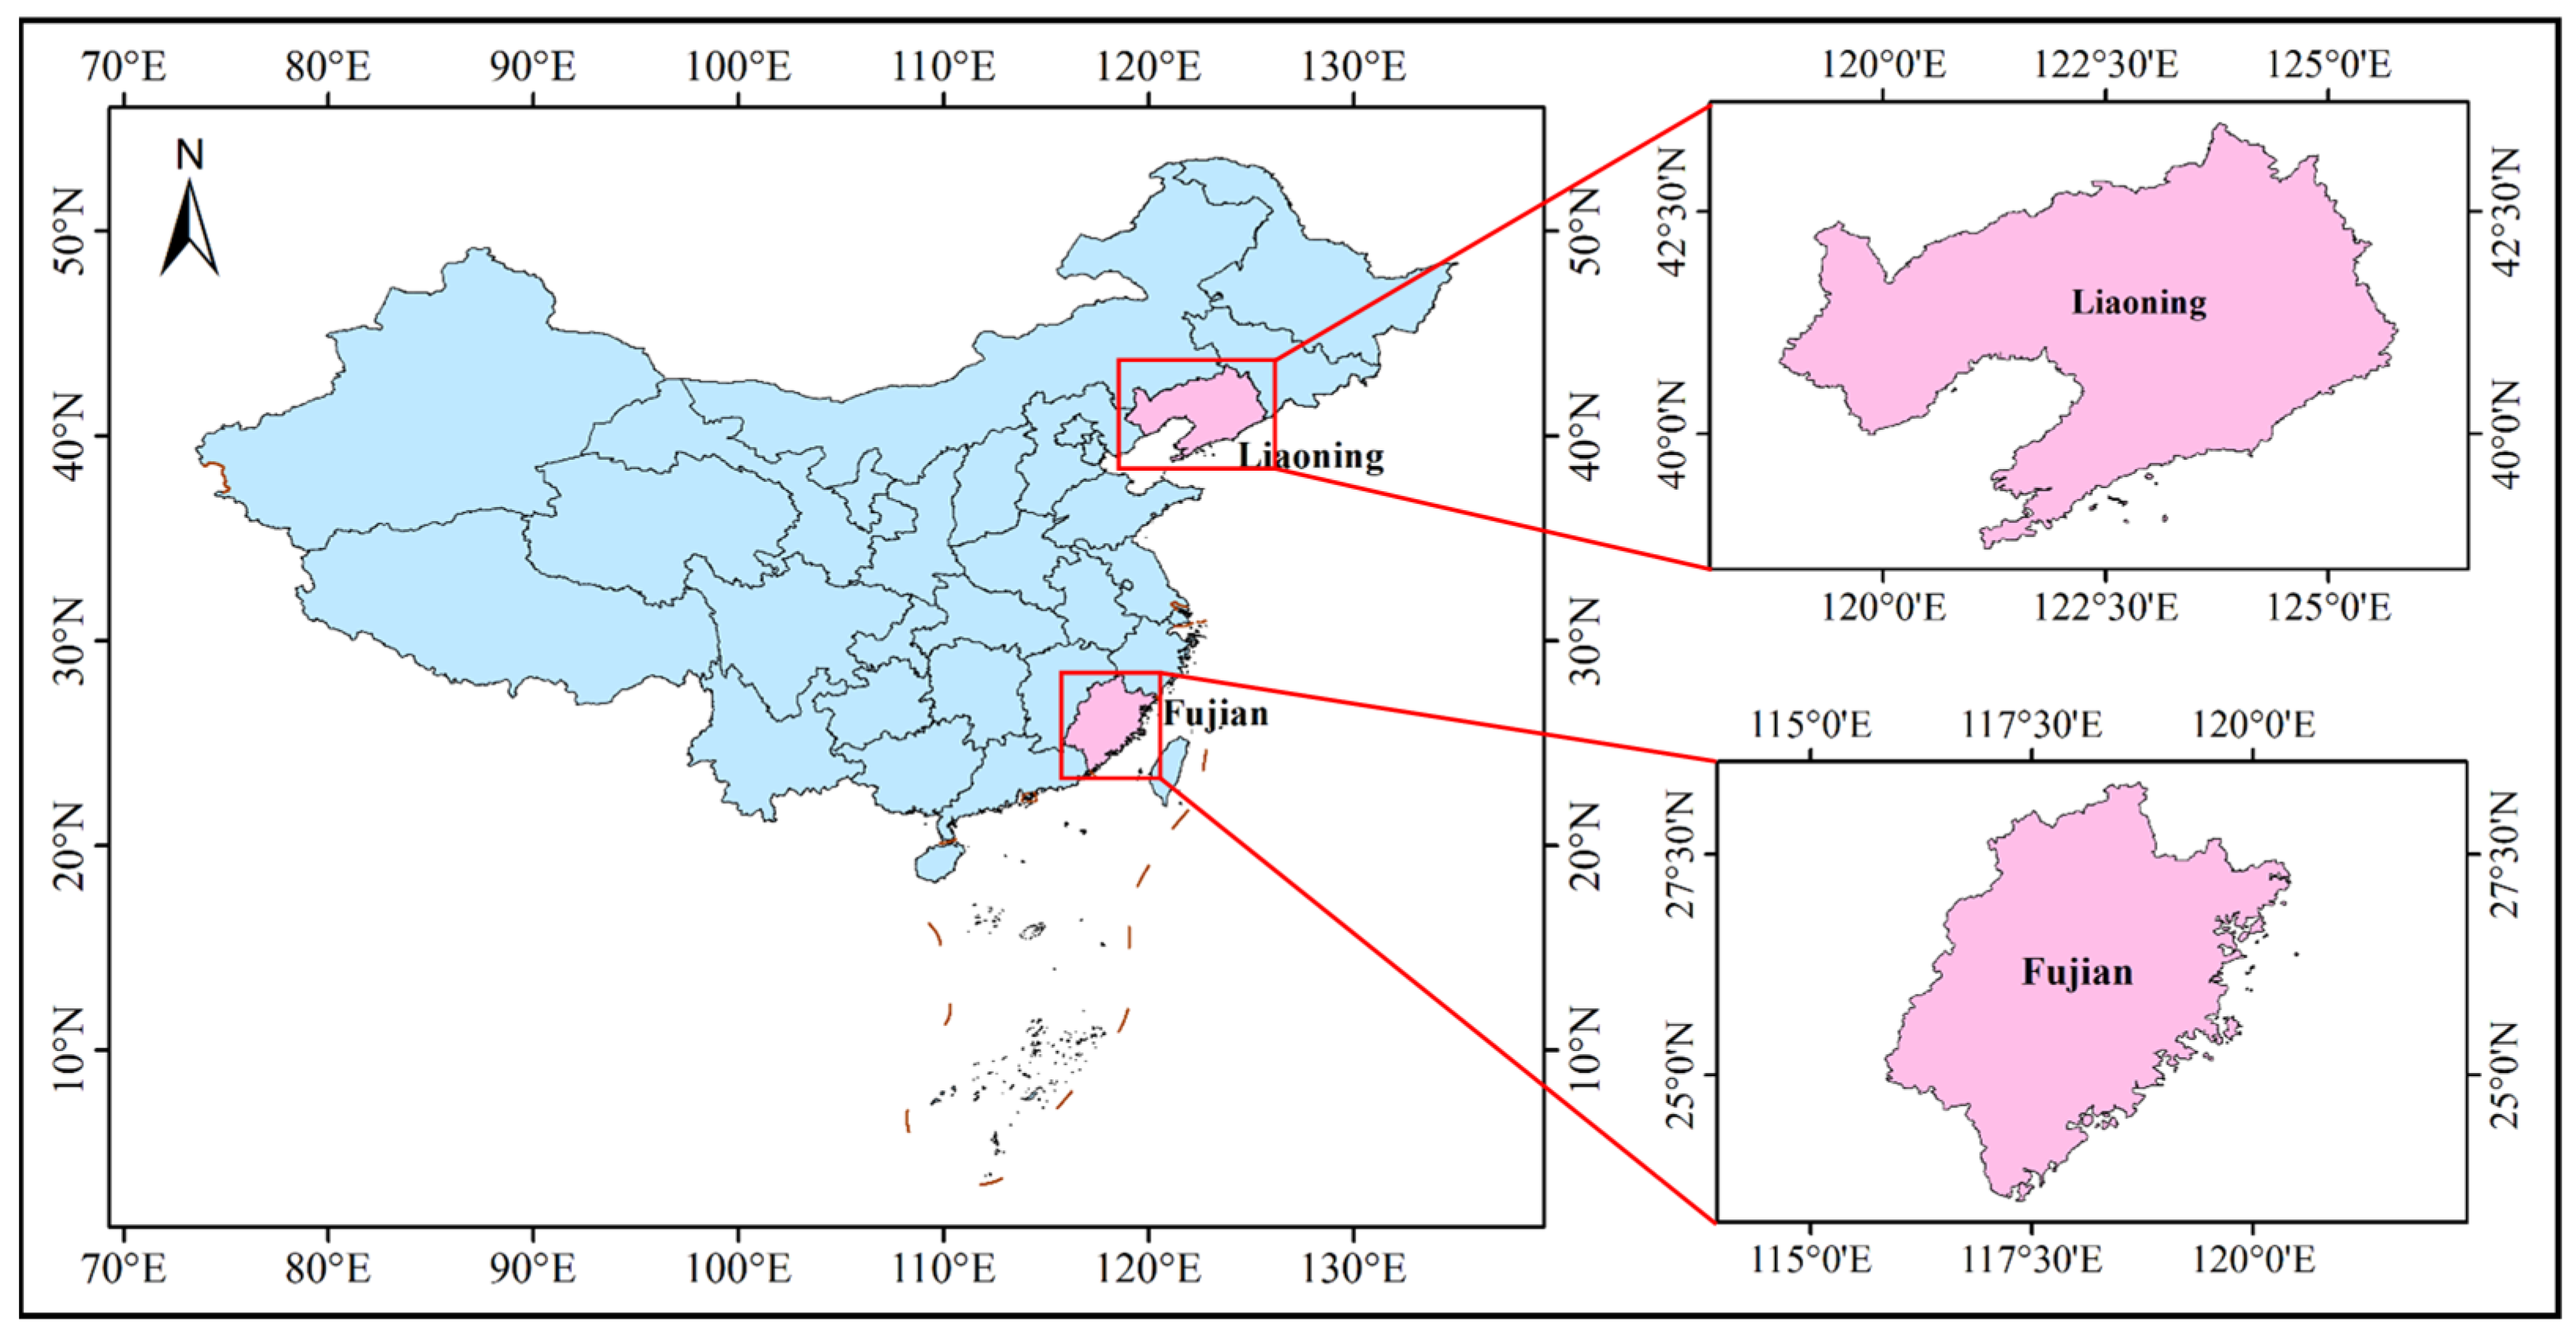
2.1. Research Regions
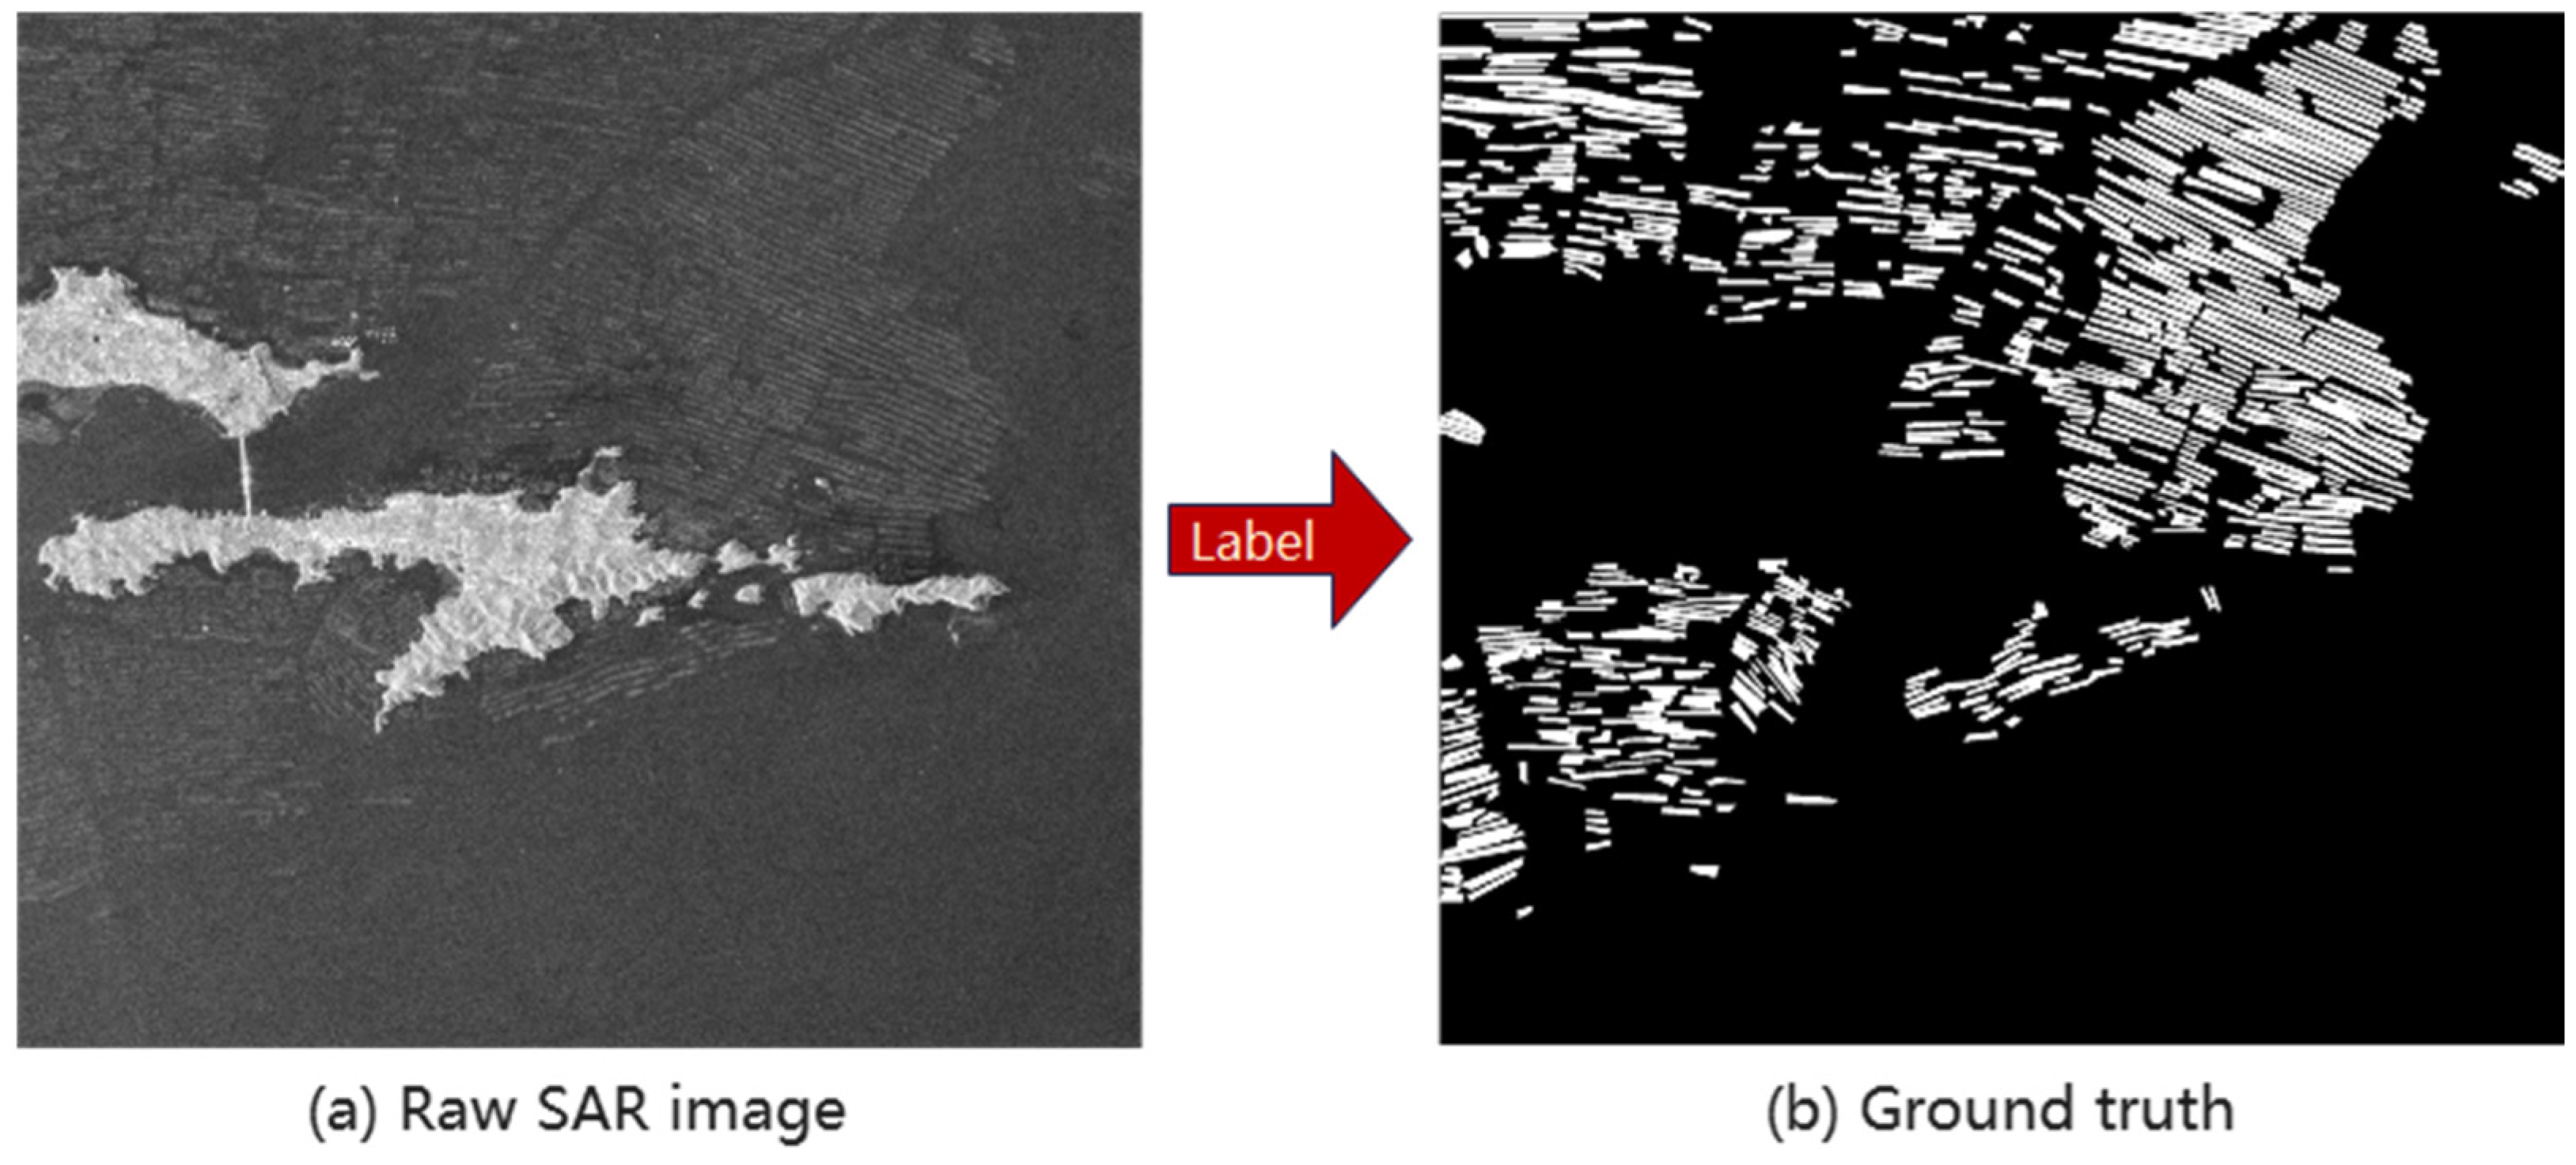
2.2. Data
2.3. Wave-Net Model
2.3.1. Overview of Wave-Net Model
2.3.2. Feature Aggregation Part
2.3.3. Feature Dispersion Part
2.3.4. Multi-Scale Loss Fusion Part
3. Experiments
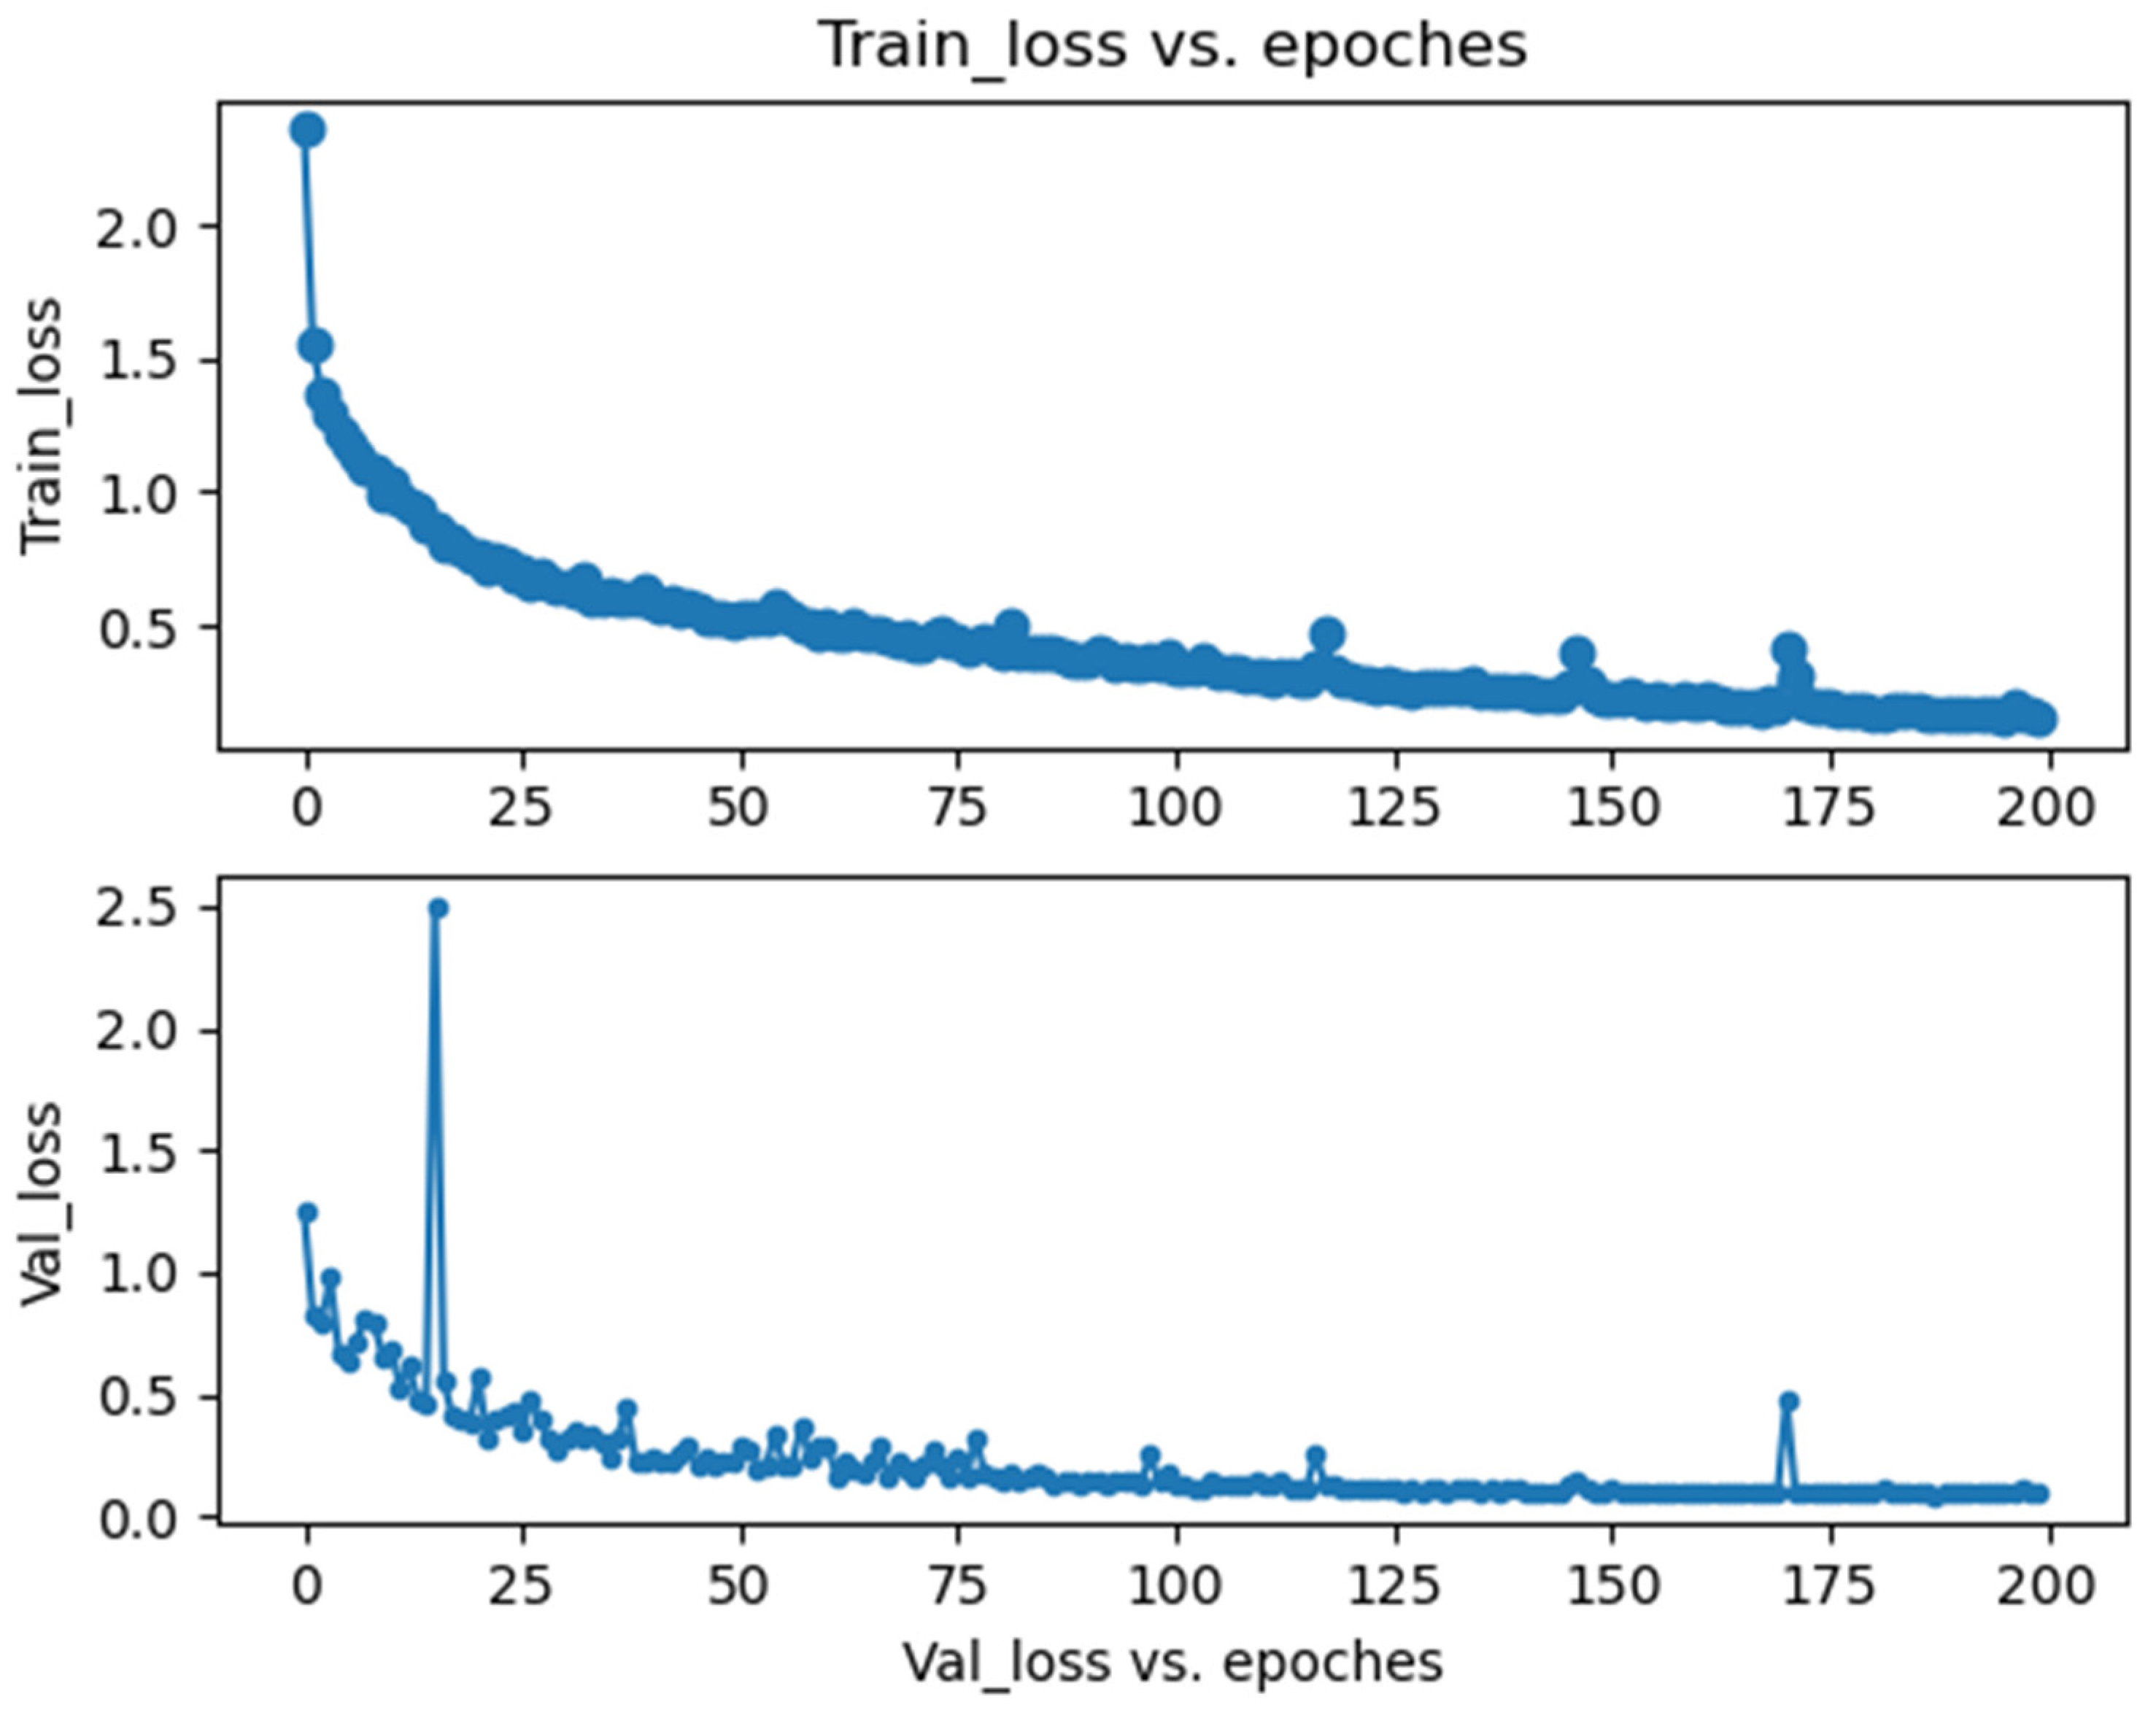
3.1. Implementation
3.2. Quantitative Evaluation
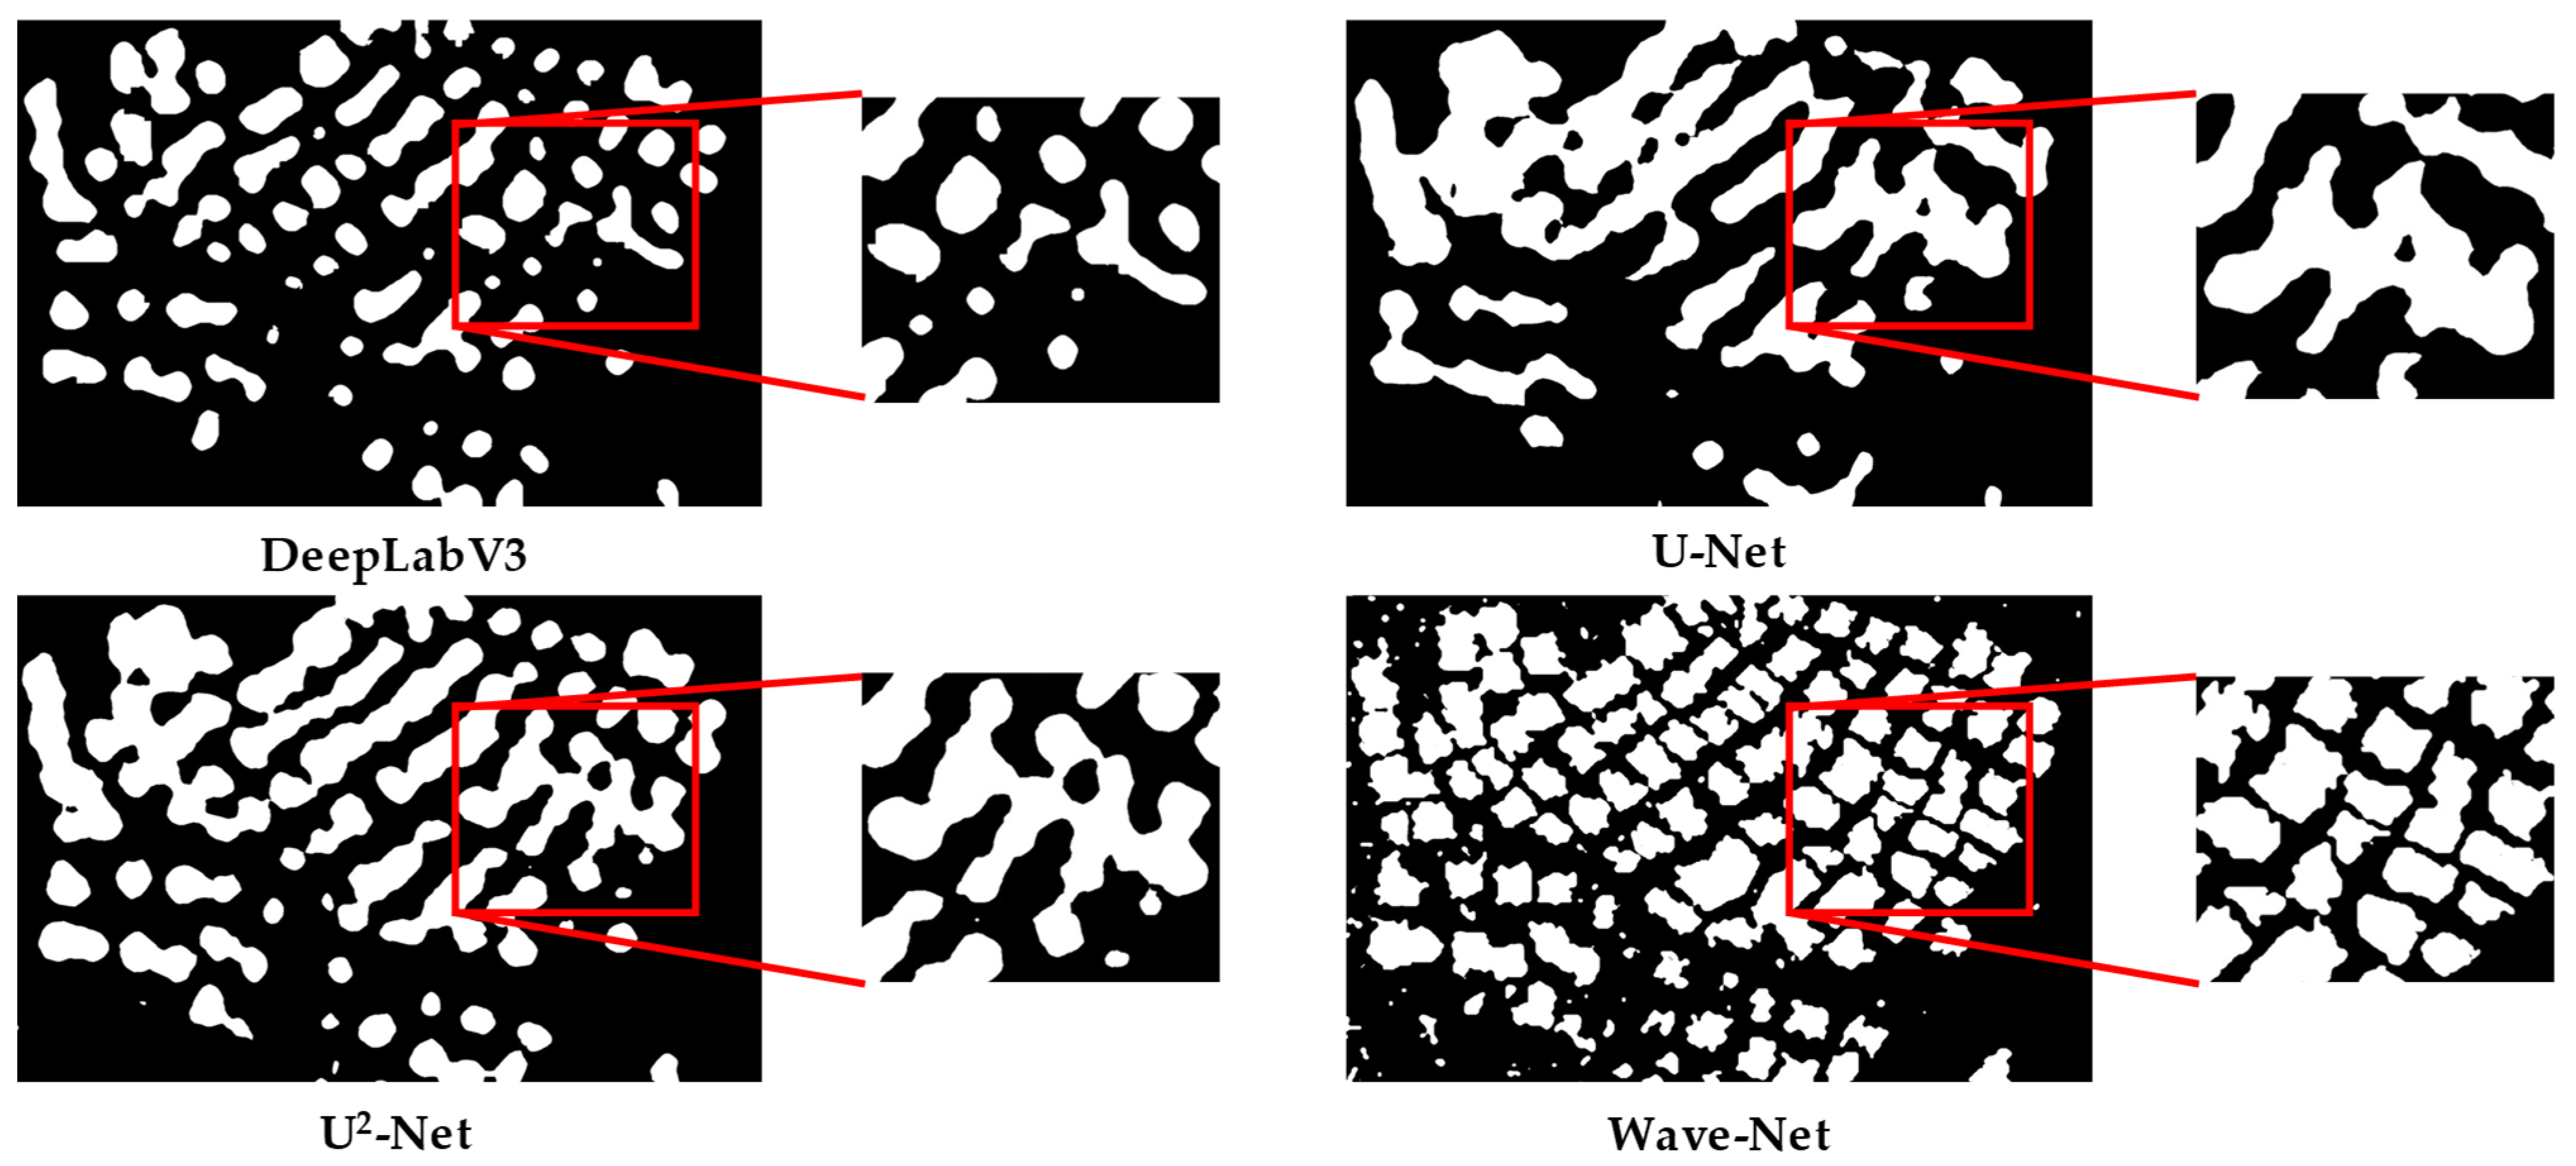
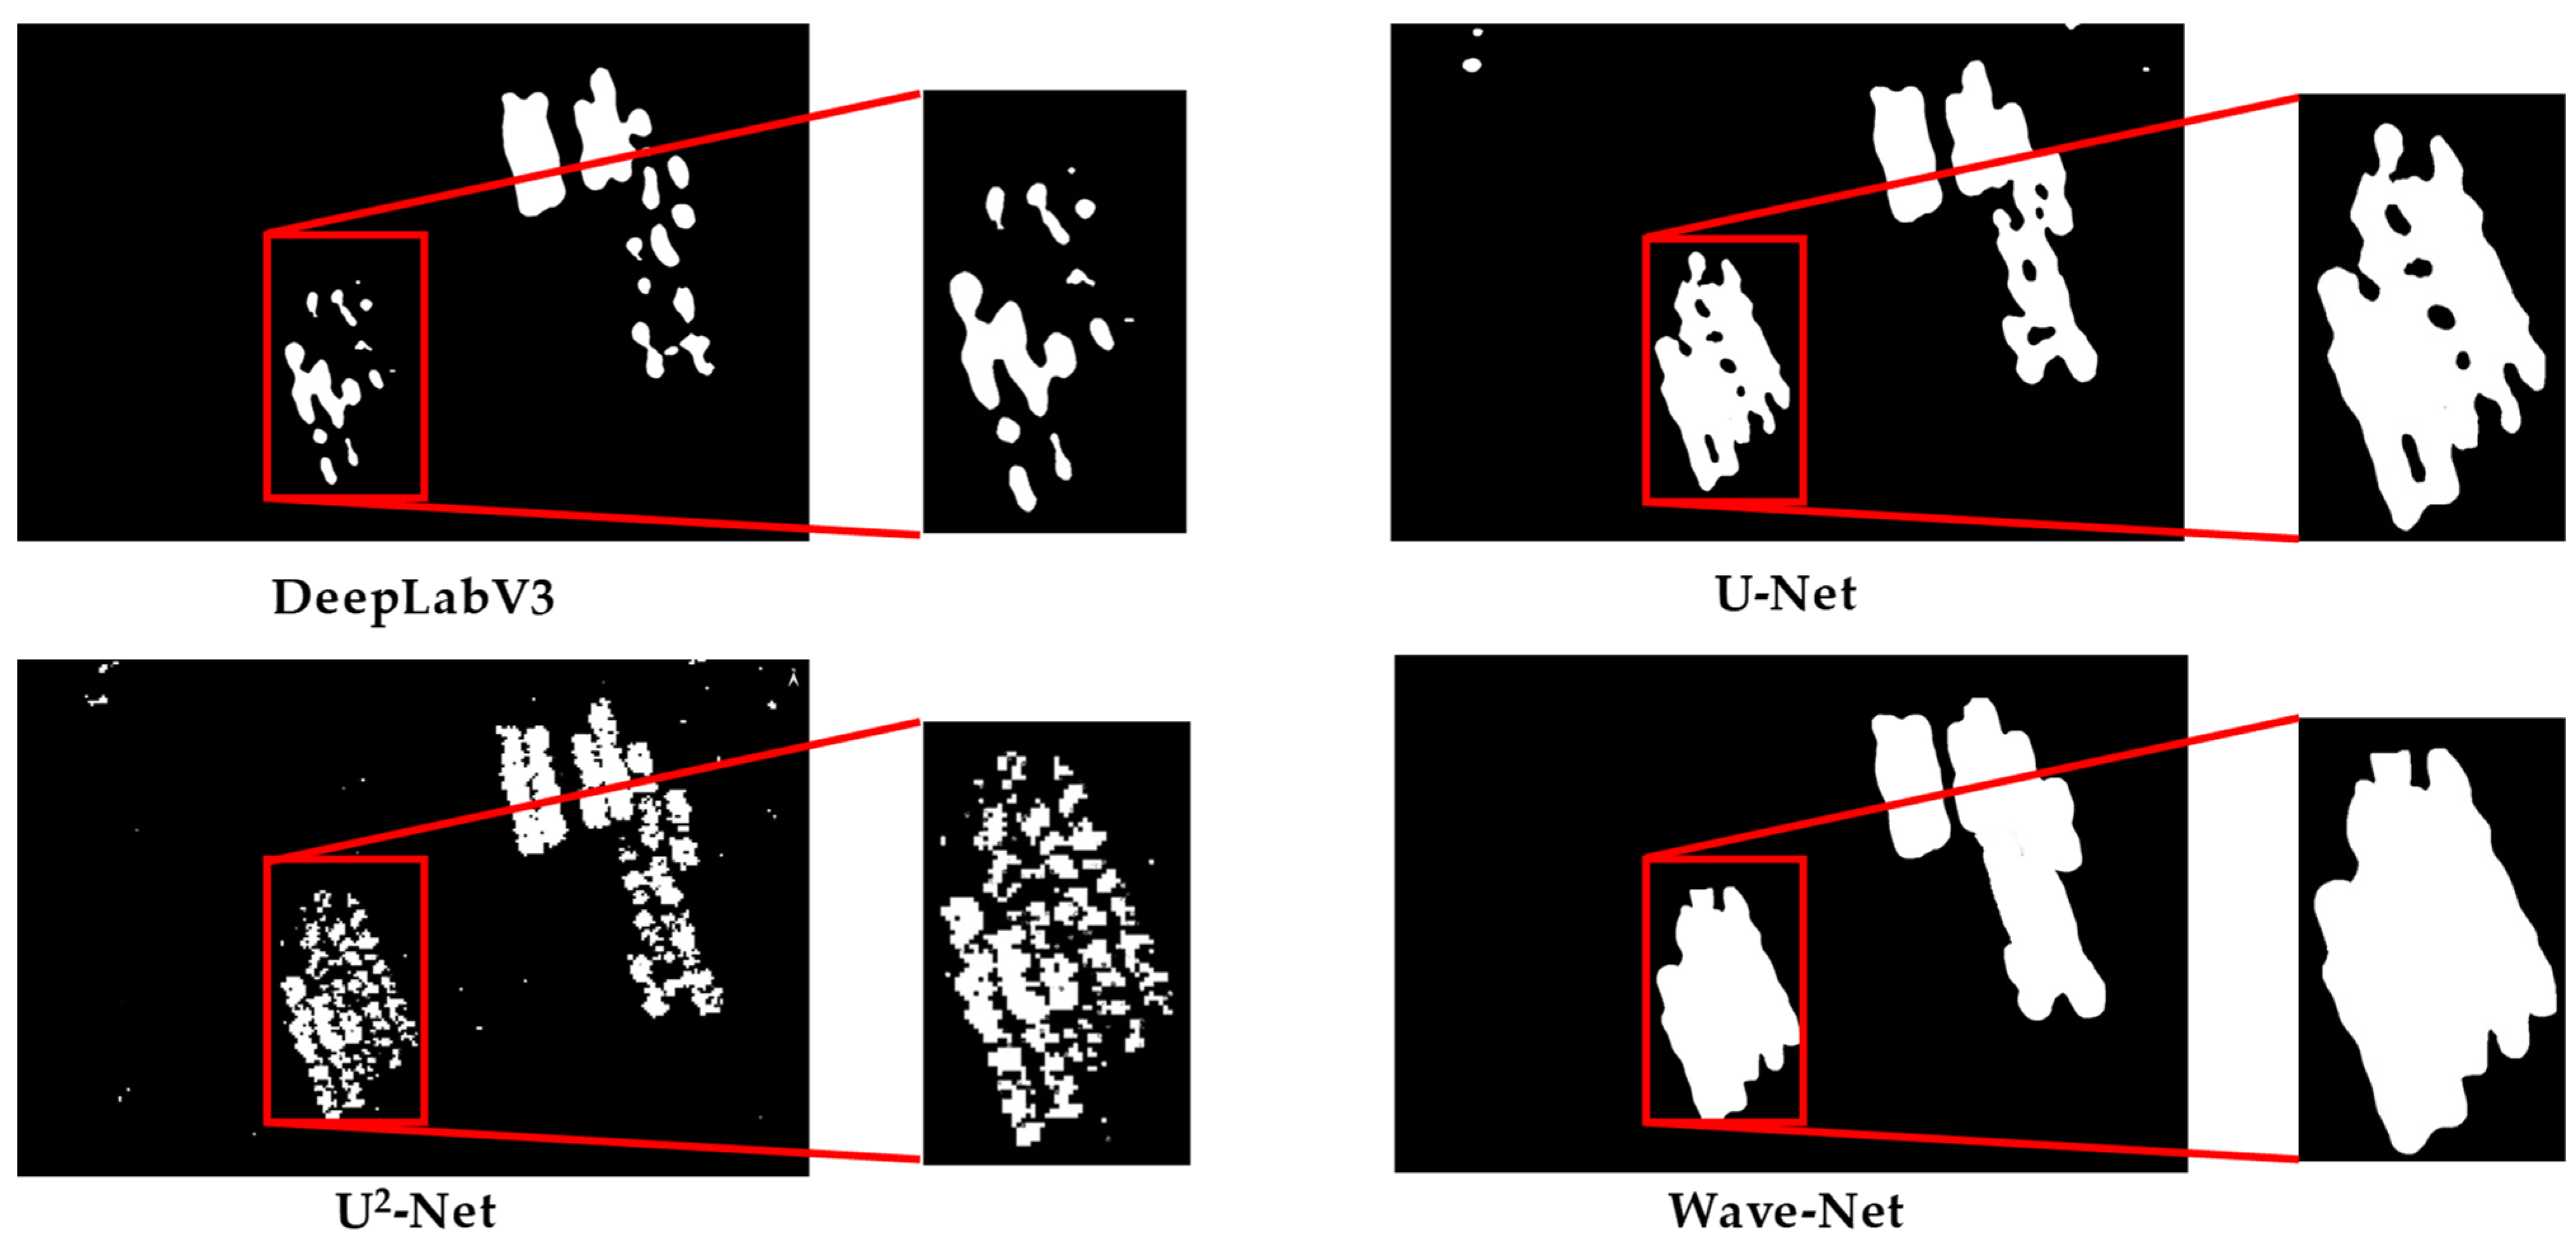
3.3. Qualitative Evaluation
3.4. Ablation Study
4. Discussion
4.1. Feasibility Analysis
4.2. Limitations
- (1)
- Raft aquaculture areas in different regions contain different textures and features. The current training set captured in the Liaoning and Fujian datasets does not contain the marine raft aquaculture areas in Shandong. Therefore, the generalization ability of the Wave-Net model decreased slightly when extracting marine raft aquaculture areas in other regions.
- (2)
- There are severe random speckle noises in SAR images at different times. Meanwhile, the gray-scale values of the same marine raft aquaculture area vary greatly at different times. Hence, some deviations may occur when using neural networks for segmenting raft aquaculture areas. Therefore, it is necessary to develop more effective algorithms to further reduce speckle noises and generate more samples to enhance the robustness of the model.
5. Conclusions
6. Patents
Author Contributions
Funding
Institutional Review Board Statement
Informed Consent Statement
Data Availability Statement
Conflicts of Interest
References
- Pérez-Camacho, A.; Labarta, U.; Vinseiro, V.; Fernández-Reiriz, M.J. Mussel production management: Raft culture without thinning-out. Aquaculture 2013, 406, 172–179. [Google Scholar] [CrossRef]
- Newell, C.R.; Richardson, J. The effects of ambient and aquaculture structure hydrodynamics on the food supply and demand of mussel rafts. J. Shellfish Res. 2014, 33, 257–272. [Google Scholar] [CrossRef]
- Caruso, M.C.; Pascale, C.; Camacho, E.; Ferrara, L. Comparative environmental and social life cycle assessments of off-shore aquaculture rafts made in ultra-high performance concrete (UHPC). Int. J. Life Cycle Ass. 2022, 27, 281–300. [Google Scholar]
- Wang, J.; Quan, S.; Xing, S.; Li, Y.; Wu, H.; Meng, W. PSO-based fine polarimetric decomposition for ship scattering characterization. ISPRS J. Photogramm. 2025, 220, 18–31. [Google Scholar] [CrossRef]
- Kakogeorgiou, I.; Karantzalos, K. Evaluating explainable artificial intelligence methods for multi-label deep learning classification tasks in remote sensing. Int. J. Appl. Earth Obs. 2021, 103, 102520. [Google Scholar]
- Mustapha, M.; Zineddine, M. An evaluative technique for drought impact on variation in agricultural LULC using remote sensing and machine learning. Environ. Monit. Assess. 2024, 196, 515. [Google Scholar] [CrossRef]
- Wang, Y.; Miao, M.; Zhu, S. L-ENet: An ultralightweight SAR image detection network. IEEE J. Sel. Top. Appl. Earth Obs. Remote Sens. 2024, 17, 8967–8978. [Google Scholar]
- Gallo, I.; Rehman, A.U.; Dehkordi, R.H.; Landro, N.; La Grassa, R.; Boschetti, M. Deep object detection of crop weeds: Performance of YOLOv7 on a real case dataset from UAV images. Remote Sens. 2023, 15, 539. [Google Scholar] [CrossRef]
- Chang, L.; Chen, Y.-T.; Chang, Y.L. A modified U-Net for oil spill semantic segmentation in SAR images. In Proceedings of the IGARSS 2024—2024 IEEE International Geoscience and Remote Sensing Symposium, Athens, Greece, 7–12 July 2024; pp. 2945–2948. [Google Scholar]
- Kotaridis, I.; Lazaridou, M. Remote sensing image segmentation advances: A meta-analysis. ISPRS J. Photogramm. 2021, 173, 309–322. [Google Scholar]
- Lenczner, G.; Chan-Hon-Tong, A.; Le Saux, B.; Luminari, N.; Le Besnerais, G. DIAL: Deep interactive and active learning for semantic segmentation in remote sensing. IEEE J. Sel. Top. Appl. Earth Obs. Remote Sens. 2022, 15, 3376–3389. [Google Scholar] [CrossRef]
- Liu, Y.; Yang, X.; Wang, X.; Lu, C.; Li, Z.; Yang, F. Aquaculture area extraction and vulnerability assessment in Sanduao based on richer convolutional features network model. J. Oceanol. Limnol. 2019, 37, 1941–1954. [Google Scholar] [CrossRef]
- Su, H.; Wei, S.; Qiu, J.; Wu, W. RaftNet: A new deep neural network for coastal raft aquaculture extraction from Landsat 8 OLI data. Remote Sens. 2022, 14, 4587. [Google Scholar] [CrossRef]
- Wang, Y.; Zhang, Y.; Chen, Y.; Wang, J.; Bai, H.; Wu, B.; Li, W.; Li, S.; Zheng, T. The assessment of more suitable image spatial resolutions for offshore aquaculture areas automatic monitoring based on coupled NDWI and mask R-CNN. Remote Sens. 2022, 14, 3079. [Google Scholar] [CrossRef]
- Cui, B.; Zhong, Y.; Fei, D.; Zhang, Y.; Liu, R.; Chu, J.; Zhao, J. Floating raft aquaculture area automatic extraction based on fully convolutional network. J. Coast. Res. 2019, 90, 86–94. [Google Scholar]
- Gao, L.; Wang, C.; Liu, K.; Chen, S.; Dong, G.; Su, H. Extraction of floating raft aquaculture areas from Sentinel-1 SAR images by a dense residual U-Net model with pre-trained Resnet34 as the encoder. Remote Sens. 2022, 14, 3003. [Google Scholar] [CrossRef]
- Liu, J.; Lu, Y.; Guo, X.; Ke, W. A deep learning method for offshore raft aquaculture extraction based on medium resolution remote sensing images. IEEE J. Sel. Top. Appl. Earth Obs. Remote Sens. 2023, 16, 6296–6309. [Google Scholar]
- Chen, Y.; He, G.; Yin, R.; Zheng, K.; Wang, G. Comparative study of marine ranching recognition in multi-temporal high-resolution remote sensing images based on DeepLab-v3+ and U-Net. Remote Sens. 2022, 14, 5654. [Google Scholar] [CrossRef]
- Geng, X.; Li, X.; Jia, T. Automatic extraction of marine aquaculture areas based on the semantic segmentation network from GF-3 SAR data. In Proceedings of the IGARSS 2022—2022 IEEE International Geoscience and Remote Sensing Symposium, Kuala Lumpur, Malaysia, 17–22 July 2022; pp. 5164–5167. [Google Scholar]
- Yu, H.; Hou, Y.; Wang, F.; Wang, J.; Zhu, J.; Guo, J. MSSFNet: A multiscale spatial–spectral fusion network for extracting offshore floating raft aquaculture areas in multispectral remote sensing images. Sensors 2024, 24, 5220. [Google Scholar] [CrossRef]
- Yu, H.; Wang, F.; Hou, Y.; Wang, J.; Zhu, J.; Guo, J. MSARG-Net: A multimodal offshore floating raft aquaculture area extraction network for remote sensing images based on multiscale SAR guidance. IEEE J. Sel. Top. Appl. Earth Obs. Remote Sens. 2024, 17, 18319–18334. [Google Scholar]
- Zou, Z.; Chen, C.; Liu, Z.; Zhang, Z.; Liang, J.; Chen, H.; Wang, L. Extraction of aquaculture ponds along coastal region using U2-Net deep learning model from remote sensing images. Remote Sens. 2022, 14, 4001. [Google Scholar] [CrossRef]
- Deng, J.; Bai, Y.; Chen, Z.; Shen, T.; Li, C.; Yang, X. A convolutional neural network for coastal aquaculture extraction from high-resolution remote sensing imagery. Sustainability 2023, 15, 5332. [Google Scholar] [CrossRef]
- Zhang, Y.; Wang, C.; Wang, Z. Raft aquaculture areas extraction based on TransUNet with channel attention. In Proceedings of the 17th Chinese Stereology and Image Analysis Academic Conference, Online, 11 November 2022; pp. 10–11. [Google Scholar]
- Hu, J.; Shen, L.; Sun, G. Squeeze-and-excitation networks. In Proceedings of the IEEE Conference on Computer Vision and Pattern Recognition (CVPR), Salt Lake City, UT, USA, 18–23 June 2018; pp. 7132–7141. [Google Scholar]
- Cui, Y.; Zhang, X.; Jiang, N.; Dong, T.; Xie, T. Remote sensing identification of marine floating raft aquaculture area based on sentinel-2A and DEM data. Front. Mar. Sci. 2022, 9, 955858. [Google Scholar] [CrossRef]
- Li, L.; Cai, Y.; Xu, H.; Liu, Z.; Wang, S.; Gao, H. Extraction of the raft aquaculture area based on convolutional neural networks and data fusion. Haiyang Xuebao 2023, 45, 155–165. [Google Scholar]
- Ronneberger, O.; Philipp, F.; Thomas, B. U-Net: Convolutional networks for biomedical image segmentation. In Proceeding of the Medical Image Computing and Computer-Assisted Intervention—MICCAI 2015: 18th International Conference, Munich, Germany, 5–9 October 2015; pp. 234–241. [Google Scholar]
- Chen, L.; Zhu, Y.; Papandreou, G.; Schroff, F.; Adam, H. Encoder-decoder with atrous separable convolution for semantic image segmentation. In Proceedings of the European Conference on Computer Vision (ECCV), Munich, Germany, 8–14 September 2018; pp. 801–818. [Google Scholar]
- Qin, X.; Zhang, Z.; Huang, C.; Dehghan, M.; Osmar, R.; Jagersand, M. U2-Net: Going deeper with nested U-structure for salient object detection. Pattern Recognit. 2020, 106, 107404. [Google Scholar]


| Sample size (pixel × pixel) | [300 × 300, 400 × 400] | [400 × 400, 500 × 500] | [500 × 500, 600 × 600] |
| Network architecture | L = 3 | L = 4 | L = 5 |
| Models | Precision (%) | Recall (%) | F1 (%) | IoU (%) |
|---|---|---|---|---|
| DeepLabV3 [15] | 78.95 ± 1.96 | 72.96 ± 2.23 | 80.91 ± 2.05 | 67.98 ± 2.84 |
| U-Net [16] | 80.75 ± 1.17 | 71.20 ± 1.48 | 80.97 ± 1.28 | 68.04 ± 1.82 |
| U2-Net [17] | 87.19 ± 1.89 | 71.89 ± 2.07 | 82.86 ± 2.16 | 68.75 ± 1.83 |
| Wave-Net | 89.54 ± 1.47 | 70.81 ± 2.67 | 83.46 ± 1.68 | 69.85 ± 1.52 |
| Models | Precision (%) | Recall (%) | F1 (%) | IoU (%) |
|---|---|---|---|---|
| DeepLabV3 [15] | 80.32 ± 1.67 | 71.23 ± 2.11 | 81.15 ± 1.81 | 65.61 ± 1.75 |
| U-Net [16] | 82.21 ± 2.11 | 72.33 ± 1.65 | 82.33 ± 1.95 | 67.81 ± 1.91 |
| U2-Net [17] | 86.33 ± 1.65 | 75.55 ± 2.12 | 85.23 ± 1.33 | 71.51 ± 1.38 |
| Wave-Net | 89.10 ± 1.32 | 81.21 ± 1.46 | 90.12 ± 1.35 | 75.51 ± 1.55 |
| Residual | Precision (%) | Recall (%) | F1 (%) | IoU (%) | Final Loss (Train/val) |
|---|---|---|---|---|---|
| No | 85.04 | 68.85 | 76.55 | 65.62 | 0.1389/0.1246 |
| Yes | 87.56 | 70.44 | 80.09 | 67.12 | 0.1233/0.1137 |
Disclaimer/Publisher’s Note: The statements, opinions and data contained in all publications are solely those of the individual author(s) and contributor(s) and not of MDPI and/or the editor(s). MDPI and/or the editor(s) disclaim responsibility for any injury to people or property resulting from any ideas, methods, instructions or products referred to in the content. |
© 2025 by the authors. Licensee MDPI, Basel, Switzerland. This article is an open access article distributed under the terms and conditions of the Creative Commons Attribution (CC BY) license (https://creativecommons.org/licenses/by/4.0/).
Share and Cite
Wang, C.; Wang, L.; Li, N. Wave-Net: A Marine Raft Aquaculture Area Extraction Framework Based on Feature Aggregation and Feature Dispersion for Synthetic Aperture Radar Images. Sensors 2025, 25, 2207. https://doi.org/10.3390/s25072207
Wang C, Wang L, Li N. Wave-Net: A Marine Raft Aquaculture Area Extraction Framework Based on Feature Aggregation and Feature Dispersion for Synthetic Aperture Radar Images. Sensors. 2025; 25(7):2207. https://doi.org/10.3390/s25072207
Chicago/Turabian StyleWang, Chengyi, Lei Wang, and Ningyang Li. 2025. "Wave-Net: A Marine Raft Aquaculture Area Extraction Framework Based on Feature Aggregation and Feature Dispersion for Synthetic Aperture Radar Images" Sensors 25, no. 7: 2207. https://doi.org/10.3390/s25072207
APA StyleWang, C., Wang, L., & Li, N. (2025). Wave-Net: A Marine Raft Aquaculture Area Extraction Framework Based on Feature Aggregation and Feature Dispersion for Synthetic Aperture Radar Images. Sensors, 25(7), 2207. https://doi.org/10.3390/s25072207