


Machine Learning Models and Mathematical Approaches for Predictive IoT Smart Parking


Abstract
1. Introduction
2. Materials and Methods
2.1. Data Collection
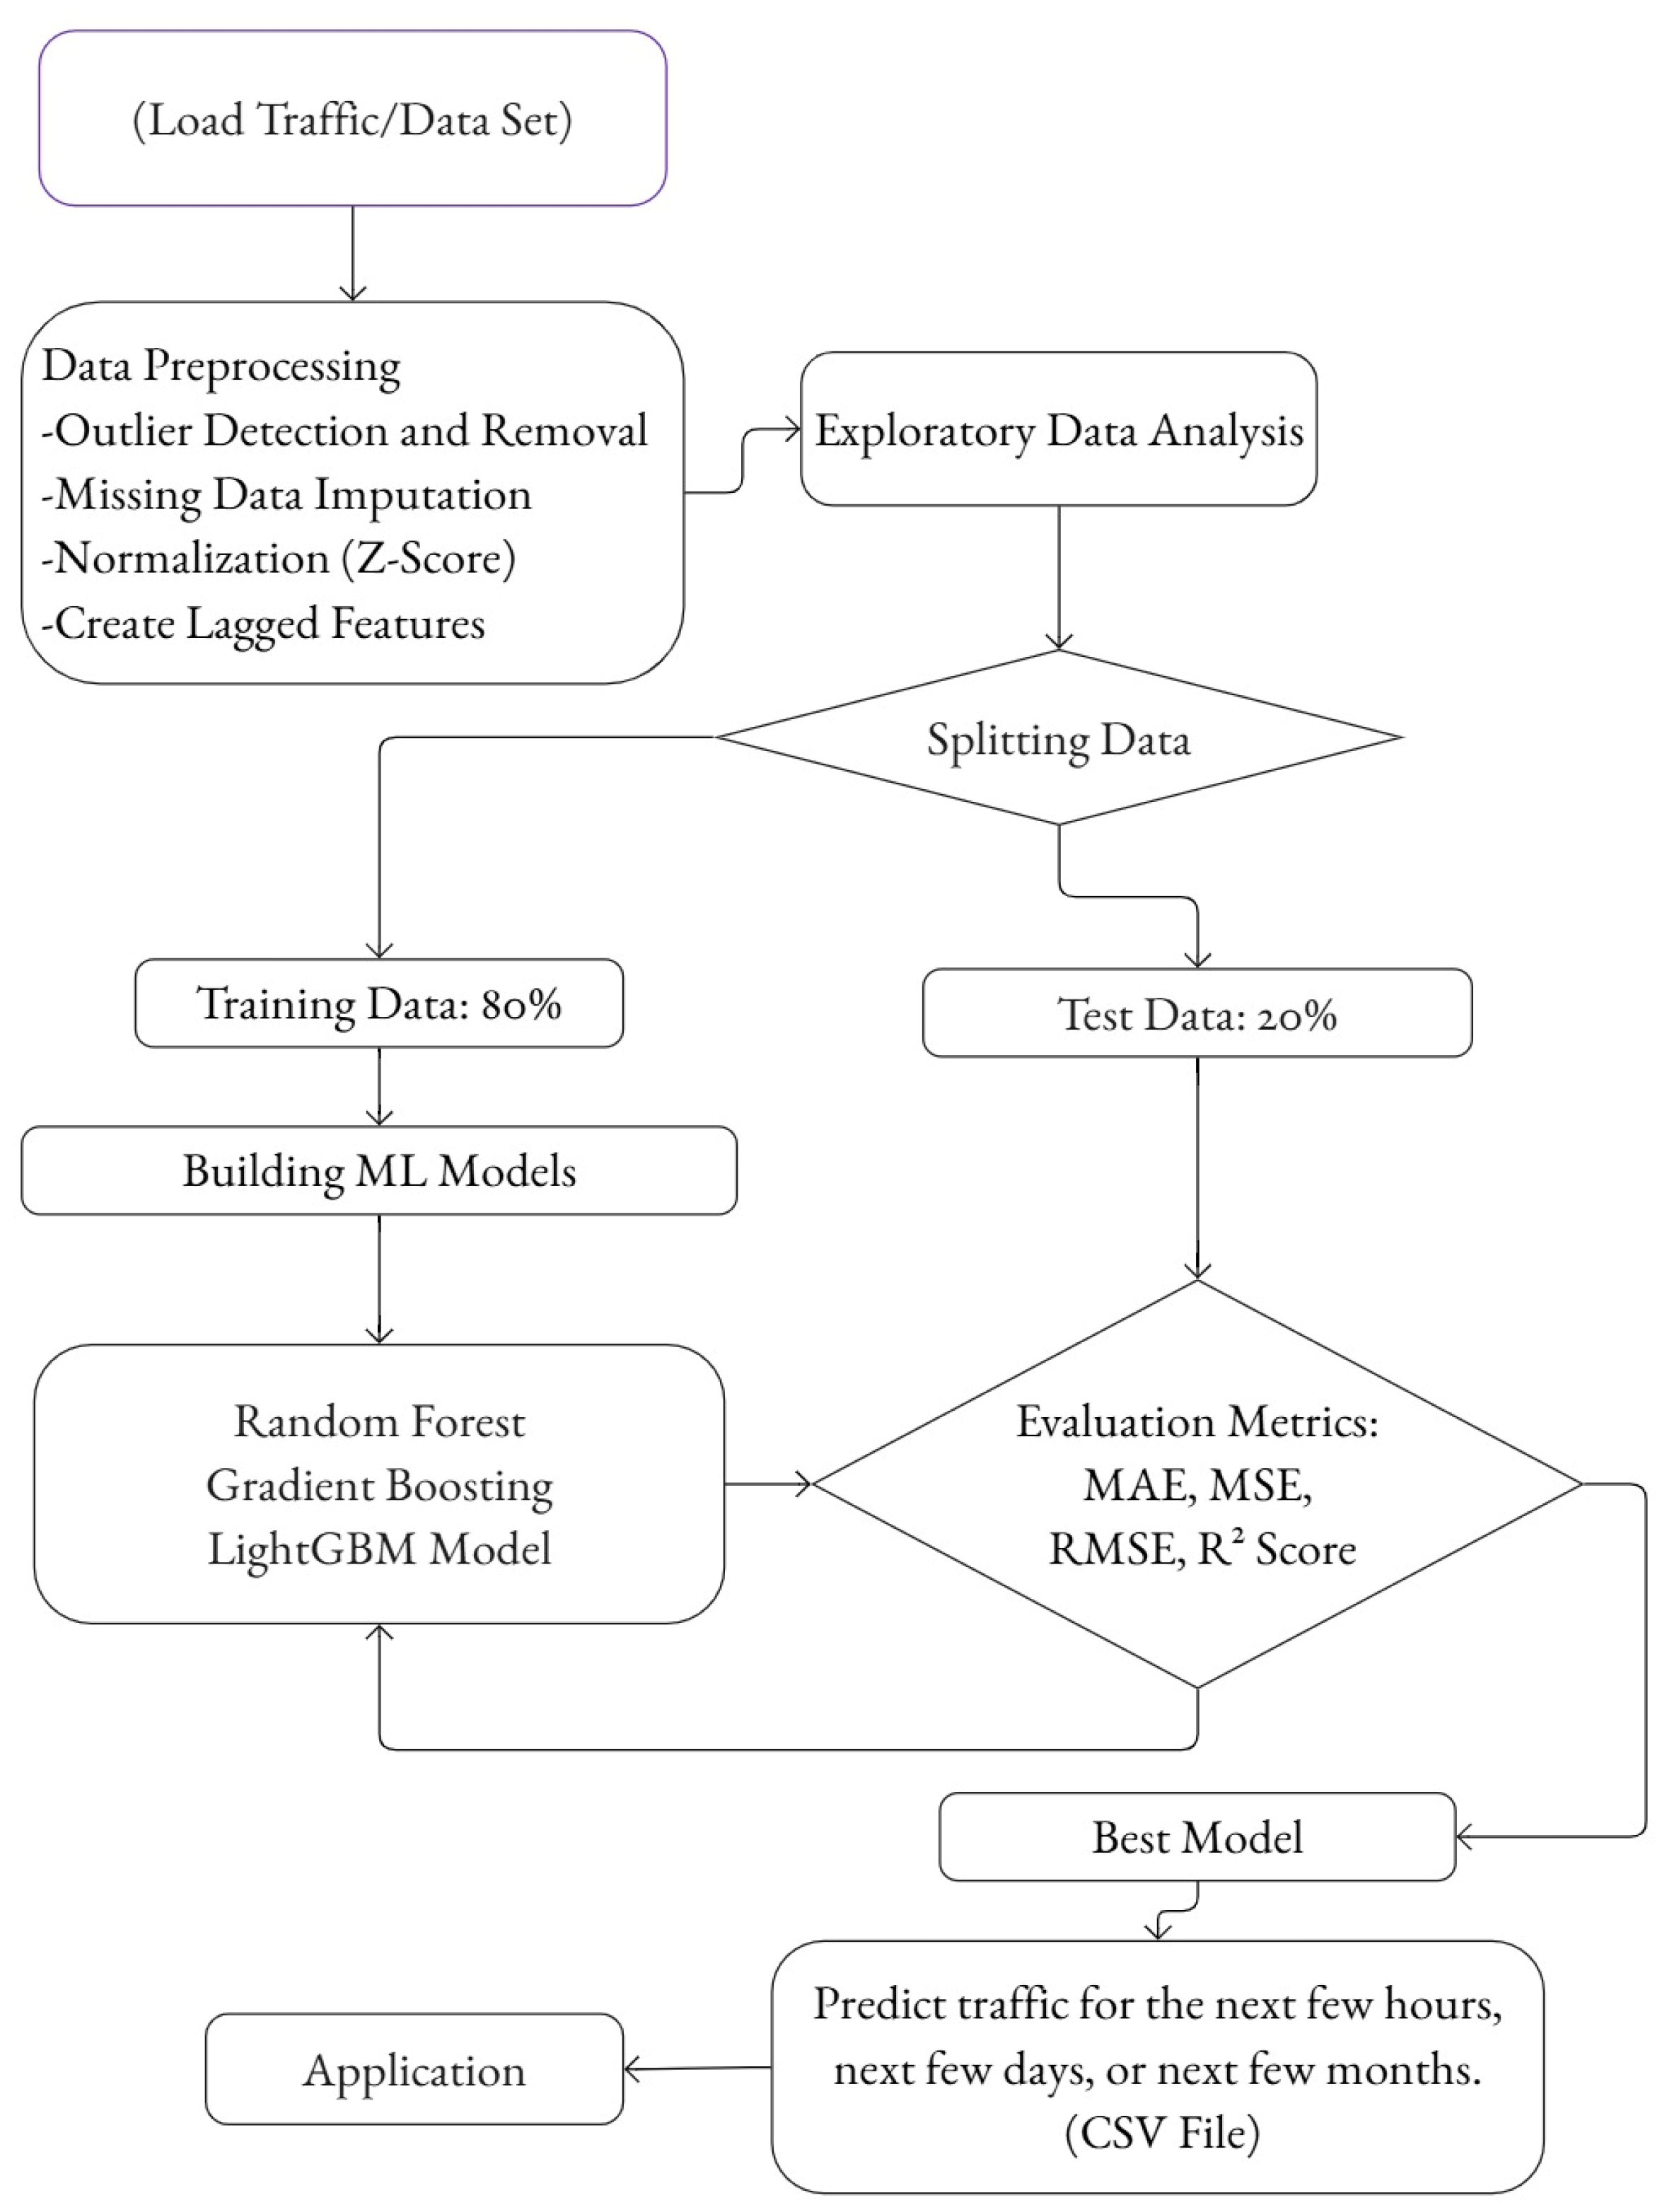
2.2. Data Preprocessing
- Outlier Detection and Removal: Outliers were identified using Z-score analysis and handled to reduce their impact on the model’s performance.
- Missing Data Imputation: Values were imputed using forward-fill and backward-fill techniques.
- Normalization: Z-score normalization was used on the numerical features (such as vehicle counts and occupancy times) to make data more standard and thus improve model performance. Because these features were unbounded and of different scales, Z-score normalization allowed all the variables to contribute equally in the training process. Each feature value x was transformed using:
- Lagged features were created to capture temporal dependencies in the data. For time series data, these were generated as follows:
2.3. Machine Learning Models
2.3.1. Random Forest Regressor
2.3.2. Gradient Boosting Model
2.3.3. Light Gradient Boosting Machine (LightGBM) Regression Model
2.3.4. Hyperparameter Optimization
2.4. Model Evaluation
- The root mean squared error (RMSE) [34,35] measures the average magnitude of the errors between predicted and actual values. It penalizes large errors more than MAE because it squares them before averaging. It is sensitive to outliers. It highlights large errors (which is useful for high-risk predictions).
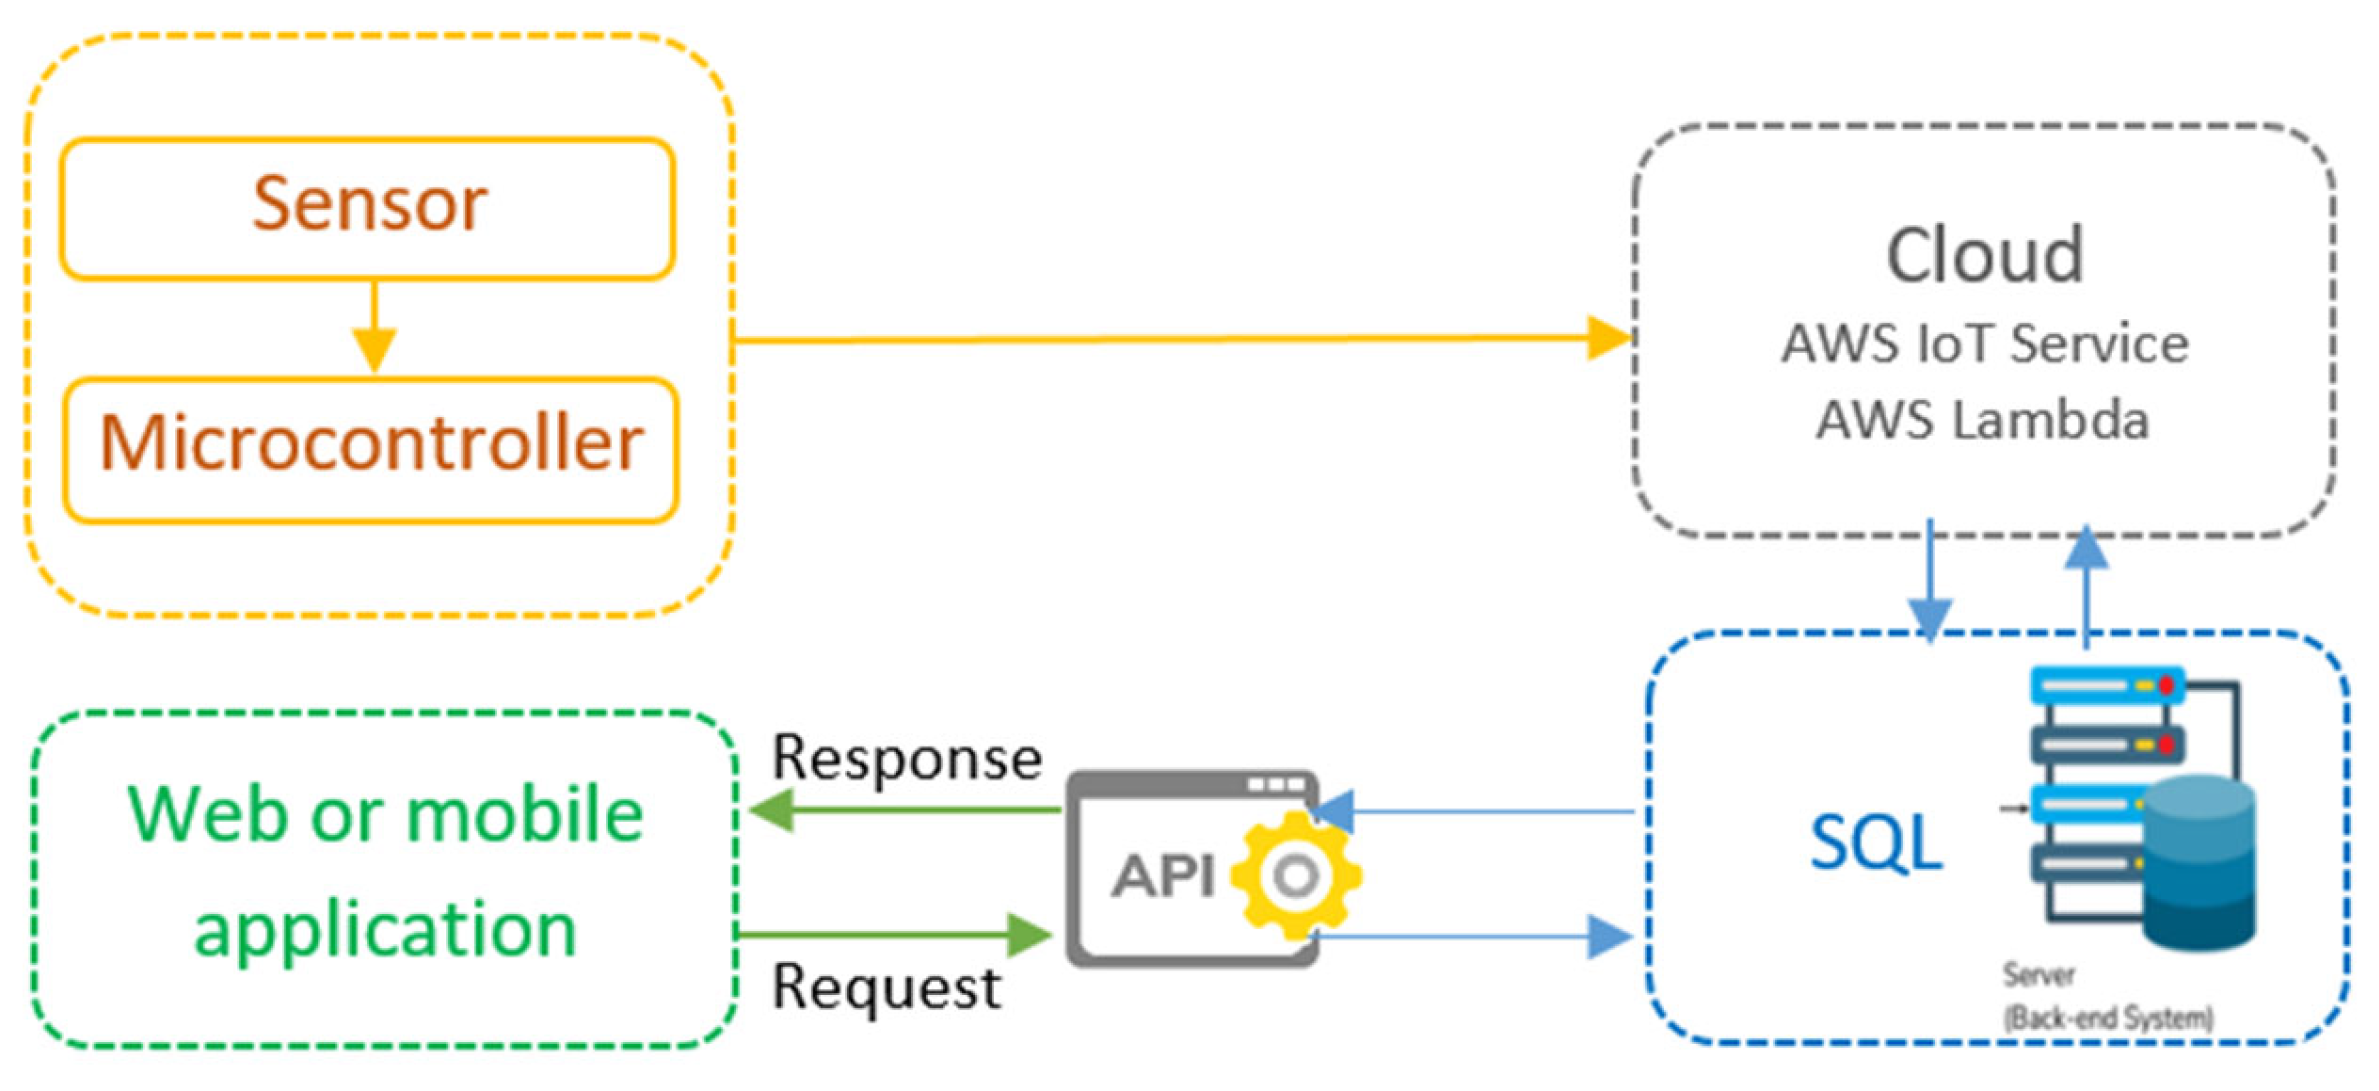
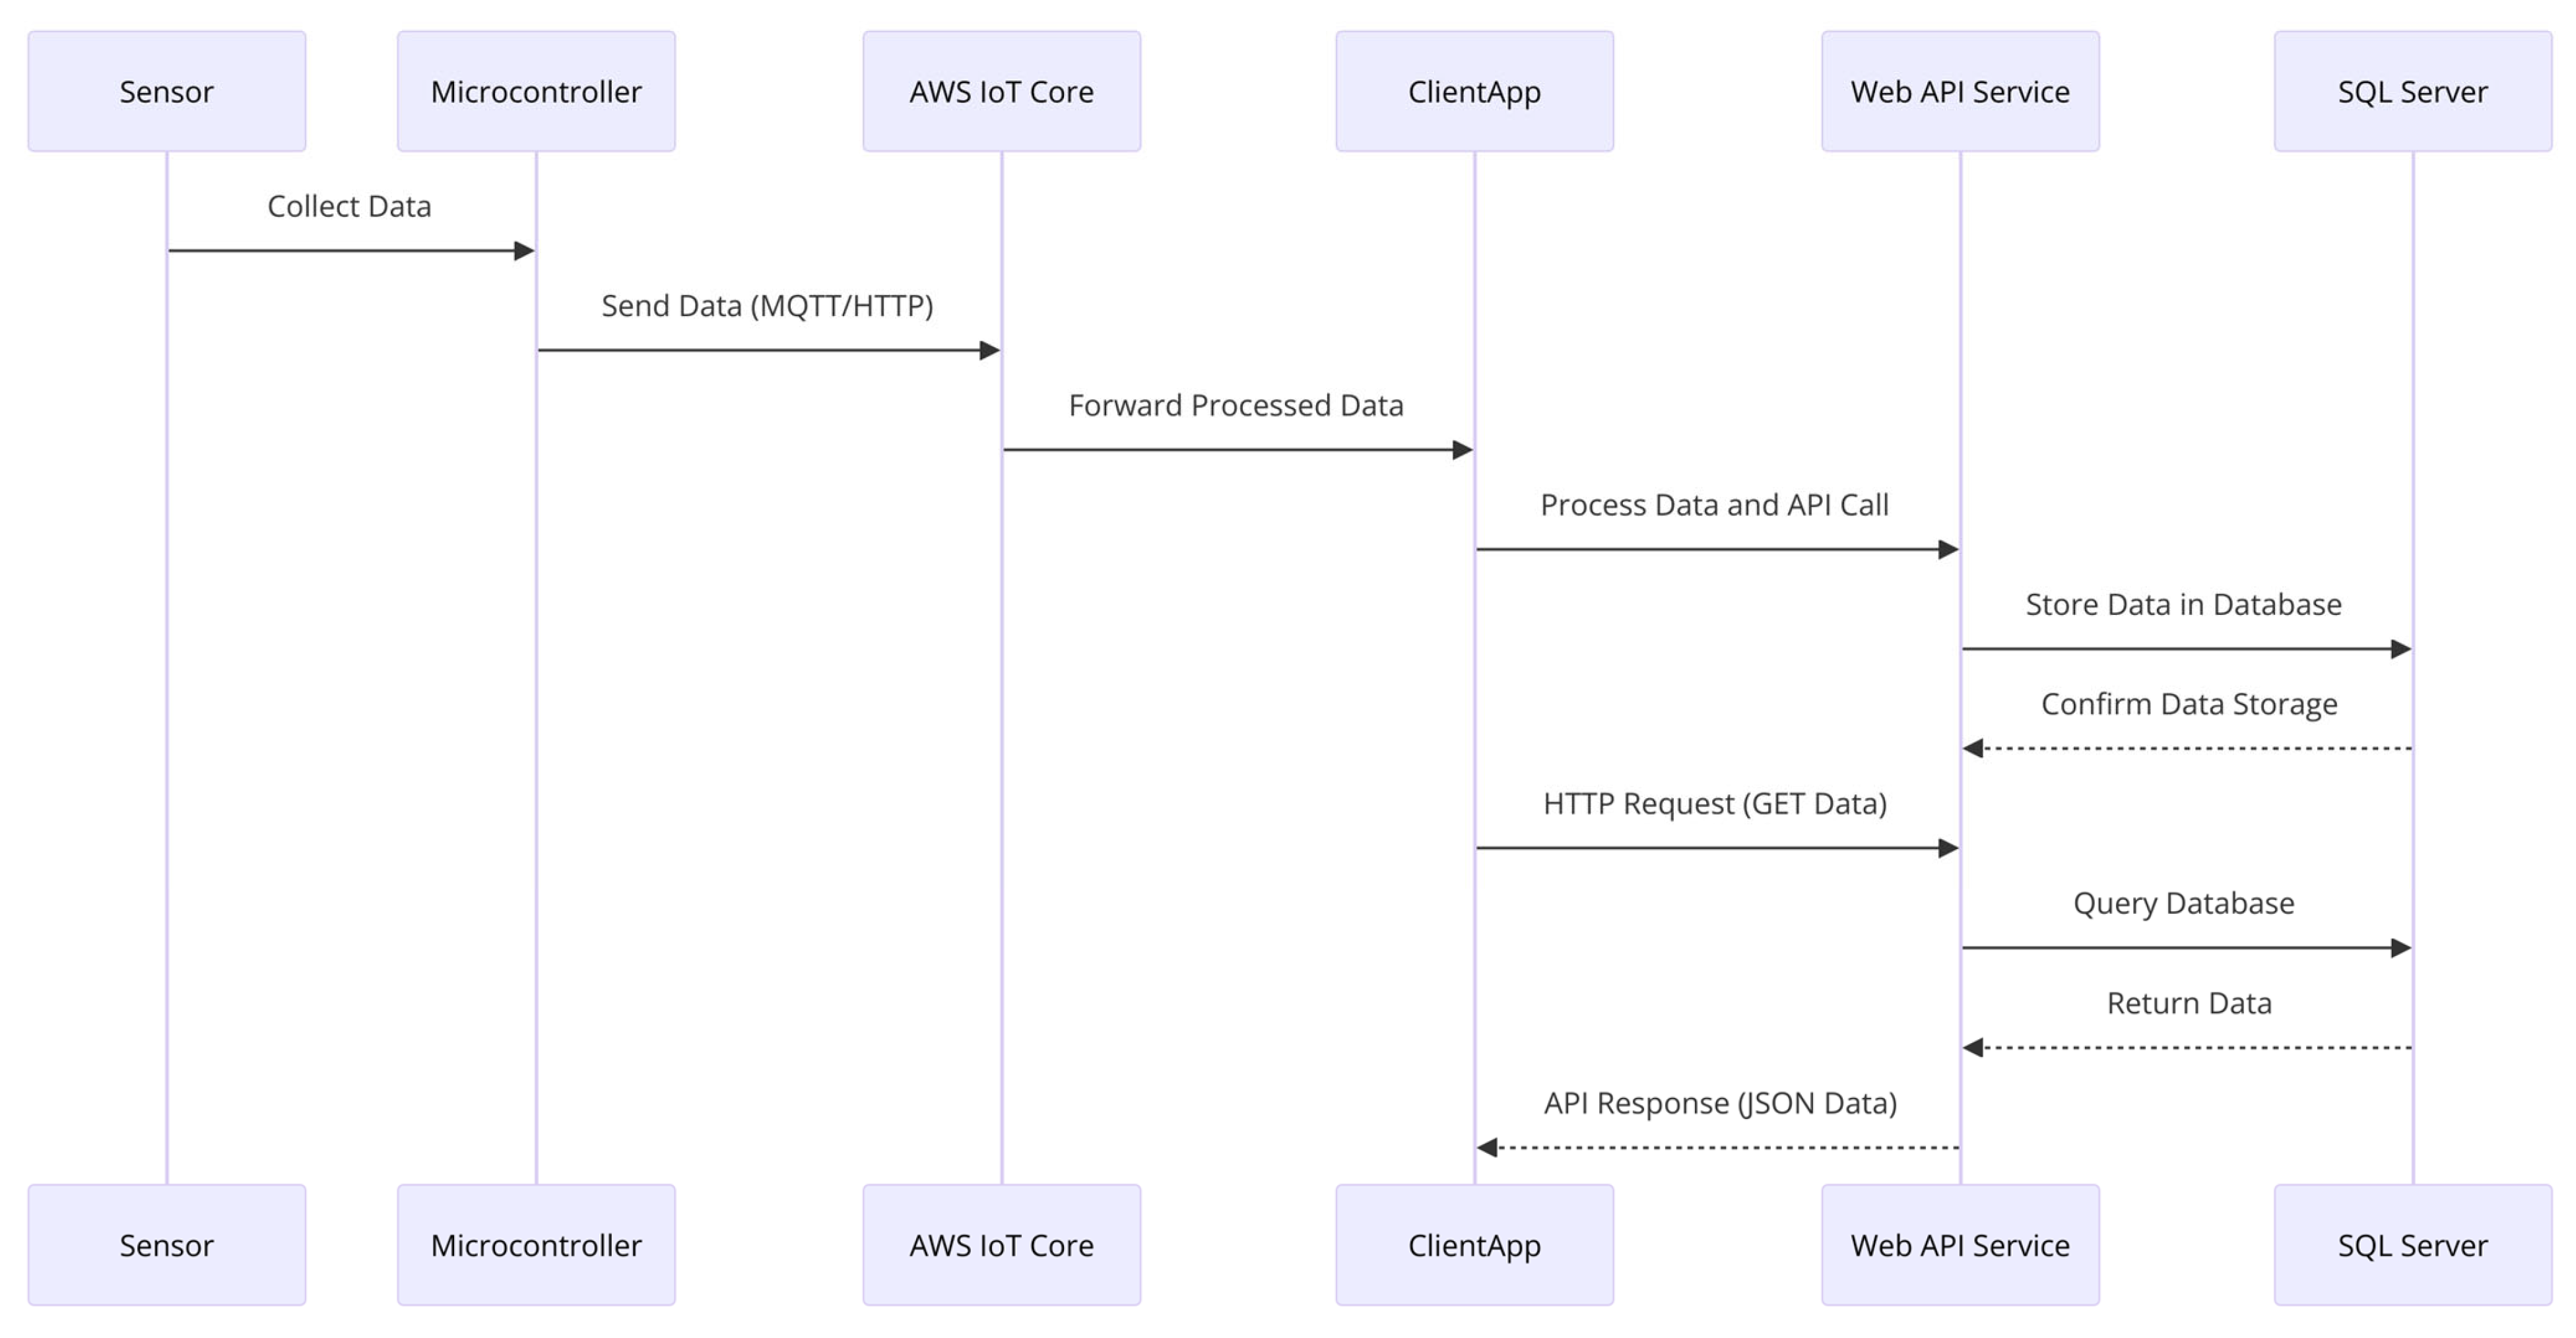
2.5. Deployment and Integration
3. Results
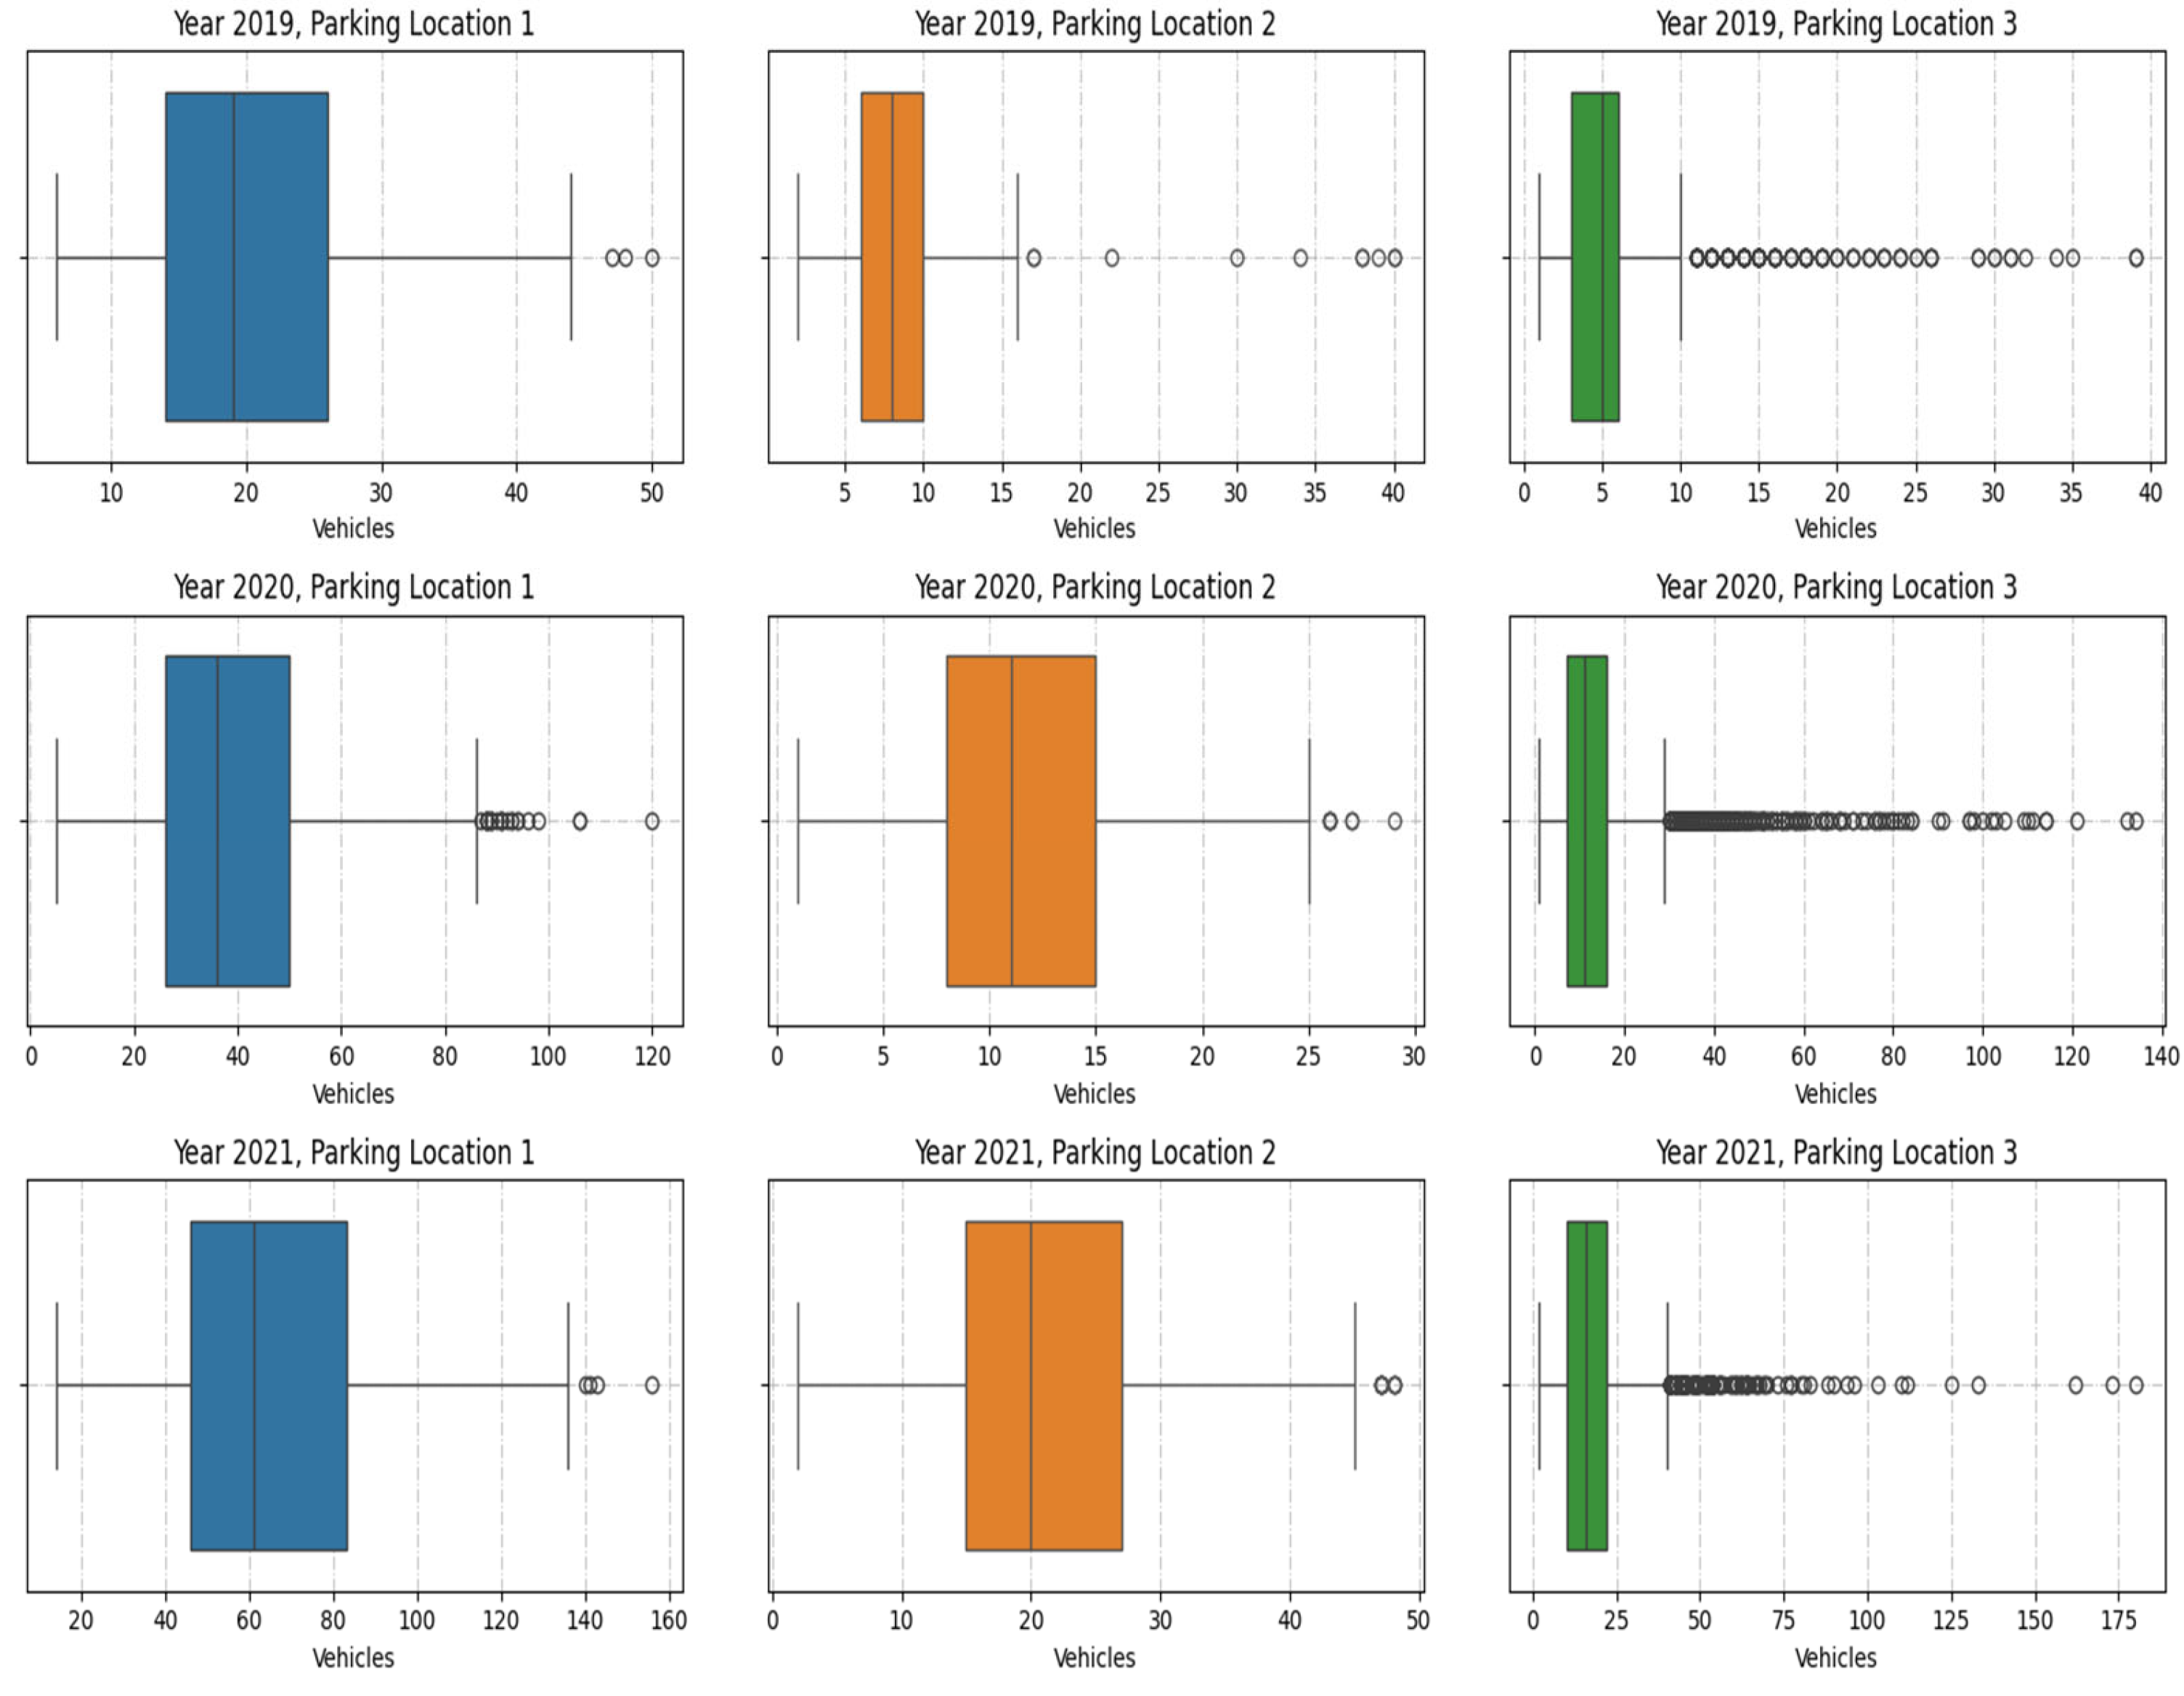
3.1. Dataset
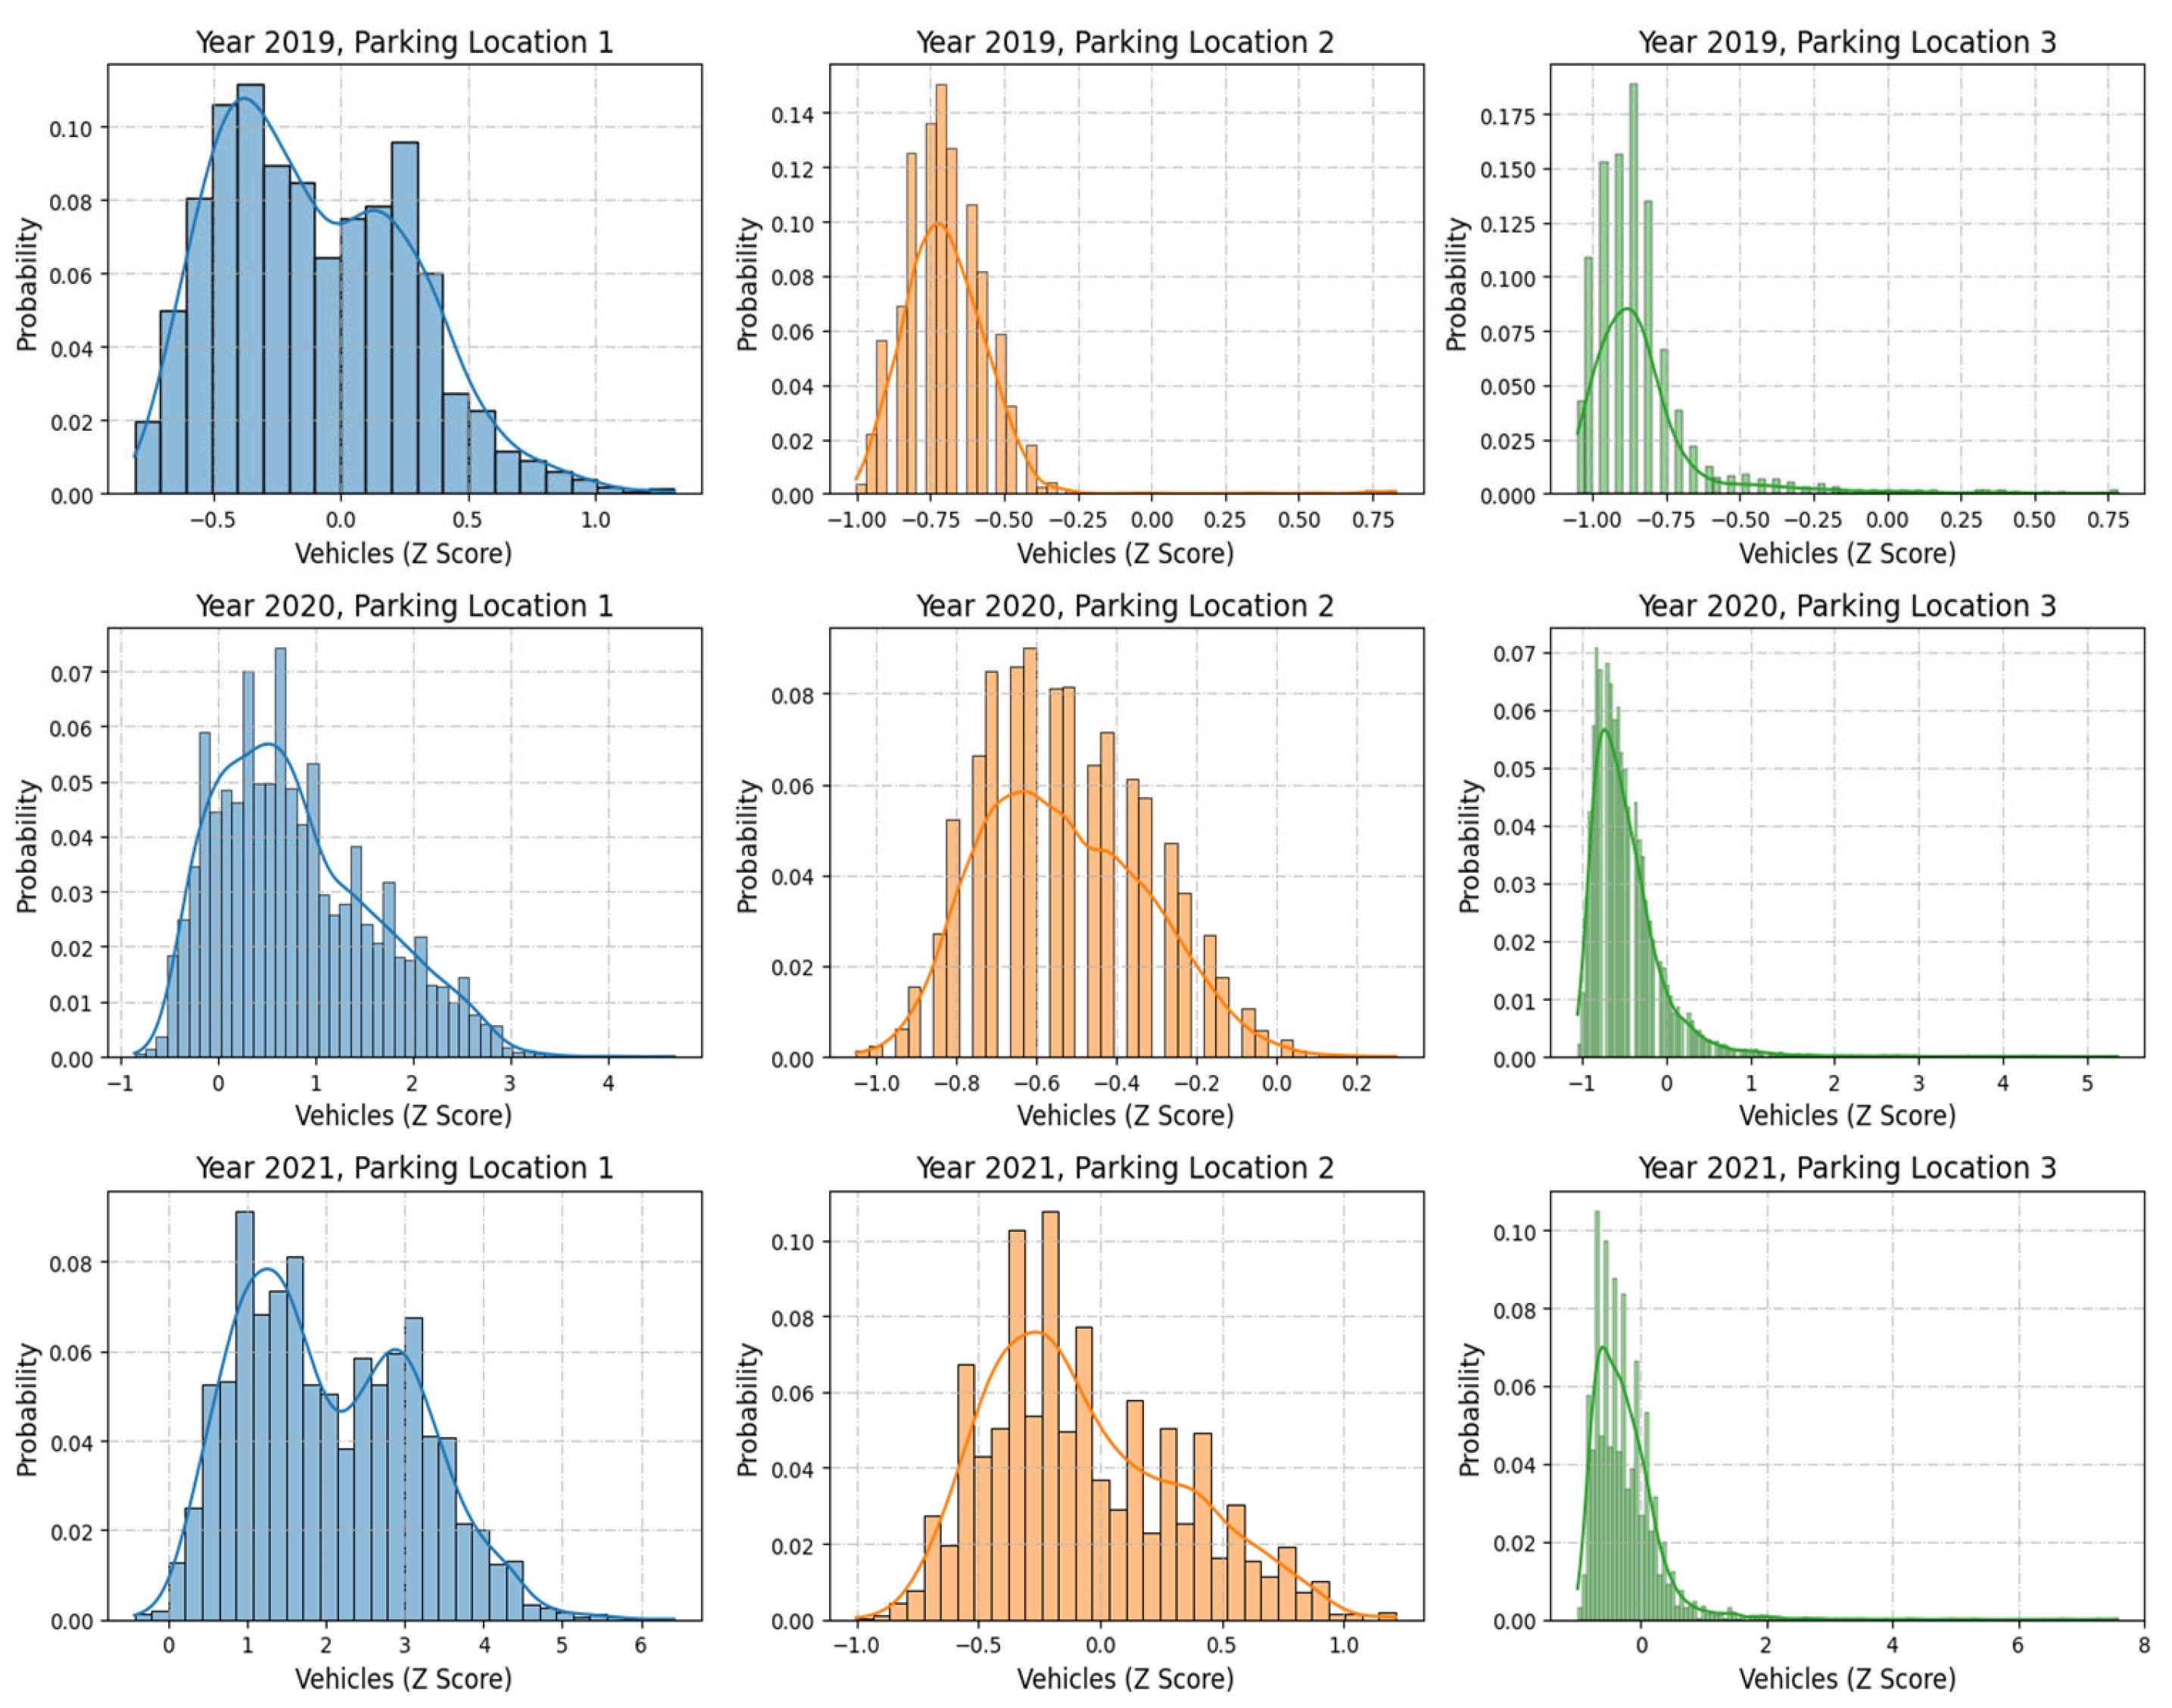
3.1.1. Normalization
- Parking Location 1 maintains a wider spread even after normalization, reflecting its inherently higher variability;
- Parking Location 2 shows a compact normalized range, emphasizing consistent parking patterns;
- Parking Location 3 remains skewed, with most values concentrated near the mean and a few extreme outliers.
3.1.2. Lagged Features
3.2. ML Models Results
- Random Forest Regressor: The best result was obtained using the lagged model for the first parking spot (R2 = 0.975874) and the use of Z-score normalization enhanced the accuracy of the third parking spot (R2 = 0.757917).
- Gradient Boosting Model: The lagged feature was found to perform best, with the highest R2 value of 0.967499 for the first parking spot and 0.883049 for the second parking spot. Z-score normalization was useful in reducing the RMSE.
- LightGBM Regression Model: The lagged feature model produced the best results in the predictive accuracy with an R2 value of 0.97725 for the first parking spot and 0.90499 for the second parking spot, with lower RMSE values.
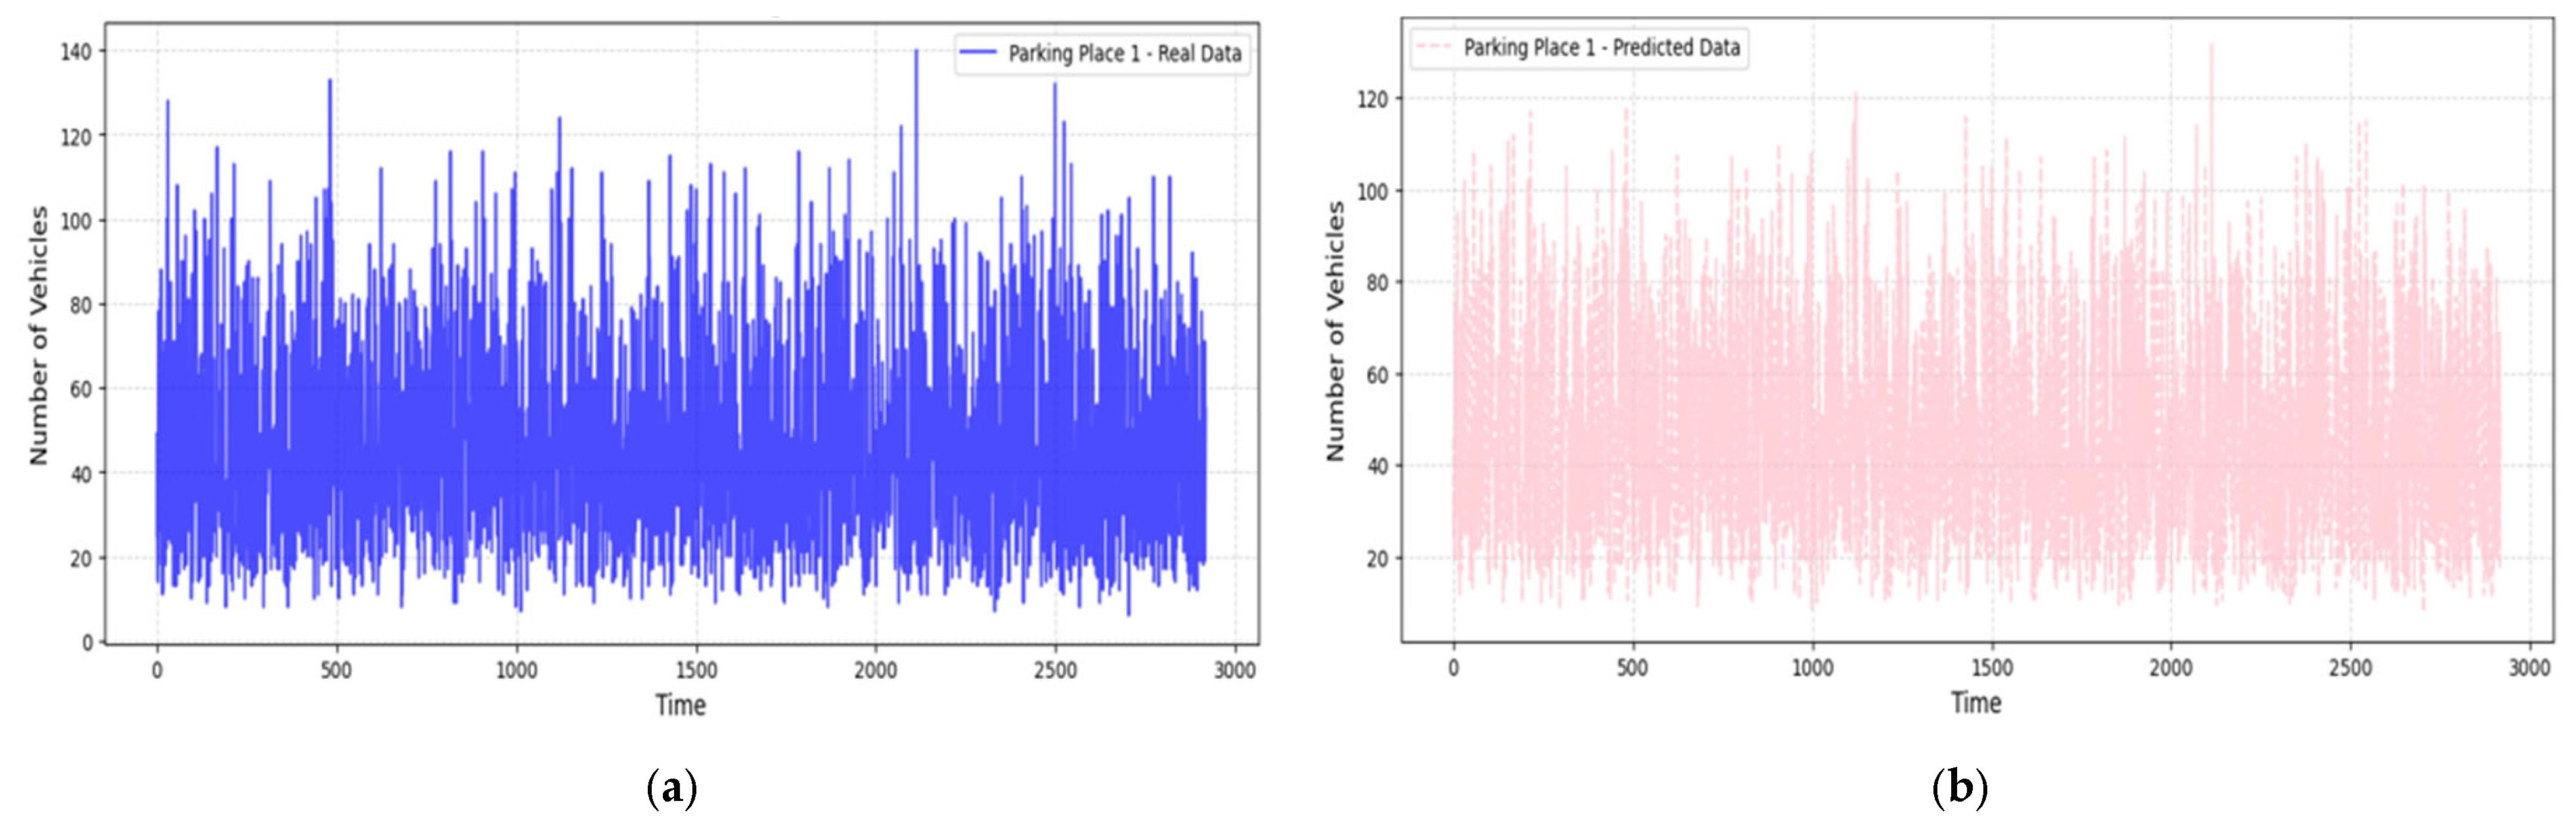
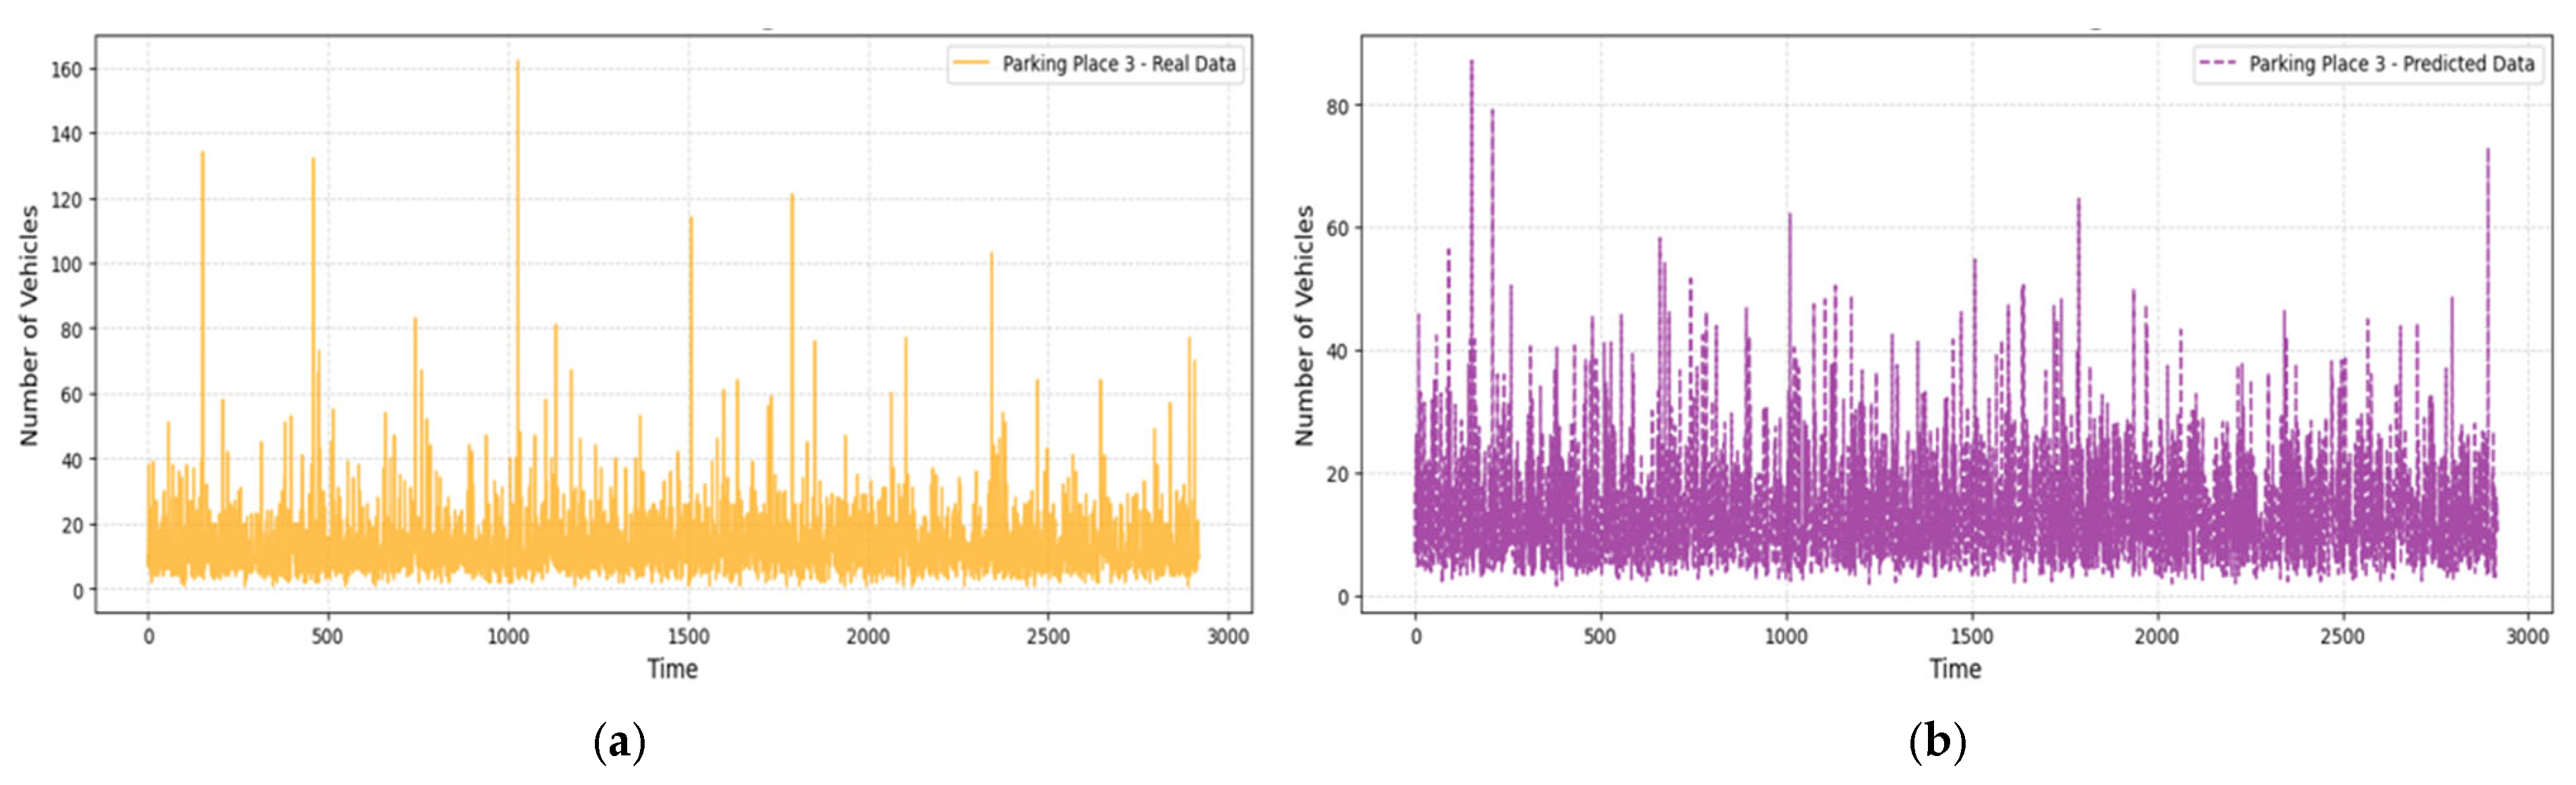
3.3. Predictions
3.4. System Design and Architecture
4. Discussion
5. Conclusions
Author Contributions
Funding
Institutional Review Board Statement
Informed Consent Statement
Data Availability Statement
Conflicts of Interest
References
- Shoup, D. Cruising for Parking. Transp. Policy 2006, 13, 479–486. [Google Scholar] [CrossRef]
- Barter, P. Is 30% of Traffic Actually Searching for Parking? Reinventing Parking. 2013. Available online: http://www.reinventingparking.org/2013/10/is-30-of-traffic-actually-searching-for.html (accessed on 10 January 2025).
- Dowling, C.; Fiez, T.; Ratliff, L.; Zhang, B. How Much Urban Traffic is Searching for Parking? Simulating Curbside Parking as a Network of Finite Capacity Queues. arXiv 2017, arXiv:1702.06156. [Google Scholar]
- Praba, R.; Darshan, G.; Roshanraj, K.T.; Prakash, P.B.S. Study on Machine Learning Algorithms. Int. J. Sci. Res. Comput. Sci. Eng. Inf. Technol. 2021, 7, 67–72. [Google Scholar]
- Shafique, M.; Naseer, M.; Theocharides, T.; Kyrkou, C.; Mutlu, O.; Orosa, L.; Choi, J. Robust Machine Learning Systems: Challenges, Current Trends, Perspectives, and the Road Ahead. IEEE Des. Test. 2020, 37, 30–57. [Google Scholar] [CrossRef]
- Raj, A.; Shetty, S.D. Smart parking systems technologies, tools, and challenges for implementing in a smart city environment: A survey based on IoT & ML perspective. Int. J. Mach. Learn. Cyber. 2024, 15, 1–15. [Google Scholar] [CrossRef]
- Singh, T.; Rathore, R.; Gupta, K.; Vijay, E.; Harikrishnan, R. Artificial Intelligence-Enabled Smart Parking System. In Innovations in Electrical and Electronic Engineering; Lecture Notes in Electrical Engineering; Shaw, R.N., Siano, P., Makhilef, S., Ghosh, A., Shimi, S.L., Eds.; Springer: Singapore, 2024; Volume 1115, pp. 369–380. [Google Scholar] [CrossRef]
- Elfaki, A.O.; Messoudi, W.; Bushnag, A.; Abuzneid, S.; Alhmiedat, T. A Smart Real-Time Parking Control and Monitoring System. Sensors 2023, 23, 9741. [Google Scholar] [CrossRef]
- Vink, J.P.; de Haan, G. Comparison of machine learning techniques for target detection. Artif. Intell. Rev. 2015, 43, 125–139. [Google Scholar] [CrossRef]
- Antoska Knights, V.; Stankovski, M.; Nusev, S.; Temeljkovski, D.; Petrovska, O. Robots for Safety and Health at Work. Mech. Eng. Sci. J. 2015, 33, 275–279. Available online: https://www.mesj.ukim.edu.mk/journals/issue/download/17/9 (accessed on 5 January 2025).
- Muharram, A.P.; Sajid, F. Supervised Machine Learning Approach for Predicting Cardiovascular Complications Risk in Patients with Diabetes Mellitus. In Proceedings of the 2023 International Conference on Electrical Engineering and Informatics (ICEEI), Bandung, Indonesia, 10–12 July 2023; pp. 1–6. [Google Scholar] [CrossRef]
- Knights, V.; Kolak, M.; Markovikj, G.; Gajdoš Kljusurić, J. Modeling and Optimization with Artificial Intelligence in Nutrition. Appl. Sci. 2023, 13, 7835. [Google Scholar] [CrossRef]
- Knights, V.A.; Gacovski, Z.; Deskovski, S. Guidance and Control System for Platoon of Autonomous Mobile Robots. J. Electr. Eng. 2018, 6, 281–288. [Google Scholar] [CrossRef]
- Sarker, I.H. Machine Learning: Algorithms, Real-World Applications and Research Directions. SN Comput. Sci. 2021, 2, 160. [Google Scholar] [CrossRef] [PubMed]
- Navarro-Espinoza, A.; López-Bonilla, O.R.; García-Guerrero, E.E.; Tlelo-Cuautle, E.; López-Mancilla, D.; Hernández-Mejía, C.; Inzunza-González, E. Traffic Flow Prediction for Smart Traffic Lights Using Machine Learning Algorithms. Technologies 2022, 10, 5. [Google Scholar] [CrossRef]
- Boukerche, A.; Wang, J. Machine learning-based traffic prediction models for intelligent transportation systems. Comput. Netw. 2020, 181, 107530. [Google Scholar] [CrossRef]
- Knights, V.; Petrovska, O. Dynamic Modeling and Simulation of Mobile Robot Under Disturbances and Obstacles in an Environment. J. Appl. Math. Comput. 2024, 8, 59–67. [Google Scholar] [CrossRef]
- Antoska-Knights, V.; Gacovski, Z.; Deskovski, S. Obstacles Avoidance Algorithm for Mobile Robots, Using the Potential Fields Method. Univ. J. Electr. Electron. Eng. 2017, 5, 75–84. [Google Scholar] [CrossRef]
- Antoska, V.; Jovanović, K.; Petrović, V.M.; Baščarević, N.; Stankovski, M. Balance Analysis of the Mobile Anthropomimetic Robot Under Disturbances—ZMP Approach. Int. J. Adv. Robot. Syst. 2013, 10, 206. [Google Scholar] [CrossRef]
- Bzai, J.; Alam, F.; Dhafer, A.; Bojović, M.; Altowaijri, S.M.; Niazi, I.K.; Mehmood, R. Machine Learning-Enabled Internet of Things (IoT): Data, Applications, and Industry Perspective. Electronics 2022, 11, 2676. [Google Scholar] [CrossRef]
- Rafique, S.H.; Abdallah, A.; Musa, N.S.; Murugan, T. Machine Learning and Deep Learning Techniques for Internet of Things Network Anomaly Detection—Current Research Trends. Sensors 2024, 24, 1968. [Google Scholar] [CrossRef]
- Knights, V.A.; Gacovski, Z. Methods for Detection and Prevention of Vulnerabilities in the IoT (Internet of Things) Systems. In Internet of Things-New Insights; IntechOpen: London, UK, 2024. [Google Scholar] [CrossRef]
- Canadian Institute for Cybersecurity, University of New Brunswick. ISCX Dataset. Available online: https://www.unb.ca/cic/datasets/index.html (accessed on 16 February 2025).
- Vapnik, V.N. The Nature of Statistical Learning Theory, 2nd ed.; Springer: New York, NY, USA, 1995. [Google Scholar]
- Draper, N.R.; Smith, H. Applied Regression Analysis, 3rd ed.; Wiley: New York, NY, USA, 1998. [Google Scholar]
- James, G.; Witten, D.; Hastie, T.; Tibshirani, R. An Introduction to Statistical Learning: With Applications in R; Springer: New York, NY, USA, 2013. [Google Scholar]
- Knights, V.; Prchkovska, M. From Equations to Predictions: Understanding the Mathematics and Machine Learning of Multiple Linear Regression. J. Math. Comput. Appl. 2024, 3, 1–8. [Google Scholar] [CrossRef]
- Irmalasari, I.; Dwiyanti, L. Algorithm Analysis of Decision Tree, Gradient Boosting Decision Tree, and Random Forest for Classification (Case Study: West Java House of Representatives Election 2019). In Proceedings of the 2023 International Conference on Electrical Engineering and Informatics (ICEEI), Bandung, Indonesia, 10–12 July 2023; pp. 1–5. [Google Scholar] [CrossRef]
- Naceur, H.A.; Abdo, H.G.; Igmoullan, B.; Namous, M.; Alshehri, F.; Albanai, J.A. Implementation of Random Forest, Adaptive Boosting, and Gradient Boosting Decision Trees Algorithms for Gully Erosion Susceptibility Mapping Using Remote Sensing and GIS. Environ. Earth Sci. 2024, 83, 121. [Google Scholar] [CrossRef]
- Quinlan, J.R. Induction of Decision Trees. Mach. Learn. 1986, 1, 81–106. [Google Scholar] [CrossRef]
- Breiman, L. Random Forests. Mach. Learn. 2001, 45, 5–32. [Google Scholar] [CrossRef]
- Friedman, J.H. Greedy Function Approximation: A Gradient Boosting Machine. Ann. Stat. 2001, 29, 1189–1232. [Google Scholar] [CrossRef]
- Yin, X.; Wu, G.; Wei, J.; Shen, Y.; Qi, H.; Yin, B. Deep Learning on Traffic Prediction: Methods, Analysis, and Future Directions. IEEE Trans. Intell. Transp. Syst. 2021, 23, 4927–4943. [Google Scholar] [CrossRef]
- Chai, T.; Draxler, R.R. Root Mean Square Error (RMSE) or Mean Absolute Error (MAE)? Arguments Against Avoiding RMSE in the Literature. Geosci. Model Dev. 2014, 7, 1247–1250. [Google Scholar] [CrossRef]
- Willmott, C.J.; Matsuura, K. Advantages of the Mean Absolute Error (MAE) Over the Root Mean Square Error (RMSE) in Assessing Average Model Performance. Clim. Res. 2005, 30, 79–82. [Google Scholar] [CrossRef]
- Hyndman, R.J.; Koehler, A.B. Another Look at Measures of Forecast Accuracy. Int. J. Forecast. 2006, 22, 679–688. [Google Scholar] [CrossRef]
- Knights, V.A.; Petrovska, O.; Kljusurić, J.G. Nonlinear Dynamics and Machine Learning for Robotic Control Systems in IoT Applications. Future Internet 2024, 16, 435. [Google Scholar] [CrossRef]
- Knights, V.; Petrovska, O.; Prchkovska, M. Enhancing Smart Parking Management through Machine Learning and AI Integration in IoT Environments. In Navigating the Internet of Things in the 22nd Century—Concepts, Applications, and Innovations; IntechOpen: London, UK, 2024. [Google Scholar] [CrossRef]
- Theodoridis, S. Machine Learning: A Bayesian and Optimization Perspective, 2nd ed.; Elsevier: Amsterdam, The Netherlands, 2020. [Google Scholar]
- Pandian, S. Time Series Analysis: Definition, Components, Methods, and Applications. Analytics Vidhya. 2025. Available online: https://www.analyticsvidhya.com/blog/2021/10/a-comprehensive-guide-to-time-series-analysis/ (accessed on 1 January 2025).
- Statsmodels Development Team. Autoregressive Distributed Lag (ARDL) Models. Statsmodels Documentation. 2024. Available online: https://www.statsmodels.org/devel/examples/notebooks/generated/autoregressive_distributed_lag.html (accessed on 20 December 2024).
- Sankpal, K.A.; Metre, K.V. A Review on Data Normalization Techniques. Int. J. Eng. Res. Technol. 2020, 9, 1438. [Google Scholar] [CrossRef]
- Xiao, R.I.; Jaller, M. Prediction Framework for Parking Search Cruising Time and Emissions in Dense Urban Areas. Transportation 2023. [Google Scholar] [CrossRef]
- Springer. Distributed Lags and Dynamic Models. In Econometrics; Springer: Berlin/Heidelberg, Germany, 2008. [Google Scholar] [CrossRef]
- Mills, T.C. Transfer Functions and Autoregressive Distributed Lag Modeling. In Applied Time Series Analysis; Mills, T.C., Ed.; Academic Press: Cambridge, MA, USA, 2019; pp. 201–210. ISBN 9780128131176. [Google Scholar] [CrossRef]
- Mills, T.C. Applied Time Series Analysis: A Practical Guide to Modeling and Forecasting; Academic Press: Cambridge, MA, USA; Elsevier: Amsterdam, The Netherlands, 2019; ISBN 978-0-12-813117-6. [Google Scholar] [CrossRef]
- Dujić Rodić, L.; Perković, T.; Županović, T.; Šolić, P. Sensing Occupancy through Software: Smart Parking Proof of Concept. Electronics 2020, 9, 2207. [Google Scholar] [CrossRef]
- Kalbhor, A.; Nair, R.S.; Phansalkar, S.; Sonkamble, R.; Sharma, A.; Mohan, H.; Wong, C.H.; Lim, W.H. PARKTag: An AI–Blockchain Integrated Solution for an Efficient, Trusted, and Scalable Parking Management System. Technologies 2024, 12, 155. [Google Scholar] [CrossRef]
- Mishra, A.; Karmakar, A.; Ghatak, A.; Ghosh, S.; Ojha, A.; Patra, K. Low Cost Parking System for Smart Cities: A Vehicle Occupancy Sensing and Resource Optimization Technique Using IoT and Cloud PaaS. Int. J. Sci. Technol. Res. 2019, 8, 1–6. Available online: https://www.ijstr.org/final-print/sep2019/Low-Cost-Parking-System-For-Smart-Cities-A-Vehicle-Occupancy-Sensing-And-Resource-Optimization-Technique-Using-Iot-And-Cloud-Paas-.pdf (accessed on 20 December 2024).
- Rupani, S.; Doshi, N. A Review of Smart Parking Using Internet of Things (IoT). Procedia Comput. Sci. 2019, 160, 706–711. [Google Scholar] [CrossRef]
- Alsafar, B.S.; Alzaher, D.M.; ALshwukh, R.W.; Darwish, A.M.; Ahmed, T.E.; Alyahyan, E.A.; Alboaneen, D.; El-Sharawy, E.E. Smart Parking Management System Using IoT. J. Internet Serv. Inf. Secur. 2024, 14, 284–297. [Google Scholar] [CrossRef]
- Alharbi, A.; Halikias, G.; Yamin, M.; Abi Sen, A.A. Web-Based Framework for Smart Parking System. Int. J. Inf. Technol. 2021, 13, 1495–1502. [Google Scholar] [CrossRef]
- Booth, H. Demographic Forecasting: 1980 to 2005 in Review. Int. J. Forecast. 2006, 22, 547–581. [Google Scholar] [CrossRef]
- Butt, U.A.; Mehmood, M.; Shah, S.B.H.; Amin, R.; Shaukat, M.W.; Raza, S.M.; Suh, D.Y.; Piran, M.J. A Review of Machine Learning Algorithms for Cloud Computing Security. Electronics 2020, 9, 1379. [Google Scholar] [CrossRef]
- Yu, Y.-C. Smart Parking System Based on Edge-Cloud-Dew Computing Architecture. Electronics 2023, 12, 2801. [Google Scholar] [CrossRef]
- Kriebel, F.; Rehman, S.; Hanif, M.A.; Khalid, F.; Shafique, M. Robustness for Smart Cyber Physical Systems and Internet-of-Things: From Adaptive Robustness Methods to Reliability and Security for Machine Learning. In Proceedings of the 2018 IEEE Computer Society Annual Symposium on VLSI (ISVLSI), Hong Kong, China, 8–11 July 2018; pp. 581–586. [Google Scholar] [CrossRef]


| Feature Name | Description | Type |
|---|---|---|
| DateTime | Timestamp of the recorded parking data | Datetime |
| Hour of the Day | Extracted hour from DateTime | Integer (0–23) |
| Day of the Week | Extracted day from DateTime (0 = Monday, 6 = Sunday) | Integer (0–6) |
| Month | Extracted month from DateTime (1 = January, 12 = December) | Integer (1–12) |
| ParkingPlace | Unique identifier for each parking location | Categorical (Integer) |
| ID | Unique record identifier (YYYYMMDDHH Parking Location) | String |
| Vehicles | Number of vehicles counted at that timestamp | Integer |
| Entry Count (Derived) | Vehicles entering the parking lot in that interval | Integer |
| Exit Count (Derived) | Vehicles leaving the parking lot in that interval | Integer |
| Total Vehicles in Parking Lot (Derived) | Current number of parked vehicles, calculated as Total Vehicles = Initial Capacity + Entry Count − Exit Count | Integer |
| Occupancy Rate (%) (Derived) | Parking space utilization percentage, calculated as | Float |
| Parking Place No./Random Forest Regressor | R2 | RMSE | MSE |
|---|---|---|---|
| 1st | 0.947253 | 5.292016 | 3.969012 |
| 2nd | 0.865725 | 2.654923 | 1.991192 |
| 3rd | 0.706305 | 5.318437 | 3.988827 |
| Random Forest Regressor—Z-Score Normalization | R2 | RMSE | MSE |
| 1st | 0.947843 | 0.263191 | 0.197393 |
| 2nd | 0.869550 | 0.134316 | 0.100737 |
| 3rd | 0.757917 | 0.243712 | 0.182784 |
| Random Forest Regressor—lag_model | R2 | RMSE | MSE |
| 1st | 0.975874 | 3.970988 | 2.978241 |
| 2nd | 0.881247 | 2.522727 | 1.892045 |
| 3rd | 0.749207 | 4.967311 | 3.725483 |
| Gradient Boosting Model | R2 | RMSE | MSE |
| 1st | 0.779331 | 8.877456 | 6.658092 |
| 2nd | 0.727689 | 3.820714 | 2.865535 |
| 3rd | 0.415435 | 8.173594 | 6.130195 |
| Gradient Boosting Model—Z-Score Normalization | R2 | RMSE | MSE |
| 1st | 0.94316 | 0.26166 | 0.196245 |
| 2nd | 0.85673 | 0.13271 | 0.099532 |
| 3rd | 0.69188 | 0.27928 | 0.209459 |
| Gradient Boosting Model—lag_model | R2 | RMSE | MSE |
| 1st | 0.967499 | 4.092043 | 3.069032 |
| 2nd | 0.883049 | 2.484115 | 1.863086 |
| 3rd | 0.718058 | 5.396979 | 4.047734 |
| LightGBM Regression Model | R2 | RMSE | MSE |
| 1st | 0.794175 | 3.300778 | 2.475583 |
| 2nd | 0.571899 | 3.827113 | 2.870334 |
| 3rd | 0.500927 | 2.587724 | 1.940793 |
| LightGBM Regression Model—Z-Score Normalization | R2 | RMSE | MSE |
| 1st | 0.947222 | 0.252000 | 0.189000 |
| 2nd | 0.852718 | 0.134618 | 0.100963 |
| 3rd | 0.704462 | 0.392441 | 0.294330 |
| LightGBM Regression Model—lag_model | R2 | RMSE | MSE |
| 1st | 0.977259 | 0.158018 | 0.118513 |
| 2nd | 0.904999 | 0.201007 | 0.150755 |
| 3rd | 0.741877 | 0.293423 | 0.205067 |
Disclaimer/Publisher’s Note: The statements, opinions and data contained in all publications are solely those of the individual author(s) and contributor(s) and not of MDPI and/or the editor(s). MDPI and/or the editor(s) disclaim responsibility for any injury to people or property resulting from any ideas, methods, instructions or products referred to in the content. |
© 2025 by the authors. Licensee MDPI, Basel, Switzerland. This article is an open access article distributed under the terms and conditions of the Creative Commons Attribution (CC BY) license (https://creativecommons.org/licenses/by/4.0/).
Share and Cite
Knights, V.; Petrovska, O.; Bunevska-Talevska, J.; Prchkovska, M. Machine Learning Models and Mathematical Approaches for Predictive IoT Smart Parking. Sensors 2025, 25, 2065. https://doi.org/10.3390/s25072065
Knights V, Petrovska O, Bunevska-Talevska J, Prchkovska M. Machine Learning Models and Mathematical Approaches for Predictive IoT Smart Parking. Sensors. 2025; 25(7):2065. https://doi.org/10.3390/s25072065
Chicago/Turabian StyleKnights, Vesna, Olivera Petrovska, Jasmina Bunevska-Talevska, and Marija Prchkovska. 2025. "Machine Learning Models and Mathematical Approaches for Predictive IoT Smart Parking" Sensors 25, no. 7: 2065. https://doi.org/10.3390/s25072065
APA StyleKnights, V., Petrovska, O., Bunevska-Talevska, J., & Prchkovska, M. (2025). Machine Learning Models and Mathematical Approaches for Predictive IoT Smart Parking. Sensors, 25(7), 2065. https://doi.org/10.3390/s25072065