
Acute Physiological and Perceptual Responses to Six Body-Weight Squat Exercise Variations

 ,
,  and
and 
Abstract
1. Introduction
2. Materials and Methods
2.1. Study Design
2.2. Participants
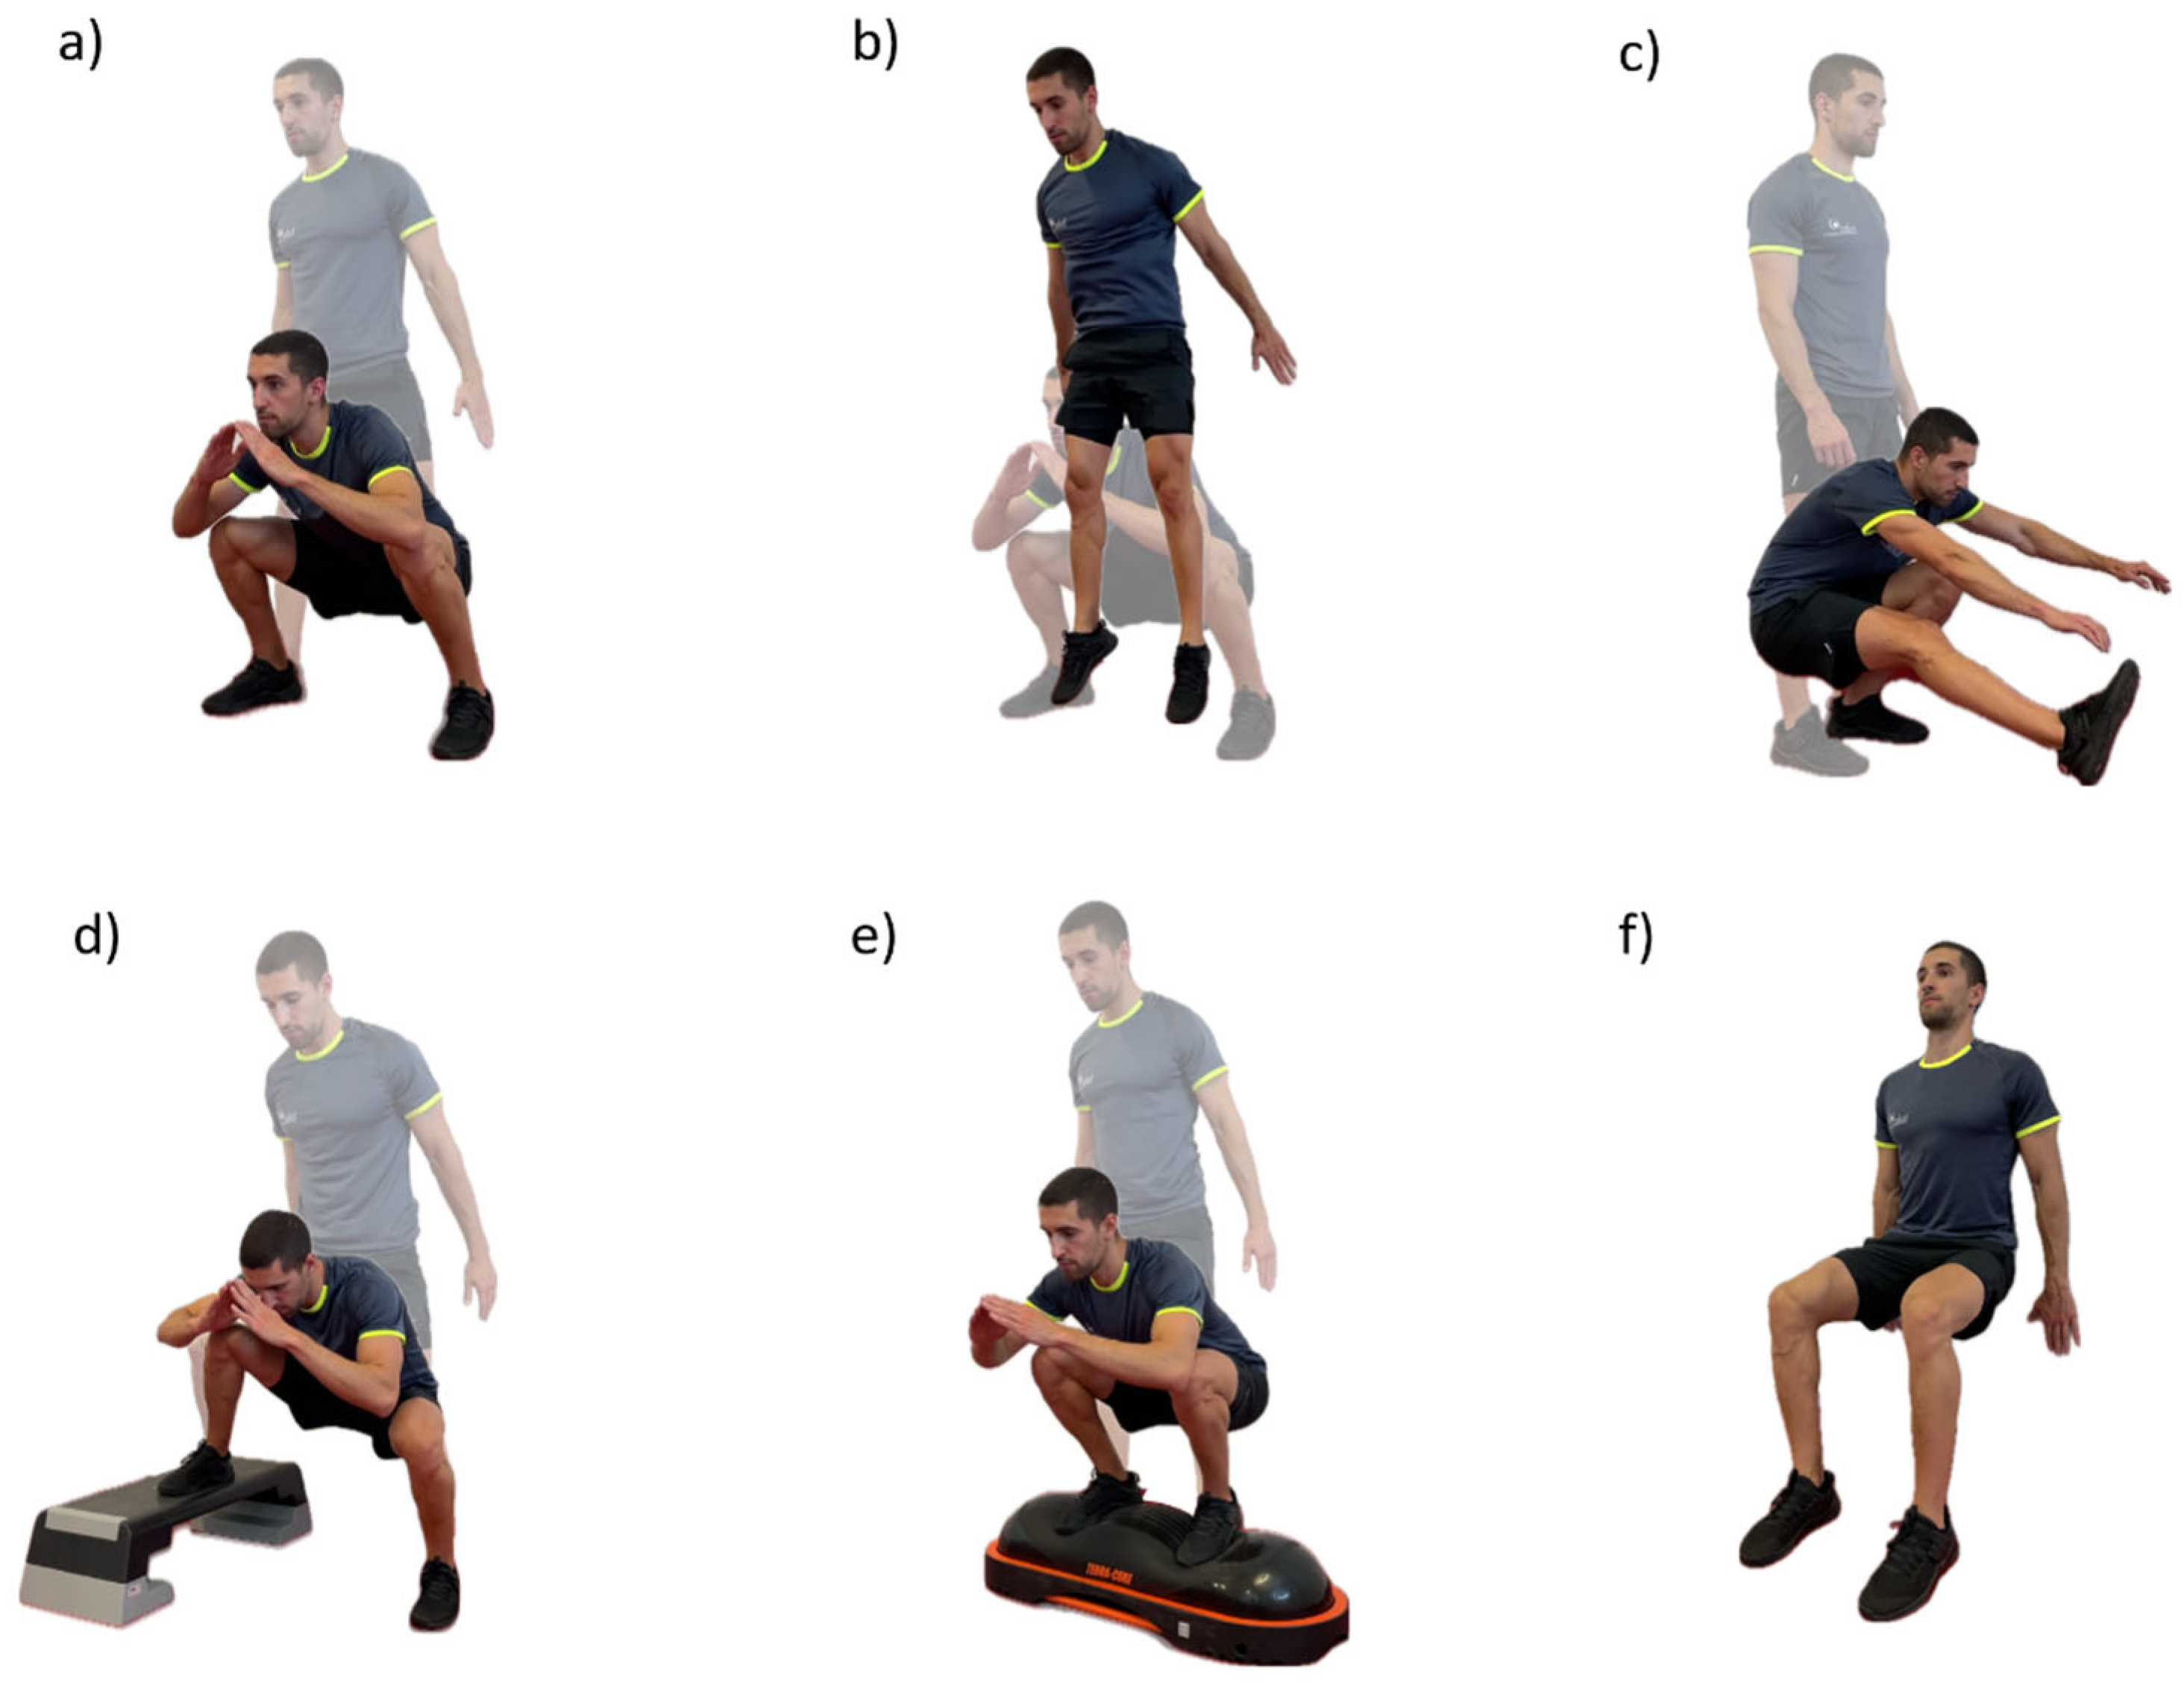
2.3. Procedures
2.4. Measurements and Instruments
2.4.1. Heart Rate (HR)
2.4.2. Near-Infrared Spectroscopy Sensor (NIRS)
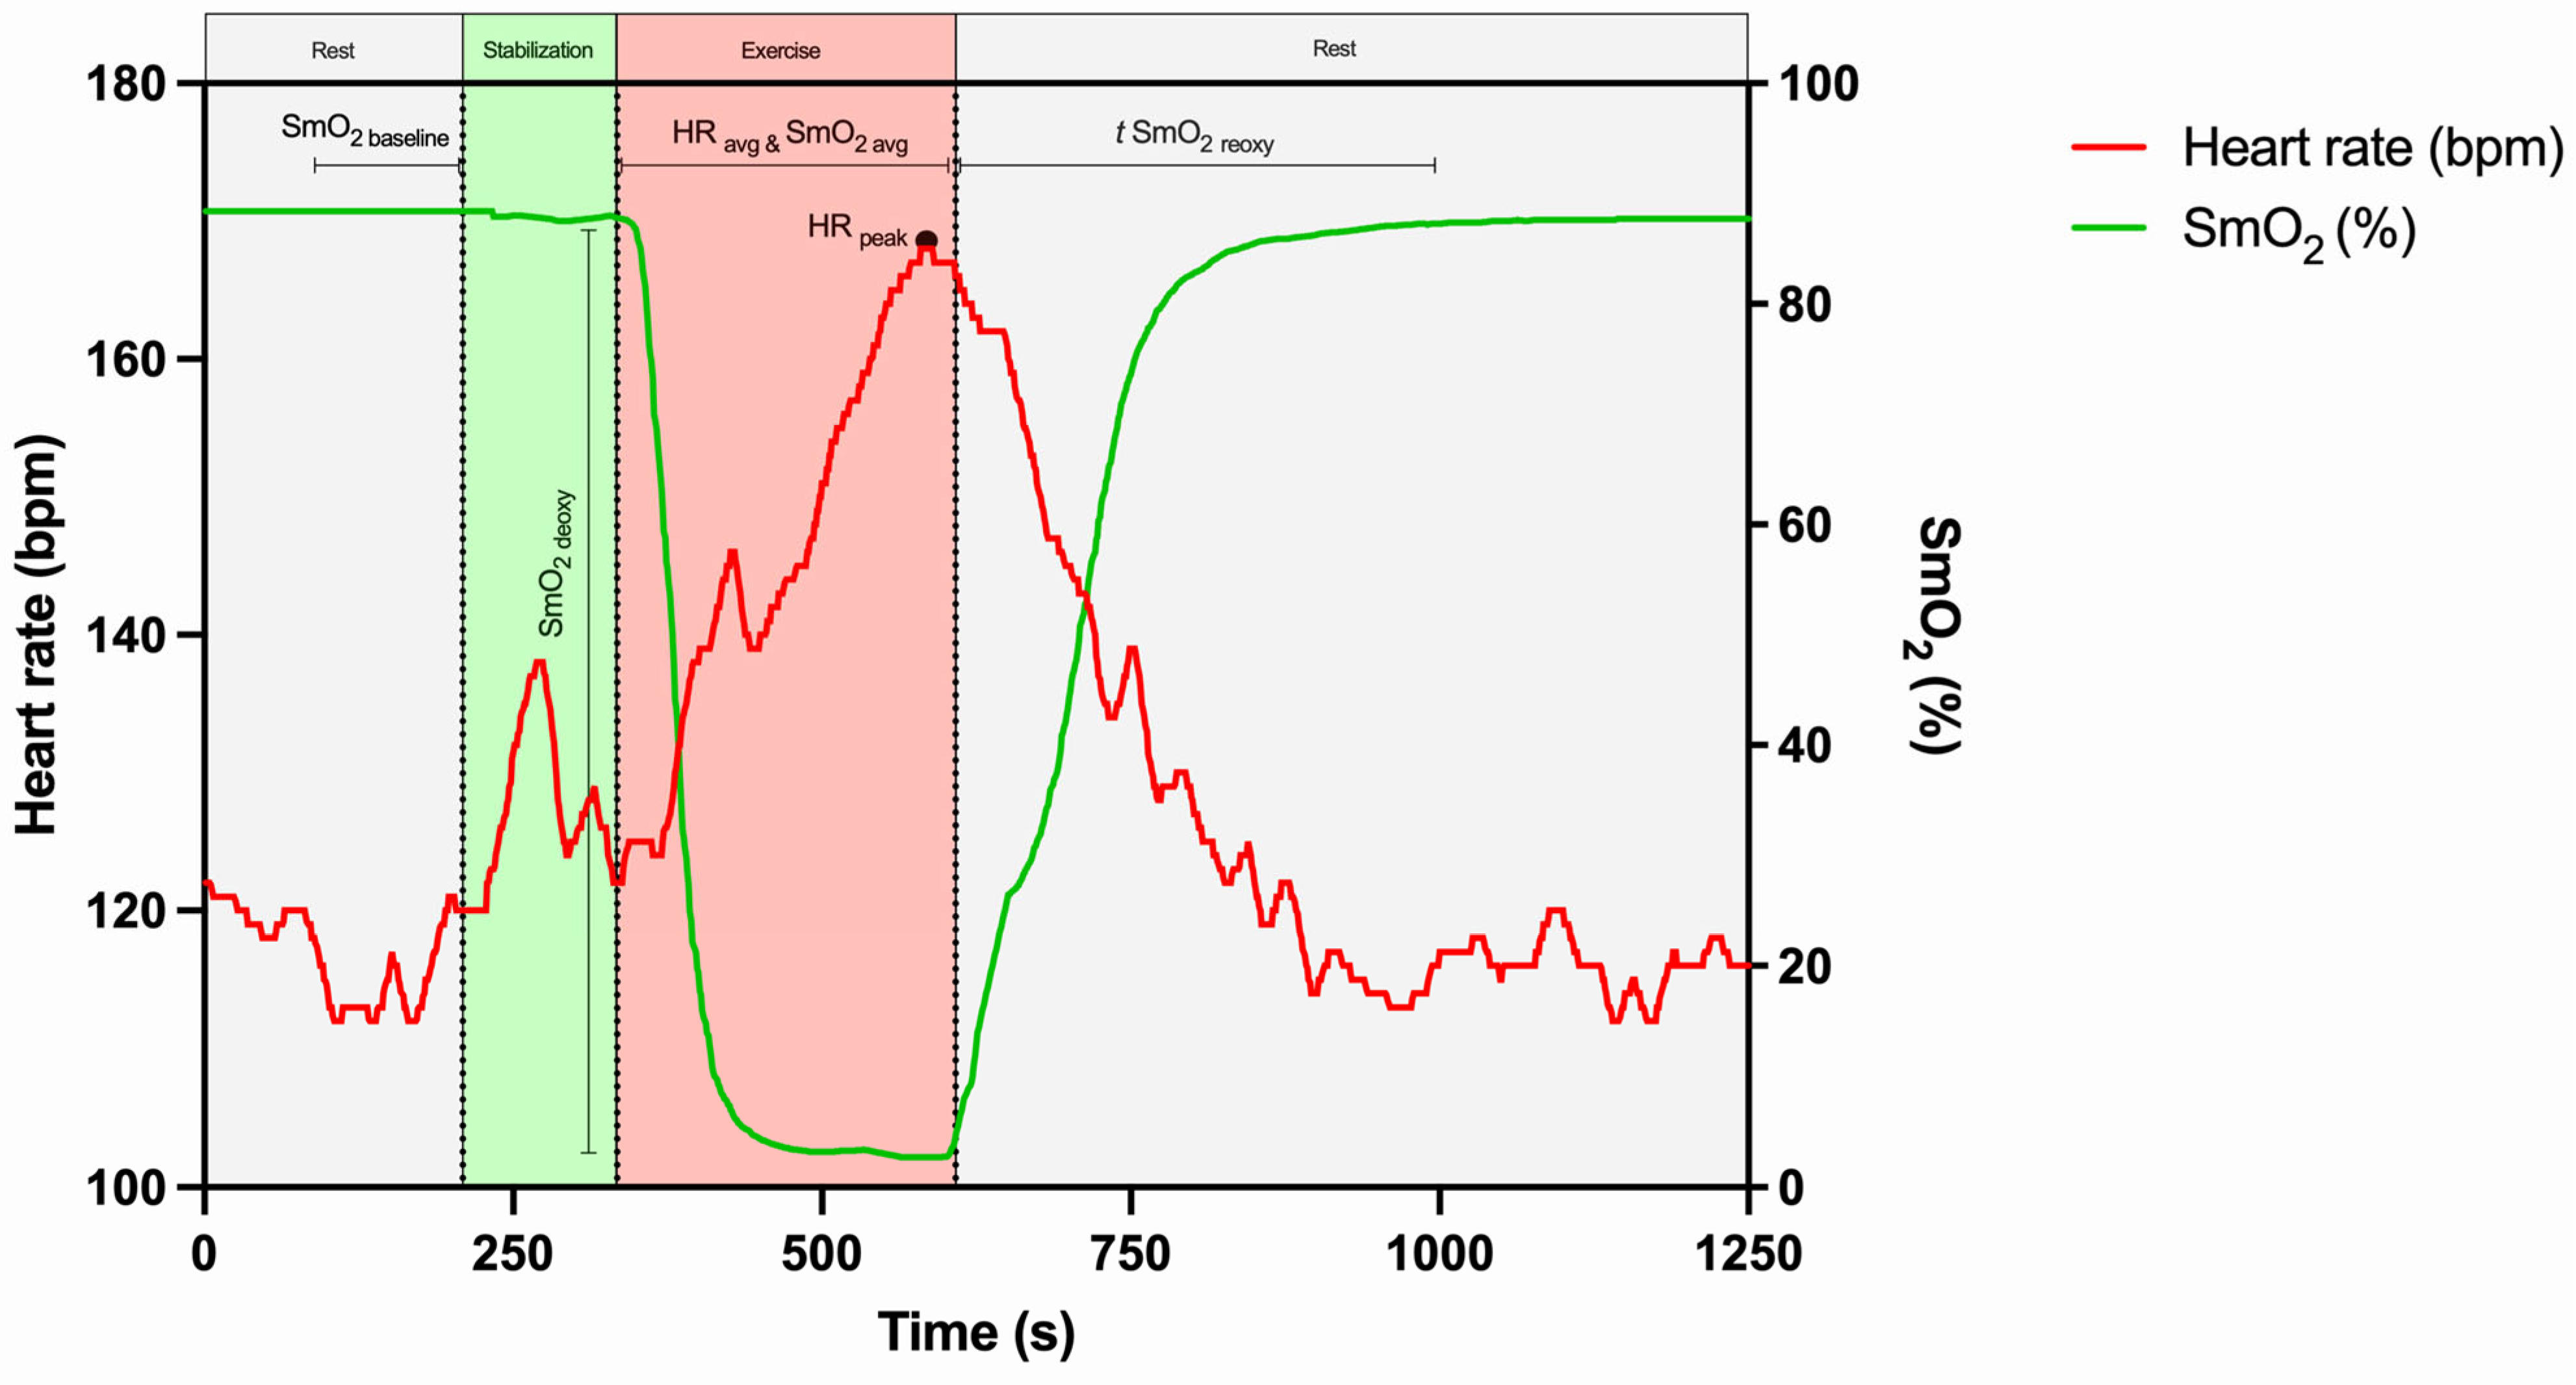
2.4.3. HR and SmO2 Parameters Assessment
2.4.4. Perceived Exertion (RPE)
2.5. Statistical Analysis
3. Results
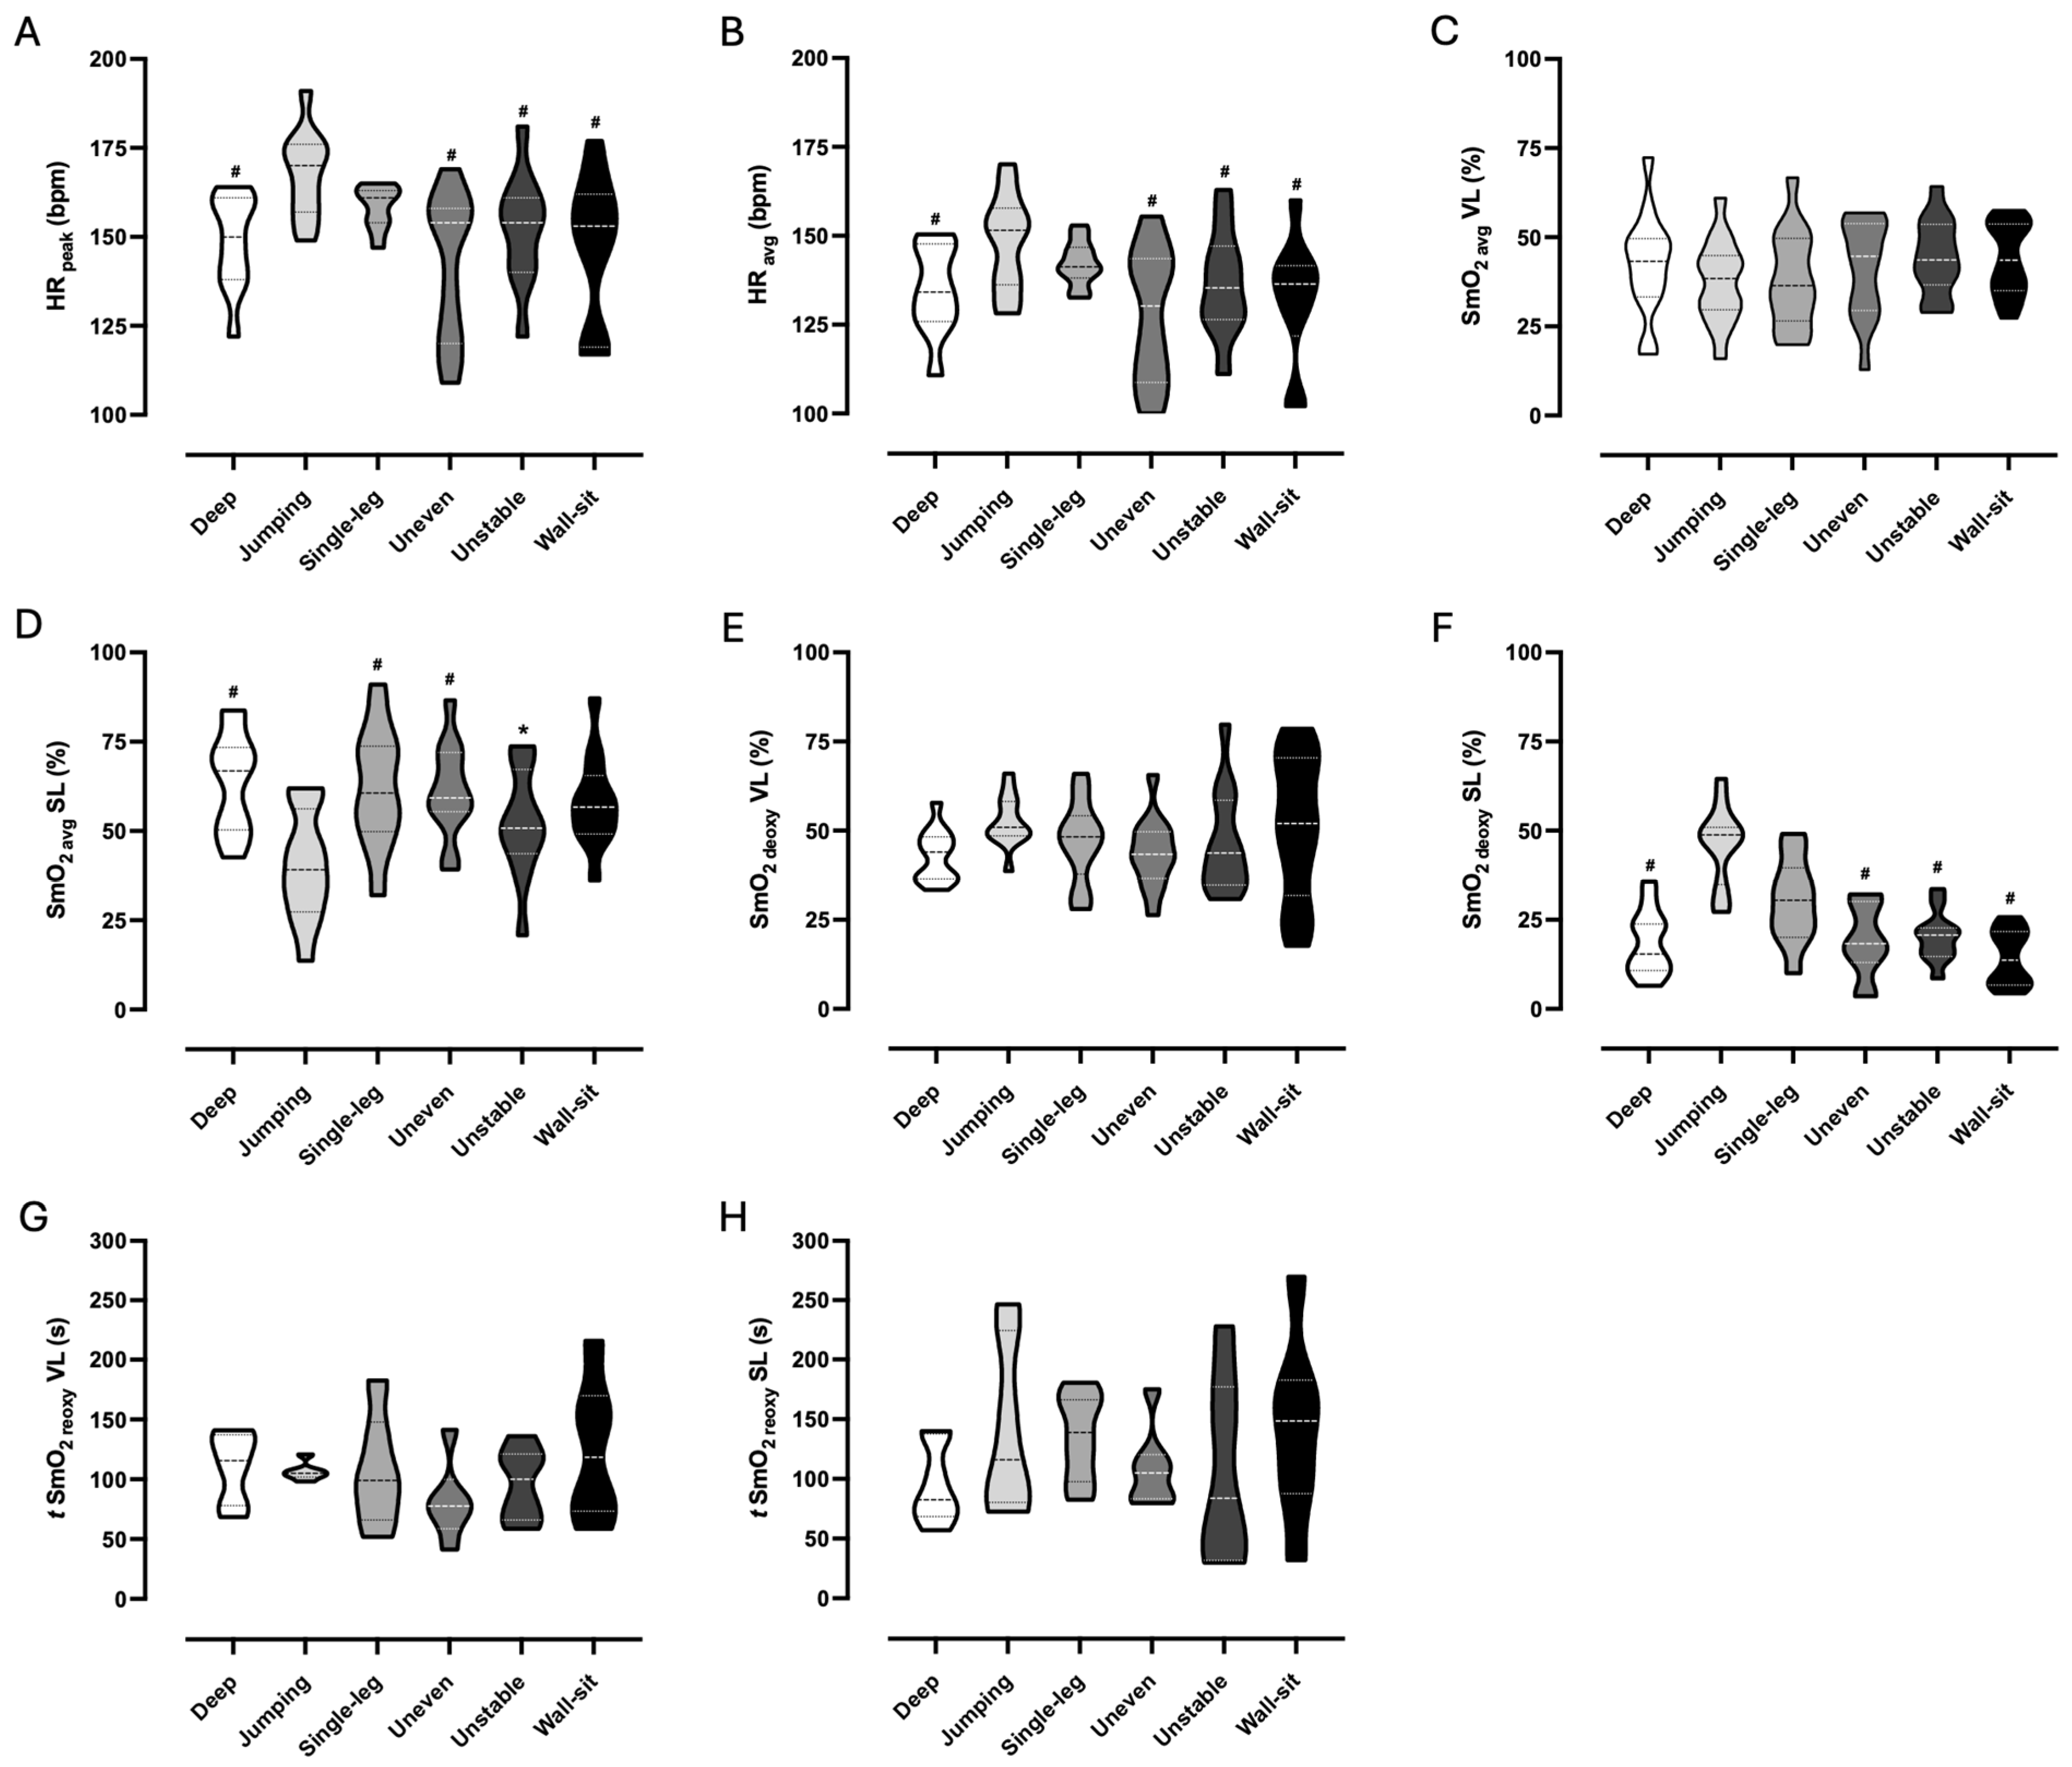
3.1. Physiological Responses
3.2. Perceptual Responses
4. Discussion
4.1. Physiological Responses
4.2. Perceptual Responses
4.3. Study Limitations and Future Research
5. Conclusions
Author Contributions
Funding
Institutional Review Board Statement
Informed Consent Statement
Data Availability Statement
Acknowledgments
Conflicts of Interest
Abbreviations
| BMI | Body mass index |
| HR | Heart rate |
| NIRS | Near-infrared spectroscopy sensor |
| RPE | Rate of perceived exertion |
| SL | Soleus muscle |
| SmO2 | Muscle oxygen saturation |
| VL | Vastus lateralis muscle |
References
- Soligard, T.; Schwellnus, M.; Alonso, J.; Bahr, R.; Clarsen, B.; Dijkstra, H.; Gabbett, T.; Gleeson, M.; Hägglund, M.; Hutcjinson, M.; et al. How much is too much? (Part 1) International Olympic Committee consensus statement on load in sport and risk of injury. Br. J. Sports Med. 2016, 50, 1030–1041. [Google Scholar] [CrossRef] [PubMed]
- De Fazio, R.; Mastronardi, V.M.; De Vittorio, M.; Visconti, P. Wearable Sensors and Smart Devices to Monitor Rehabilitation Parameters and Sports Performance: An Overview. Sensors 2023, 23, 1856. [Google Scholar] [CrossRef]
- Seshadri, D.R.; Li, R.T.; Voos, J.E.; Rowbottom, J.; Alfes, C.; Zorman, C.; Drummond, C. Wearable sensors for monitoring the physiological and biochemical profile of the athlete. Npj Digit. Med. 2019, 2, 72. [Google Scholar] [CrossRef]
- Bourdon, P.C.; Cardinale, M.; Murray, A.; Gastin, P.; Kellmann, M.; Varley, M.; Gabbett, T.; Burgess, D.; Gregson, W.; Cable, N. Monitoring Athlete Training Loads: Consensus Statement. Int. J. Sports Physiol. Perform. 2017, 12 (Suppl. S2), S2161–S2170. [Google Scholar] [CrossRef]
- Castillo, D.; Weston, M.; McLaren, S.J.; Cámara, J.; Yanci, J. Relationships Between Internal and External Match-Load Indicators in Soccer Match Officials. Int. J. Sports Physiol. Perform. 2017, 12, 922–927. [Google Scholar] [CrossRef]
- Strath, S.J.; Swartz, A.M.; Bassett, D.R.; O’Brien, W.; Ainsworth, B. Evaluation of heart rate as a method for assessing moderate intensity physical activity. Med. Sci. Sports Exerc. 2000, 32, S465–S470. [Google Scholar] [CrossRef] [PubMed]
- Ferrari, M.; Muthalib, M.; Quaresima, V. The use of near-infrared spectroscopy in understanding skeletal muscle physiology: Recent developments. Philos. Trans. R. Soc. A Math. Phys. Eng. Sci. 2011, 369, 4577–4590. [Google Scholar] [CrossRef]
- Morishita, S.; Tsubaki, A.; Takabayashi, T.; Fu, J.B. Relationship Between the Rating of Perceived Exertion Scale and the Load Intensity of Resistance Training. Strength Cond. J. 2018, 40, 94–109. [Google Scholar] [CrossRef] [PubMed]
- Selye, H. The Stress of Life; McGraw Hill Publ.: New York, NY, USA, 1956; pp. 12–38. [Google Scholar]
- Iversen, V.M.; Norum, M.; Schoenfeld, B.J.; Fimland, M.S. No Time to Lift? Designing Time-Efficient Training Programs for Strength and Hypertrophy: A Narrative Review. Sports Med. 2021, 51, 2079–2095. [Google Scholar] [CrossRef]
- Schoenfeld, B.J. Squatting Kinematics and Kinetics and Their Application to Exercise Performance. J. Strength Cond. Res. 2010, 24, 3497–3506. [Google Scholar] [CrossRef]
- Lorenzetti, S.; Ostermann, M.; Zeidler, F.; Zimmer, P.; Jentsch, L.; List, R.; Taylor, W.; Schellenberg, F. How to squat? Effects of various stance widths, foot placement angles and level of experience on knee, hip and trunk motion and loading. BMC Sports Sci. Med. Rehabil. 2018, 10, 14. [Google Scholar] [CrossRef] [PubMed]
- Shields, R.K.; Madhavan, S.; Gregg, E.; Leitch, J.; Petersen, B.; Salata, S.; Wallerich, S. Neuromuscular Control of the Knee during a Resisted Single-Limb Squat Exercise. Am. J. Sports Med. 2005, 33, 1520–1526. [Google Scholar] [CrossRef] [PubMed]
- Neto, W.K.; Soares, E.G.; Vieira, T.L.; Aguiar, R.; Chola, T.; Sampaio, V.; Gama, E. Gluteus Maximus Activation during Common Strength and Hypertrophy Exercises: A Systematic Review. J. Sports Sci. Med. 2020, 19, 195–203. [Google Scholar]
- Caterisano, A.; Moss, R.F.; Pellinger, T.K.; Woodruff, K.; Lewis, V.; Booth, W.; Khadra, T. The Effect of Back Squat Depth on the EMG Activity of 4 Superficial Hip and Thigh Muscles. J. Strength Cond. Res. 2002, 16, 428–432. [Google Scholar]
- Baker, D. Improving Vertical Jump Performance Through General, Special, and Specific Strength Training: A Brief Review. J. Strength Cond. Res. 1996, 10, 131–136. [Google Scholar] [CrossRef]
- Lee, J.; Kim, S.; Heo, J.; Park, D.; Chang, E. Differences in the muscle activities of the quadriceps femoris and hamstrings while performing various squat exercises. BMC Sports Sci. Med. Rehabil. 2022, 14, 12. [Google Scholar] [CrossRef]
- Gibson, A.L.; Wagner, D.R.; Heyward, V.H. Advanced Fitness Assessment and Exercise Prescription, 4th ed.; Human Kinetics: Champaign, IL, USA, 2024. [Google Scholar]
- World Health Organization. Guidelines on Physical Activity and Sedentary Behaviour; World Health Organization: Geneva, Switzerland, 2020. [Google Scholar]
- Feldmann, A.; Schmitz, R.; Erlacher, D. Near-infrared spectroscopy-derived muscle oxygen saturation on a 0% to 100% scale: Reliability and validity of the Moxy Monitor. J. Biomed. Opt. 2019, 24, 115001. [Google Scholar] [CrossRef]
- American College of Sports Medicine. ACSM’s Guidelines for Exercise Testing and Prescription, 11th ed.; Wolters Kluwer: Alphen aan den Rijn, The Netherlands, 2021. [Google Scholar]
- Lagally, K.M.; Costigan, E.M. Anchoring procedures in reliability of ratings of perceived exertion during resistance exercise. Percept. Mot. Ski. 2004, 98, 1285–1295. [Google Scholar] [CrossRef] [PubMed]
- Noble, B.J.; Robertson, R.J. Perceived Exertion; Human Kinetics: Champaign, IL, USA, 1996. [Google Scholar]
- SENIAM Recommendations for Sensor Locations on Individual Muscles. Available online: http://seniam.org/sensor_location.htm (accessed on 12 April 2023).
- Borg, G. Perceived exertion as an indicator of somatic stress. Scand. J. Rehabil. Med. 1970, 2, 92–98. [Google Scholar] [CrossRef]
- Cohen, J. Statistical Power Analysis for the Behavioral Sciences, 2nd ed.; L. Erlbaum Associates: Mahwah, NJ, USA, 1988. [Google Scholar]
- Kluess, H.A.; Wood, R.H.; Welsch, M.A. Vagal modulation of the heart and central hemodynamics during handgrip exercise. Am. J. Physiol.-Heart Circ. Physiol. 2000, 278, H1648–H1652. [Google Scholar] [CrossRef]
- Fu, Q.; Levine, B.D. Exercise and the autonomic nervous system. Handb. Clin. Neurol. 2013, 117, 147–160. [Google Scholar] [CrossRef]
- Powers, S.K.; Howley, E.T. Exercise Physiology: Theory and Application to Fitness and Performance, 4th ed.; McGraw-Hill Higher Education: New York, NY, USA, 2000. [Google Scholar]
- Hong, S.; Oh, M.; Oh, C.; Lee, H.; Suh, S.; Park, H.; Lalande, S.; Tanaka, H.; Jeon, J.Y. Cardiorespiratory and aerobic demands of squat exercise. Sci. Rep. 2024, 14, 68187. [Google Scholar] [CrossRef]
- Tanimoto, M.; Ishii, N. Effects of low-intensity resistance exercise with slow movement and tonic force generation on muscular function in young men. J. Appl. Physiol. 2006, 100, 1150–1157. [Google Scholar] [CrossRef] [PubMed]
- Miura, H.; McCully, K.; Nioka, S.; Chance, B. Relationship between muscle architectural features and oxygenation status determined by near infrared device. Eur. J. Appl. Physiol. 2004, 91, 273–278. [Google Scholar] [CrossRef]
- Azuma, K.; Homma, S.; Kagaya, A. Oxygen supply-consumption balance in the thigh muscles during exhausting knee-extension exercise. J. Biomed. Opt. 2000, 5, 97–101. [Google Scholar] [CrossRef] [PubMed]
- Santarém, D.; Machado, I.; Sampaio, J.; Abrantes, C. Comparing the effects of dynamic and holding isometric contractions on cardiovascular, perceptual, and near-infrared spectroscopy parameters: A pilot study. PLoS ONE 2023, 18, e0281885. [Google Scholar] [CrossRef]
- Davis, P.R.; Yakel, J.P.; Anderson, J.F. Muscle Oxygen Demands of the Vastus Lateralis in Back and Front Squats. Int. J. Exerc. Sci. 2020, 13, 734–743. [Google Scholar]
- Gómez-Carmona, C.D.; Bastida-Castillo, A.; Rojas-Valverde, D.; Sánchez, E.; García-Rubio, J.; Ibáñez, S.; Pino-Ortega, J. Lower-limb Dynamics of Muscle Oxygen Saturation During the Back-squat Exercise: Effects of Training Load and Effort Level. J. Strength Cond. Res. 2020, 34, 1227–1236. [Google Scholar] [CrossRef]
- Manchado-Gobatto, F.B.; Marostegan, A.B.; Rasteiro, F.M.; Cirino, C.; Cruz, J.P.; Moreno, M.A.; Gobatto, C.A. New insights into mechanical, metabolic and muscle oxygenation signals during and after high-intensity tethered running. Sci. Rep. 2020, 10, 63297. [Google Scholar] [CrossRef]
- Shiroishi, K.; Kime, R.; Osada, T.; Murase, N.; Shimomura, K.; Katsumura, T. Decreased muscle oxygenation and increased arterial blood flow in the non-exercising limb during leg exercise. In Oxygen Transport to Tissue XXXI. Advances in Experimental Medicine and Biology; Springer: Boston, MA, USA, 2009; pp. 379–384. [Google Scholar] [CrossRef]
- Buchheit, M.; Ufland, P. Effect of endurance training on performance and muscle reoxygenation rate during repeated-sprint running. Eur. J. Appl. Physiol. 2011, 111, 293–301. [Google Scholar] [CrossRef]
- Jones, B.; Hamilton, D.K.; Cooper, C.E. Muscle Oxygen Changes following Sprint Interval Cycling Training in Elite Field Hockey Players. PLoS ONE 2015, 10, e0120338. [Google Scholar] [CrossRef]
- Ryan, T.E.; Southern, W.M.; Reynolds, M.A.; McCully, K.K. A cross-validation of near-infrared spectroscopy measurements of skeletal muscle oxidative capacity with phosphorus magnetic resonance spectroscopy. J. Appl. Physiol. 2013, 115, 1757–1766. [Google Scholar] [CrossRef]
- Fortin, J.; Billaut, F. Blood-Flow Restricted Warm-Up Alters Muscle Hemodynamics and Oxygenation during Repeated Sprints in American Football Players. Sports 2019, 7, 121. [Google Scholar] [CrossRef]
- Vasquez-Bonilla, A.A.; Camacho-Cardeñosa, A.; Timón, R.; Martínez-Guardado, I.; Camacho-Cardeñosa, M.; Olcina, G. Muscle Oxygen Desaturation and Re-Saturation Capacity Limits in Repeated Sprint Ability Performance in Women Soccer Players: A New Physiological Interpretation. Int. J. Environ. Res. Public Health 2021, 18, 3484. [Google Scholar] [CrossRef] [PubMed]
- Pandolf, K.B.; Burse, R.L.; Goldman, R.F. Differentiated Ratings of Perceived Exertion during Physical Conditioning of Older Individuals Using Leg-Weight Loading. Percept. Mot. Ski. 1975, 40, 563–574. [Google Scholar] [CrossRef]
- Hollander, D.B.; Durand, R.J.; Trynicki, J.L.; Larock, D.; Castracane, V.D.; Hebert, E.P.; Kraemer, R.R. RPE, pain, and physiological adjustment to concentric and eccentric contractions. Med. Sci. Sports Exerc. 2003, 35, 1017–1025. [Google Scholar] [CrossRef] [PubMed]
- Miller, P.C.; Hall, E.E.; Chmelo, E.A.; Morrison, J.M.; DeWitt, R.E.; Kostura, C.M. The influence of muscle action on heart rate, RPE, and affective responses after Upper-Body Resistance exercise. J. Strength Cond. Res. 2009, 23, 366–372. [Google Scholar] [CrossRef]
- Baechle, T.R.; Earle, R.W. Essentials of Strength Training and Conditioning, 2nd ed.; Human Kinetics: Champaign, IL, USA, 2000. [Google Scholar]
- Sargeant, A.J.; Davies, C.T. Perceived exertion during rhythmic exercise involving different muscle masses. J. Hum. Ergol. 1973, 2, 3–11. [Google Scholar]
- Matos-Santos, L.; Farinatti, P.; Borges, J.P.; Massaferri, R.; Monteiro, W. Cardiovascular Responses to Resistance Exercise Performed with Large and Small Muscle Mass. Int. J. Sports Med. 2017, 38, 883–889. [Google Scholar] [CrossRef]
- McCloskey, D.E.; Gandevia, S.; Porter, E.K.; Colebatch, J.G. Muscle sense and effort: Motor commands and judgements about muscular contractions. Adv. Neurol. 1983, 39, 151–167. [Google Scholar]


| Variable | Mean ± Standard Deviation |
|---|---|
| Age (years) | 28.2 ± 8.0 |
| Height (m) | 1.73 ± 0.08 |
| Body mass (kg) | 71.1 ± 11.2 |
| BMI (kg·m−2) | 23.8 ± 2.8 |
| VL skinfold (mm) | 11.12 ± 3.97 |
| SL skinfold (mm) | 11.10 ± 3.94 |
| HR rest (bpm) | 75.0 ± 8.5 |
| SmO2 rest in VL (%) | 62.2 ± 14.3 |
| SmO2 rest in SL (%) | 54.5 ± 19.2 |
| Variables | Deep | Jumping | Single-Leg | Uneven | Unstable | Wall-Sit |
|---|---|---|---|---|---|---|
| Perception | ||||||
| RPE-O (a.u.) | 12.0 ± 0.8 # | 15.3 ± 0.9 | 12.3 ± 2.8 | 11.4 ± 1.8 # | 11.8 ± 1.8 # | 12.8 ± 2.8 |
| RPE-AM (a.u.) | 12.3 ± 1.7 # | 17.6 ± 1.7 | 15.9 ± 2.8 # | 12.9 ± 2.5 # | 14.6 ± 2.0 # | 12.6 ± 0.8 * |
Disclaimer/Publisher’s Note: The statements, opinions and data contained in all publications are solely those of the individual author(s) and contributor(s) and not of MDPI and/or the editor(s). MDPI and/or the editor(s) disclaim responsibility for any injury to people or property resulting from any ideas, methods, instructions or products referred to in the content. |
© 2025 by the authors. Licensee MDPI, Basel, Switzerland. This article is an open access article distributed under the terms and conditions of the Creative Commons Attribution (CC BY) license (https://creativecommons.org/licenses/by/4.0/).
Share and Cite
Santarém, D.; Teixeira, A.; Amaral, A.; Sampaio, J.; Abrantes, C. Acute Physiological and Perceptual Responses to Six Body-Weight Squat Exercise Variations. Sensors 2025, 25, 2018. https://doi.org/10.3390/s25072018
Santarém D, Teixeira A, Amaral A, Sampaio J, Abrantes C. Acute Physiological and Perceptual Responses to Six Body-Weight Squat Exercise Variations. Sensors. 2025; 25(7):2018. https://doi.org/10.3390/s25072018
Chicago/Turabian StyleSantarém, Daniel, Andreia Teixeira, António Amaral, Jaime Sampaio, and Catarina Abrantes. 2025. "Acute Physiological and Perceptual Responses to Six Body-Weight Squat Exercise Variations" Sensors 25, no. 7: 2018. https://doi.org/10.3390/s25072018
APA StyleSantarém, D., Teixeira, A., Amaral, A., Sampaio, J., & Abrantes, C. (2025). Acute Physiological and Perceptual Responses to Six Body-Weight Squat Exercise Variations. Sensors, 25(7), 2018. https://doi.org/10.3390/s25072018