

HYFF-CB: Hybrid Feature Fusion Visual Model for Cargo Boxes

 , ,
, ,
Abstract
1. Introduction
2. Research Status
2.1. Automatic Loading and Unloading Technology
2.2. CNN-Based Object Detection Algorithm
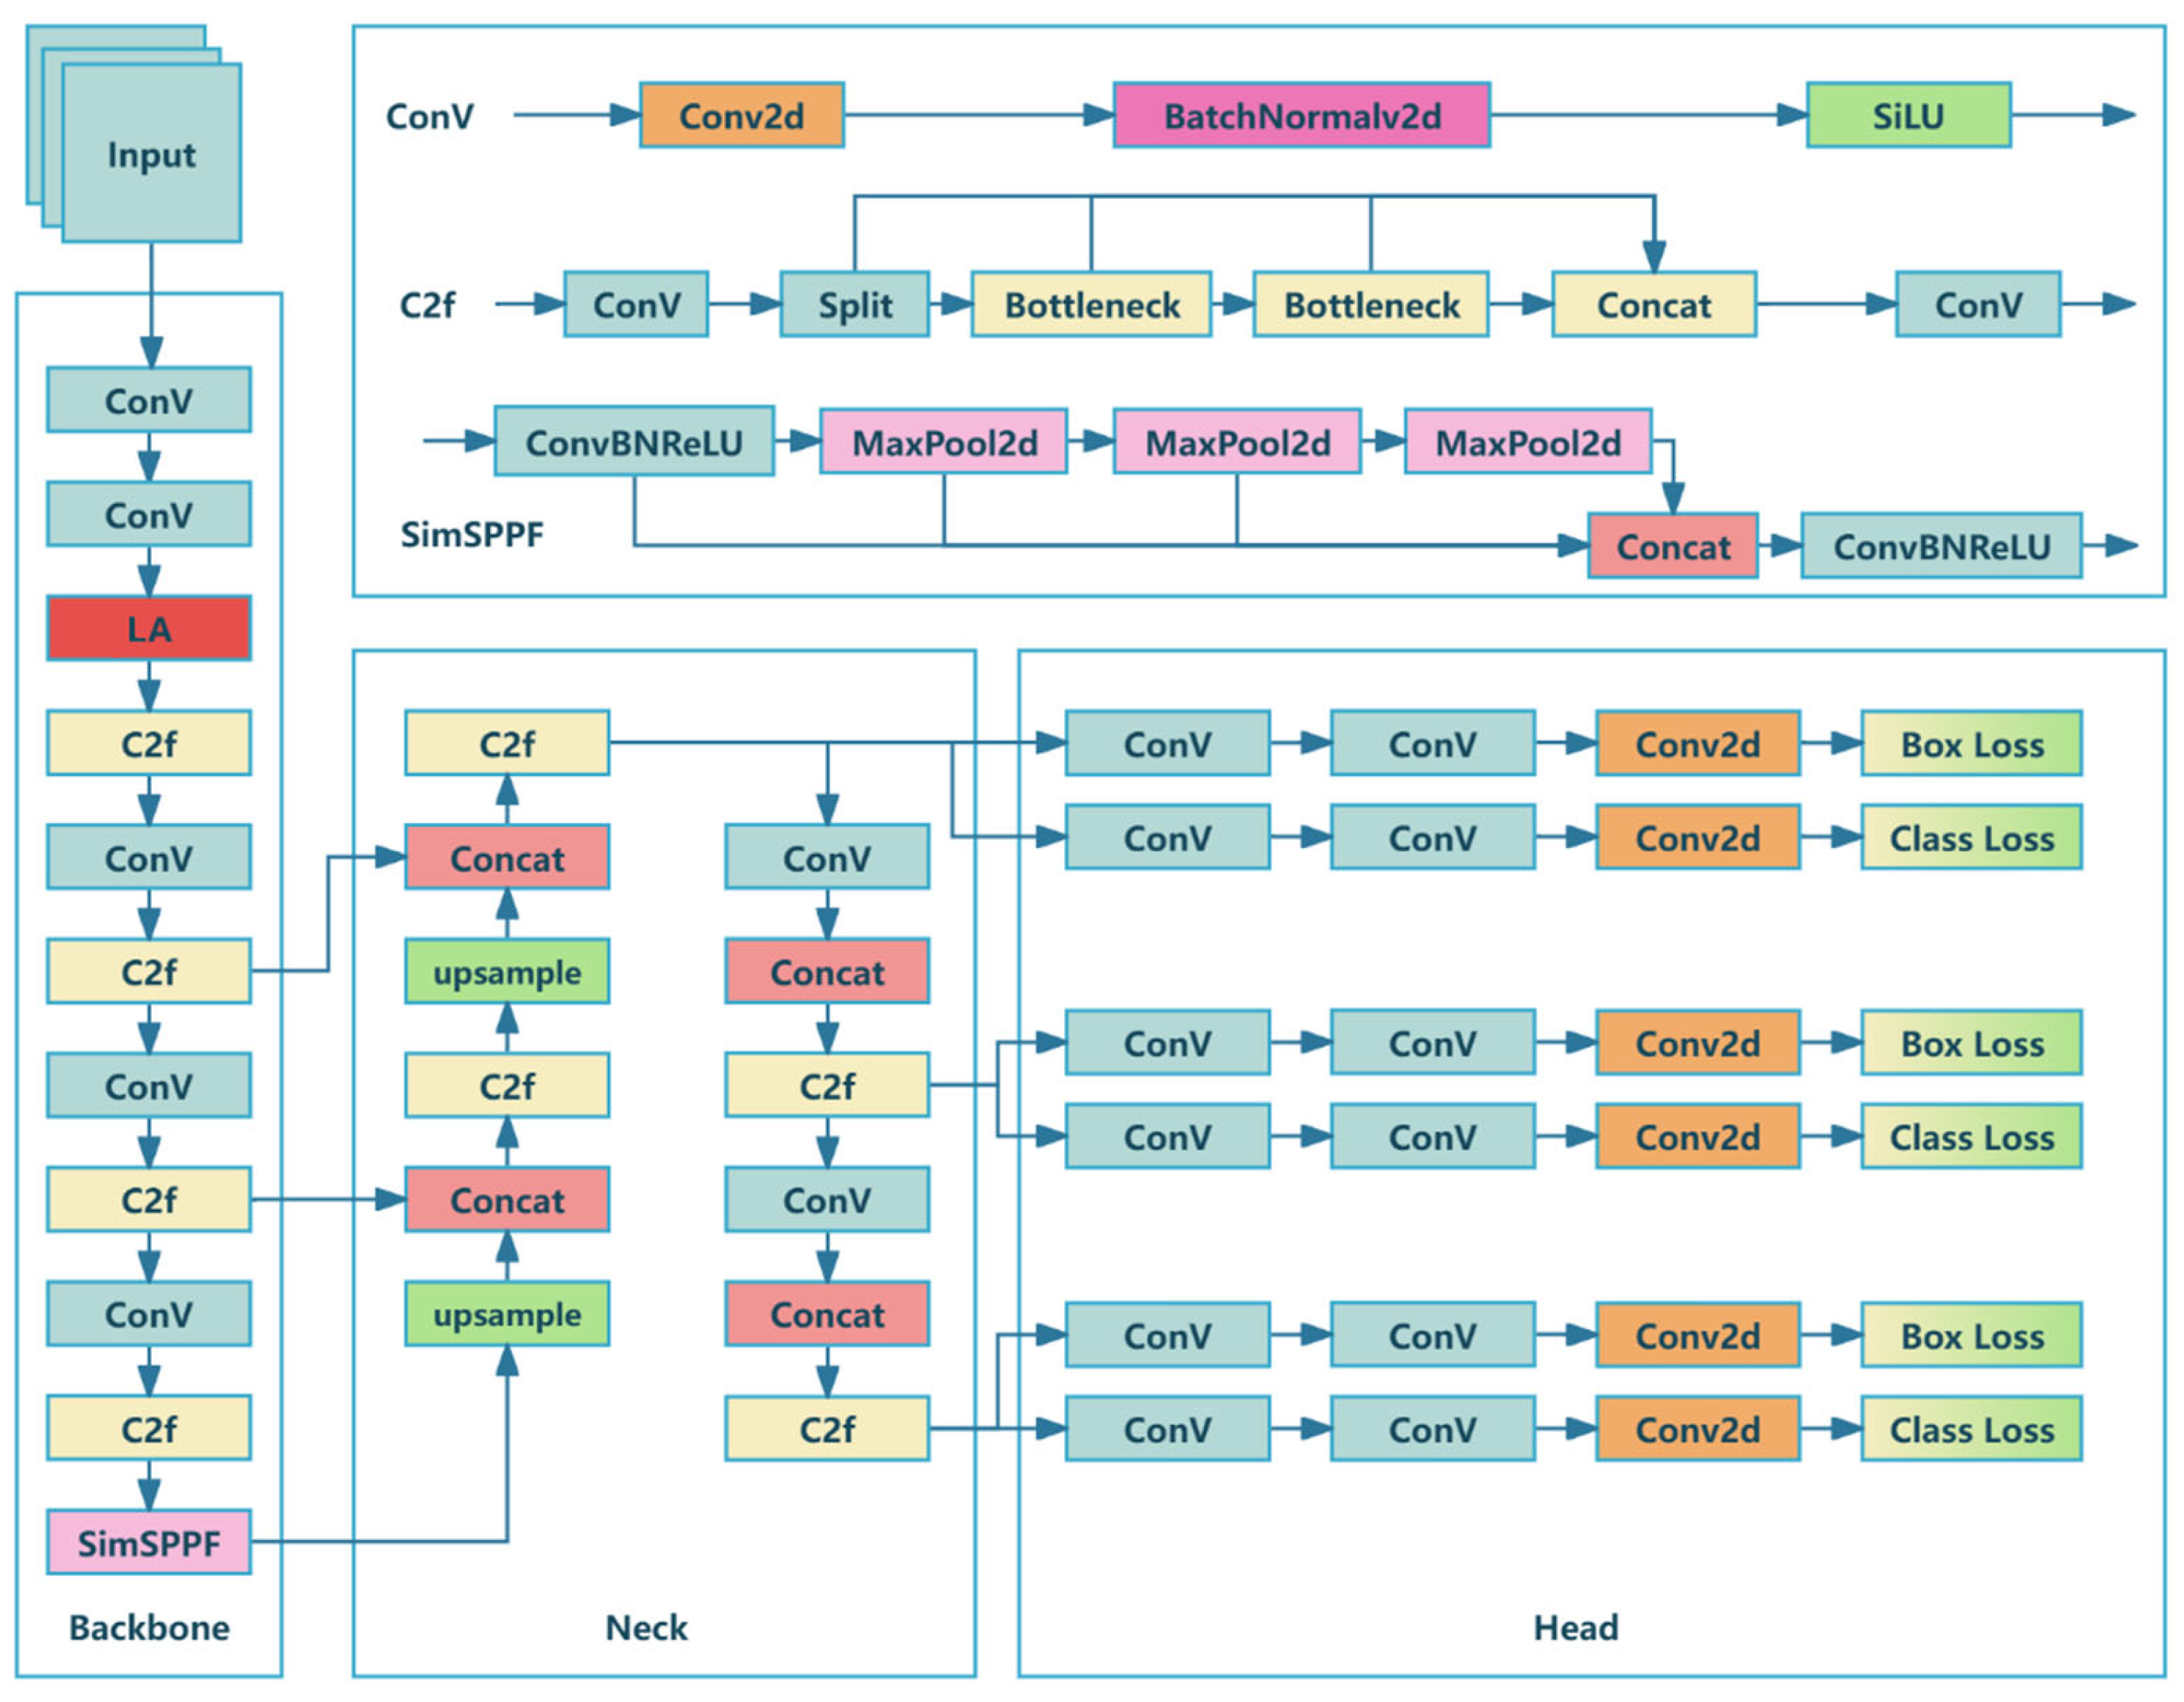
3. Methods
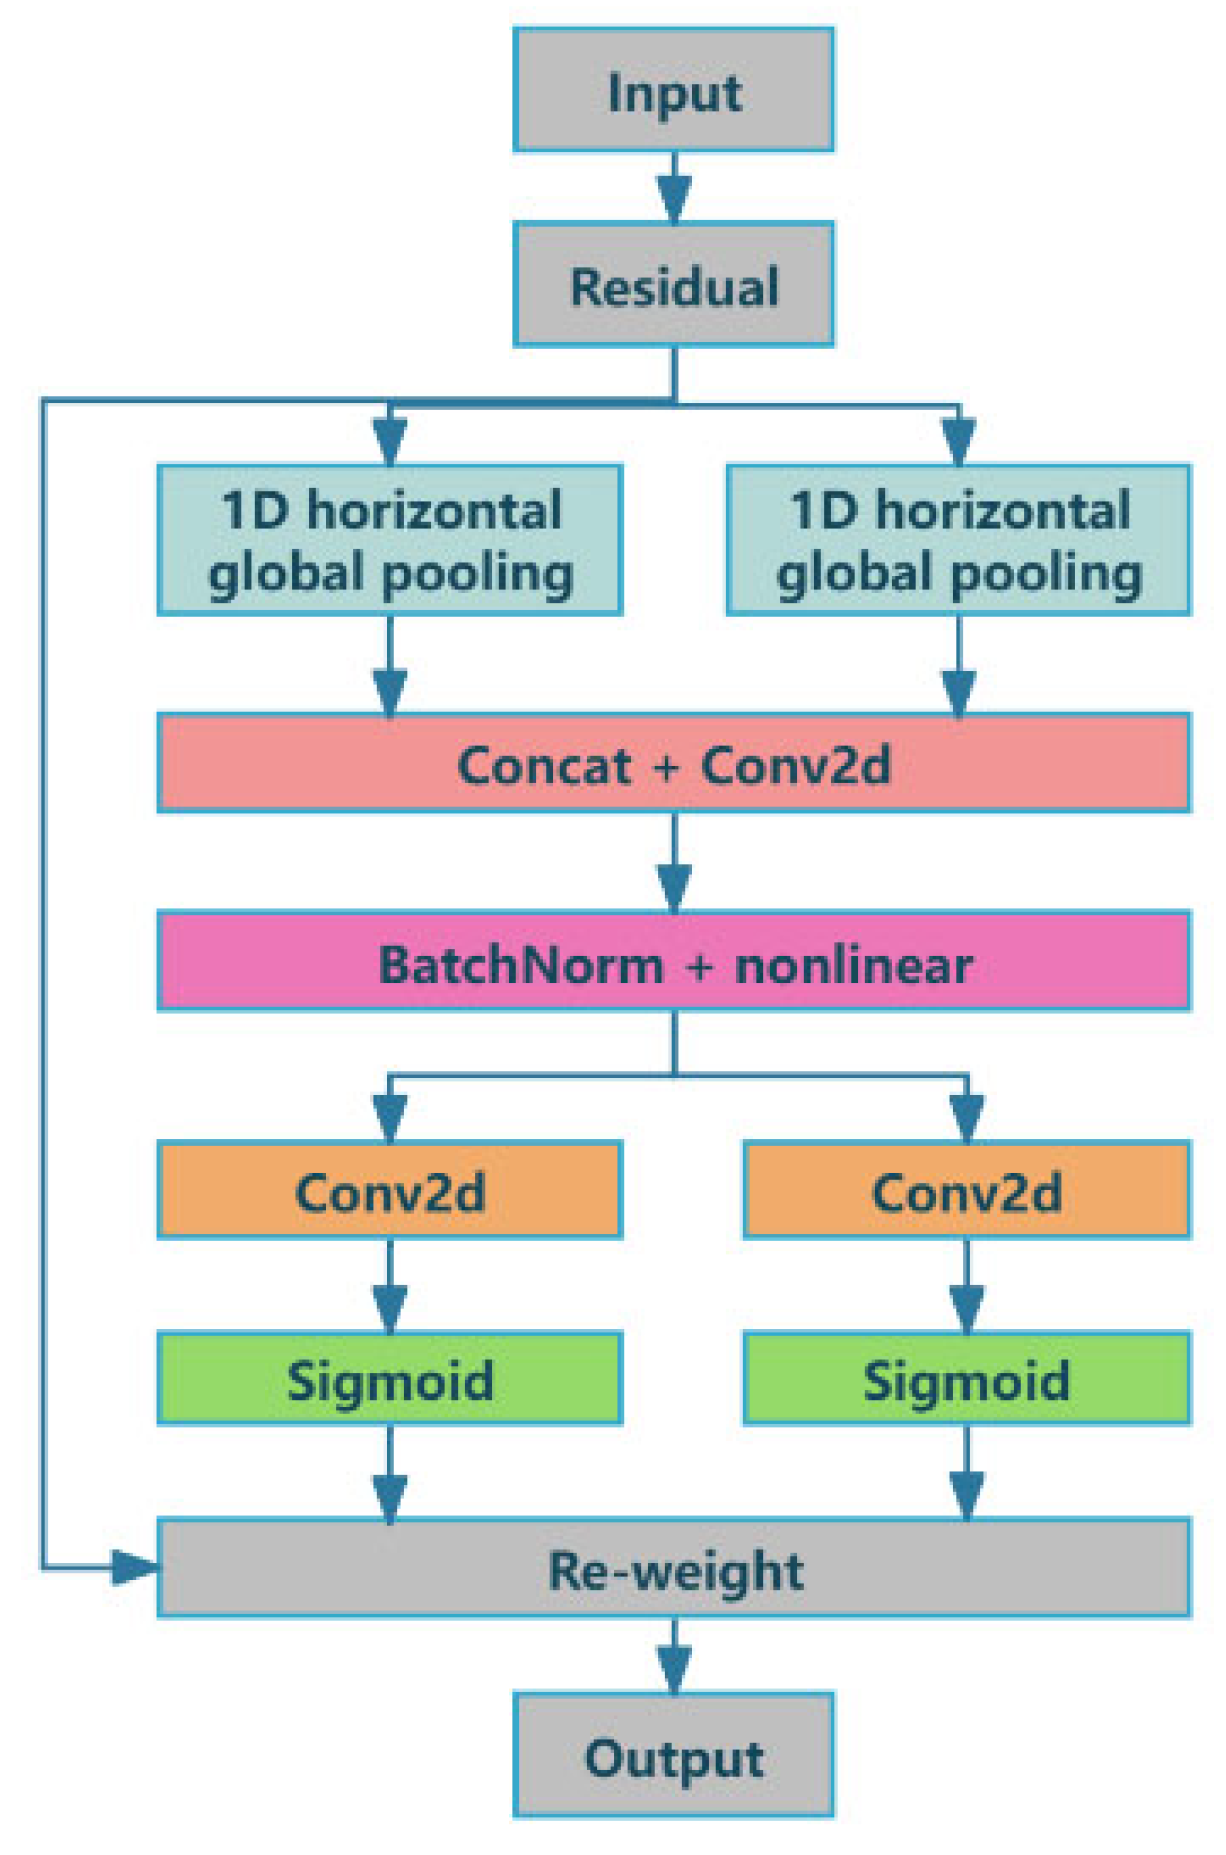
3.1. LA Mechanism
3.2. FEP
3.3. SW-Loss System
4. Experimental Results
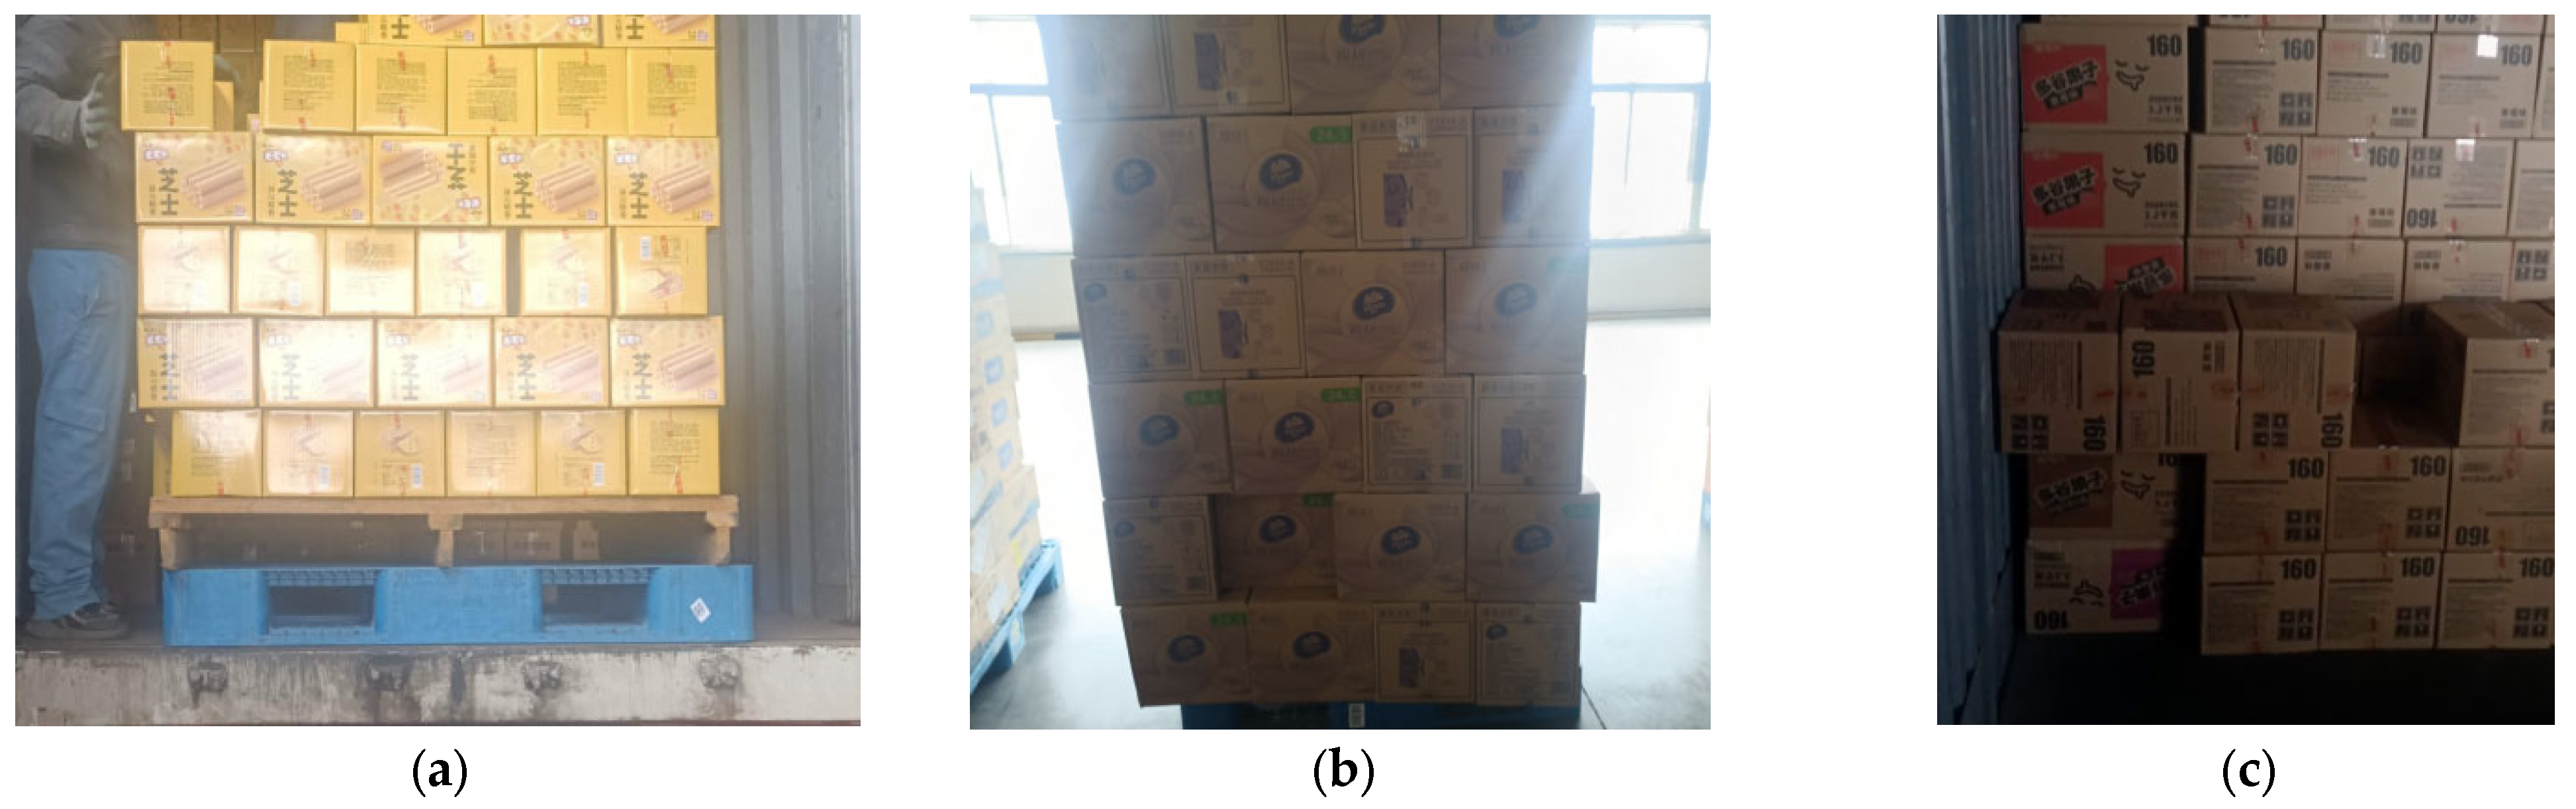
4.1. Dataset
- Images from various shooting angles, including images of boxes with varying degrees of blur and occlusion;
- Various lighting conditions, including natural light, artificial light, forward light, and backlight;
- Various weather conditions, such as sunny, cloudy, and rainy days;
- Various locations, including warehouses, trucks, and outdoor scenes.
4.2. Experimental Process and Evaluation Indicators
4.3. Ablation Experiment
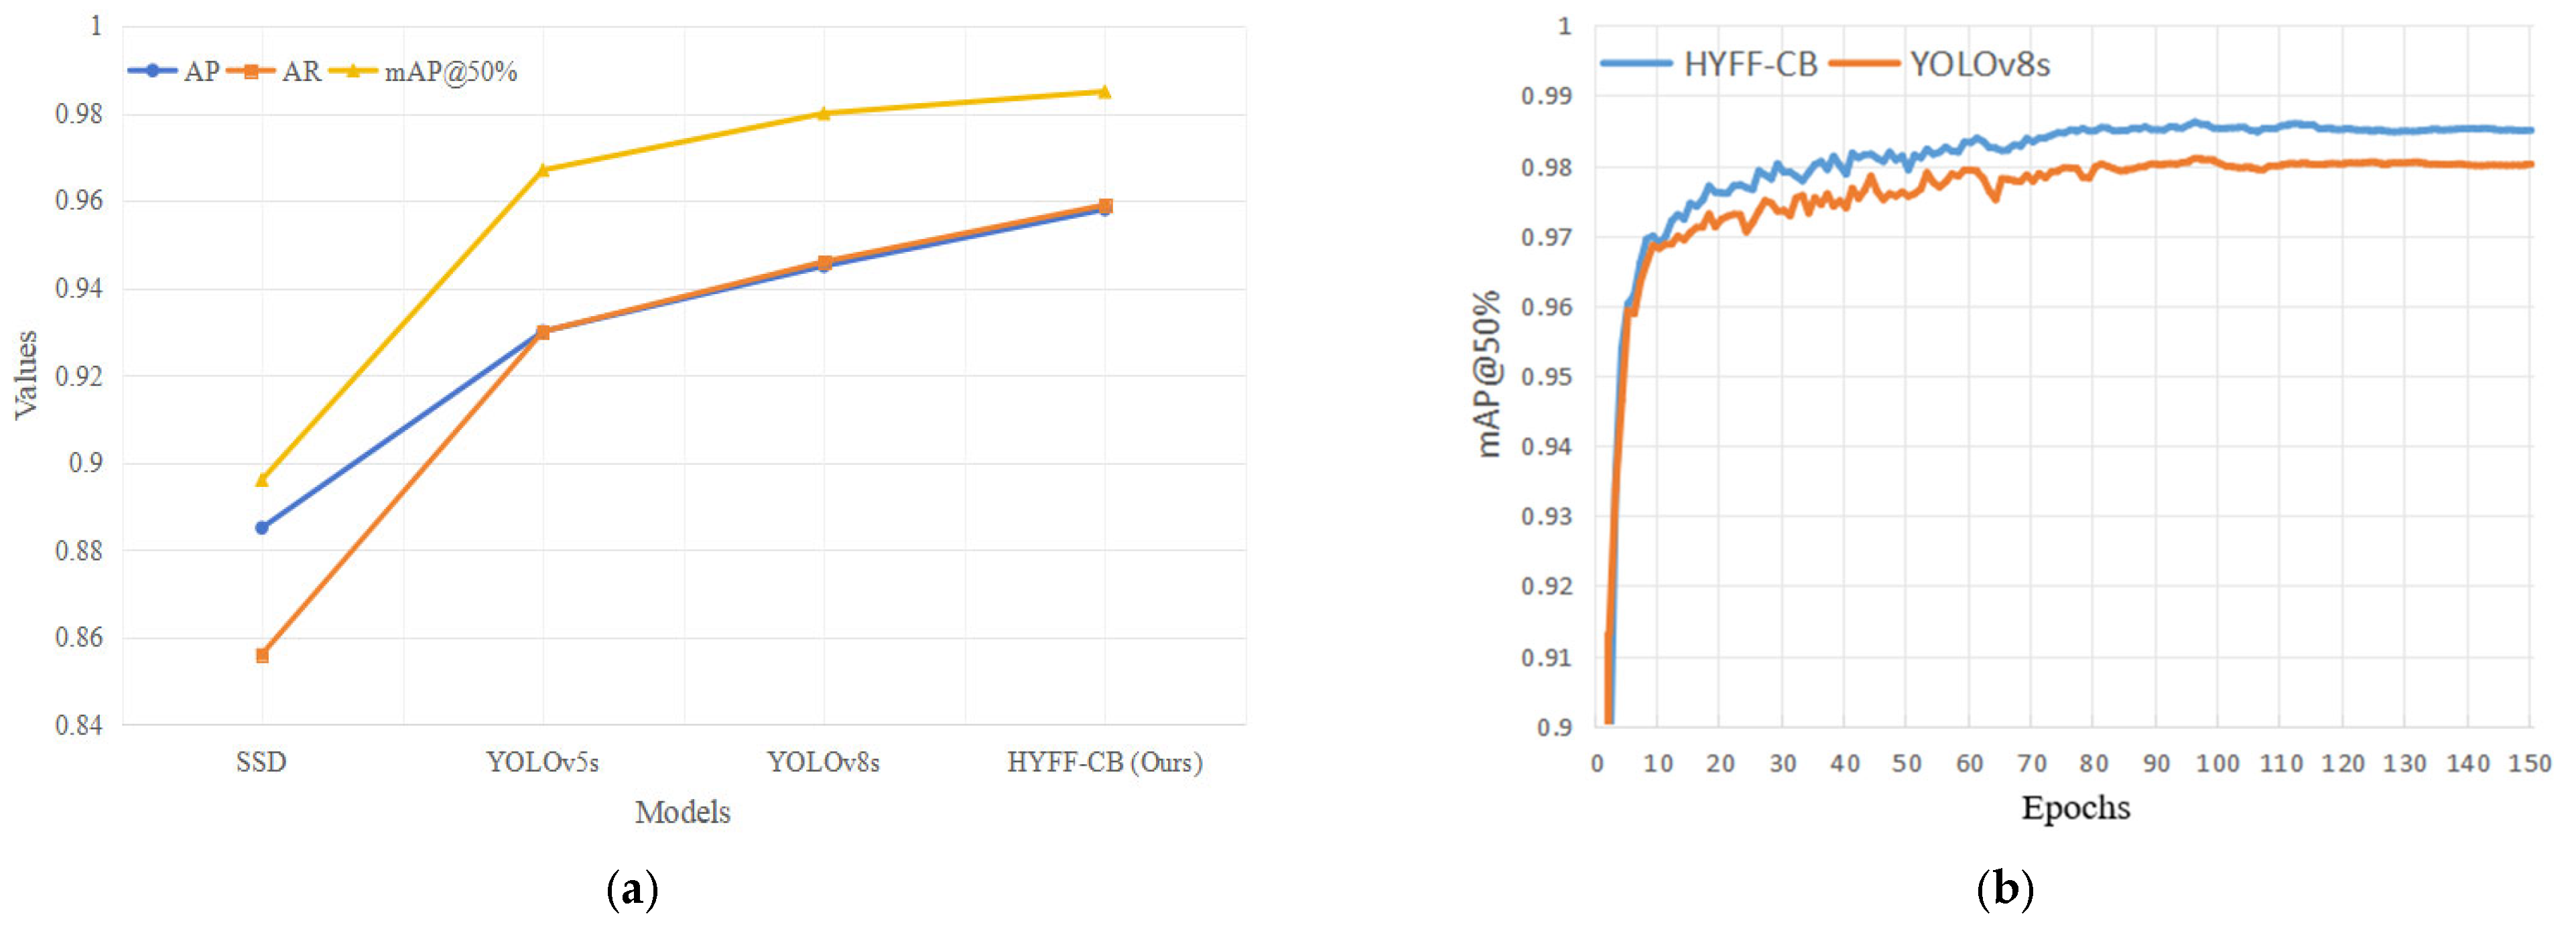
4.4. Comparative Experiment
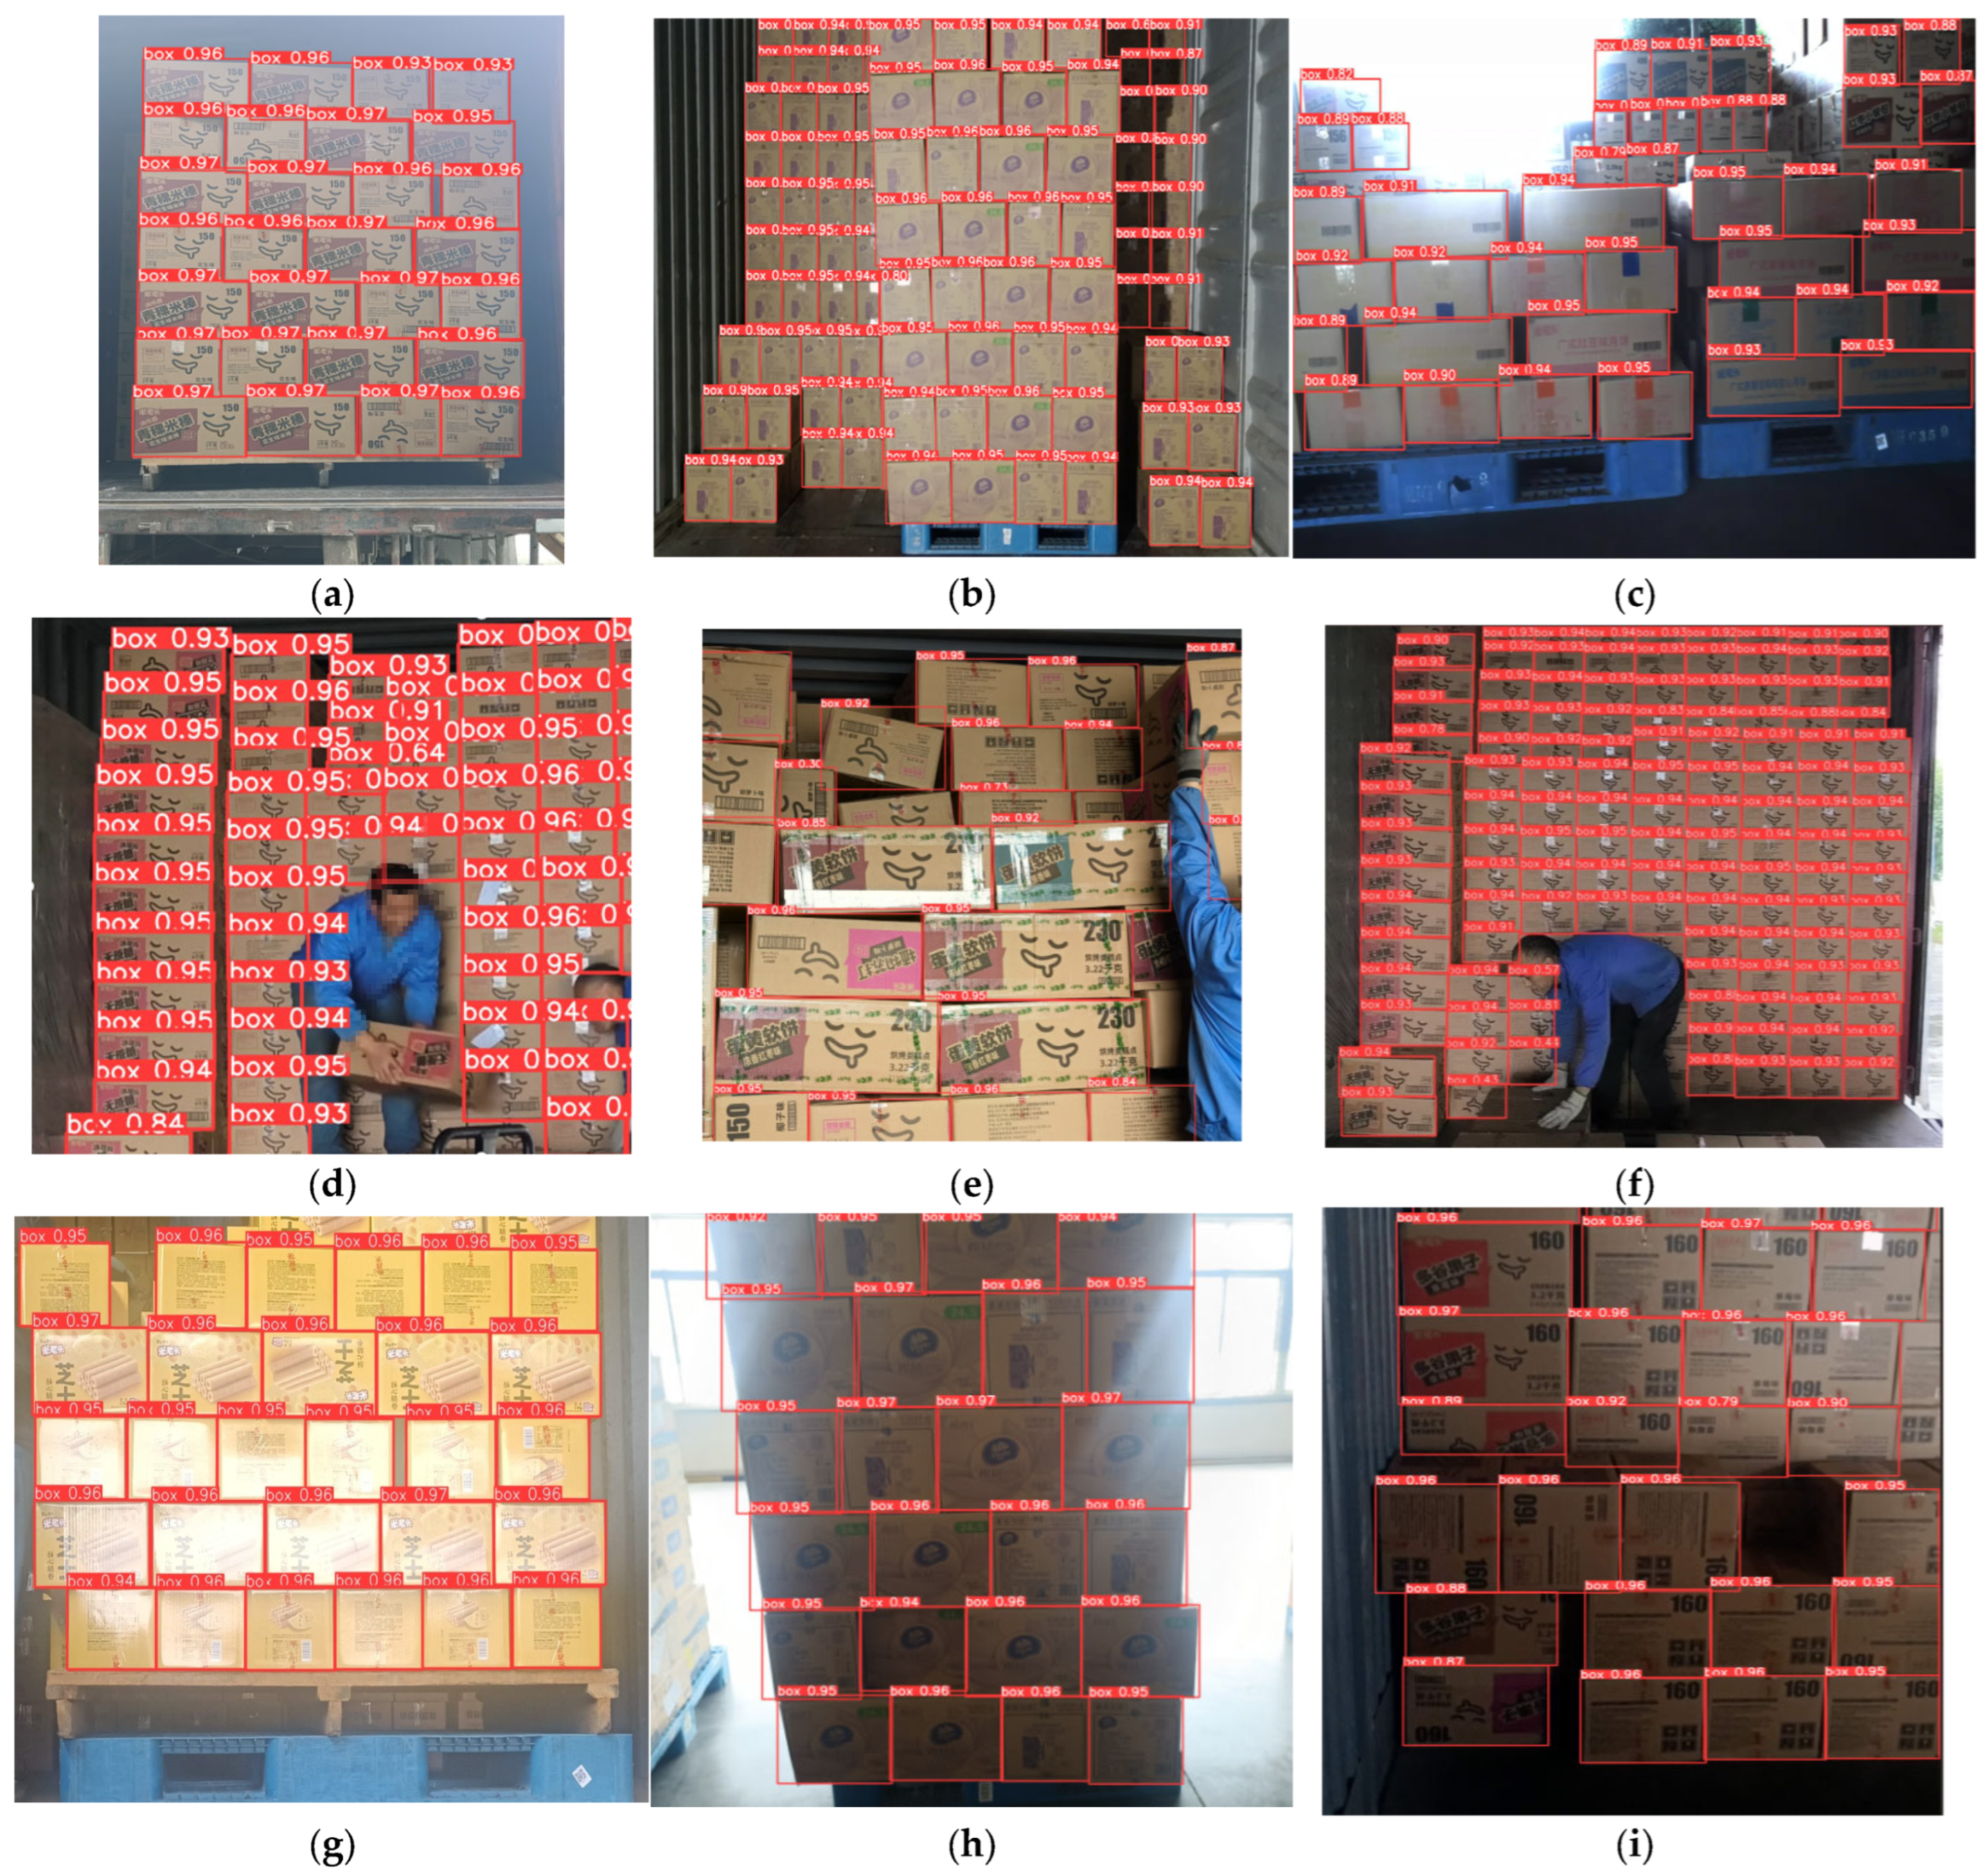
4.5. Validation of Actual Effect
5. Conclusions
Author Contributions
Funding
Institutional Review Board Statement
Informed Consent Statement
Data Availability Statement
Conflicts of Interest
References
- Oliver, R.K.; Webber, M.D. Supply-Chain Management: Logistics Catches up with Strategy. In The Roots of Logistics; Klaus, P., Müller, S., Eds.; Springer: Berlin/Heidelberg, Germany, 2012; pp. 183–194. [Google Scholar] [CrossRef]
- Ferreira, B.; Reis, J. A Systematic Literature Review on the Application of Automation in Logistics. Logistics 2023, 7, 80. [Google Scholar] [CrossRef]
- Kirchheim, A.; Burwinkel, M.; Echelmeyer, W. Automatic Unloading of Heavy Sacks from Containers. In Proceedings of the 2008 IEEE International Conference on Automation and Logistics, Qingdao, China, 1–3 September 2008; IEEE: Piscataway, NJ, USA, 2008; pp. 946–951. [Google Scholar] [CrossRef]
- Lei, W. Market Analysis of Intelligent Loading and Unloading Vehicle Robots. Logist. Mater. Handl. 2023, 28, 90–93. [Google Scholar]
- Jiang, H. Development of Automatic Loading and Unloading Vehicle Technology from an Industrial Perspective. Logist. Mater. Handl. 2023, 28, 116–117. [Google Scholar]
- Roy, D.; de Koster, R. Stochastic Modeling of Unloading and Loading Operations at a Container Terminal Using Automated Lifting Vehicles. Eur. J. Oper. Res. 2018, 266, 895–910. [Google Scholar] [CrossRef]
- Mi, C.; Huang, Y.; Fu, C.; Zhang, Z.; Postolache, O. Vision-Based Measurement: Actualities and Developing Trends in Automated Container Terminals. IEEE Instrum. Meas. Mag. 2021, 24, 65–76. [Google Scholar] [CrossRef]
- Yan, R.; Tian, X.; Wang, S.; Peng, C. Development of Computer Vision Informed Container Crane Operator Alarm Methods. Transp. A: Transp. Sci. 2024, 20, 2145862. [Google Scholar] [CrossRef]
- Zhou, Z.; Wang, M.; Chen, X.; Liang, W.; Zhang, J. Box Detection and Positioning Based on Mask R-CNN [1] for Container Unloading. In Proceedings of the 2019 IEEE 4th Advanced Information Technology, Electronic and Automation Control Conference (IAEAC), Chengdu, China, 20–22 December 2019; IEEE: Piscataway, NJ, USA, 2019; pp. 171–174. [Google Scholar] [CrossRef]
- Naumann, A.; Hertlein, F.; Dörr, L.; Thoma, S.; Furmans, K. Literature Review: Computer Vision Applications in Transportation Logistics and Warehousing. arXiv 2023, arXiv:2304.06009. [Google Scholar] [CrossRef]
- Rolf, B.; Jackson, I.; Müller, M.; Lang, S.; Reggelin, T.; Ivanov, D. A Review on Reinforcement Learning Algorithms and Applications in Supply Chain Management. Int. J. Prod. Res. 2023, 61, 7151–7179. [Google Scholar] [CrossRef]
- Shen, D.; Hu, J.; Zhai, T.; Wang, T.; Zhang, Z. Parallel Loading and Unloading: Smart Technology towards Intelligent Logistics. In Proceedings of the 2019 IEEE International Conference on Systems, Man and Cybernetics (SMC), Bari, Italy, 6–9 October 2019; IEEE: Piscataway, NJ, USA, 2019; pp. 847–851. [Google Scholar] [CrossRef]
- Liu, K.; Zhang, H.; Zhou, Z.; Zhou, J.; Ma, L. Computer Vision Based Cargo Boxes Pose Adjustment System for Two-Dimensional Conveyor Platform. Sci. Rep. 2024, 14, 19997. [Google Scholar] [CrossRef]
- Leo, M.; Natale, A.; Del-Coco, M.; Carcagnì, P.; Distante, C. Robust Estimation of Object Dimensions and External Defect Detection with a Low-Cost Sensor. J. Nondestruct. Eval. 2017, 36, 17. [Google Scholar] [CrossRef]
- Bandong, S.; Nazaruddin, Y.Y.; Joelianto, E. Container Detection System Using CNN Based Object Detectors. In Proceedings of the 2021 International Conference on Instrumentation, Control, and Automation (ICA), Bandung, Indonesia, 25–28 August 2021; IEEE: Piscataway, NJ, USA, 2021; pp. 106–111. [Google Scholar] [CrossRef]
- Gou, L.; Wu, S.; Yang, J.; Yu, H.; Lin, C.; Li, X.; Deng, C. Carton Dataset Synthesis Method for Loading-and-Unloading Carton Detection Based on Deep Learning. Int. J. Adv. Manuf. Technol. 2023, 124, 3049–3066. [Google Scholar] [CrossRef]
- Yang, X.; Han, M.; Tang, H.; Li, Q.; Luo, X. Detecting Defects with Support Vector Machine in Logistics Packaging Boxes for Edge Computing. IEEE Access 2020, 8, 64002–64010. [Google Scholar] [CrossRef]
- Kulik, S.D.; Shtanko, A.N. Experiments with Neural Net Object Detection System YOLO on Small Training Datasets for Intelligent Robotics. In Advanced Technologies in Robotics and Intelligent Systems; Misyurin, S.Y., Arakelian, V., Avetisyan, A.I., Eds.; Mechanisms and Machine Science; Springer International Publishing: Cham, Switzerland, 2020; Volume 80, pp. 157–162. [Google Scholar] [CrossRef]
- Chen, C.; Zheng, Z.; Xu, T.; Guo, S.; Feng, S.; Yao, W.; Lan, Y. YOLO-Based UAV Technology: A Review of the Research and Its Applications. Drones 2023, 7, 190. [Google Scholar] [CrossRef]
- Terven, J.; Córdova-Esparza, D.-M.; Romero-González, J.-A. A Comprehensive Review of YOLO Architectures in Computer Vision: From YOLOv1 to YOLOv8 and YOLO-NAS. Make 2023, 5, 1680–1716. [Google Scholar] [CrossRef]
- Ge, Z.; Liu, S.; Wang, F.; Li, Z.; Sun, J. YOLOX: Exceeding YOLO Series in 2021. arXiv 2021, arXiv:2107.08430. [Google Scholar] [CrossRef]
- Varghese, R.; Sambath, M. YOLOv8: A Novel Object Detection Algorithm with Enhanced Performance and Robustness. In Proceedings of the 2024 International Conference on Advances in Data Engineering and Intelligent Computing Systems (ADICS), Chennai, India, 18–19 April 2024; IEEE: Piscataway, NJ, USA, 2024; pp. 1–6. [Google Scholar] [CrossRef]
- Zhou, Q.; Wang, Z.; Zhong, Y.; Zhong, F.; Wang, L. Efficient Optimized YOLOv8 Model with Extended Vision. Sensors 2024, 24, 6506. [Google Scholar] [CrossRef]
- Jia, C. Technical Solutions and Applications of Automatic Loading and Unloading Vehicle Technology in the Food and Beverage Industry. Logist. Mater. Handl. 2023, 28, 94–98. [Google Scholar]
- Hu, Z.; Yang, A. Development Status of Automatic Loading and Unloading Vehicle Technology for Boxed Products. Mech. Electr. Eng. Technol. 2021, 50, 15–18. [Google Scholar]
- Zhang, Z.; Zhang, L. Design of Automatic Handling and Loading/Unloading Robot for Railway Freight Trains. China Science and Technology Information. 2024, 11, 85–87. [Google Scholar]
- Rajendran, S.D.; Wahab, S.N.; Ling, Y.W.; Yun, L.S. The Impact of Logistics Services on the E-Shoppers’ Satisfaction. Int. J. Supply Chain. Manag. 2018, 7, 461–469. [Google Scholar]
- Wen, J.; He, L.; Zhu, F. Swarm Robotics Control and Communications: Imminent Challenges for Next Generation Smart Logistics. IEEE Commun. Mag. 2018, 56, 102–107. [Google Scholar] [CrossRef]
- Heimfarth, A.; Ostermeier, M.; Hübner, A. A Mixed Truck and Robot Delivery Approach for the Daily Supply of Customers. Eur. J. Oper. Res. 2022, 303, 401–421. [Google Scholar] [CrossRef]
- Da Costa Barros, Í.R.; Nascimento, T.P. Robotic Mobile Fulfillment Systems: A Survey on Recent Developments and Research Opportunities. Robot. Auton. Syst. 2021, 137, 103729. [Google Scholar] [CrossRef]
- O’Shea, K.; Nash, R. An Introduction to Convolutional Neural Networks. arXiv 2015, arXiv:1511.08458. [Google Scholar] [CrossRef]
- Albawi, S.; Mohammed, T.A.; Al-Zawi, S. Understanding of a Convolutional Neural Network. In Proceedings of the 2017 International Conference on Engineering and Technology (ICET), Antalya, Turkey, 21–23 August 2017; IEEE: Piscataway, NJ, USA, 2017; pp. 1–6. [Google Scholar] [CrossRef]
- Yamashita, R.; Nishio, M.; Do, R.K.G.; Togashi, K. Convolutional Neural Networks: An Overview and Application in Radiology. Insights Imaging 2018, 9, 611–629. [Google Scholar] [CrossRef]
- Taye, M.M. Theoretical Understanding of Convolutional Neural Network: Concepts, Architectures, Applications, Future Directions. Computation 2023, 11, 52. [Google Scholar] [CrossRef]
- Ju, M.; Luo, J.; Liu, G.; Luo, H. ISTDet: An Efficient End-to-End Neural Network for Infrared Small Target Detection. Infrared Phys. Technol. 2021, 114, 103659. [Google Scholar] [CrossRef]
- Liu, W.; Anguelov, D.; Erhan, D.; Szegedy, C.; Reed, S.; Fu, C.-Y.; Berg, A.C. SSD: Single Shot MultiBox Detector. In Computer Vision–ECCV 2016; Leibe, B., Matas, J., Sebe, N., Welling, M., Eds.; Lecture Notes in Computer Science; Springer International Publishing: Cham, Switzerland, 2016; Volume 9905, pp. 21–37. [Google Scholar] [CrossRef]
- Jiang, P.; Ergu, D.; Liu, F.; Cai, Y.; Ma, B. A Review of Yolo Algorithm Developments. Procedia Comput. Sci. 2022, 199, 1066–1073. [Google Scholar] [CrossRef]
- Hsu, W.-Y.; Lin, W.-Y. Adaptive Fusion of Multi-Scale YOLO for Pedestrian Detection. IEEE Access 2021, 9, 110063–110073. [Google Scholar] [CrossRef]
- Benjumea, A.; Teeti, I.; Cuzzolin, F.; Bradley, A. YOLO-Z: Improving Small Object Detection in YOLOv5 for Autonomous Vehicles. arXiv 2023, arXiv:2112.11798. [Google Scholar] [CrossRef]
- Li, Q.; Ding, X.; Wang, X.; Chen, L.; Son, J.; Song, J.-Y. Detection and Identification of Moving Objects at Busy Traffic Road Based on YOLO V4. J. Inst. Internet Broadcast. Commun. 2021, 21, 141–148. [Google Scholar] [CrossRef]
- Chen, R.-C. Automatic License Plate Recognition via Sliding-Window Darknet-YOLO Deep Learning. Image Vis. Comput. 2019, 87, 47–56. [Google Scholar] [CrossRef]
- Dewi, C.; Chen, R.-C.; Jiang, X.; Yu, H. Deep Convolutional Neural Network for Enhancing Traffic Sign Recognition Developed on Yolo V4. Multimed. Tools Appl. 2022, 81, 37821–37845. [Google Scholar] [CrossRef]
- Chen, W.; Huang, H.; Peng, S.; Zhou, C.; Zhang, C. YOLO-Face: A Real-Time Face Detector. Vis. Comput. 2021, 37, 805–813. [Google Scholar] [CrossRef]
- Ma, H.; Celik, T.; Li, H. FER-YOLO: Detection and Classification Based on Facial Expressions. In Image and Graphics; Peng, Y., Hu, S.-M., Gabbouj, M., Zhou, K., Elad, M., Xu, K., Eds.; Lecture Notes in Computer Science; Springer International Publishing: Cham, Switzerland, 2021; Volume 12888, pp. 28–39. [Google Scholar] [CrossRef]
- Tan, L.; Huangfu, T.; Wu, L.; Chen, W. Comparison of RetinaNet, SSD, and YOLO v3 for Real-Time Pill Identification. BMC Med. Inform. Decis. Mak. 2021, 21, 324. [Google Scholar] [CrossRef]
- Al-masni, M.A.; Al-antari, M.A.; Park, J.-M.; Gi, G.; Kim, T.-Y.; Rivera, P.; Valarezo, E.; Choi, M.-T.; Han, S.-M.; Kim, T.-S. Simultaneous Detection and Classification of Breast Masses in Digital Mammograms via a Deep Learning YOLO-Based CAD System. Comput. Methods Programs Biomed. 2018, 157, 85–94. [Google Scholar] [CrossRef]
- Lippi, M.; Bonucci, N.; Carpio, R.F.; Contarini, M.; Speranza, S.; Gasparri, A. A YOLO-Based Pest Detection System for Precision Agriculture. In Proceedings of the 2021 29th Mediterranean Conference on Control and Automation (MED), Puglia, Italy, 22–25 June 2021; IEEE: Piscataway, NJ, USA, 2021; pp. 342–347. [Google Scholar] [CrossRef]
- Wu, D.; Lv, S.; Jiang, M.; Song, H. Using Channel Pruning-Based YOLO v4 Deep Learning Algorithm for the Real-Time and Accurate Detection of Apple Flowers in Natural Environments. Comput. Electron. Agric. 2020, 178, 105742. [Google Scholar] [CrossRef]
- Dos Reis, D.H.; Welfer, D.; De Souza Leite Cuadros, M.A.; Gamarra, D.F.T. Mobile Robot Navigation Using an Object Recognition Software with RGBD Images and the YOLO Algorithm. Appl. Artif. Intell. 2019, 33, 1290–1305. [Google Scholar] [CrossRef]
- Sahin, O.; Ozer, S. YOLODrone: Improved YOLO Architecture for Object Detection in Drone Images. In Proceedings of the 2021 44th International Conference on Telecommunications and Signal Processing (TSP), Brno, Czech Republic, 26–28 July 2021; IEEE: Piscataway, NJ, USA, 2021; pp. 361–365. [Google Scholar] [CrossRef]
- Kang, J.-S.; Kang, J.K.; Son, S.; Park, S.H.; Jung, E.-J.; Cho, G.R. Image Enhancement Method for Detection in Logistics Loading and Unloading Robots. IEEE Access 2024, 1–1. [Google Scholar] [CrossRef]
- Xiang, R.; Feng, W.; Song, S.; Zhang, H. Automated Docking System for LNG Loading Arm Based on Machine Vision and Multi-Sensor Fusion. Appl. Sci. 2025, 15, 2264. [Google Scholar] [CrossRef]
- Li, C.; Li, L.; Jiang, H.; Weng, K.; Geng, Y.; Li, L.; Ke, Z.; Li, Q.; Cheng, M.; Nie, W.; et al. YOLOv6: A Single-Stage Object Detection Framework for Industrial Applications. arXiv 2022, arXiv:2209.02976. [Google Scholar] [CrossRef]


| Location | Warehouse | Truck | Outdoor | Total |
|---|---|---|---|---|
| Quantity | 5962 | 2281 | 1291 | 9534 |
| Proportion | 62.5% | 23.9% | 13.6% | 100% |
| Device | Parameter | Hyperparameters | Value |
|---|---|---|---|
| CPU | Intel(R) Core(TM) I7-12650H | Optimizer | SGD |
| RAM | 32 GB | Epochs | 150 |
| GPU | NVIDIA GeForce RTX 4060 | Batch size | 16 |
| GPU memory | 8 GB | Imgsz | 640 |
| Operating System | Windows 11 | Workers | 8 |
| Deep learning framework | PyTorch 2.1.2 | lrf | 0.01 |
| Programming language | Python 3.8.18 | weight_decay | 0.0005 |
| FEP | SW-Loss | LA | CBAM | SE | AP (%) | AR (%) | mAP@ 50% | FLOP GFLOPs/s | Parameters (M) | Model Size (M) |
|---|---|---|---|---|---|---|---|---|---|---|
| 一 | 一 | 一 | 一 | 一 | 94.5 | 94.6 | 98.0 | 28.6 | 11.1 | 21.4 |
| 一 | 一 | 一 | 一 | √ | 94.5 | 94.8 | 98.0 | 28.7 | 11.2 | 21.5 |
| 一 | 一 | 一 | √ | 一 | 94.6 | 95.0 | 98.1 | 28.9 | 11.3 | 21.9 |
| 一 | 一 | √ | 一 | 一 | 95.2 | 95.3 | 98.3 | 28.7 | 11.2 | 21.7 |
| √ | 一 | 一 | 一 | 一 | 95.0 | 95.2 | 98.1 | 28.9 | 11.4 | 21.9 |
| 一 | √ | 一 | 一 | 一 | 94.7 | 94.8 | 98.1 | 28.6 | 11.1 | 21.4 |
| √ | √ | 一 | 一 | 一 | 95.1 | 95.3 | 98.2 | 29.0 | 11.4 | 22.0 |
| √ | √ | √ | 一 | 一 | 95.8 | 95.9 | 98.5 | 29.1 | 11.6 | 22.3 |
| Model | Epochs | AP (%) | AR (%) | mAP@50% | FLOPs GFLOPs/s |
|---|---|---|---|---|---|
| SSD [37] | 150 | 88.5 | 85.6 | 89.6 | 22.0 |
| YOLOv5_G [51] | 150 | 90.7 | 80.4 | 87.8 | 24.0 |
| YOLOv5s | 150 | 93.0 | 93.0 | 96.7 | 24.2 |
| YOLOv8s | 150 | 94.5 | 94.6 | 98.0 | 28.6 |
| HYFF-CB (ours) | 150 | 95.8 | 95.9 | 98.5 | 29.1 |
| Number of Test Samples | TP | FP | FN | RP | RR |
|---|---|---|---|---|---|
| 663 | 15,264 | 16 | 25 | 99.9% | 99.8% |
Disclaimer/Publisher’s Note: The statements, opinions and data contained in all publications are solely those of the individual author(s) and contributor(s) and not of MDPI and/or the editor(s). MDPI and/or the editor(s) disclaim responsibility for any injury to people or property resulting from any ideas, methods, instructions or products referred to in the content. |
© 2025 by the authors. Licensee MDPI, Basel, Switzerland. This article is an open access article distributed under the terms and conditions of the Creative Commons Attribution (CC BY) license (https://creativecommons.org/licenses/by/4.0/).
Share and Cite
Li, J.; Yang, K.; Qiu, C.; Wang, L.; Cai, Y.; Wei, H.; Yu, Q.; Huang, P. HYFF-CB: Hybrid Feature Fusion Visual Model for Cargo Boxes. Sensors 2025, 25, 1865. https://doi.org/10.3390/s25061865
Li J, Yang K, Qiu C, Wang L, Cai Y, Wei H, Yu Q, Huang P. HYFF-CB: Hybrid Feature Fusion Visual Model for Cargo Boxes. Sensors. 2025; 25(6):1865. https://doi.org/10.3390/s25061865
Chicago/Turabian StyleLi, Juedong, Kaifan Yang, Cheng Qiu, Lubin Wang, Yujia Cai, Hailan Wei, Qiang Yu, and Peng Huang. 2025. "HYFF-CB: Hybrid Feature Fusion Visual Model for Cargo Boxes" Sensors 25, no. 6: 1865. https://doi.org/10.3390/s25061865
APA StyleLi, J., Yang, K., Qiu, C., Wang, L., Cai, Y., Wei, H., Yu, Q., & Huang, P. (2025). HYFF-CB: Hybrid Feature Fusion Visual Model for Cargo Boxes. Sensors, 25(6), 1865. https://doi.org/10.3390/s25061865