Article

Design Method of a Wide-Field, Dual-Slit, Low-Distortion, and High-Sensitivity Hyperspectral Imager

1
School of Opto-Electronical Engineering, Xi’an Technological University, Xi’an 710021, China
2
Shaanxi Key Laboratory of Optical Remote Sensing and Intelligent Information Processing, Xi’an Institute of Optics and Precision Mechanics, Chinese Academy of Sciences, Xi’an 710119, China
*
Authors to whom correspondence should be addressed.
Sensors 2025, 25(20), 6478; https://doi.org/10.3390/s25206478
Submission received: 30 July 2025 / Revised: 16 October 2025 / Accepted: 17 October 2025 / Published: 20 October 2025
(This article belongs to the Special Issue Advances in Optical Sensing, Instrumentation and Systems: 2nd Edition)

Abstract

To increase target acquisition probability and the signal-to-noise ratio (SNR) of hyperspectral images, this paper presents a wide-field, dual-slit, low-distortion, and high-sensitivity Offner hyperspectral imager, with a wavelength range of 0.4 μm to 0.9 μm, a numerical aperture of 0.15, and a slit length of 73 mm. To avoid signal aliasing, the space between the dual slits is 2.4 mm, increasing the SNR by 1.4 times after dual-slit image fusion. Furthermore, to achieve the required registration accuracy of dual-slit images, the spectral performance of the hyperspectral imager is critical. Thus, we compensate and correct the spectral performance and dispersion nonlinearity of the hyperspectral imager by taking advantages of the material properties and tilt eccentricity of a low-dispersion internal reflection curved prism and high-dispersion double-pass curved prisms. To meet the final operation requirements, the tilt of the internal reflection curved prism is used as a compensator. Using the modulation transfer function (MTF) as the evaluation criterion, an inverse sensitivity analysis confirmed that the compensator is a highly sensitive component. Additionally, the root mean square standard deviation (RSS) discrete calculation method was adopted to assess the influence of actual assembly tolerance on spectral performance. The test results demonstrate that the hyperspectral imager meets the registration accuracy requirements of dual-slit images, with an MTF better than 0.4. Furthermore, the spectral smile and spectral keystone of the dual-slit images are both less than or equal to 0.3 pixels.

1. Introduction

Currently, imaging spectrometers are widely used in various fields, including remote sensing, biomedicine, chemical detection, mineral exploration, environmental monitoring, missile interception, explosion analysis, and combustion diagnostics [1,2,3,4,5]. Pushbroom imaging spectrometers have two dimensions, capturing spatial data parallel to the slit and acquiring the corresponding spectral information perpendicular to the slit. Spatial information along the orbital direction is acquired through a satellite’s movement along its orbit over time, ultimately generating a three-dimensional data cube containing spatial and spectral information [6,7]. Unlike traditional planar dispersion prisms, curved prism spectral imaging technology can be applied to non-parallel optical paths, with advantages, like compact structure, low nonlinear dispersion, and aberration correction, significantly improving imaging quality and overall system performance [8]. On-orbit high-resolution curved prism hyperspectral imagers include the CHRIS system, the STSAT3 system, the EnMap system, and micro-nano spectrometers [9,10,11,12]. However, although curved prism spectrometers have advantages such as low spectral keystone and high spectral resolution, their processing and tuning are more difficult to work with than those of traditional grating dispersion spectrometers owing to their non-coaxial features. Rational allocation of processing and alignment tolerances for curved prisms ensures instruments have excellent spectral performance and imaging quality and are thus suitable for engineering.
The impact of optical system manufacturing and assembly errors on system imaging performance can be determined through traditional Monte Carlo tolerance analysis. However, this tolerance analysis and evaluation method fails to provide impact analysis on indicators, like system distortion magnification, telecentricity, spectral smile, and spectral keystone. L.B. Moore et al. proposed an evaluation method for imaging spectrometer that simultaneously satisfies five variables, namely, along-track response functions, cross-track response functions, spectral response functions, spectral centroid uniformity, and spatial centroid uniformity [13]. This method quantifies spectral smile and keystone, enabling rapid and semi-automated assessment from the design stage to processing, assembly, and the orbital cycle. H. Ku et al. designed an inverse sensitivity evaluation method for traditional Offner imaging spectrometers, assessing tolerance budgets for each component in practical production [14]. By using the tilt and eccentricity of the secondary mirror as compensators, they were able to perform a multi- performance tolerance analysis of the system’s MTF, diapoint, spectral smile, and spectral keystone. L. Feng et al. designed a broadband Offner imaging spectrometer covering 0.4 μm–2.5 μm, ensuring the spectral performance of the system through MTF Monte Carlo analysis [15].
In this study, the spectral performance of a hyperspectral imager was analyzed by using the MTF evaluation method. The tilt of its curved prism was adopted as the compensator, verifying its sensitivity through inverse sensitivity analysis. Further, the RSS discrete calculation method was used to evaluate processing and assembly errors, ultimately achieving excellent imaging and spectral performance.

2. Impact of Processing and Assembly Errors on Spectral Performance

Processing and assembly errors of the curved prism can cause variations in the incident angle and height of emitted light rays from each slit point on its surface. Figure 1 illustrates the assembly errors in the curved prism under study through geometric ray tracing.
Here, Dx represents the displacement deviation of the curved prism along the x-axis, and Ty denotes the rotational deviation along the y-axis.
Spectral smile can be authentically quantified using spectral calibration data, and corrected through data processing and differential fitting. A spectral keystone can be created through polychromatic light star point centroid fitting, yet correcting it is very difficult [16]. Hence, this section focuses on analyzing the impact of the curved prism on the spectral keystone. Ideally, the light refraction transfer matrix of the curved prism in the x-axis direction can be expressed as follows:
N 2 = M S 2 M t M S 1 N 1
M s q = 1 0 n - n r q 1 ,   q = 1 , 2
N q = h q n q sin u q
M S 2   | X O Z = 1 P 1 P 2 n p r i s m 0 1 M S 1 | X O Z
where N2 is the refraction matrix of the curved prism in the x-axis direction; Msq is the refraction matrix for a single spherical surface; Mt is the transition matrix from S1 to S2 (with S1 and S2 indicated in the diagram); n′ is the refractive index of the medium on the refractive side; n is the refractive index of the medium on the incident side; rq is the radius of the qth spherical refractive surface; nq is the refractive index of the material of the qth spherical refractive surface; nq is the ray matrix; MS2|XOZ is the transition matrix between the spherical surfaces along the x-axis; MS1|XOZ is the refraction matrix of the spherical surface along the y-axis. n is the refractive index of the curved prism; hq is the distance from the spherical surface intersection point to the principal axis; and uq is the angle between the chief ray of the refractive surface and the principal axis of the spherical surface.
When processing and assembly errors occur in the curved prism, the incident light at slit point A deflects in the XOZ plane. The dispersion angle of the light at point A along the X-axis is derived from Equations (1)–(4), and the light deflection angle at point A in the X-axis direction is θA|XOZ [17,18,19].
h F i n a l n a i r sin ( θ A | X O Z ) + T x = 1 0 n a i r n R 2 | X O Z 1 1 ( P 1 P 2 D y tan α ) cos T y n p r i s m 0 1 h 1 n p r i s m sin U 1 | X O Z
h 1 n p r i s m sin U 1 | X O Z = 1 0 n n a i r R 1 | X O Z 1 ( d + D x ) cos T z cos T x n a i r sin T x
where h F i n a l is the distance from the intersection point of the emitted ray from the curved prism and the rear surface to the principal optical axis of the rear surface; Tx is the tilt error of the curved prism around the x-axis; Dy is the eccentric error in the y-axis direction; Tz is the tilt error around the Z-axis; h 1 is the distance from S1 to the principal axis of S1; and the angle between the refracted ray after passing through S1 and the principal axis of S1 is U l X O Z .

3. Spectroscopic System Design

In the design process, the first step is to determine the design input of a hyperspectral imager, including wavelength, spectral resolution, etc.; the second step is to determine the initial structural configuration, including off-axis displacement, material, optical power, and air space. Finally, the design parameters of the system are determined as shown in Table 1.
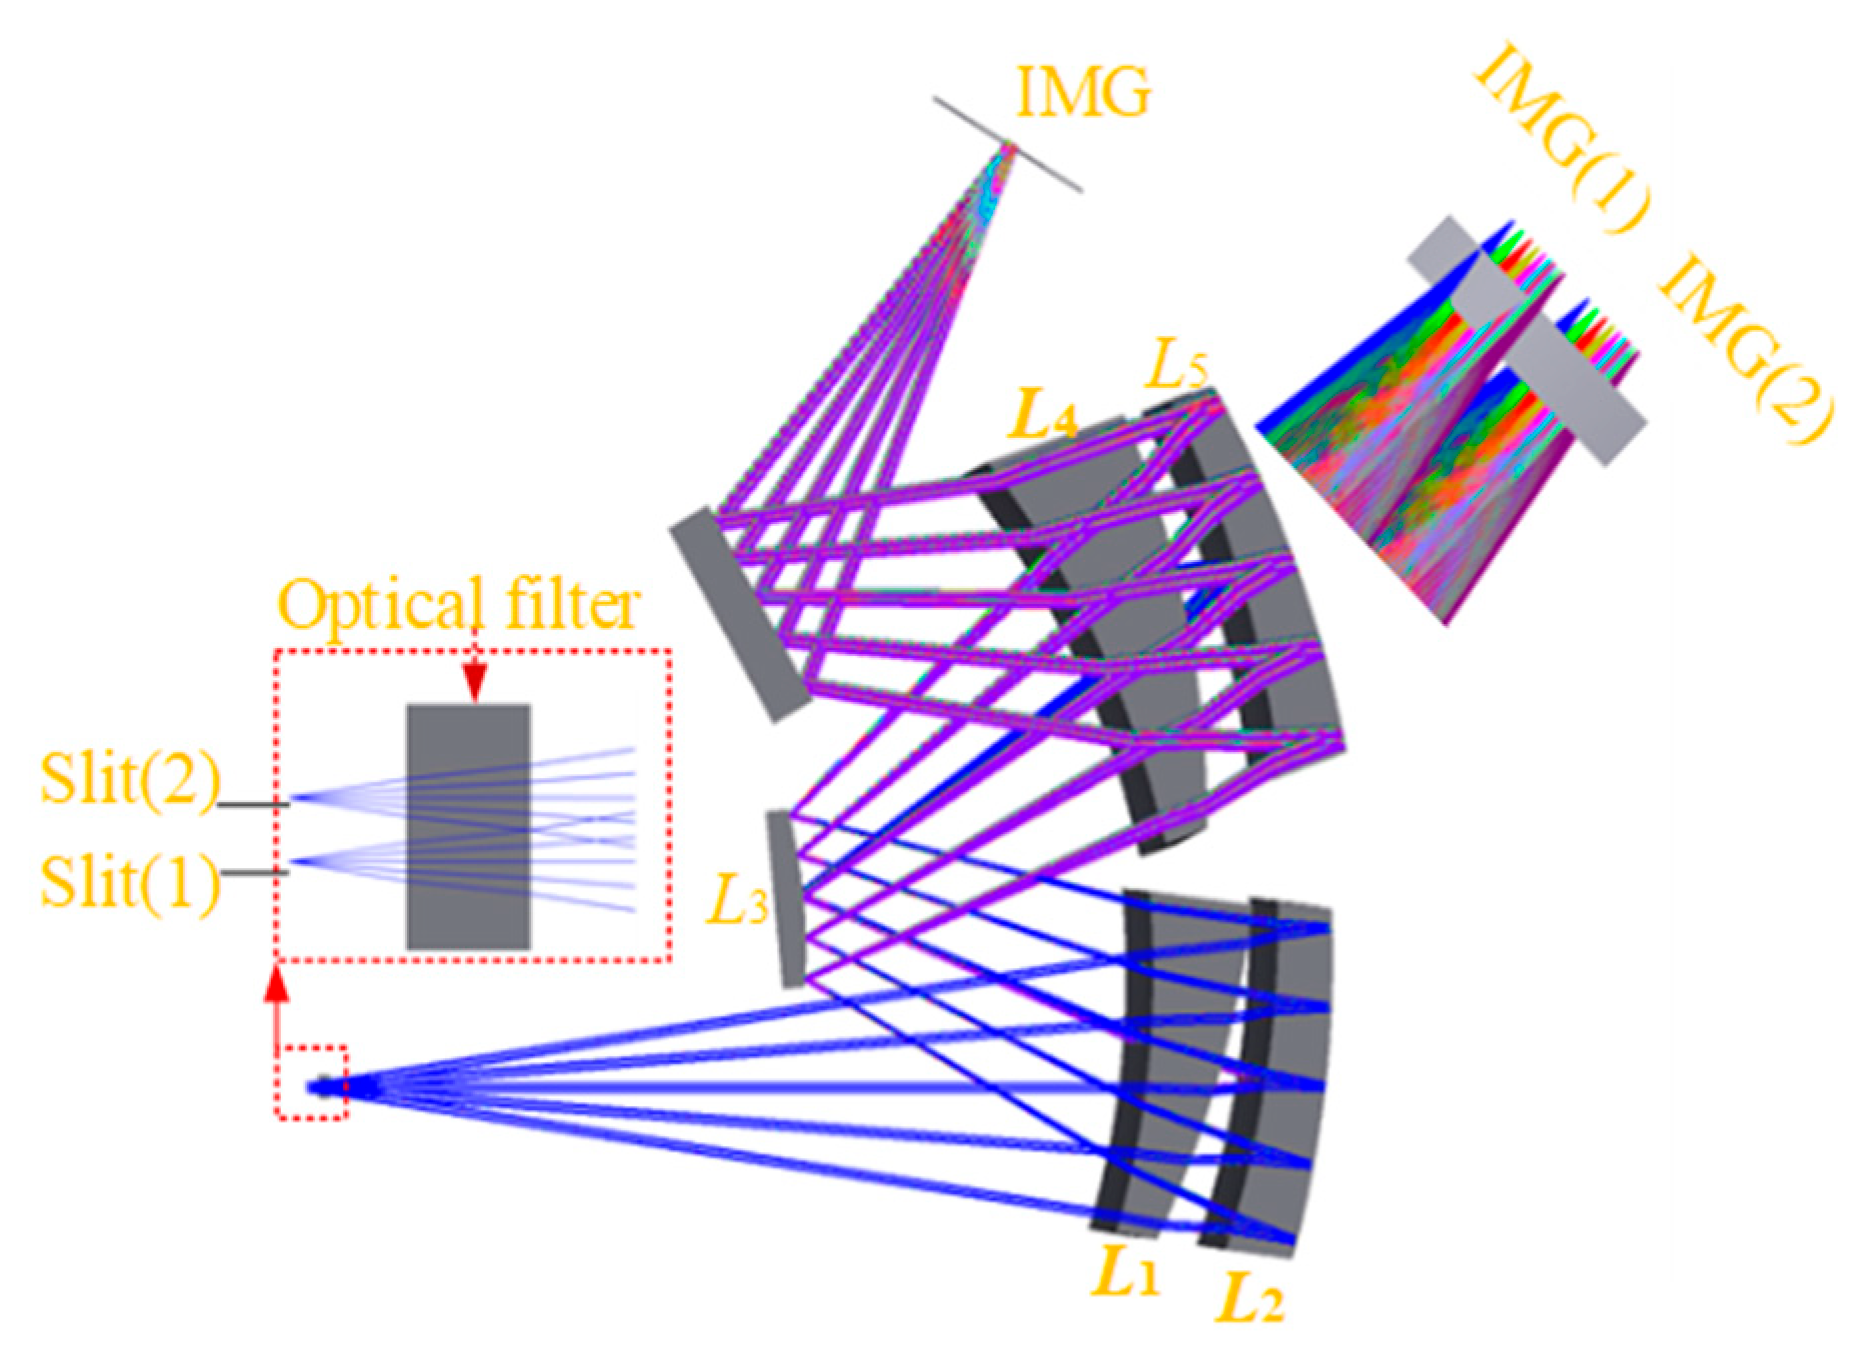
The initial configuration of the hyperspectral imager is an Offner concentric structure, achieving dispersion width through different off-axis displacement of curved prisms and the element tilt, and correcting dispersion non-uniformity through material matching. The final light path diagram of the system is illustrated in Figure 2, primarily consisting of four curved prisms and a secondary mirror, and the volume is 445 mm × 230 mm × 461 mm. The parameters of the optical elements are detailed in Table 2.

3.1. System Design

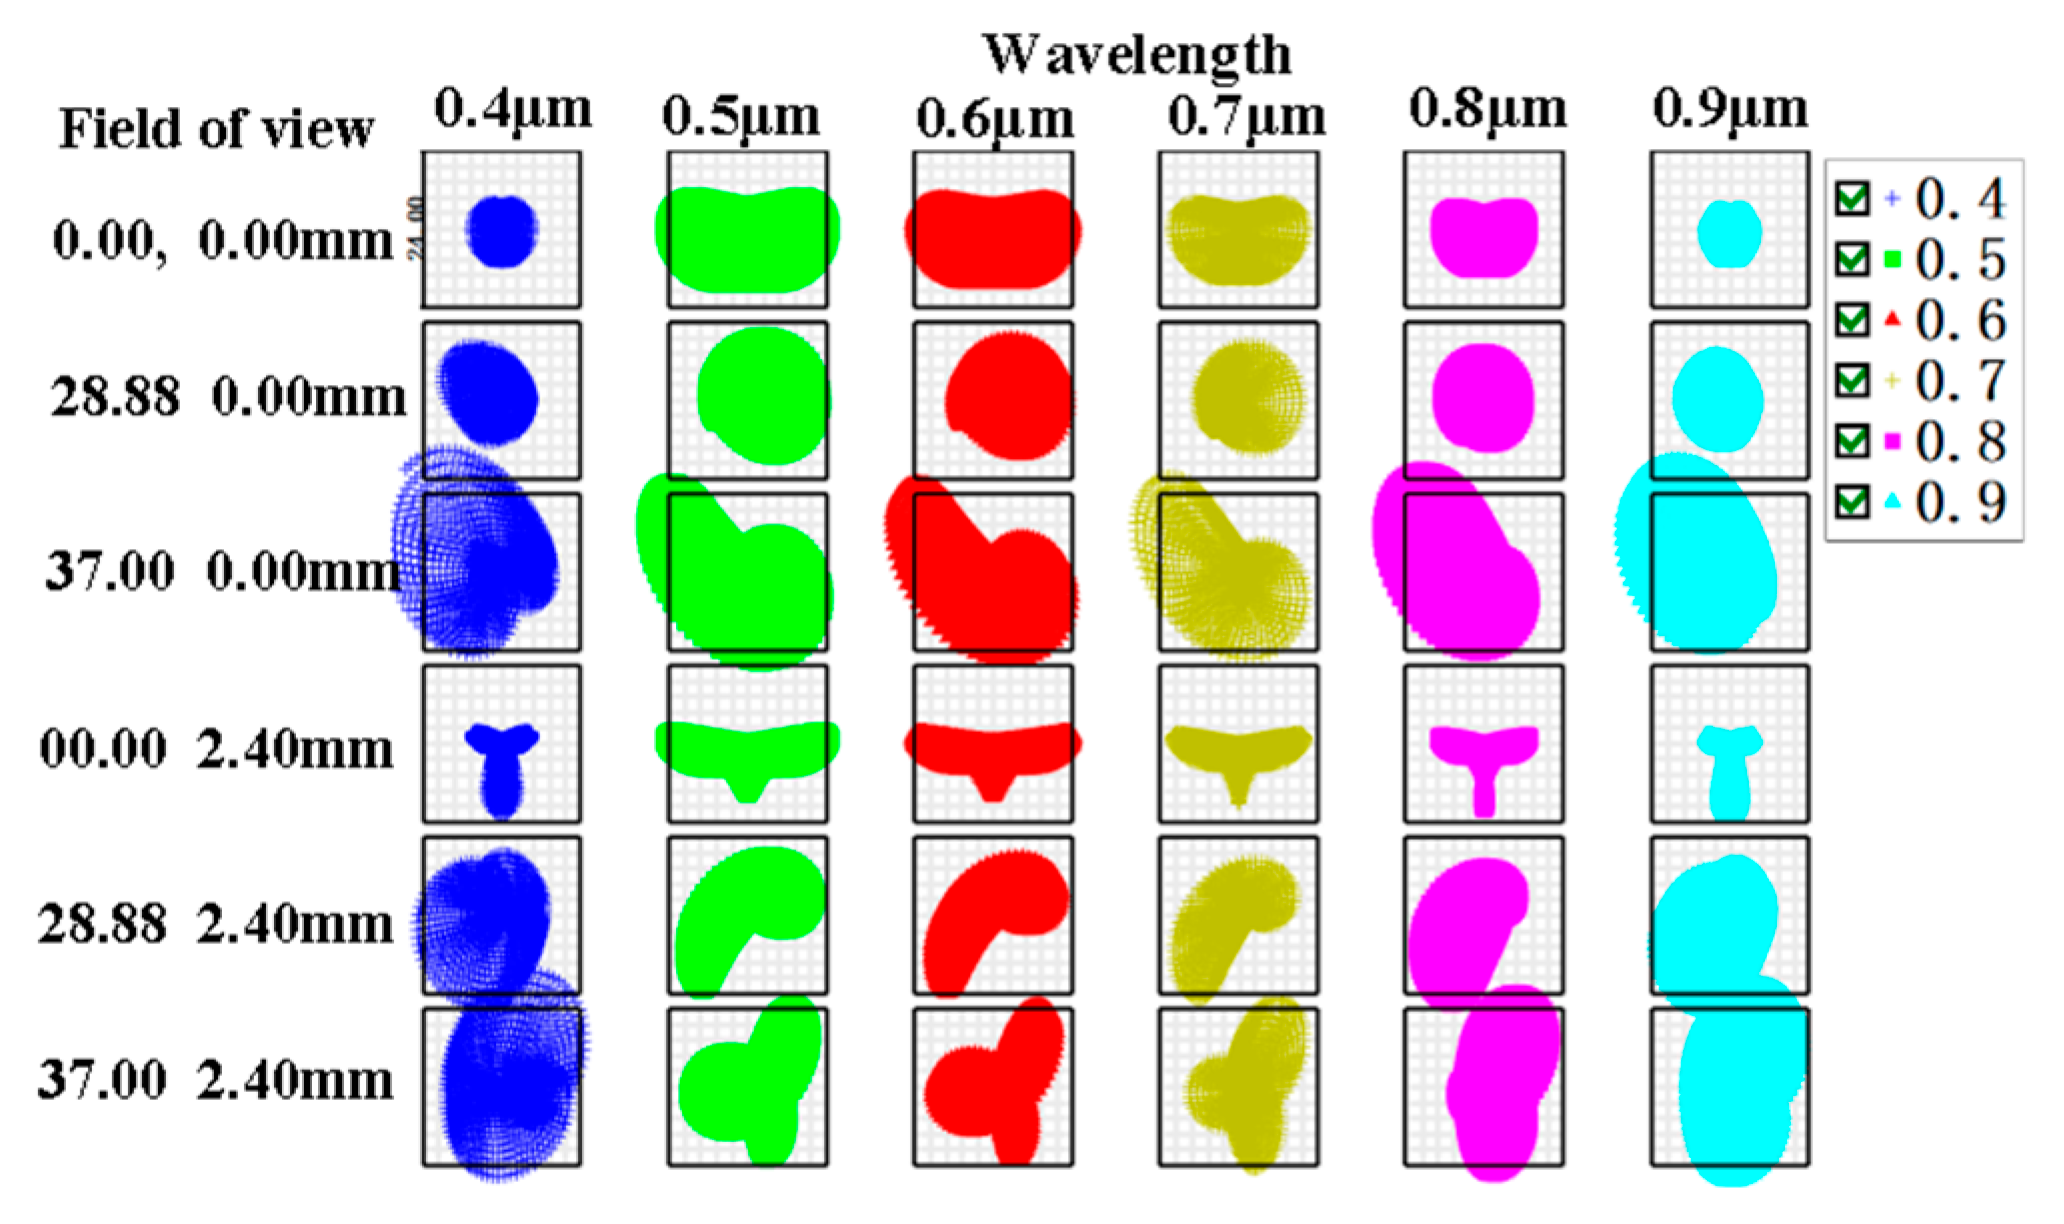
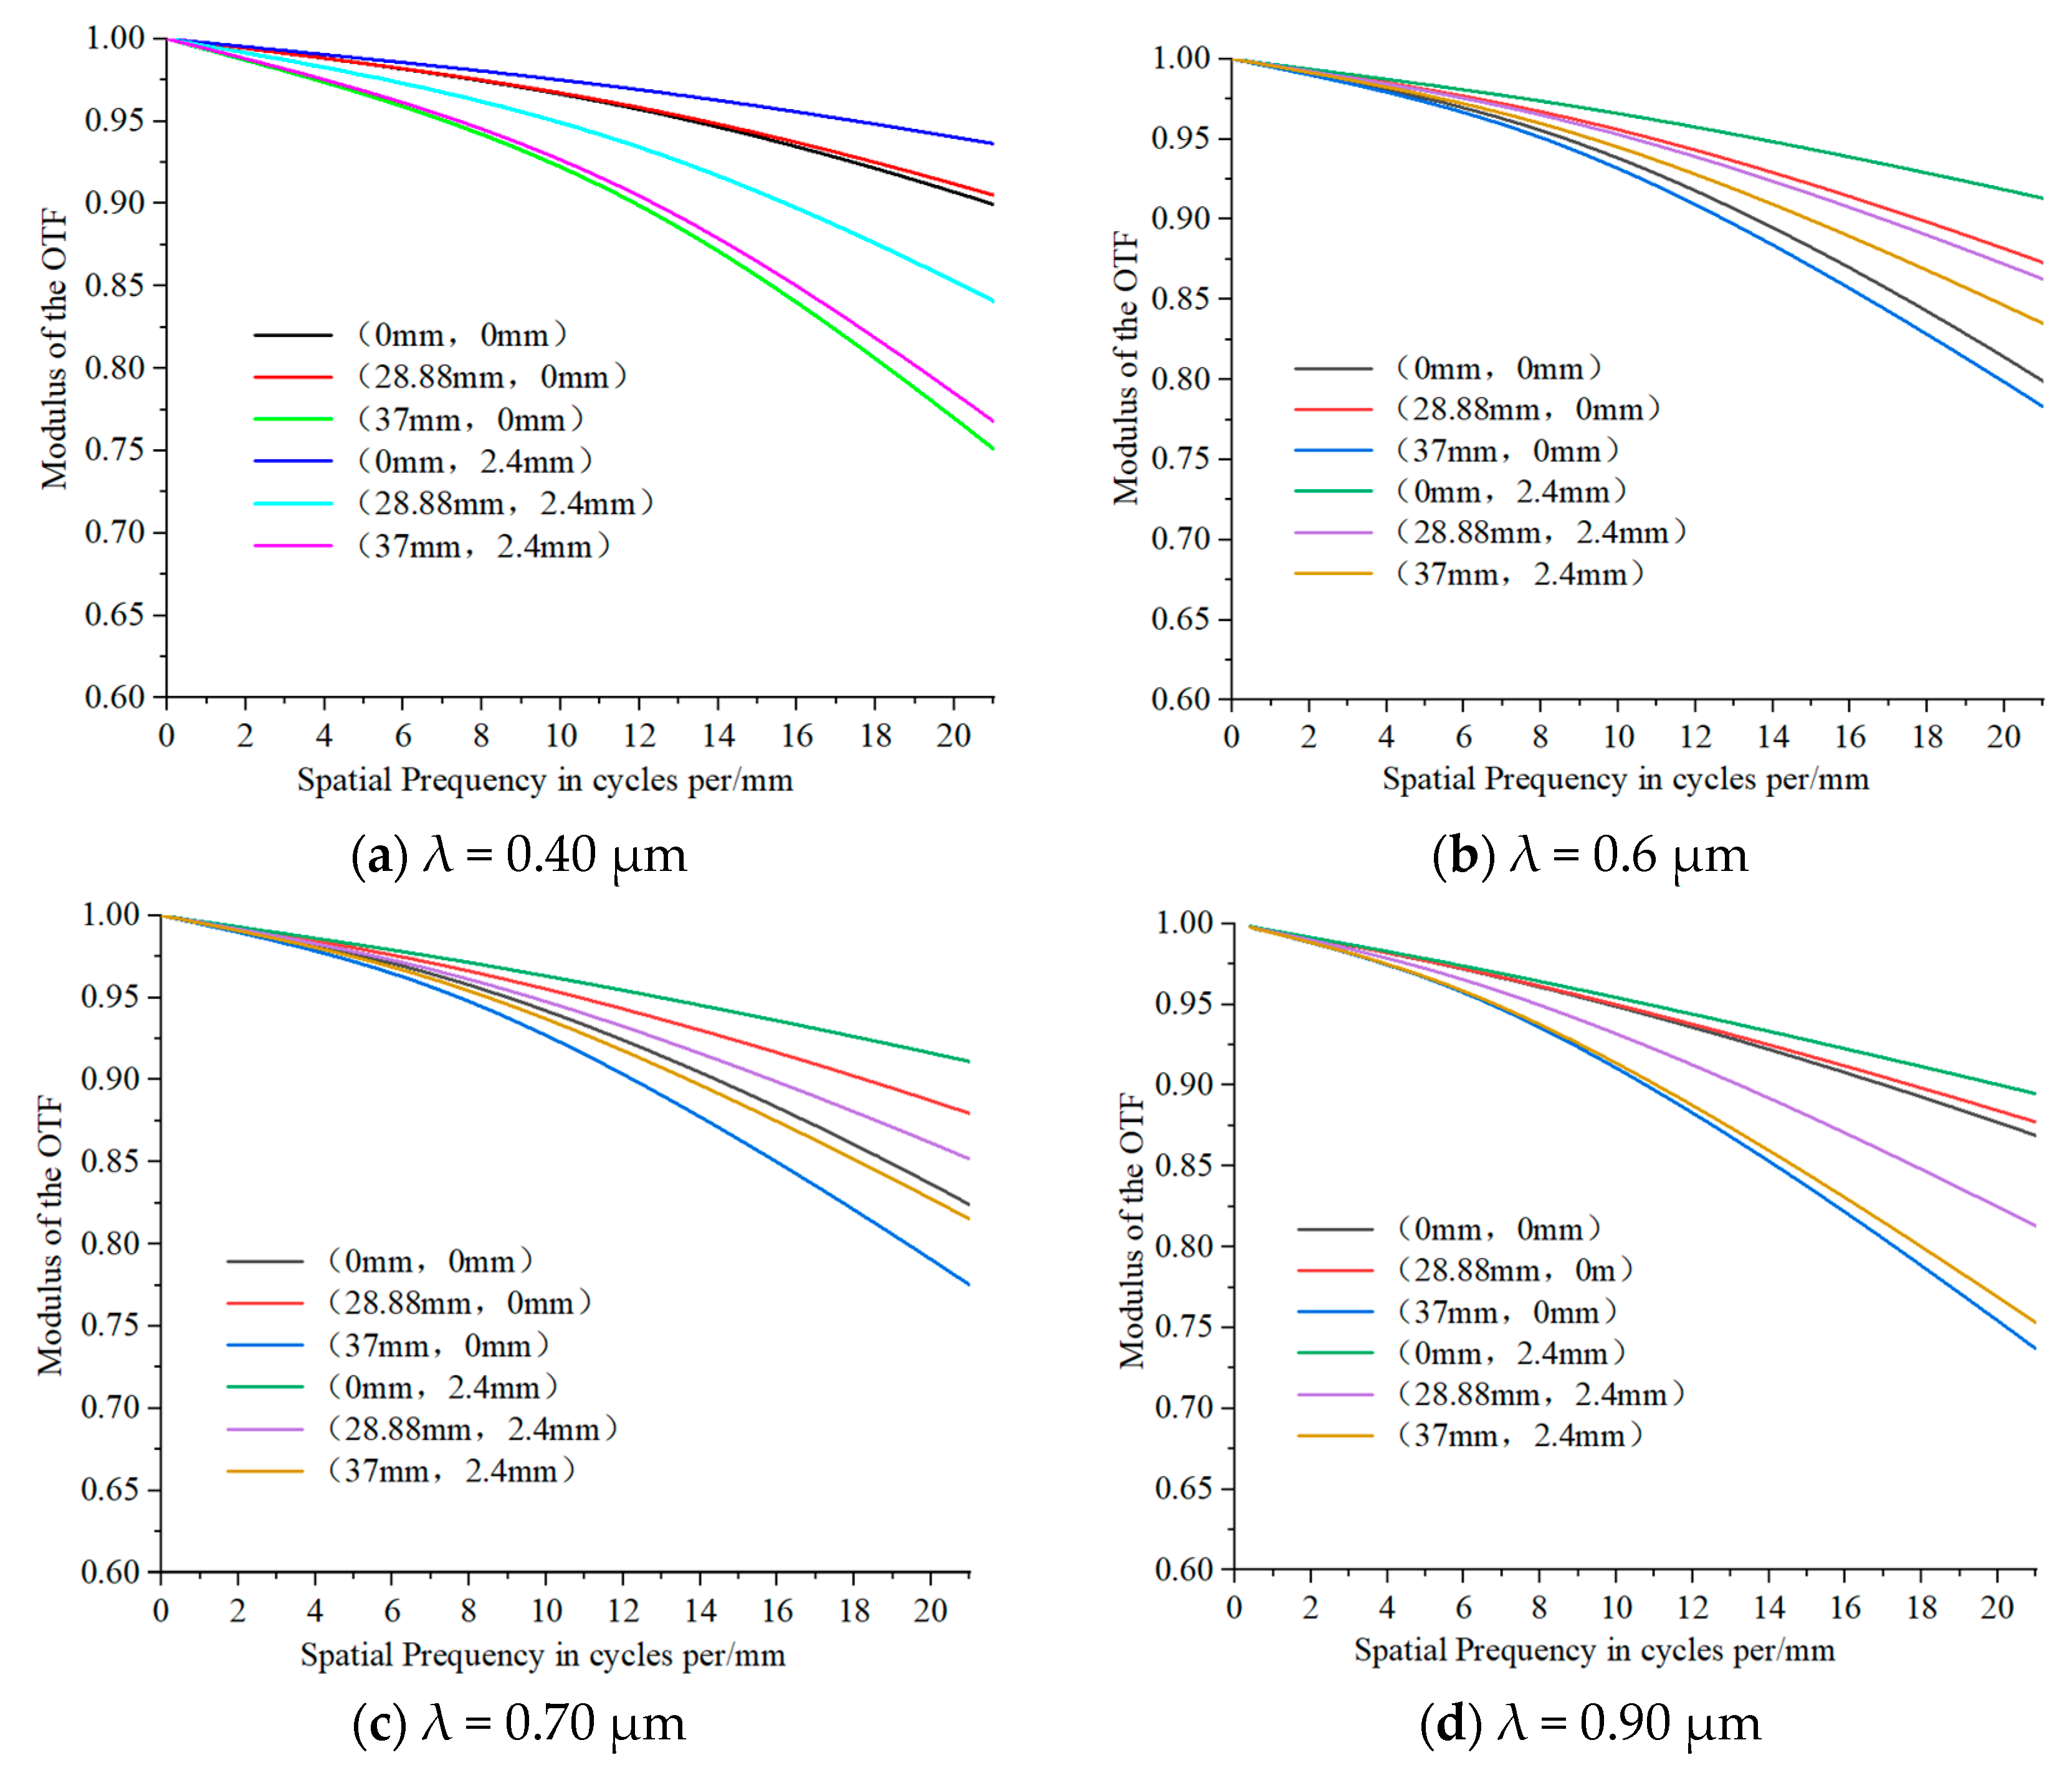
The system’s matrix spot diagrams of the sampling wavelengths of 0.4 μm, 0.5 μm, 0.6 μm, 0.7 μm, 0.8 μm, and 0.9 μm at the slit lengths of (0 mm, 0 mm), (28.88 mm, 0 mm), (37 mm, 0 mm), (0 mm, 2.4 mm), (28.88 mm, 2.4 mm), and (37 mm, 2.4 mm) are shown in Figure 3, illustrating that the system’s matrix spot diagrams at different sampling wavelengths and slit lengths are within a single pixel (24 μm). The system’s MTF of the sampling wavelengths of 0.4 μm, 0.6 μm, 0.7 μm, and 0.9 μm at various slit lengths are presented in Figure 4, observing that the system’s MTF of different sampling wavelengths at the entire slit lengths exceeds 0.75 at the Nyquist frequency of 21 lp/mm across. In conclusion, the imaging quality of the system is excellent.
The spectral smile and spectral keystone affect the detection accuracy and recognition accuracy of spectroscopic instruments, respectively, thus correcting them is very important.
Taking the center of the slit as the reference, the spectral difference between the different slit lengths at the same sampling wavelength and the reference are spectral smile. As shown in Figure 5, the spectral smiles of the system were fitted at sampling wavelengths of 0.40 μm, 0.45 μm, 0.50 μm, 0.65 μm, 0.75 μm, 0.80 μm, and 0.90 μm, indicating that the spectral smile of Silt (1) and Silt (2) at different sampling wavelengths are both less than 0.3 pixels. Spectral keystone fitting is based on the sampling center wavelength as the reference, the spectral difference between the different sampling wavelengths at the same FOV and the reference are spectral keystone. The system’s spectral keystones of different sampling wavelengths at 0.3 h, 0.5 h, 0.707 h, 0.85 h and 1 h are shown in Figure 6, indicating that the spectral keystones of Sill (1) and Sill (2) at different FOVs are both less than 0.24 pixels. The spectral lateral deviation fitting curve of the system, as shown in Figure 7, is less than 2 nm. Therefore, the spectral smile and spectral keystone can be corrected without data processing.

3.2. System Assembly Tolerance Analysis

Using MTF as the evaluation criterion, an inverse sensitivity Monte Carlo analysis method was employed to analyze the preset tolerances of the processing and assembly of the system. The assembly tolerances of Prisms 2 and 5 served as compensators. The preset tolerance values of the system are listed in Table 3 and Table 4.
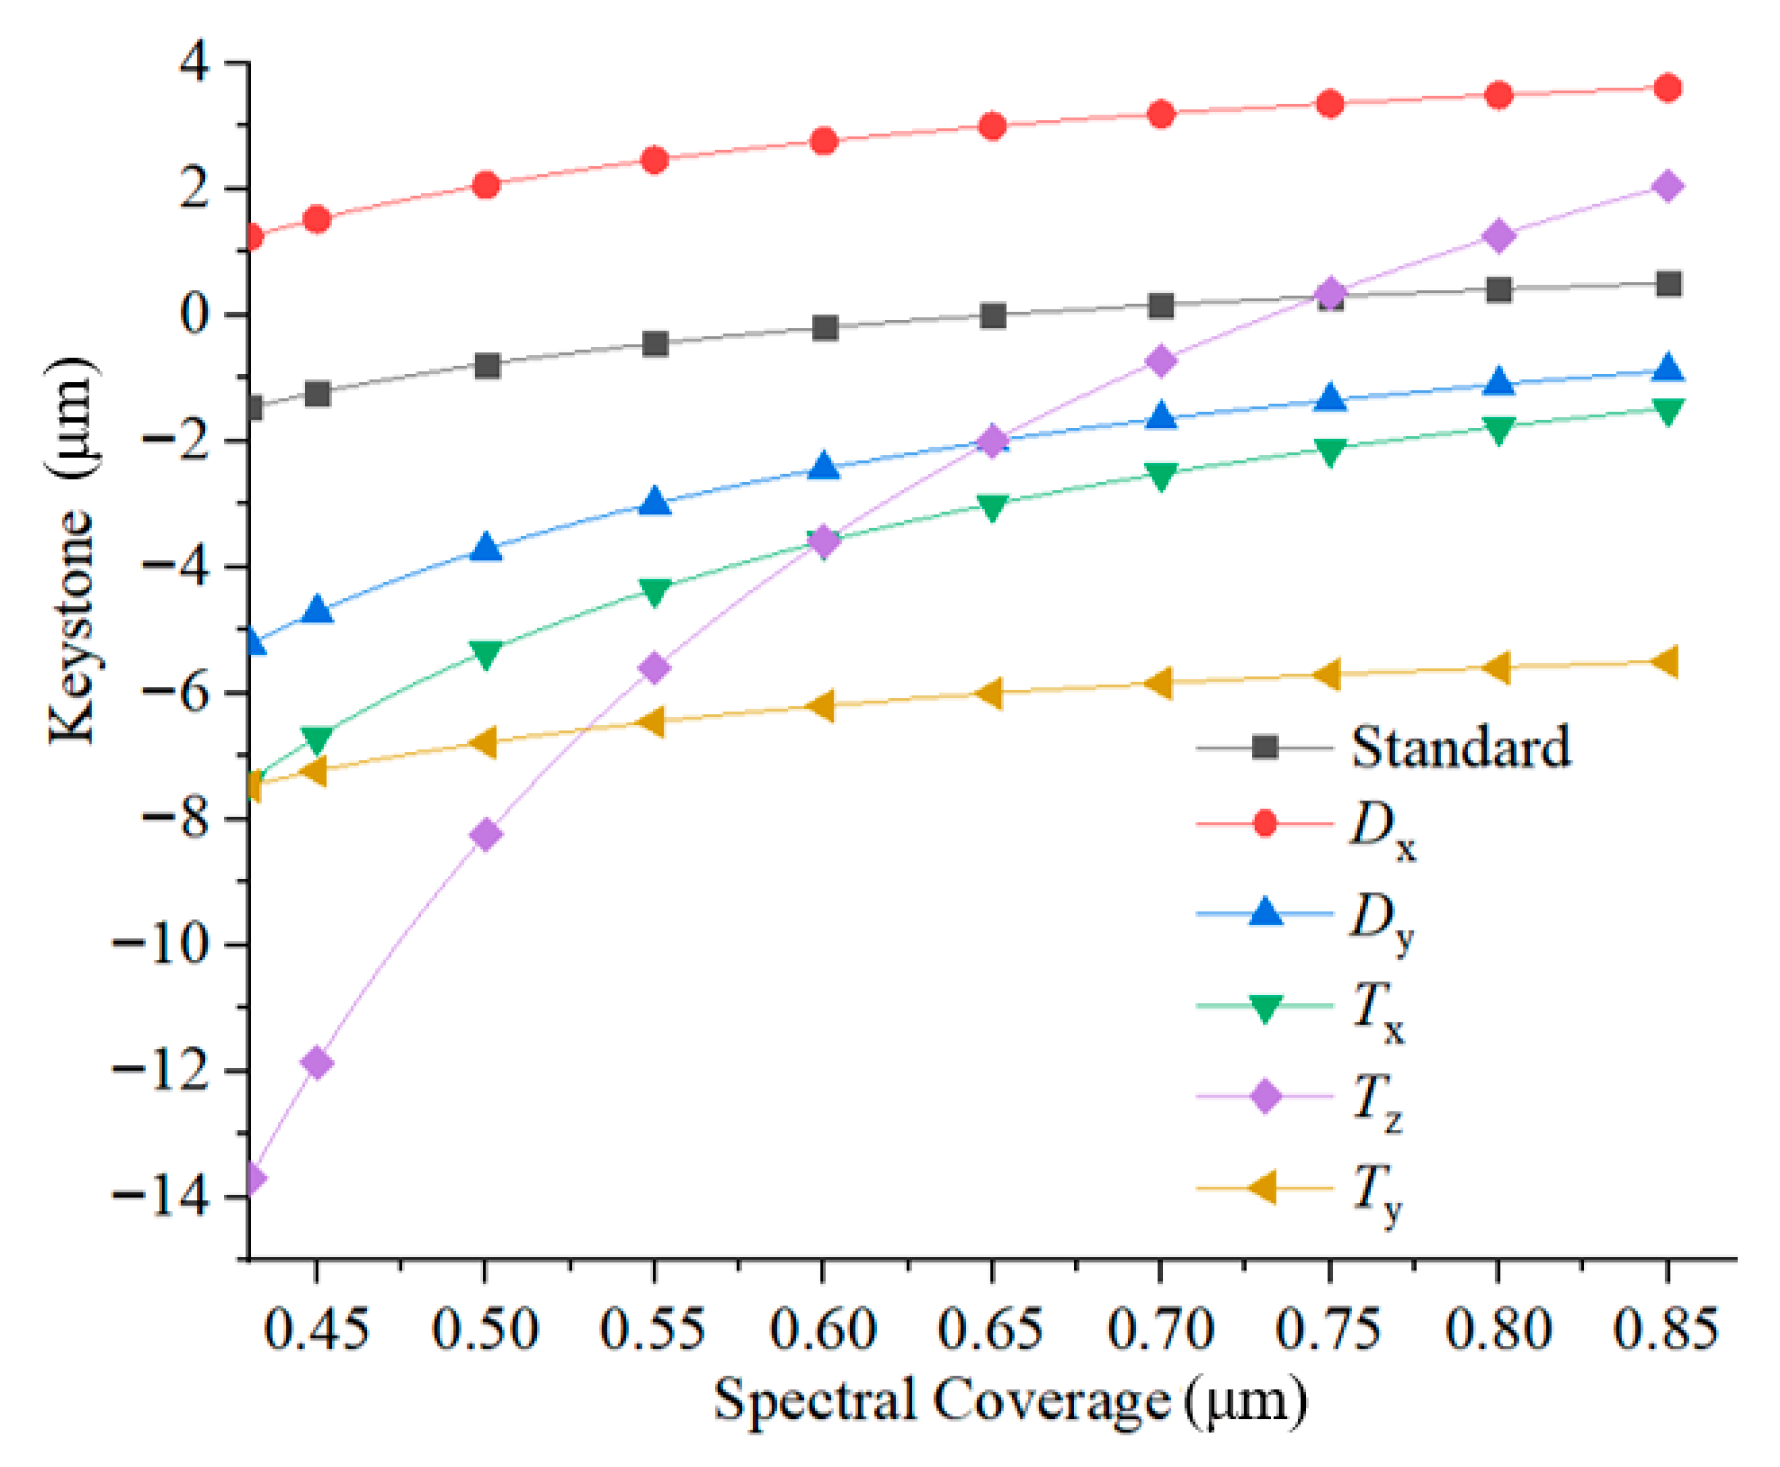
Since the elements can compensate for spectral performance, using Monte Carlo methods to analyze the spectral performance will lead to inaccurate results. The eccentricity of the spectral keystone and tilt adjustment error function includes five variables. The sensitivity of each variable to the spectral keystone is shown in Figure 8, suggesting that the spectral keystone is particularly sensitive to the Tz and Tx tolerance terms.
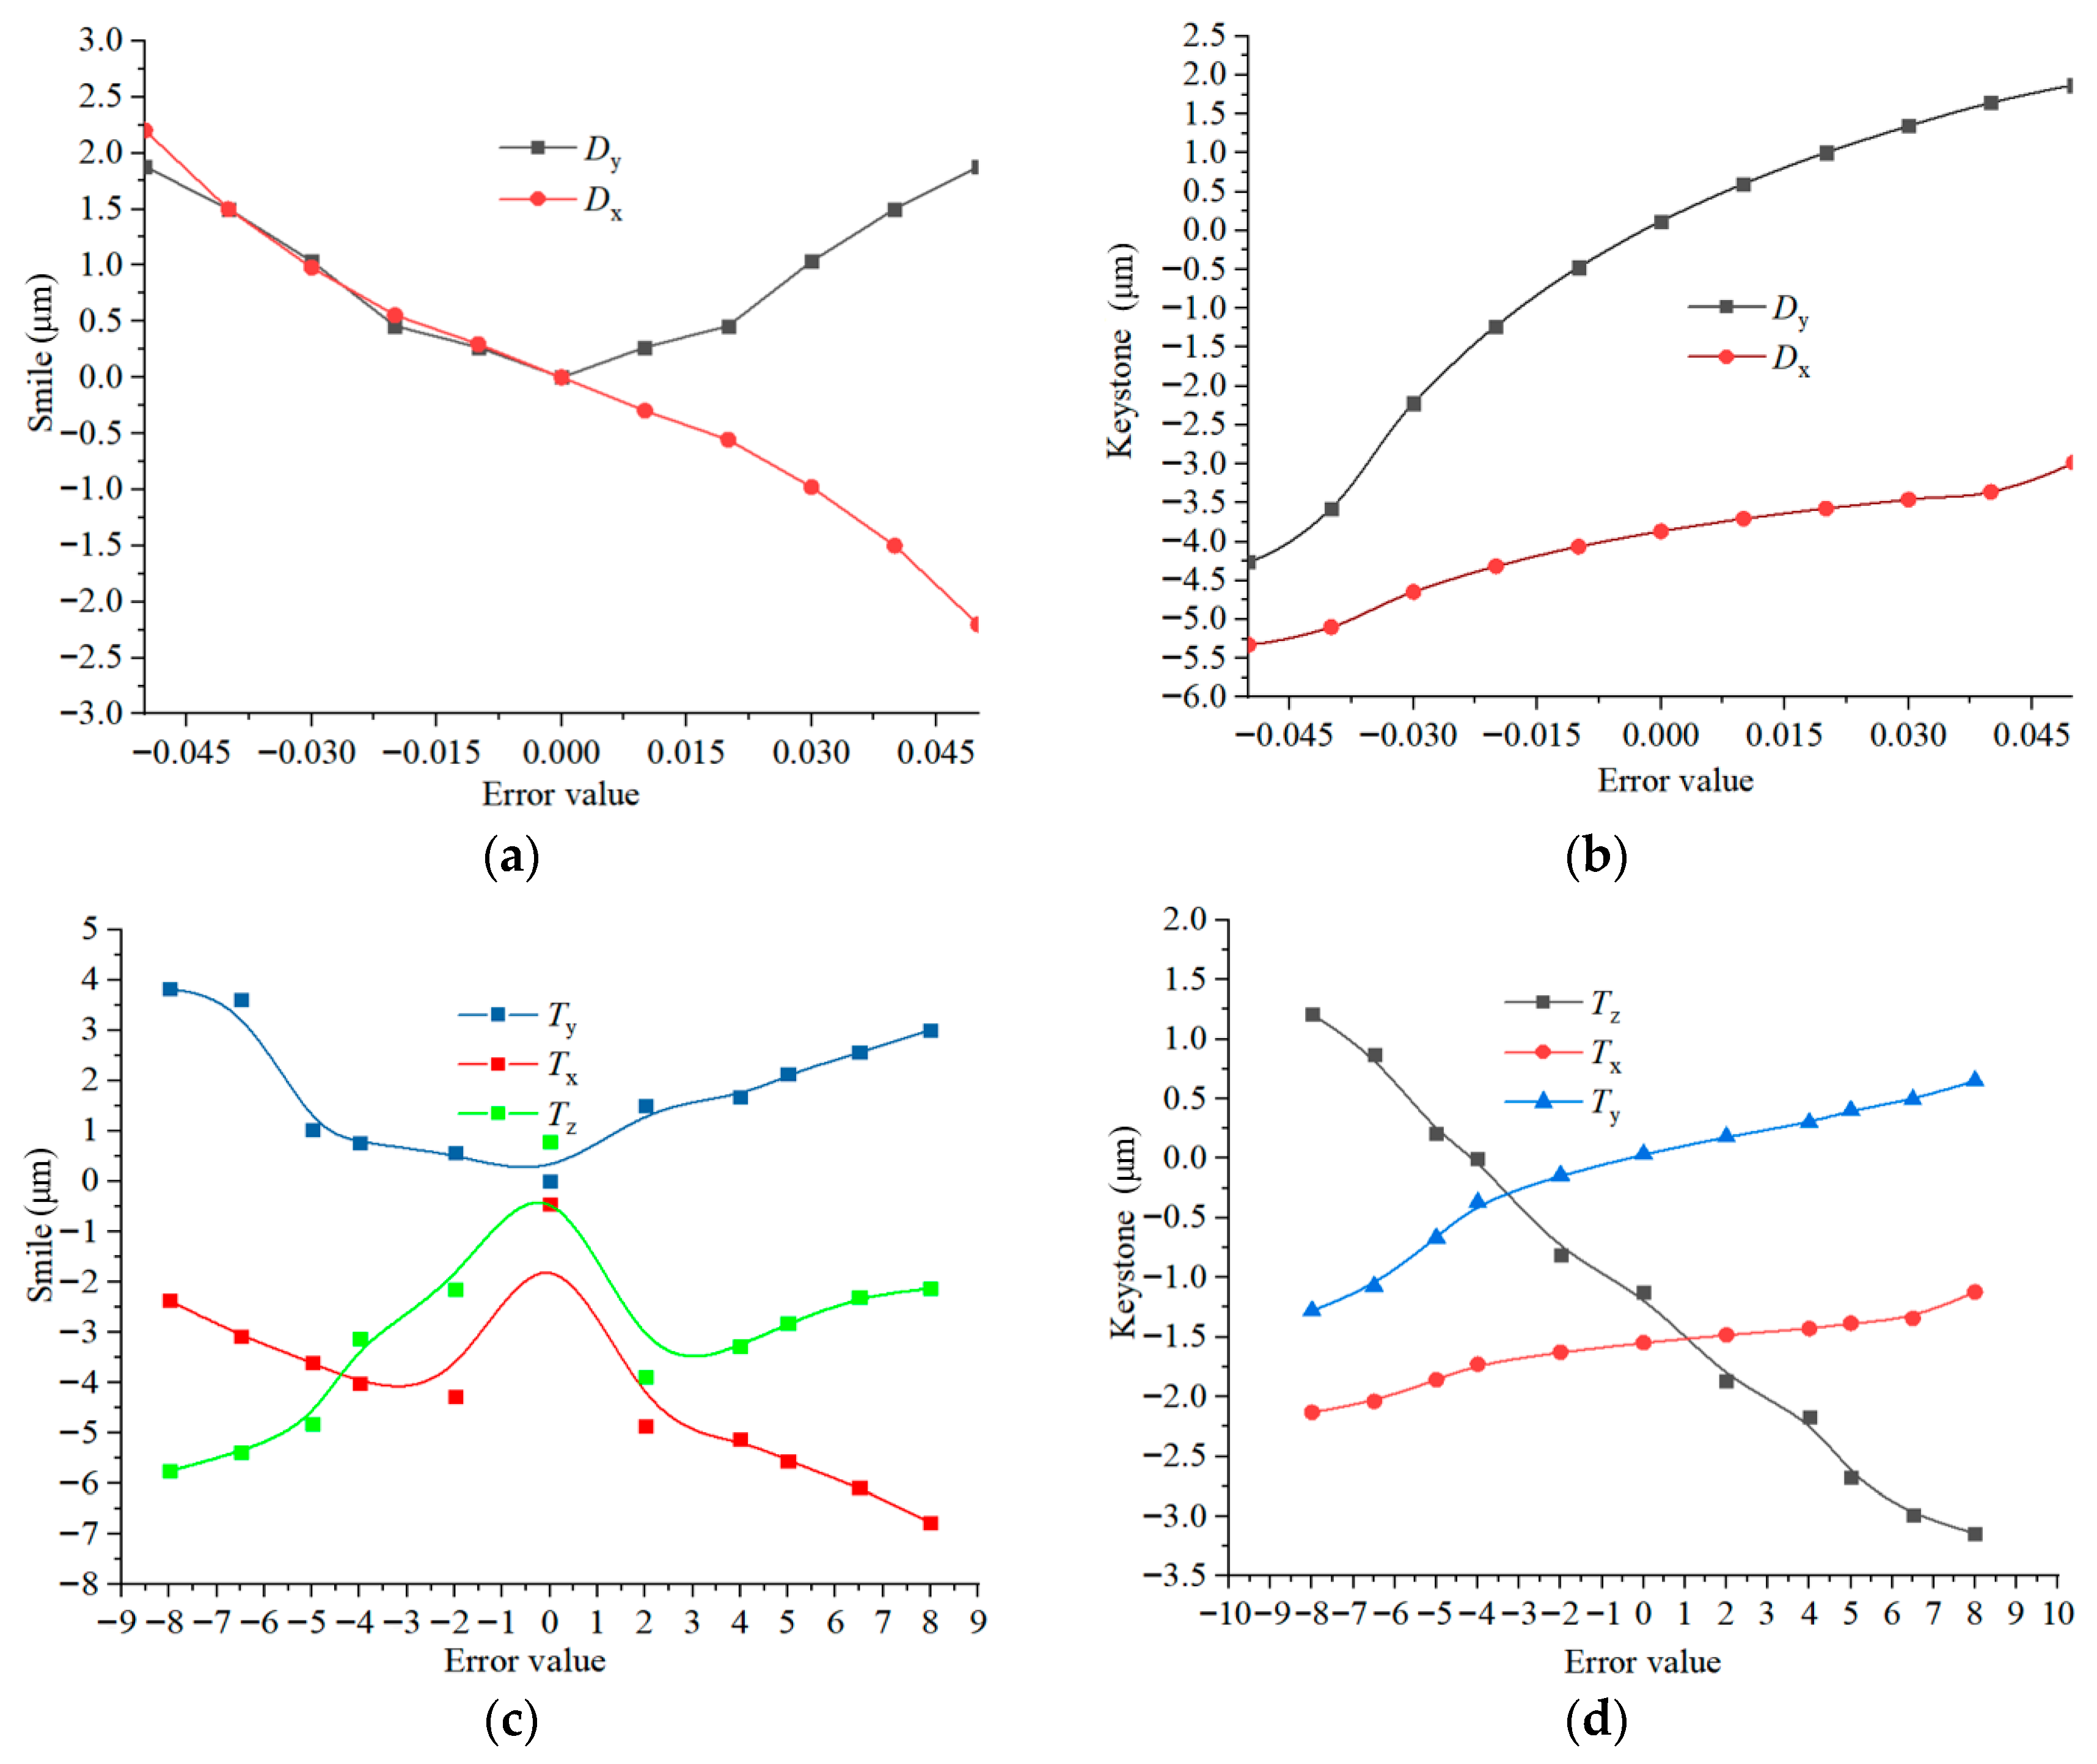
The error ranges for the decentration (Dx, Dy) of the compensation mirror group are set from −0.05 mm to 0.05 mm, and the tilt errors (Tx, Ty, Tz) are set from −8′ to 8′. Taking a wavelength of 0.6328 μm as an example, the sensitivity of the system within this error range is analyzed (Figure 9). The figure indicates that Tz is the most sensitive to the spectral keystone, Dx is the most sensitive to the spectral smile, and individual alignment errors can mutually compensate for each other.
To validate the tolerance sensitivity of the system’s spectral performance, the extremum method was adopted to obtain discrete data for the positive increment of the spectral performance caused by the assembly tolerances. Then, the RSS method was adopted to calculate the maximum positive increment for each discrete datapoint on spectral performance, as shown in the following equation:
RSS = j = 1 N x j 2
From Table 5, it can be concluded that the limit increment of the spectral smile caused by the element eccentricity and tilt assembly tolerances is 1.502 µm, and the maximum design residual of the spectral smile is 5.546 µm. Therefore, the final maximum spectral smile is 7.048 µm, which is less than 7.2 µm (0.3 pixels).

4. Performance Test

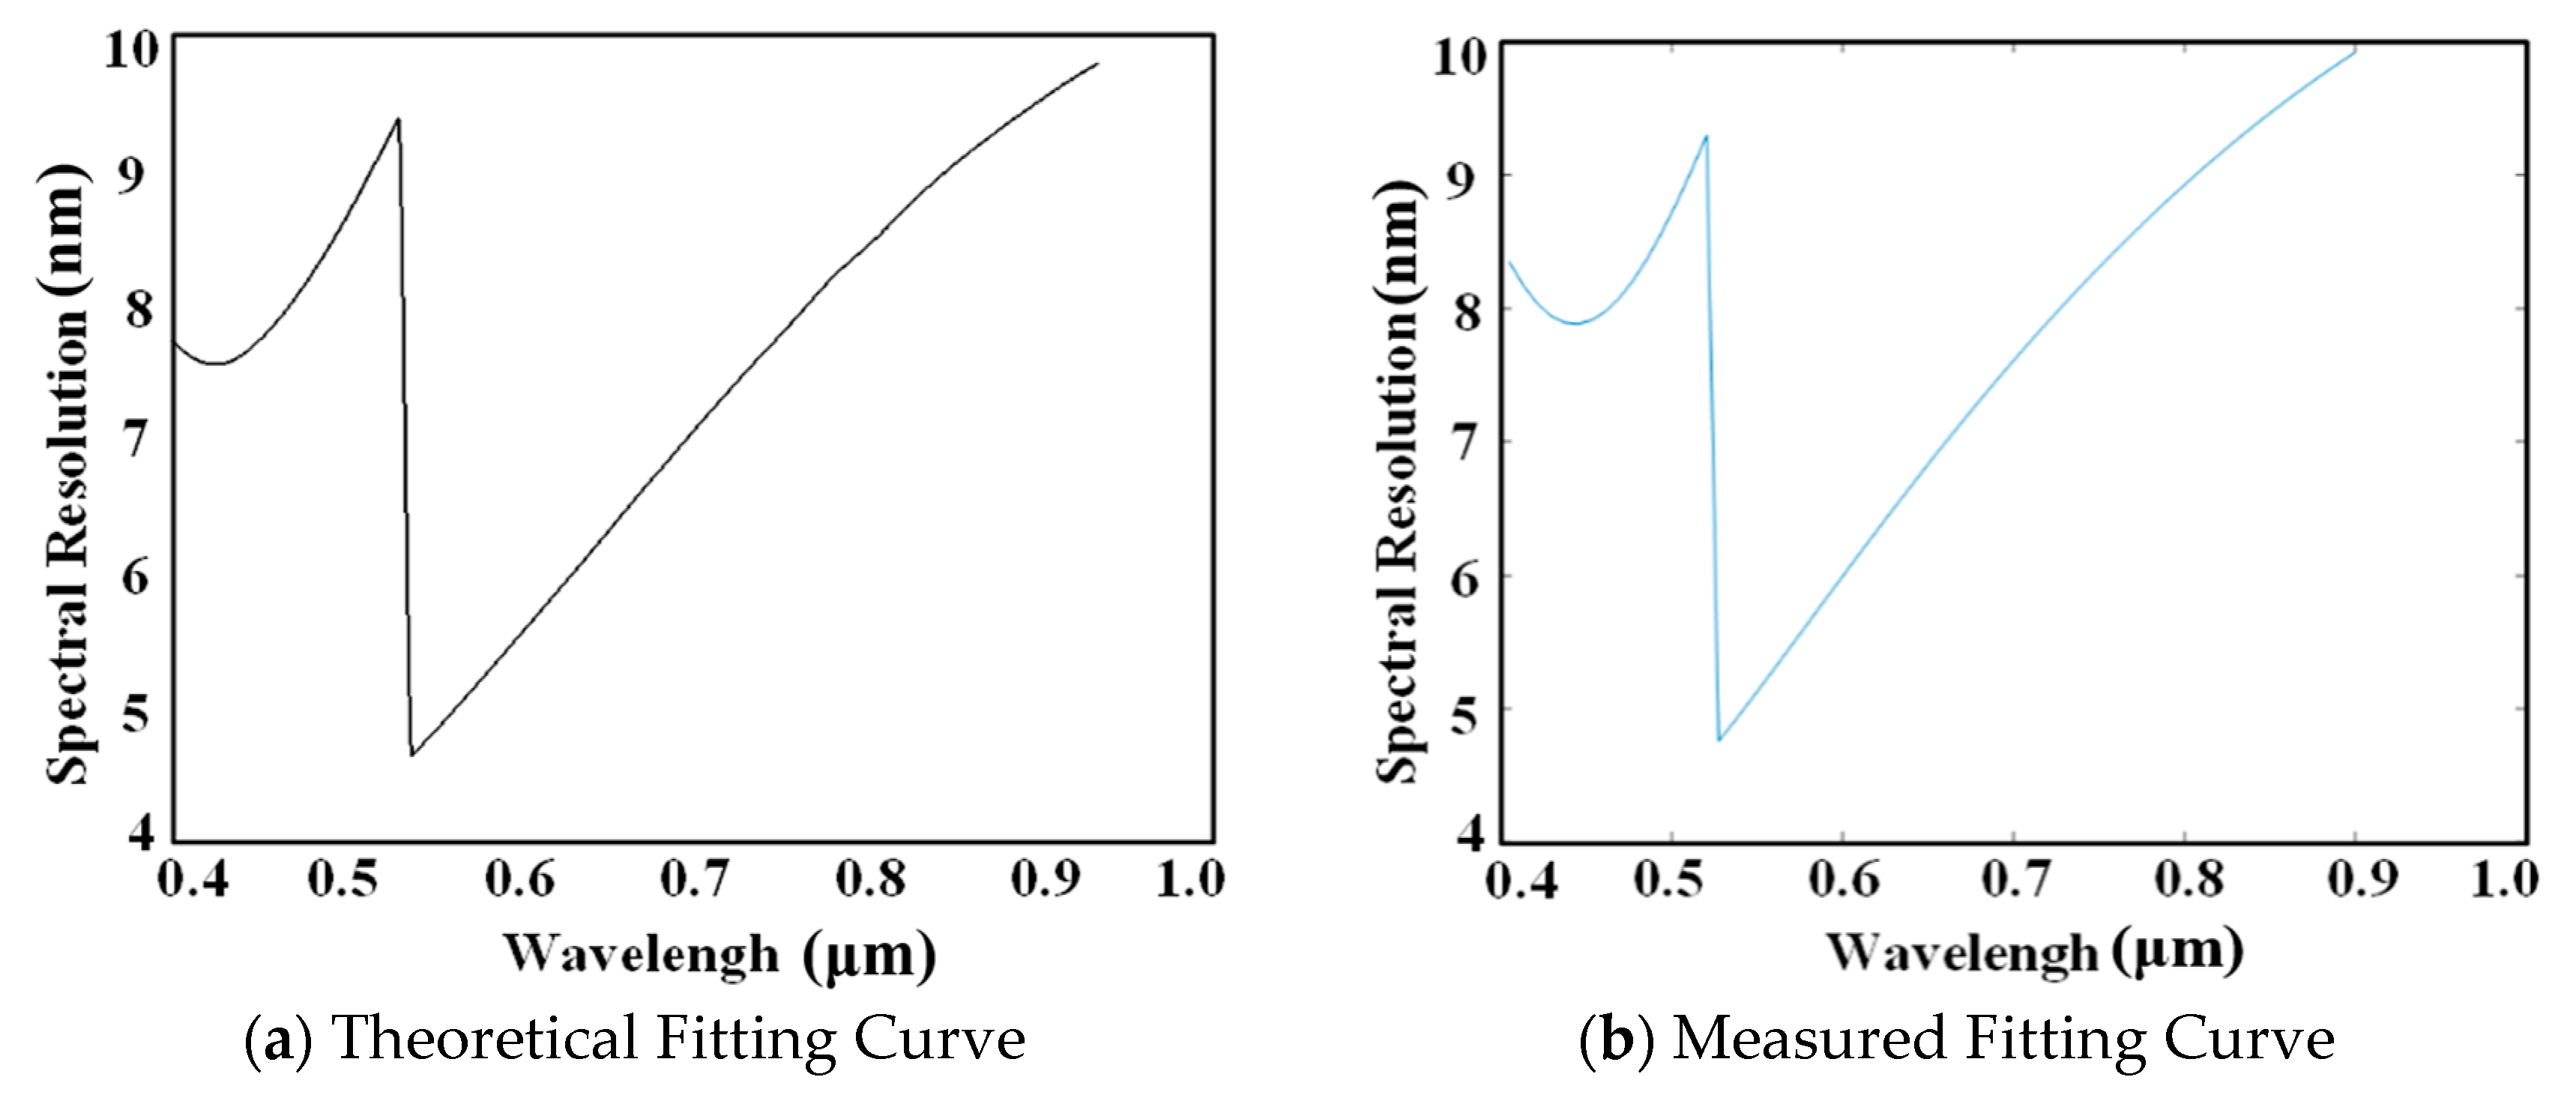
The theoretical fitting curve of the spectral resolution is shown in Figure 10a. The theoretical average sampling resolution of the system is 6.0102 nm, with a theoretical maximum sampling resolution of 9.7781 nm. A monochrometer was used to obtain slit images at the center pixel of each channel. The centroids of these slit images underwent difference fitting, yielding the system’s sampling resolution as shown in Figure 10b. The fitted results show an average sampling resolution of 7.5314 nm and a maximum sampling resolution of 9.9226 nm, aligning closely with the theoretical fitting curve. The test results fully confirm the effectiveness of the off-axis lens group in correcting the spectral smile.
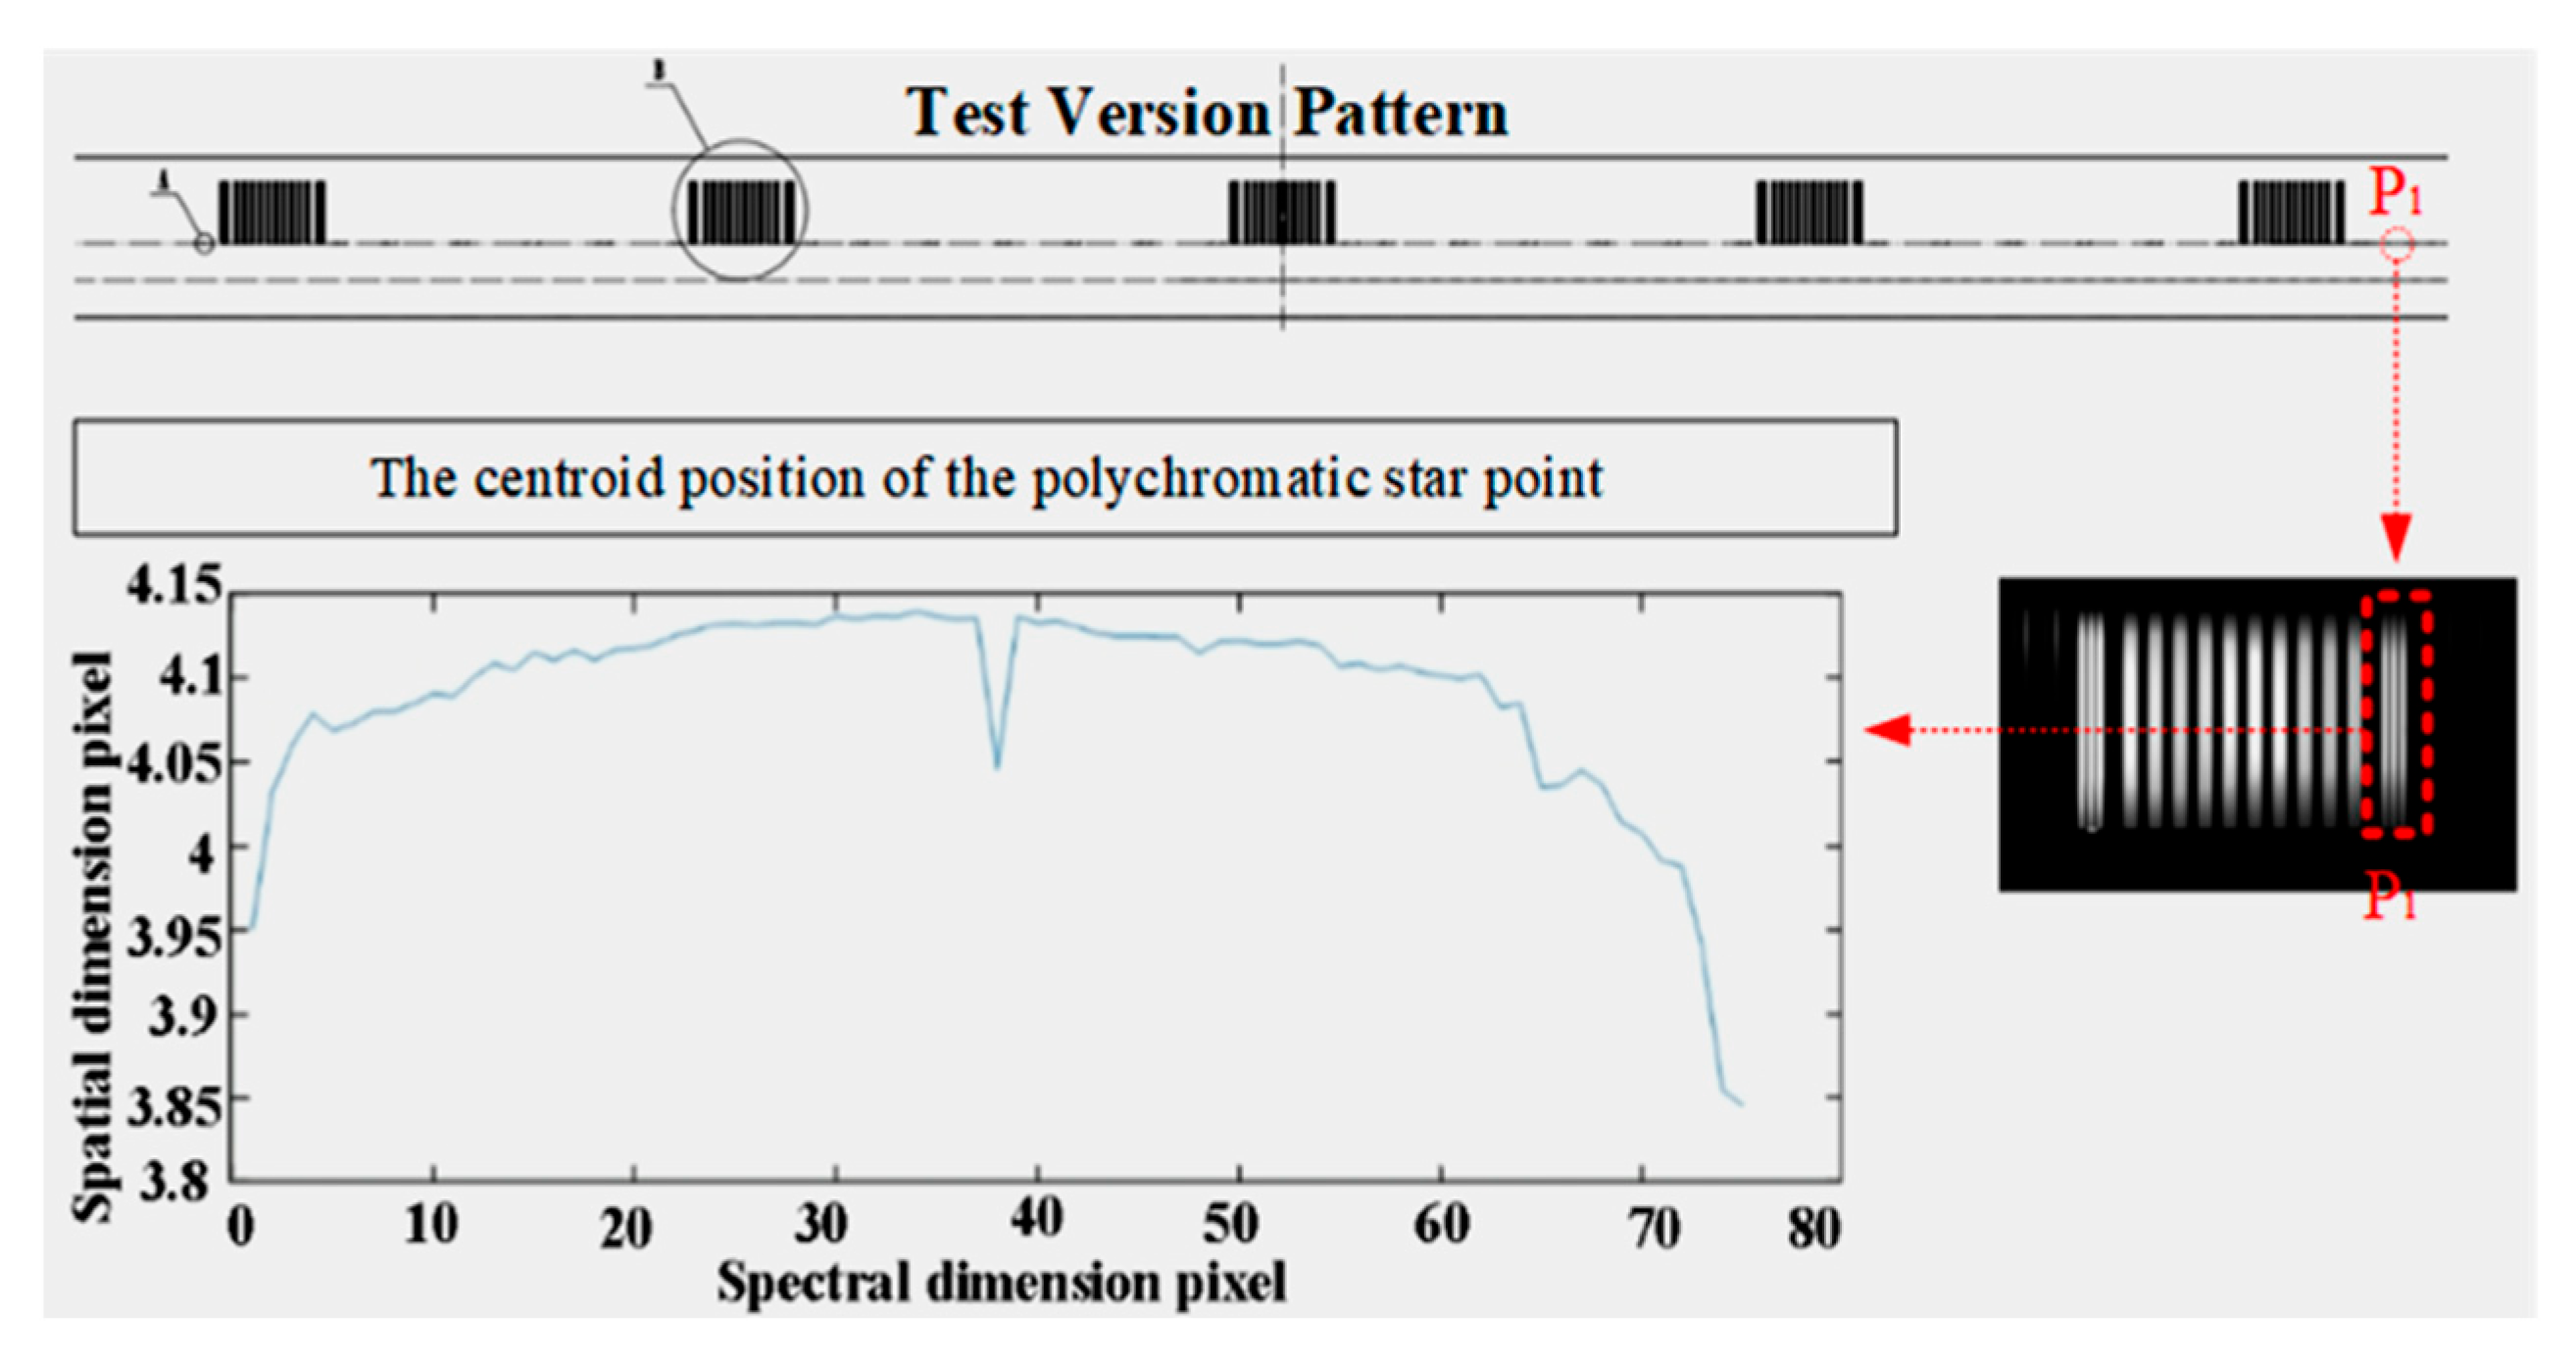
For such systems with complex spatial positions and intricate curved prism processing and assembly, the indicators of the dual slits should be tested. In order to effectively test indicators of the system, a test slit was manufactured, as shown in Figure 11. Slit (1) is the slit image, which can monitor the parallelism between the slit and the CCD and test the spectral smile. Slit (2) are star points and stripe plate that can test the magnification, MTF and spectral keystone of the system. The test striped plate is illustrated in Figure 11. When all indicators meet the requirements, the test slit is rotated 180° for comparative test in both states, ensuring that all indicators of Slit (1) and Slit (2) satisfy the requirements.
The laser at different wavelengths were used to uniformly illuminate the slit. The MTF of the system for different wavelengths at different FOVs were calculated according to Equation (8). The principle schematic diagram of the MTF test is shown in Figure 12. The calculation results of the MTF of the system at different fields of view under wavelengths of 405 nm, 635 nm, 780 nm, and 808 nm are presented in Table 6.
MTF π 4 × ( D N b r i g h t D N d a r k D N b r i g h t + D N d a r k 2 × D N n o i s e )
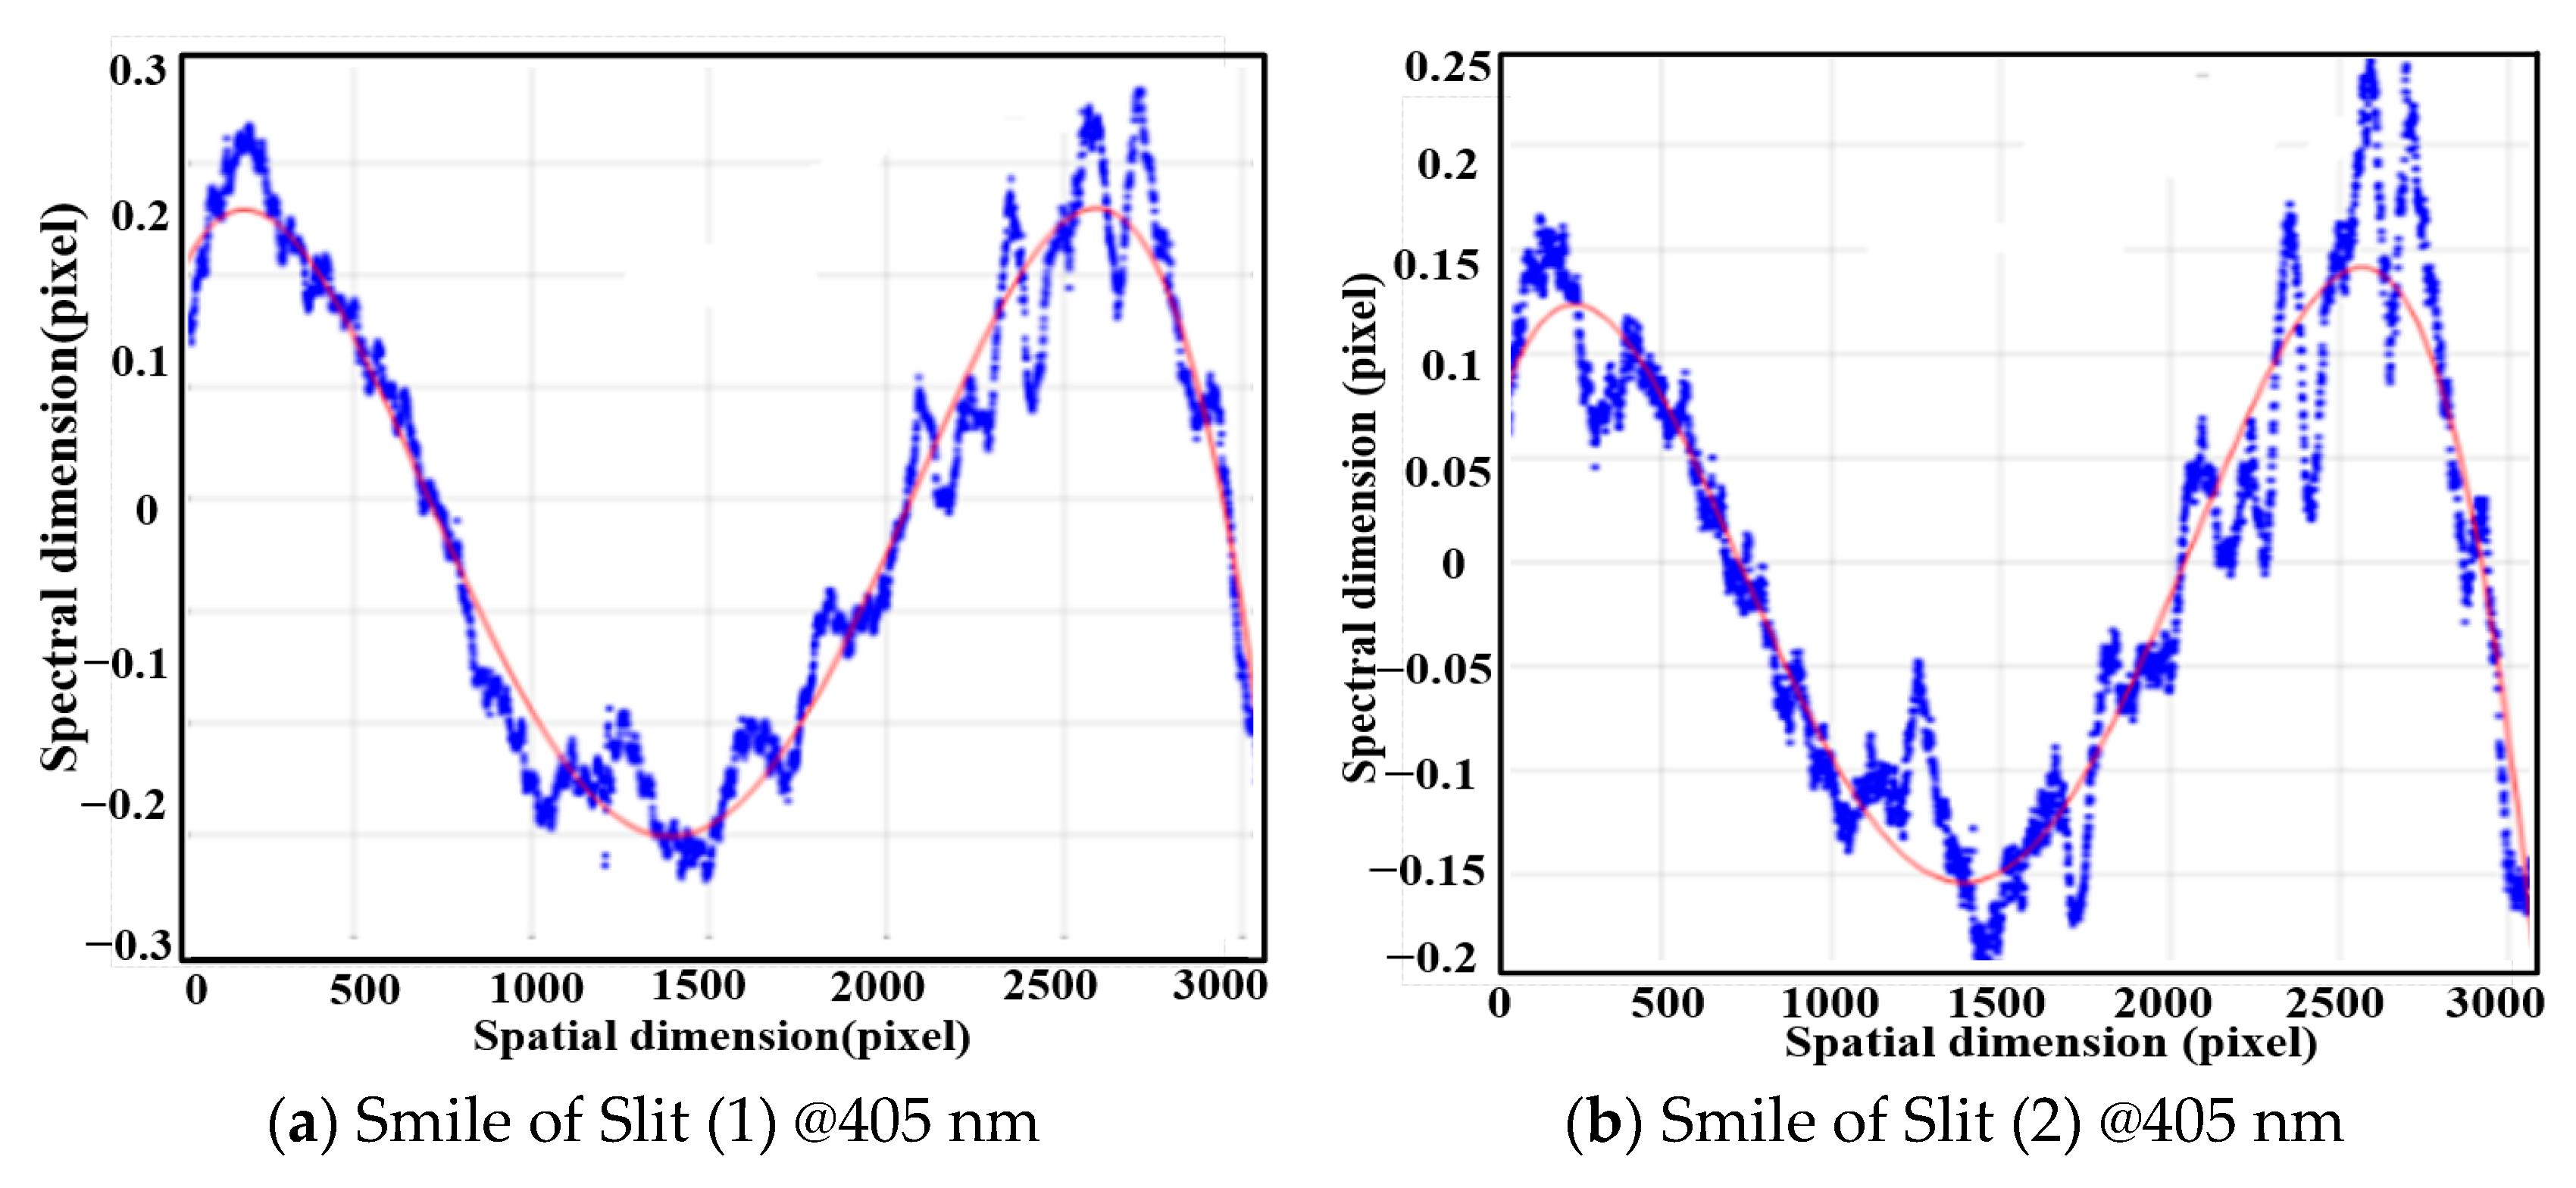
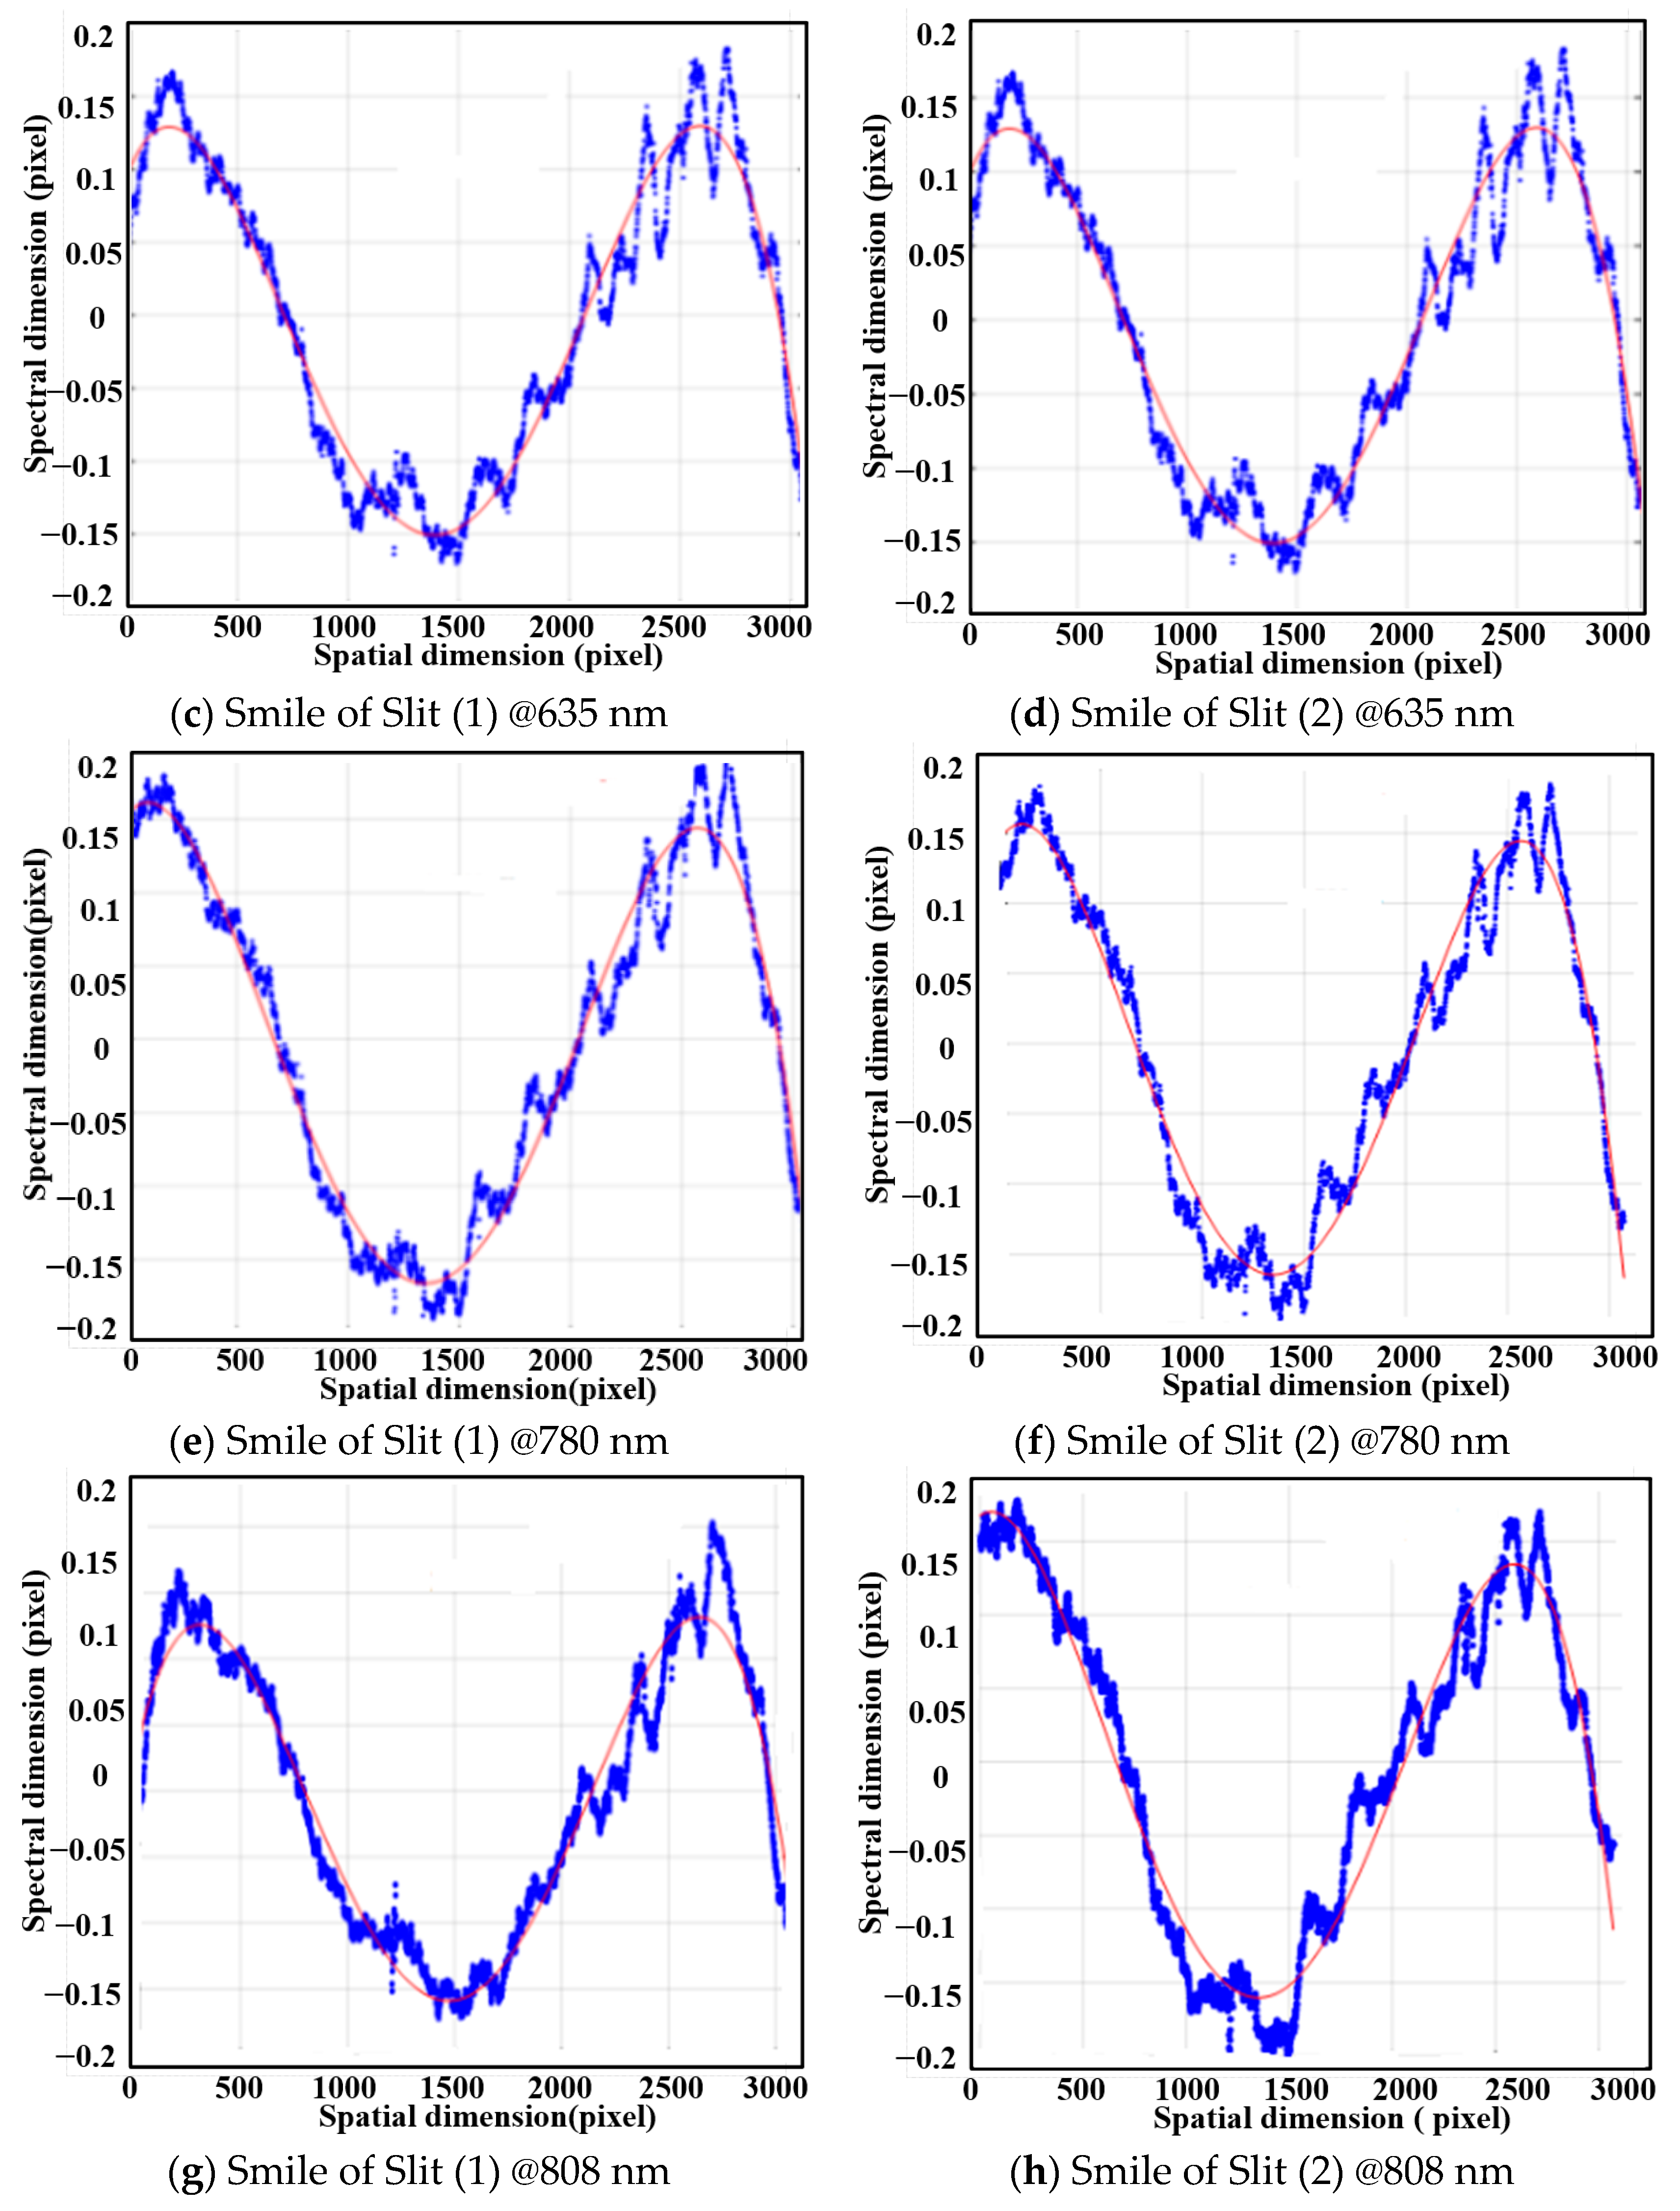
The 405 nm, 635 nm, 780 nm, and 808 nm lasers were used to fit and calculate the spectral smile at different wavelengths. The fitting curves are shown in Figure 13, and the corresponding spectral smile of 0.3669 pixel @405 nm, 0.227 pixel @ 635 nm, 0.3286 pixel @780 nm, and 0.1848 pixel @808 nm.
The spectral lateral deviation data of the system at different wavelengths are listed in Table 7.
Continuous polychromatic spectra were attained through uniform polychromatic light illumination of star point images. The centroids of these spectra were fitted to calculate the keystone of the spectrometer. According to the test results in Figure 14, the maximum spectral keystone reaches 0.2451 pixels.
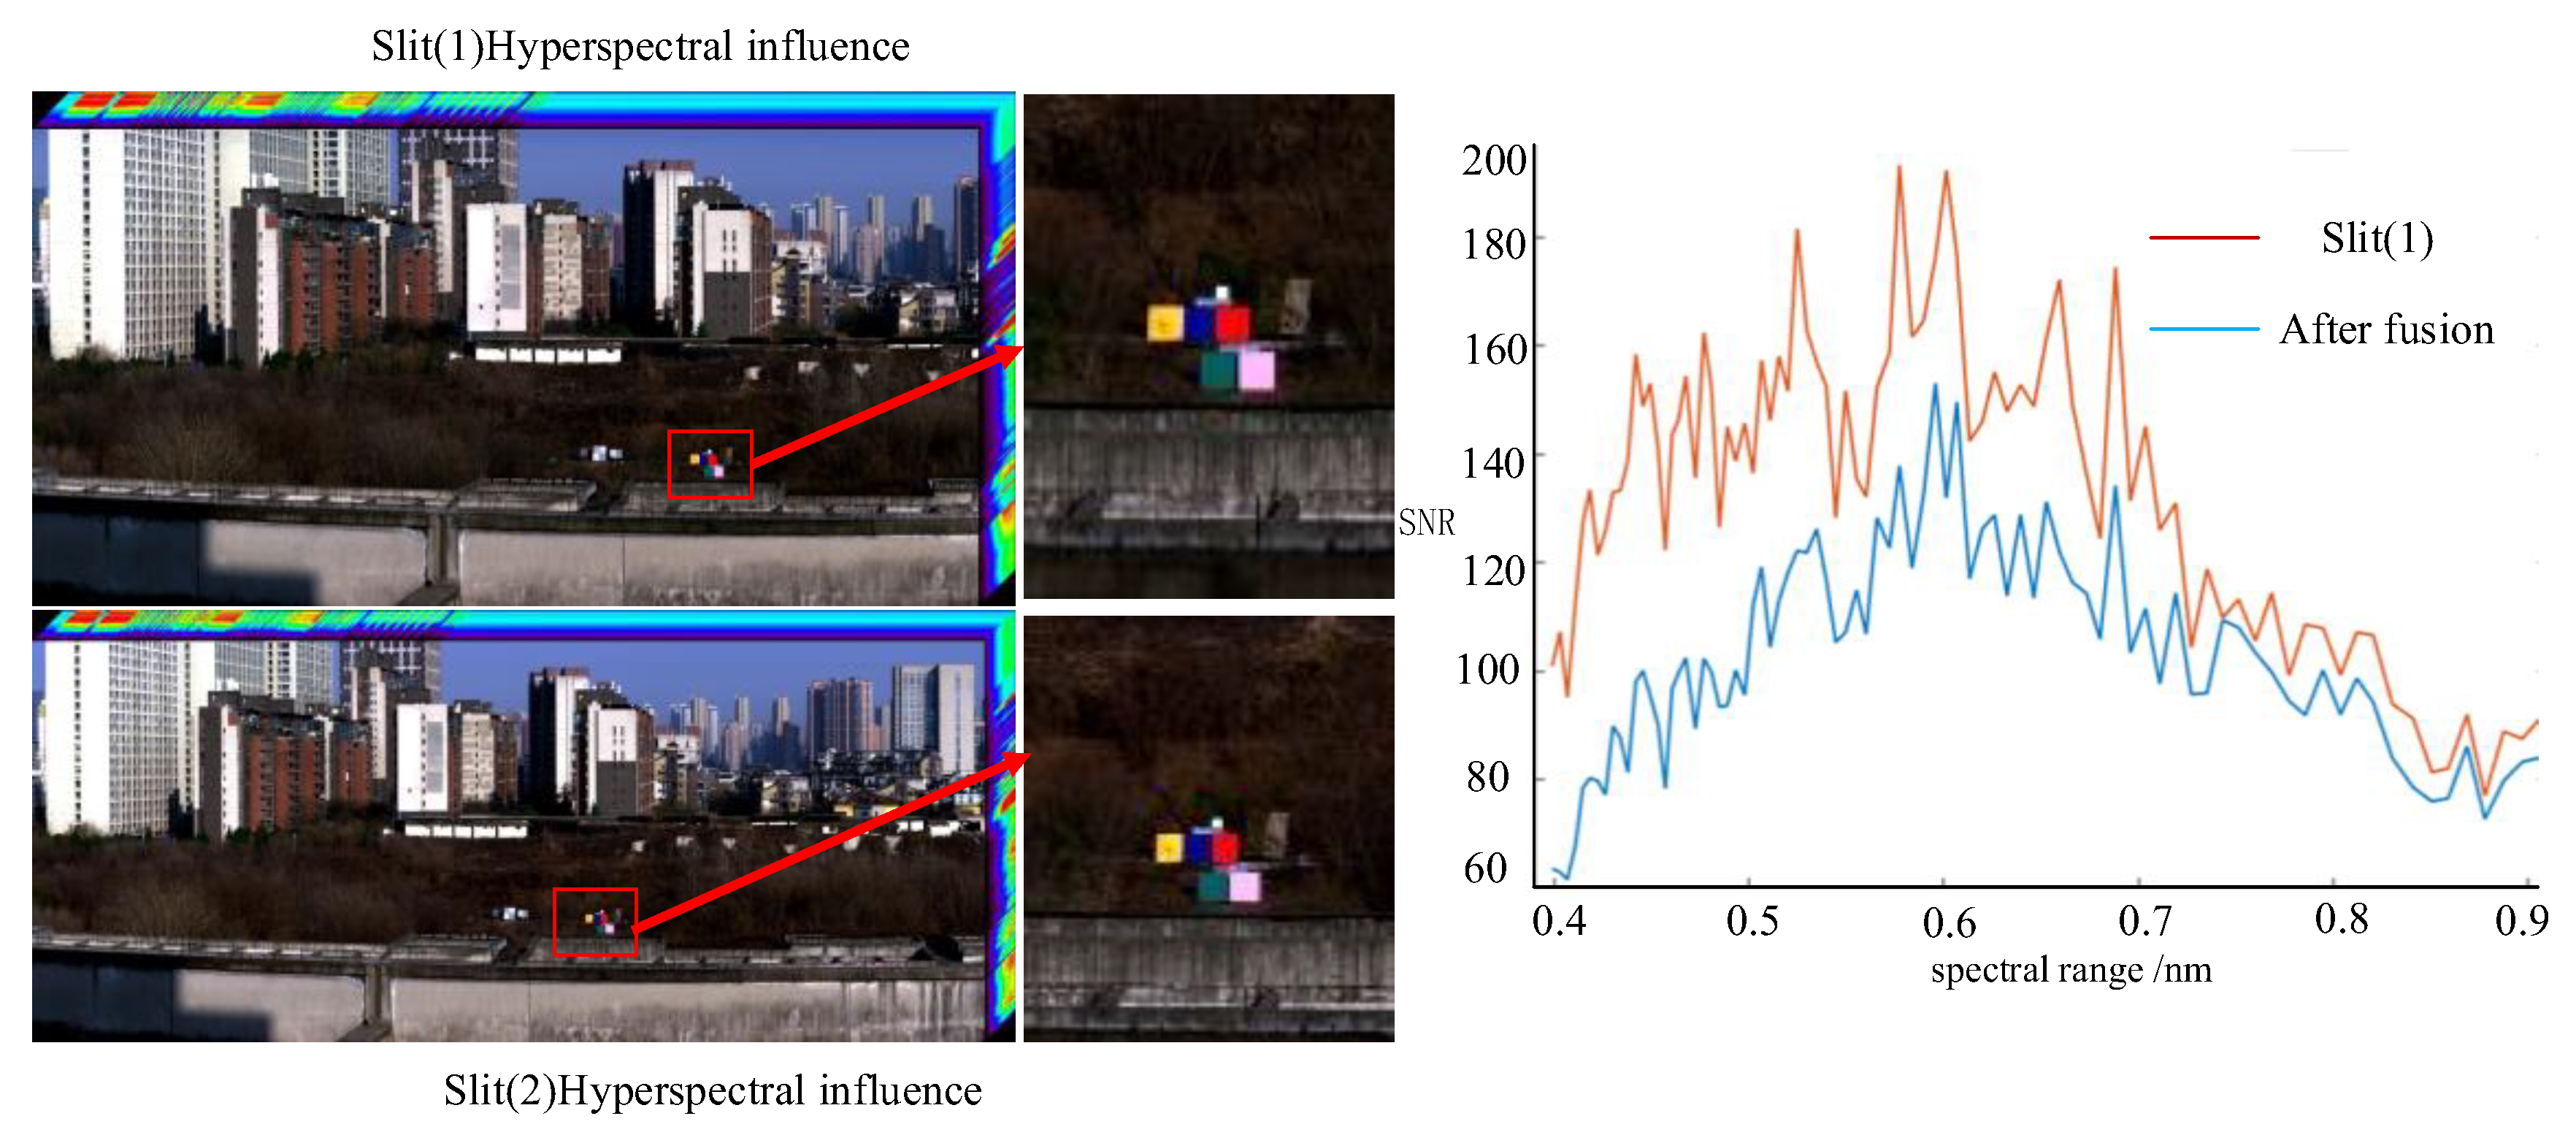
In February 2025, a field push-broom experiment was conducted using the prototype. The double-slit data cube and SNR derived from push-broom scanning are illustrated in Figure 15. The image contours are clearly distinguishable, and the imaging quality is excellent. The SNR after the dual-slit fusion is 1.4 times that of the Slit (1) image.

5. Conclusions

This paper presents a wide-field, dual-slit, low-distortion, and high-sensitivity Offner hyperspectral imager. A sensitivity tolerance analysis method is proposed to improve the dual-slit image fusion precision of the hyperspectral imager and to acquire high-quality image data. The influence of actual assembly errors on spectral performance is evaluated through the Monte Carlo analysis and RSS methods. Finally, the prototype was tested, demonstrating that the SNR of the dual-slit image fusion is 1.4 times that of the single-slit image, significantly improving the detection sensitivity of the system. The test value of the spectral smile and spectral keystone closely align with the design value, effectively validating the feasibility of the inverse-sensitivity Monte Carlo analysis and RSS tolerance analysis methods.

Author Contributions

Conceptualization, X.L. (Xijie Li) and S.L.; Funding acquisition, X.L. (Xijie Li) and S.L.; Methodology, X.L. (Xijie Li) and M.G.; Project administration, Z.Z.; Software, X.F. and X.L. (Xin Lu); Supervision, S.L. and M.G.; Validation, Z.S.; Writing—original draft, X.L. (Xijie Li). All authors have read and agreed to the published version of the manuscript.

Funding

This research was funded by Self-deployment project of Xi’an Institute of Optics and Precision Mechanics of CAS (No. E35543Z501).

Data Availability Statement

The data presented in this study are included in the article.

Conflicts of Interest

The authors declare no conflicts of interest.

References

  1. Hang, L.; Liao, N.; Li, H. High resolution ultraviolet imaging spectrometer for latent image analysis. Opt. Express 2016, 24, 6459–6468. [Google Scholar] [CrossRef] [PubMed]
  2. Sinitsa, L.N.; Serdyukov, V.I.; Emelyanov, N.M.; Marinina, A.; Perevalov, V. LED-based Fourier transform spectroscopy of 14N2 16O in the 9750-12050 cm−1 regions. J. Quant. Spectrosc. Radiat. Transf. 2024, 315, 108888. [Google Scholar] [CrossRef]
  3. Wu, T.; Li, G.; Yang, Z. Shortwave infrared imaging spectroscopy for analysis of ancient paintings. Appl. Spectrosc. 2017, 71, 977–987. [Google Scholar] [CrossRef] [PubMed]
  4. Cui, J.C.; Tang, Y.G.; Han, P.; Pan, M.Z.; Zhang, J.N. Development of diagnostic imaging spectrometer for tumor on-line operation. Opt. Precis. Eng. 2013, 2, 3043–3049. [Google Scholar] [CrossRef]
  5. Bendor, E.; Chabrillat, S.; Demattê, J.A.M. Using imaging spectroscopy to study soil properties. Remote Sens. Environ. 2009, 113, S38–S55. [Google Scholar] [CrossRef]
  6. Sullenberger, R.M.; Milstein, A.B.; Rachlin, Y. Computational reconfigurable imaging spectrometer. Opt. Express 2017, 25, 31960–31969. [Google Scholar] [CrossRef] [PubMed]
  7. Hagen, N.; Kudenov, M.W. Review of snapshot spectral imaging technologies. Opt. Eng. 2013, 52, 090901. [Google Scholar] [CrossRef]
  8. Féry, C. A prism with curved faces, for spectrograph or spectroscope. Astrophys. J. Lett. 1911, 34, 79. [Google Scholar]
  9. Cutter, M.A.; Lobb, D.R.; Williams, T.L.; Renton, R.E. Integration and testing of the compact high-resolution imaging spectrometer (CHRIS). In Proceedings of the SPIE-The International Society for Optical Engineering 1999, Denver, CO, USA, 18–23 July 1999. [Google Scholar]
  10. Kim, D.H.; Yang, S.; Cheon, D.-I.; Lee, S.; Oh, H.-S. Combined estimation method for inertia properties of STSAT-3. J. Mech. Sci. Technol. 2010, 24, 1737–1741. [Google Scholar] [CrossRef]
  11. Kaiser, S.; Sang, B.; Schubert, J.; Hofer, S.; Stuffler, T. Compact prism spectrometer of pushbroom type for hyperspectral imaging. In Proceedings of the SPIE—The International Society for Optical Engineering 2008, Scotland, UK, 1 September 2008. [Google Scholar]
  12. Nie, Y.F.; Bin, X.; Zhou, J.S.; Huang, M. A Wide-Field Push-Broom Hyperspectral Imager Based on Curved Prism. Spectrosc. Spectr. Anal. 2012, 32, 1708–1711. [Google Scholar]
  13. Moore, L.B.; Bender, H.A.; Bradley, C.L.; Haag, J.M.; Zandbergen, S.; Green, R.O.; Mouroulis, P. Recent developments in tolerancing methods forimaging spectrometers. In Proceedings of the Optical System Alignment, Tolerancing, and Verification XIII, Online, 24 August–4 September 2020. [Google Scholar]
  14. Ku, H.; Kim, S.H.; Kong, H.J.; Lee, J.H. Optical design; performance, and tolerancing of an Offner imaging spectrograph. In Proceedings of the Optical System Alignment, Tolerancing, and Verification VI, San Diego, CA, USA, 12–16 August 2012. [Google Scholar]
  15. Feng, L.; Zhou, J.; Wei, L.; He, X.; Li, Y.; Jing, J.; Xiangli, B. Design of a compact wide-spectrum double-channel prism imaging spectrometer with freeform surface. Appl. Opt. 2018, 57, 9512–9522. [Google Scholar] [CrossRef] [PubMed]
  16. Jing, J.; Zhou, J.; Li, Y.; Feng, L. Spectral curvature correction method based on inverse on inverse distance weighted interpolation. In Proceedings of the Image and Signal Processing for Remote Sensing XXII, Edinburgh, UK, 26–29 September 2016. [Google Scholar]
  17. Ji, Y.; Han, J.; Zhao, S.W.C. Ultra-compact dual band imaging spectrometer with freeform prisms. Appl. Opt. 2023, 62, 5991–5998. [Google Scholar] [CrossRef] [PubMed]
  18. Zhang, X.; Fang, X.; Li, T.; Wang, X.X.; Gu, G.C.; Li, H.S.; Lin, G.Y.; Li, B. Design method for eliminating spectral line tilt in a multiple sub-pupil ultra-spectral imager (MSPUI). Opt. Express 2024, 32, 17. [Google Scholar] [CrossRef] [PubMed]
  19. Zhang, J.; Lin, C.; Ji, Z.; Wu, H.; Li, C.; Du, B.; Zheng, Y. Design of a compact hyperspectral imagingspectrometer with freeform surface based on anastigmatism. Appl. Opt. 2020, 59, 1715–1725. [Google Scholar] [CrossRef] [PubMed]
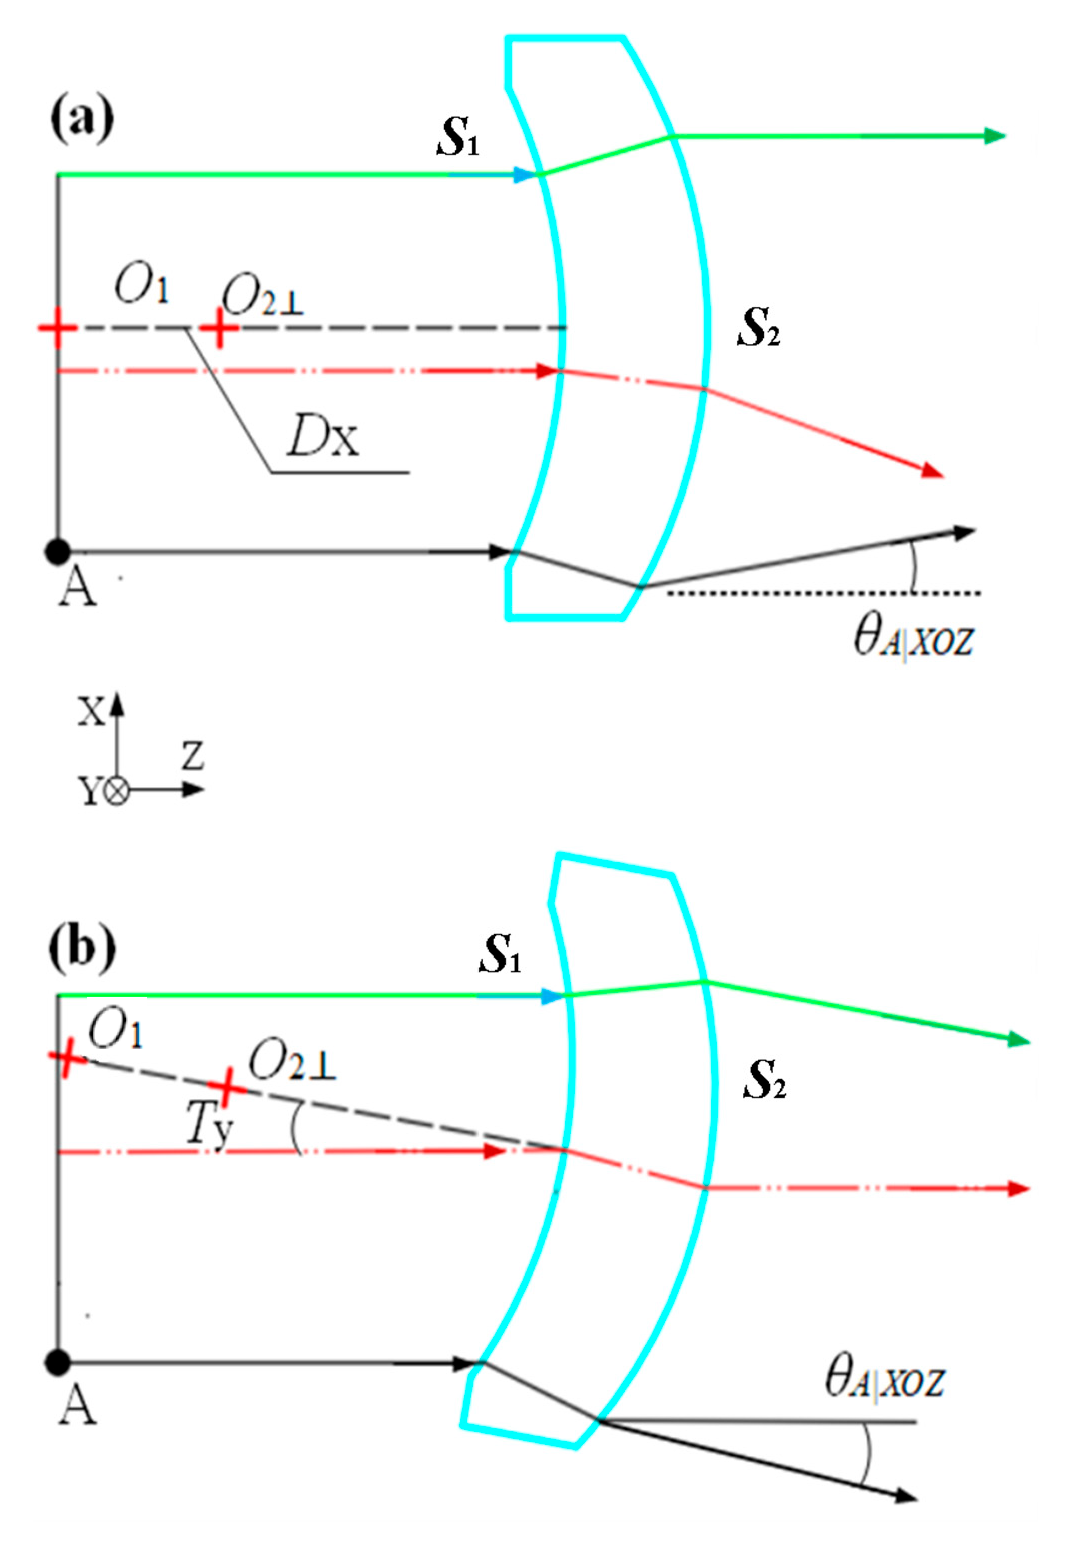
Figure 1. Schematic diagram of assembly error of the curved prism. (a) Assembly decentration error; (b) Assembly tilt error.
Sensors 25 06478 g001
Figure 2. Optical path diagram of the spectroscopic system.
Sensors 25 06478 g002
Figure 3. Matrix spot diagrams of the system at different sampling wavelengths and slit lengths.
Sensors 25 06478 g003
Figure 4. MTF of the system at different wavelengths.
Sensors 25 06478 g004
Figure 5. Spectral smile of the system at different wavelengths.
Sensors 25 06478 g005
Figure 6. Spectral keystone curve of the system at different FOVs.
Sensors 25 06478 g006
Figure 7. Spectral lateral deviation curve of the system at different wavelengths.
Sensors 25 06478 g007
Figure 8. Influence of error perturbation on spectral keystone at different wavelengths.
Sensors 25 06478 g008
Figure 9. Spectral smile and spectral keystone under tilt and decentration errors. (a,b) present the influences of tilt on spectral smile and spectral keystone, respectively; (c,d) present the influences of decentration on spectral smile and spectral keystone, respectively.
Sensors 25 06478 g009
Figure 10. The fitting curves of the spectral resolution.
Sensors 25 06478 g010
Figure 11. Test version pattern.
Sensors 25 06478 g011
Figure 12. Principle schematic diagram of the MTF test.
Sensors 25 06478 g012
Figure 13. Measured fitting curves of spectral smile of the system at different wavelengths.
Sensors 25 06478 g013aSensors 25 06478 g013b
Figure 14. Test fitting curve of spectral keystone.
Sensors 25 06478 g014
Figure 15. Field push-broom data cube of the hyperspectral imager.
Sensors 25 06478 g015
Table 1. System specification.
ParametersValue
Wavelength0.4 μm~0.9 μm
Spectral Resolution≤10 nm
Width of Slit24 μm
Length of Slit73 mm
Pixel size24 μm
Image format3072 × 256
Relative aperture0.15
Spectral band68
lateral magnification1:1
Spectral lateral deviation≤3 nm
Spectral keystone≤0.3 pixel
Object’s telecentricity≤0.5°
Table 2. Optical parameters.
TypeCurvature
/mm
Prism Thickness
/mm
Air Space
/mm
Optical MaterialPrism Wedge Angle/°Off-Axis/mmTilt
L1−367.823850.82H-K9L10.39111.25.85
−418.365
L2−426.9526.5149.7H-TF82.2565.18.98
−449
L3−218.0240127.5F_SILICA-80−5.64
L4−383.561.752H-K9L13.15185.55−26.05
−415.323
L5−435.48635.5126H-TF84.213209.5−16.83
−460.724
Table 3. The preset machining tolerance of the system.
TypeΔR/mmΔd/mmΔθyRMS @632.8 nm
L10.0470.0310.4°1/45λ
L20.0510.032.2°1/45λ
L30.020.1-1/70λ
L40.0360.0313.06°1/45λ
L50.0410.033.91°1/45λ
Table 4. The preset assembly tolerances of the system.
Relative Positional DeviationNotes
TypeΔx (mm)Δy (mm)Δz (mm)Δθx (°)Δθy (°)Δθz (°)
L10.030.030.0315″15″15″
L20.030.030.0315″15″15″Compensator
L3------Reference
L40.030.030.0310″10″15″
L50.030.030.0310″10″15″Compensator
Table 5. The influence of actual assembly errors on spectral performance based on RSS method.
TypeTilt ErrorEccentric Error
ΔSmile (μm)ΔKeystone (μm)ΔSmile (μm)ΔKeystone (μm)
θxθyθzθxθyθzΔxΔyΔxΔy
L10.1150.1260.4150.020.050.080.0450.040.0240.003
L20.8210.0020.130.0410.001120.10.0050.3510.0030.005
L40.1820.6480.5370.030.0180.120.410.040.210.015
L50.47980.330.1450.0420.1210.270.0120.0170.1420.021
RSS1.4120.35480.5449580.256
Table 6. MTF calculation results for different wavelengths at different FOVs.
TypeSlit(1) MTF AverageSlit(2) MTF Average
−1 h0 h1 h−1 h0 h1 h
405 nm0.52790.55490.44670.5210.5050.489
635 nm0.5410.56110.51120.5710.5520.478
780 nm0.5040.5450.4810.5780.5670.459
808 nm05690.5630.4870.5840.5080.487
Table 7. Measured data of spectral lateral deviation.
NumberWavelength
/nm
Smile
/pixel
Spectral Resolution/nmSpectral Lateral Deviation/nm
1405 nm0.36693.7 nm1.36 nm
2635 nm0.22706.5 nm1.48 nm
3780 nm0.32868.7 nm2.86 nm
4808 nm0.18489.0 nm1.66 nm
Disclaimer/Publisher’s Note: The statements, opinions and data contained in all publications are solely those of the individual author(s) and contributor(s) and not of MDPI and/or the editor(s). MDPI and/or the editor(s) disclaim responsibility for any injury to people or property resulting from any ideas, methods, instructions or products referred to in the content.