
Exploring Effects of Mental Stress with Data Augmentation and Classification Using fNIRS

 , , , and
Abstract
1. Introduction
2. Materials and Methods
2.1. Participants
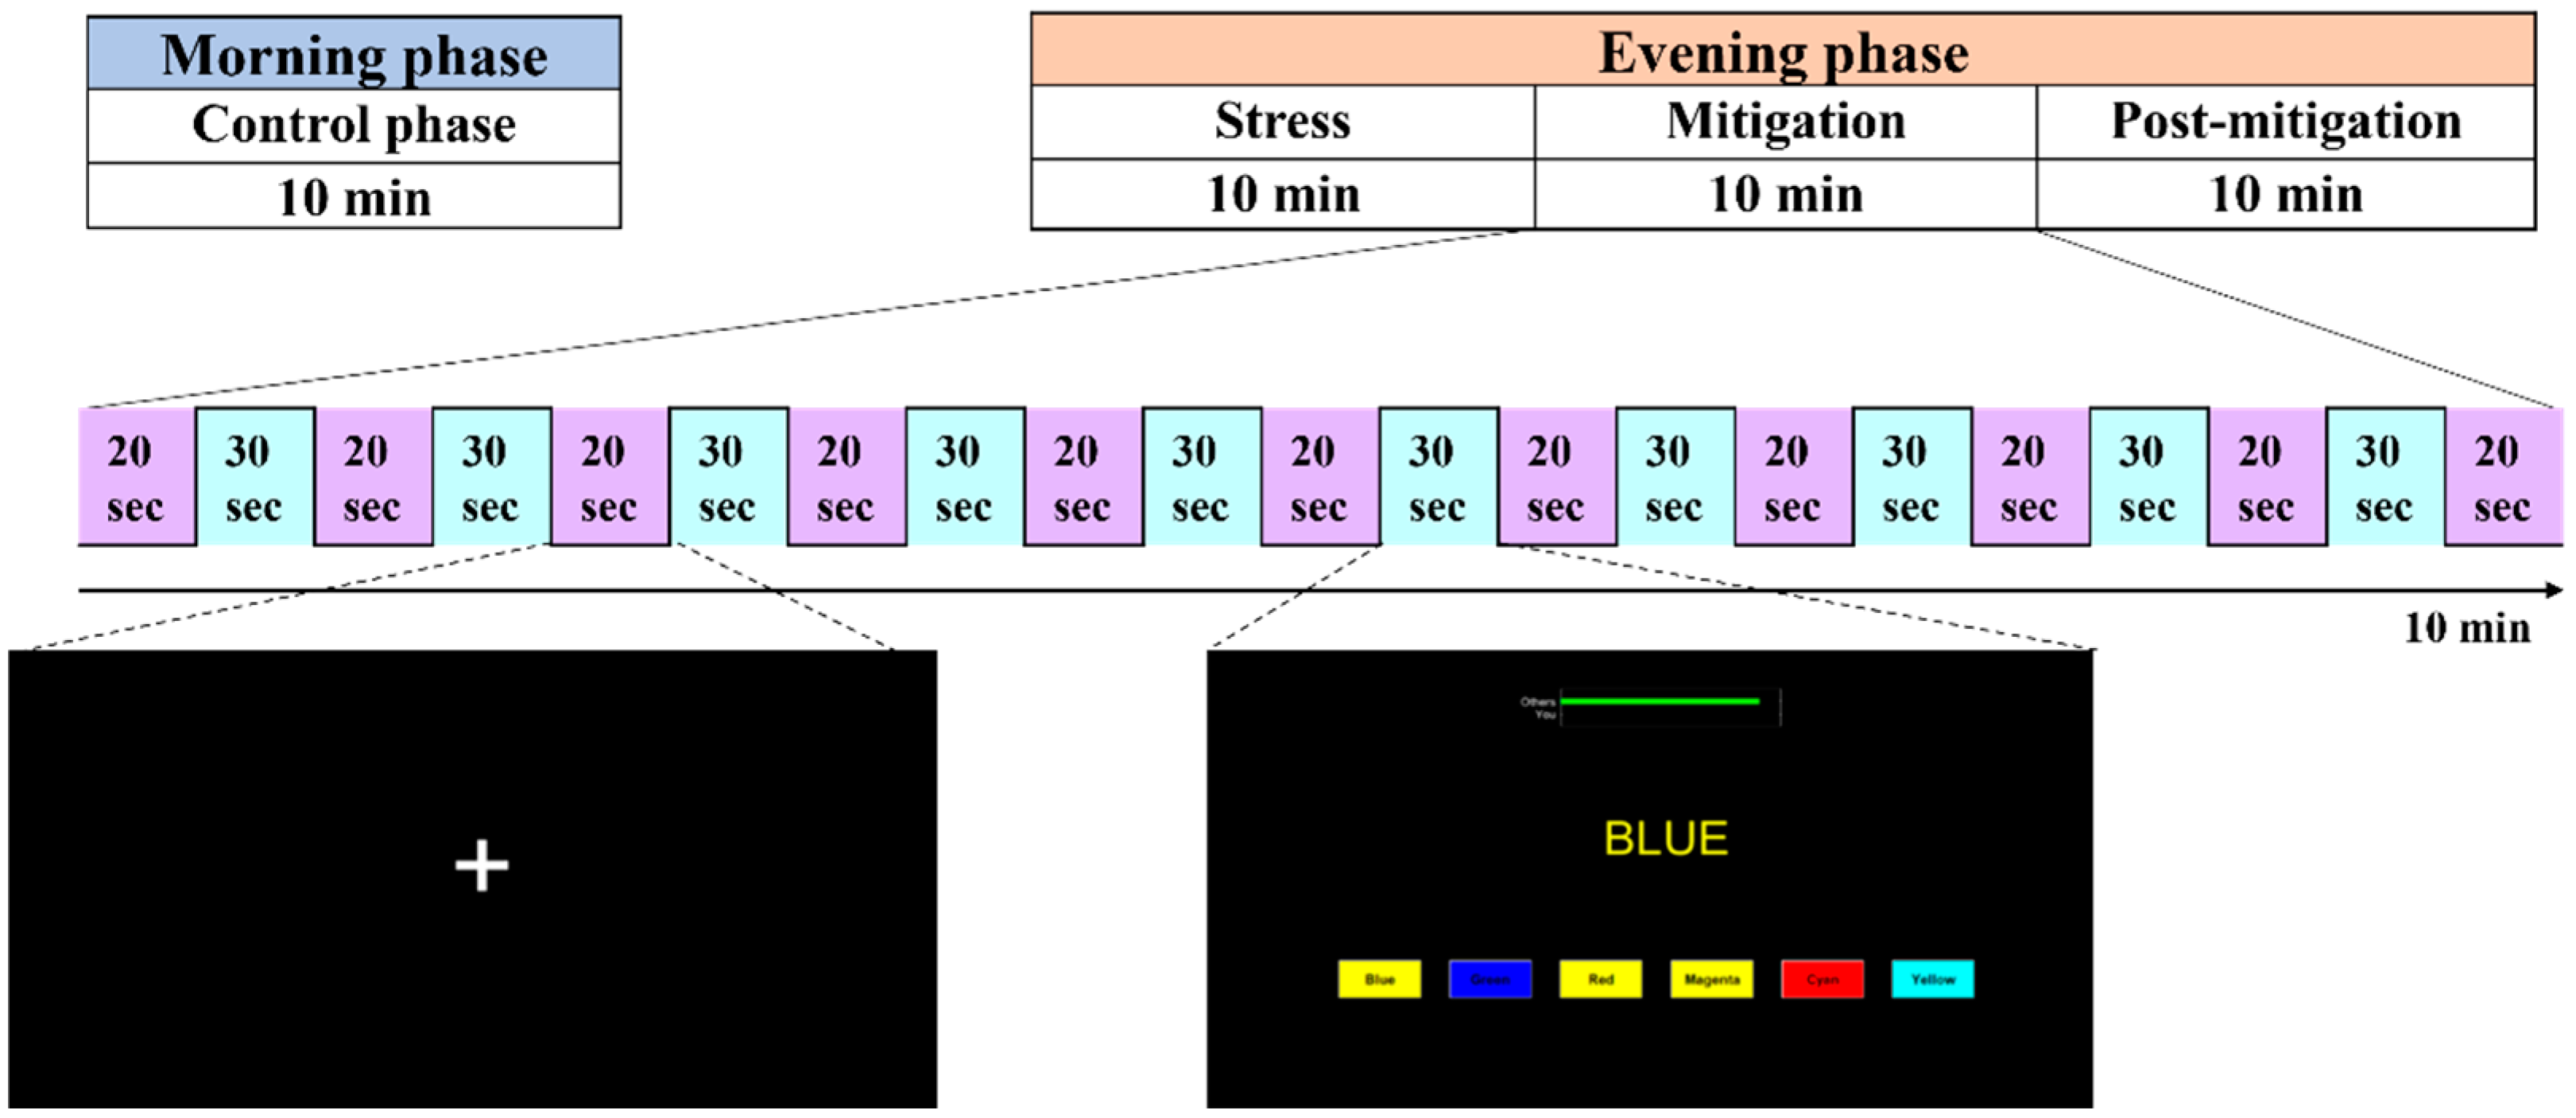
2.2. Task Design
2.3. Experimental Paradigm
2.4. Optode Placement
2.5. Data Acquisition
2.6. fNIRS Preprocessing
2.7. Statistical Analysis
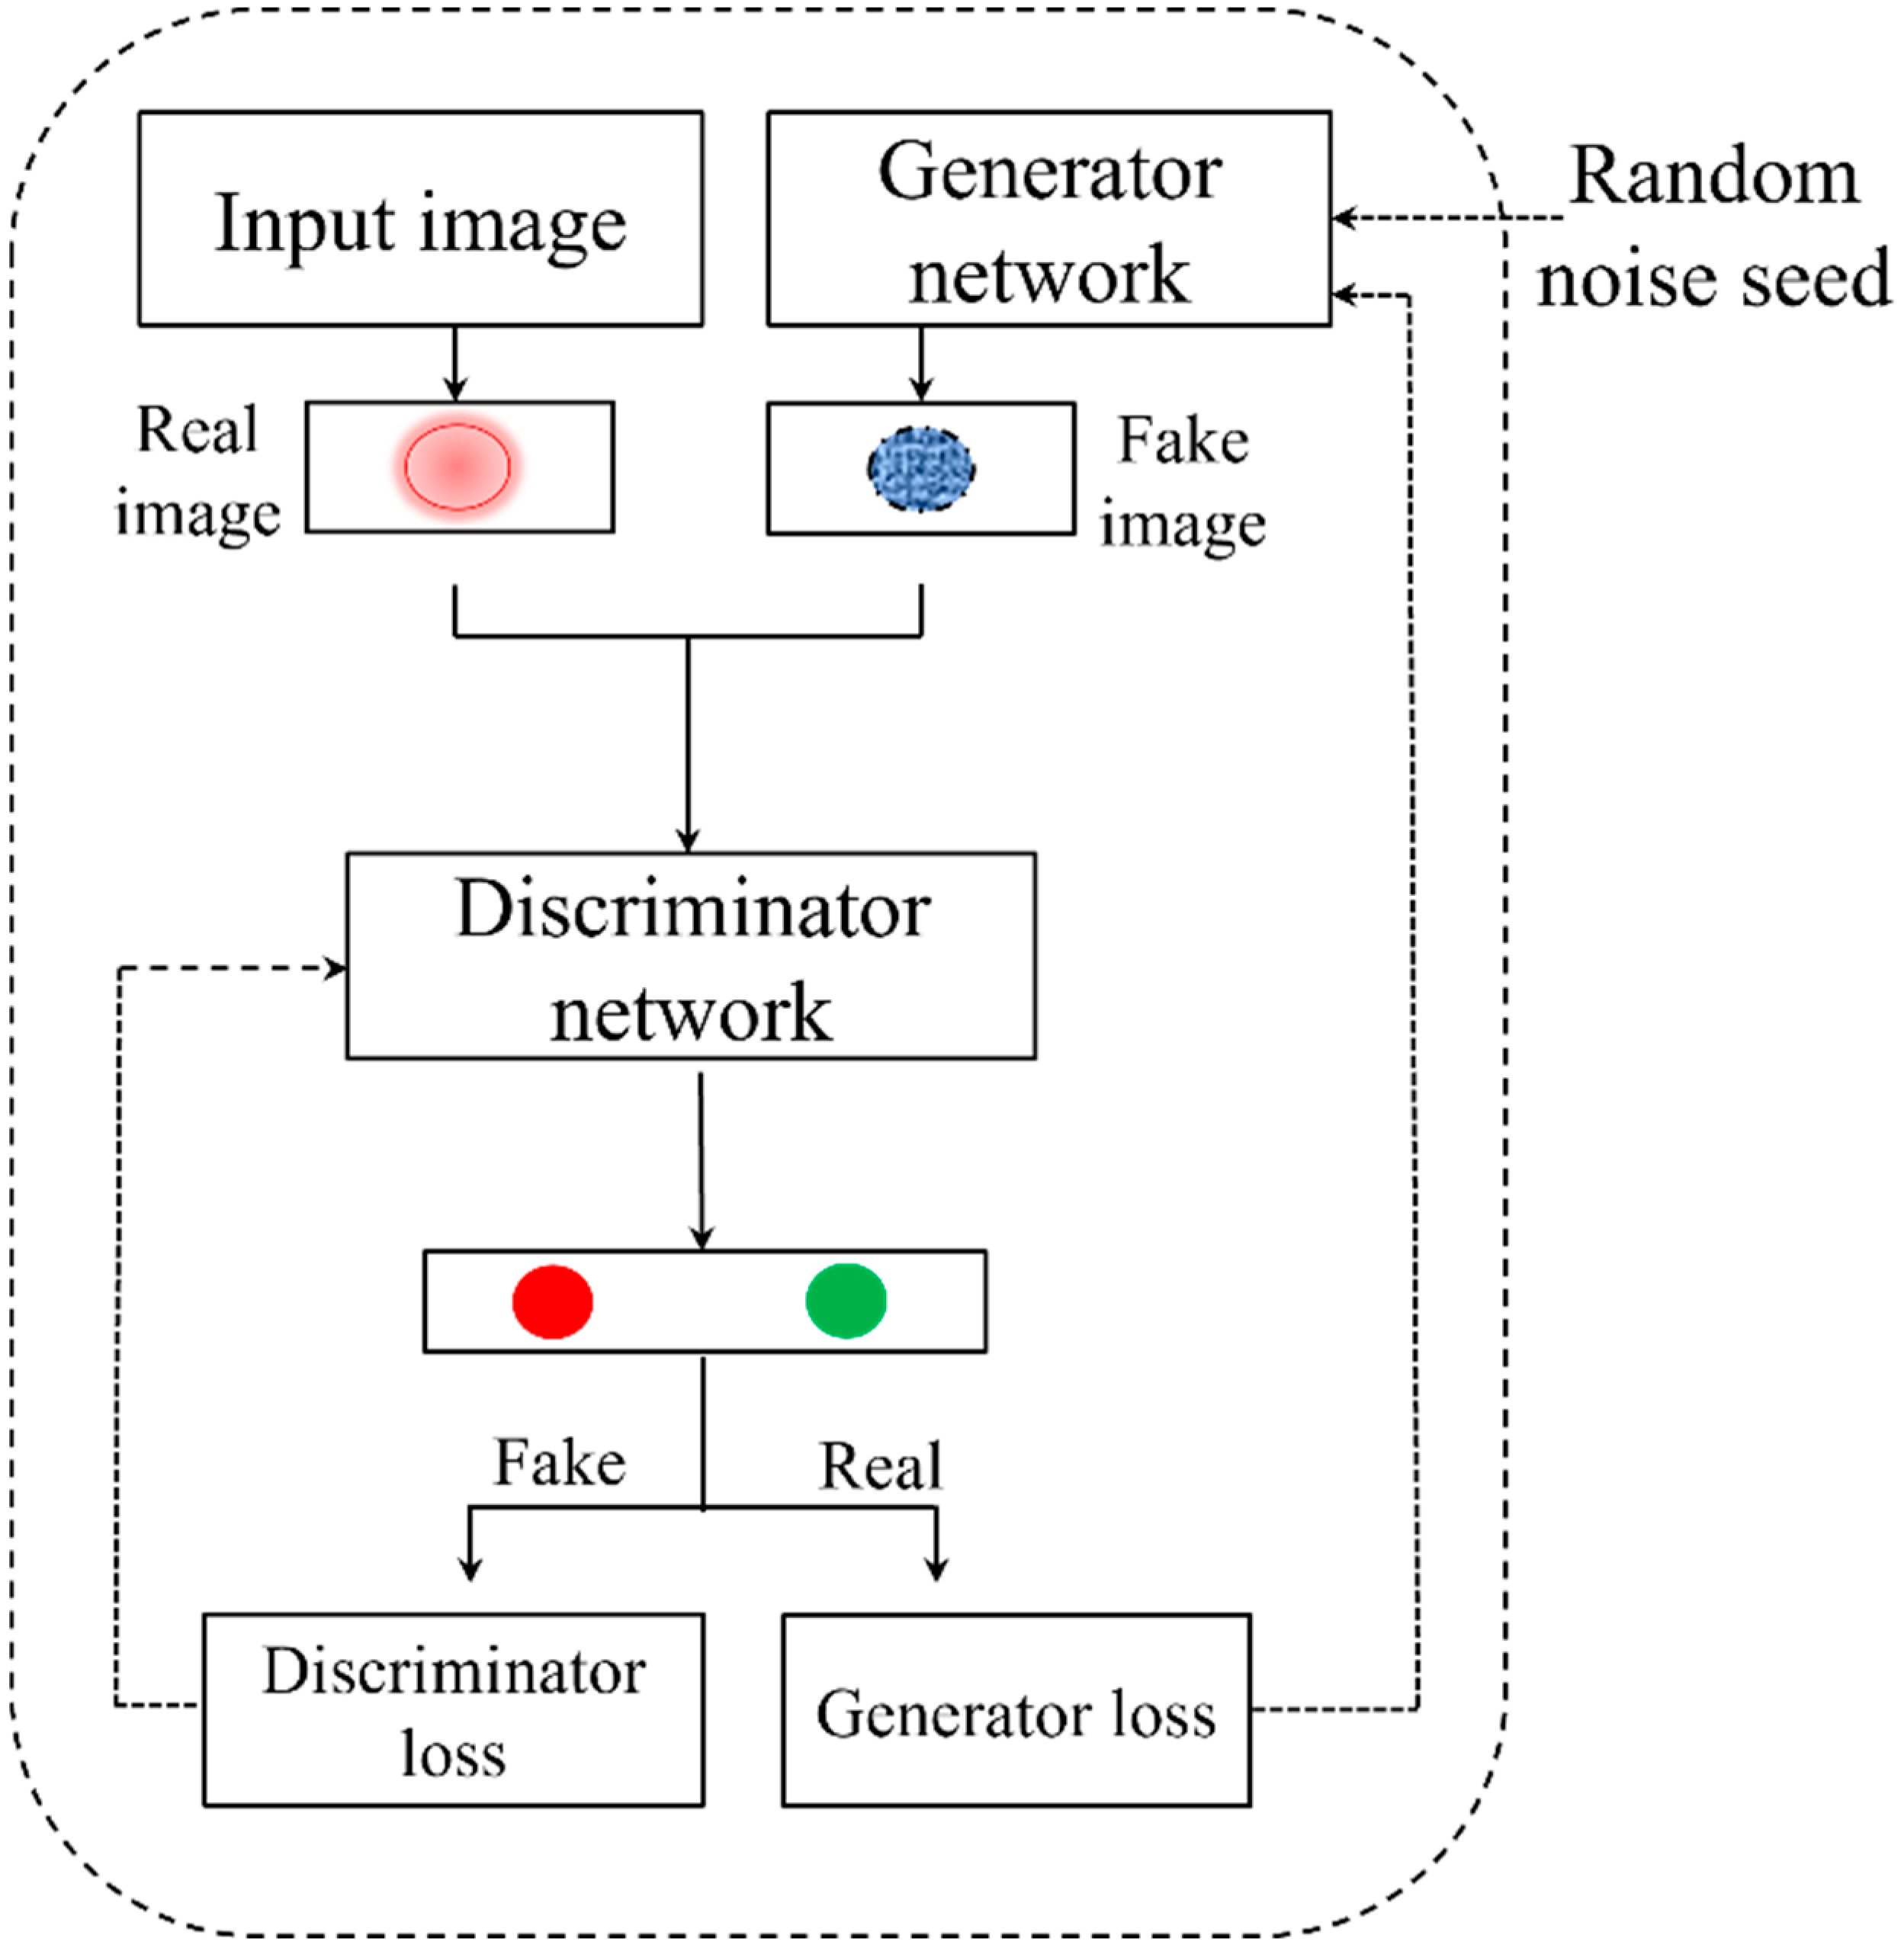
2.8. Data Augmentation
2.9. Classification
3. Results
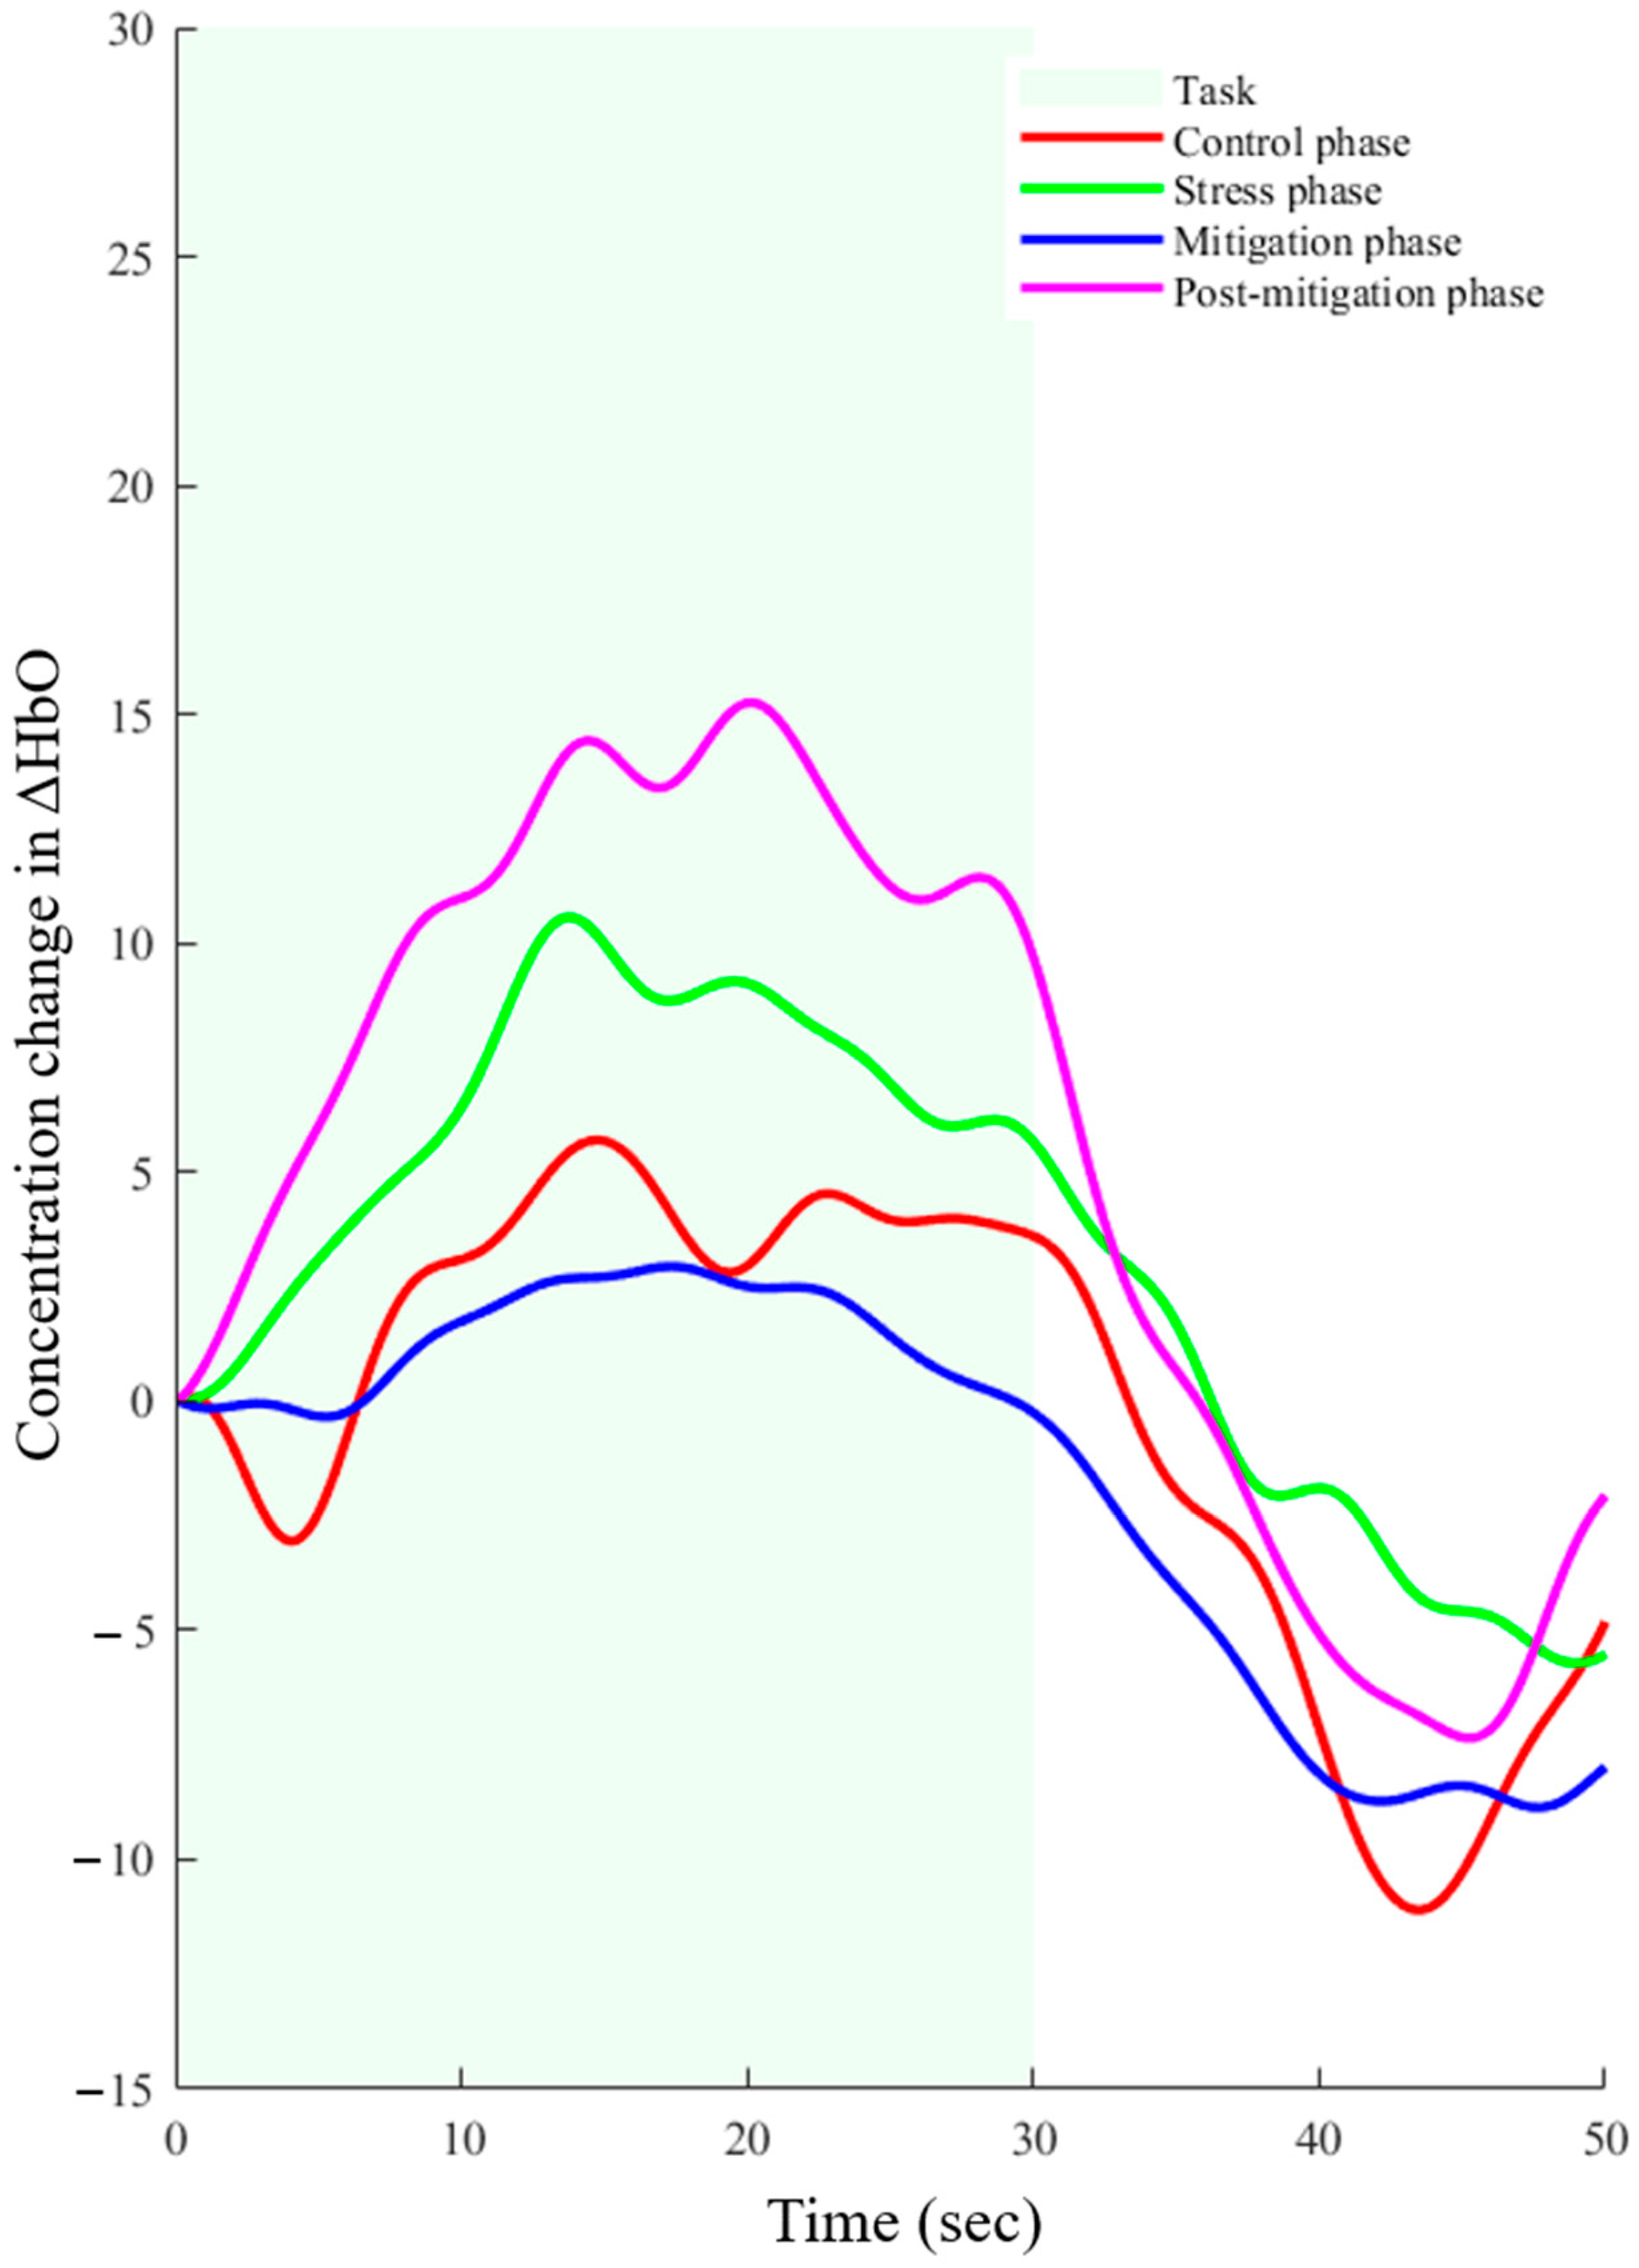
3.1. Comparison of Hemodynamic Responses
3.2. Enhancement of Classification Accuracies
4. Discussion
5. Conclusions
Author Contributions
Funding
Institutional Review Board Statement
Informed Consent Statement
Data Availability Statement
Acknowledgments
Conflicts of Interest
References
- Noninvasive, F.F.J. Infrared Monitoring of Cerebral and Myocardial Oxygen Sufficiency and Circulatory Parameters. Science 1977, 198, 1264–1267. [Google Scholar] [CrossRef]
- Villringer, A.; Planck, J.; Hock, C.; Schleinkofer, L.; Dirnagl, U. Near infrared spectroscopy (NIRS): A new tool to study hemodynamic changes during activation of brain function in human adults. Neurosci. Lett. 1993, 154, 101–104. [Google Scholar] [CrossRef] [PubMed]
- Hoshi, Y.; Tamura, M. Near-Infrared Optical Detection of Sequential Brain Activation in the Prefrontal Cortex during Mental Tasks. Neuroimage 1997, 5, 292–297. [Google Scholar] [CrossRef] [PubMed]
- Chance, B.; Zhuang, Z.; UnAh, C.; Alter, C.; Lipton, L. Cognition-activated low-frequency modulation of light absorption in human brain. Proc. Natl. Acad. Sci. USA 1993, 90, 3770–3774. [Google Scholar] [CrossRef] [PubMed]
- Ferrari, M.; Quaresima, V. A brief review on the history of human functional near-infrared spectroscopy (fNIRS) development and fields of application. Neuroimage 2012, 63, 921–935. [Google Scholar] [CrossRef] [PubMed]
- Ayaz, H.; Onaral, B.; Izzetoglu, K.; Shewokis, P.A.; McKendrick, R.; Parasuraman, R. Continuous monitoring of brain dynamics with functional near infrared spectroscopy as a tool for neuroergonomic research: Empirical examples and a technological development. Front. Hum. Neurosci. 2013, 871, 7. [Google Scholar] [CrossRef] [PubMed]
- Khan, M.N.A.; Hong, K.-S. Most favorable stimulation duration in the sensorimotor cortex for fNIRS-based BCI. Biomed. Opt. Express 2021, 12, 5939–5954. [Google Scholar] [CrossRef] [PubMed]
- Khan, M.; Ghafoor, U.; Yoo, H.-R.; Hong, K.-S. Acupuncture enhances brain function in patients with mild cognitive impairment: Evidence from a functional-near infrared spectroscopy study. Neural Regen. Res. 2022, 17, 1850. [Google Scholar] [CrossRef] [PubMed]
- Yaqub, M.A.; Woo, S.-W.; Compact, K.-S.H. Portable, High-Density Functional Near-Infrared Spectroscopy System for Brain Imaging. IEEE Access 2020, 8, 128224–128238. [Google Scholar] [CrossRef]
- Naseer, N.; Hong, K.-S. fNIRS-based brain-computer interfaces: A review. Front. Hum. Neurosci. 2015, 9, 3. [Google Scholar] [CrossRef] [PubMed]
- Watanabe, H.; Shitara, Y.; Aoki, Y.; Inoue, T.; Tsuchida, S.; Takahashi, N.; Taga, G. Hemoglobin phase of oxygenation and deoxygenation in early brain development measured using fNIRS. Proc. Natl. Acad. Sci. USA 2017, 114, E1737–E1744. [Google Scholar] [CrossRef] [PubMed]
- Cutini, S.; Moro, S.B.; Bisconti, S. Functional near Infrared Optical Imaging in Cognitive Neuroscience: An Introductory Review. J. Near Infrared Spectrosc. 2012, 20, 75–92. [Google Scholar] [CrossRef]
- Ghafoor, U.; Lee, J.-H.; Hong, K.-S.; Park, S.-S.; Kim, J.; Yoo, H.-R. Effects of Acupuncture Therapy on MCI Patients Using Functional Near-Infrared Spectroscopy. Front. Aging Neurosci. 2019, 11, 237. [Google Scholar] [CrossRef] [PubMed]
- Wang, Z.; Zhou, Y.; Chen, L.; Gu, B.; Yi, W.; Liu, S.; Xu, M.; Qi, H.; He, F.; Ming, D. BCI Monitor Enhances Electroencephalographic and Cerebral Hemodynamic Activations During Motor Training. IEEE Trans. Neural Syst. Rehabil. Eng. 2019, 27, 780–787. [Google Scholar] [CrossRef] [PubMed]
- Petrantonakis, P.C.; Kompatsiaris, I. Single-Trial NIRS Data Classification for Brain–Computer Interfaces Using Graph Signal Processing. IEEE Trans. Neural Syst. Rehabil. Eng. 2018, 26, 1700–1709. [Google Scholar] [CrossRef]
- Zheng, Y.; Zhang, D.; Wang, L.; Wang, Y.; Deng, H.; Zhang, S.; Li, D.; Wang, D. Resting-State-Based Spatial Filtering for an fNIRS-Based Motor Imagery Brain-Computer Interface. IEEE Access 2019, 7, 120603–120615. [Google Scholar] [CrossRef]
- Tanveer, M.A.; Khan, M.J.; Qureshi, M.J.; Naseer, N.; Hong, K.-S. Enhanced Drowsiness Detection Using Deep Learning: An fNIRS Study. IEEE Access 2019, 7, 137920–137929. [Google Scholar] [CrossRef]
- Katmah, R.; Al-Shargie, F.; Tariq, U.; Babiloni, F.; Al-Mughairbi, F.; Al-Nashash, H. Mental Stress Management Using fNIRS Directed Connectivity and Audio Stimulation. IEEE Trans. Neural Syst. Rehabil. Eng. 2023, 31, 1086–1096. [Google Scholar] [CrossRef] [PubMed]
- Al-Shargie, F.; Katmah, R.; Tariq, U.; Babiloni, F.; Al-Mughairbi, F.; Al-Nashash, H. Stress management using fNIRS and binaural beats stimulation. Biomed. Opt. Express 2022, 13, 3552. [Google Scholar] [CrossRef]
- Mark, G.; Smith, A. Effects of occupational stress, job characteristics, coping, and attributional style on the mental health and job satisfaction of university employees. Anxiety Stress Coping 2012, 25, 63–78. [Google Scholar] [CrossRef] [PubMed]
- Shi, Y.; Zhu, Y.; Mehta, R.K.; Du, J. A neurophysiological approach to assess training outcome under stress: A virtual reality experiment of industrial shutdown maintenance using Functional Near-Infrared Spectroscopy (fNIRS). Adv. Engin Infors 2020, 46, 101153. [Google Scholar] [CrossRef]
- Mücke, M.; Ludyga, S.; Colledge, F.; Pühse, U.; Gerber, M. Association of Exercise with Inhibitory Control and Prefrontal Brain Activity Under Acute Psychosocial Stress. Brain Sci. 2020, 10, 439. [Google Scholar] [CrossRef]
- Gurel, N.Z.; Jung, H.; Hersek, S.; Inan, O.T. Fusing Near-Infrared Spectroscopy With Wearable Hemodynamic Measurements Improves Classification of Mental Stress. IEEE Sens. J. 2019, 19, 8522–8531. [Google Scholar] [CrossRef] [PubMed]
- Shirvan, R.A.; Setarehdan, S.K.; Nasrabadi, A.M. Classification of Mental Stress Levels by Analyzing fNIRS Signal Using Linear and Non-linear Features. Int. Clin. Neuro J. 2018, 5, 55–61. [Google Scholar] [CrossRef]
- Wickramaratne, S.D.; Mahmud, M.S. Conditional-GAN Based Data Augmentation for Deep Learning Task Classifier Improvement Using fNIRS Data. Front. Big Data 2021, 4, 659146. [Google Scholar] [CrossRef]
- Nagasawa, T.; Sato, T.; Nambu, I.; Wada, Y. fNIRS-GANs: Data augmentation using generative adversarial networks for classifying motor tasks from functional near-infrared spectroscopy. J. Neural Eng. 2020, 17, 016068. [Google Scholar] [CrossRef] [PubMed]
- Zhang, Y.; Liu, D.; Li, T.; Zhang, P.; Li, Z.; Gao, F. CGAN-rIRN: A data-augmented deep learning approach to accurate classification of mental tasks for a fNIRS-based brain-computer interface. Biomed. Opt. Express 2023, 14, 2934. [Google Scholar] [CrossRef] [PubMed]
- Toutouh, J.; O’Reilly, U.-M.; Hemberg, E. Data Dieting in GAN Training. arXiv 2020, arXiv:2004.04642. [Google Scholar] [CrossRef]
- Zhao, S.; Liu, Z.; Lin, J.; Zhu, J.-Y.; Han, S. Differentiable Augmentation for Data-Efficient GAN Training. arXiv 2020, arXiv:2006.10738. [Google Scholar] [CrossRef]
- Christie, B. Doctors revise Declaration of Helsinki. BMJ 2000, 321, 913. [Google Scholar] [CrossRef]
- Kocsis, L.; Herman, P.; Eke, A. The modified Beer–Lambert law revisited. Phys. Med. Biol. 2006, 51, N91–N98. [Google Scholar] [CrossRef] [PubMed]
- Gemignani, J.; Gervain, J. Comparing different pre-processing routines for infant fNIRS data. Dev. Cogn. Neurosci. 2021, 48, 100943. [Google Scholar] [CrossRef] [PubMed]
- Zhang, X.; Noah, J.A.; Hirsch, J. Separation of the global and local components in functional near-infrared spectroscopy signals using principal component spatial filtering. Neurophotonics 2016, 3, 015004. [Google Scholar] [CrossRef] [PubMed]
- Fishburn, F.A.; Ludlum, R.S.; Vaidya, C.J.; Medvedev, A.V. Temporal Derivative Distribution Repair (TDDR): A motion correction method for fNIRS. Neuroimage 2019, 184, 171–179. [Google Scholar] [CrossRef] [PubMed]
- Zafar, A.; Hong, K.-S. Neuronal Activation Detection Using Vector Phase Analysis with Dual Threshold Circles: A Functional Near-Infrared Spectroscopy Study. Int. J. Neural Syst. 2018, 28, 1850031. [Google Scholar] [CrossRef] [PubMed]
- Radford, A.; Metz, L.; Chintala, S. Unsupervised Representation Learning with Deep Convolutional Generative Adversarial Networks. arXiv 2015, arXiv:1511.06434. [Google Scholar]
- Wu, Q.; Chen, Y.; Meng, J. DCGAN-Based Data Augmentation for Tomato Leaf Disease Identification. IEEE Access 2020, 8, 98716–98728. [Google Scholar] [CrossRef]
- Yahaya, M.S.M.; Teo, J. Data augmentation using generative adversarial networks for images and biomarkers in medicine and neuroscience. Front. Appl. Math Stat. 2023, 9, 1162760. [Google Scholar] [CrossRef]
- Benerradi, J.; Clos, J.; Landowska, A.; Valstar, M.F.; Wilson, M.L. Benchmarking framework for machine learning classification from fNIRS data. Front. Neuroergo 2023, 4, 99496. [Google Scholar] [CrossRef]
- Gao, Y.; Jia, B.; Houston, M.; Zhang, Y. Hybrid EEG-fNIRS Brain Computer Interface Based on Common Spatial Pattern by Using EEG-Informed General Linear Model. IEEE Trans. Instrum. Meas. 2023, 72, 4006110. [Google Scholar] [CrossRef]
- Wang, Z.; Yang, L.; Zhou, Y.; Chen, L.; Gu, B.; Liu, S.; Xu, M.; He, F.; Ming, D. Incorporating EEG and fNIRS Patterns to Evaluate Cortical Excitability and MI-BCI Performance During Motor Training. IEEE Trans. Neural Syst. Rehabil. Eng. 2023, 31, 2872–2882. [Google Scholar] [CrossRef] [PubMed]
- Sato, H.; Fuchino, Y.; Kiguchi, M.; Katura, T.; Maki, A.; Yoro, T.; Koizumi, H. Intersubject variability of near-infrared spectroscopy signals during sensorimotor cortex activation. J. Biomed. Opt. 2005, 10, 044001. [Google Scholar] [CrossRef] [PubMed]
- Lu, H.; Zhang, Y.; Qiu, H.; Zhang, Z.; Tan, X.; Huang, P.; Zhang, M.; Miao, D.; Zhu, X. A new perspective for evaluating the efficacy of and tDCS in improving executive functions: A combined tES and fNIRS study. Hum. Brain Mapp. 2023, 45, e26559. [Google Scholar] [CrossRef] [PubMed]
- Huo, C.; Xu, G.; Xie, H.; Zhao, H.; Zhang, X.; Li, W.; Zhang, S.; Huo, J.; Li, H.; Sun, A.; et al. Effect of High-Frequency rTMS combined with bilateral arm training on brain functional network in patients with chronic stroke: An fNIRS study. Brain Res. 2023, 1809, 148357. [Google Scholar] [CrossRef] [PubMed]


| Parameters | Values |
|---|---|
| Batch size | 32 |
| Epoch | 30,000 |
| Learning rate | 0.0001 |
| Image Channels | 3 |
| Batch Normalization | 0.9 |
| Drop-Out | 0.3 |
| Strides | 2 |
| Window Size | Control vs. Stress | Control vs. Mitigation | Control vs. Post-Mitigation |
|---|---|---|---|
| 0 to 5 s | 58.84 | 59.06 | 59.04 |
| 5 to 30 s | 59.53 | 59.60 | 60.04 |
| 30 to 50 s | 58.58 | 59.50 | 59.29 |
| 0 to 50 s | 59.56 | 59.81 | 59.96 |
| Accuracy (%) | |||
|---|---|---|---|
| Classifiers | Control vs. Stress | Control vs. Mitigation | Control vs. Post-Mitigation |
| CNN | 72 | 68 | 73 |
| FFNN | 57 | 52 | 59 |
| DT | 64 | 60 | 63 |
| LSVM | 66 | 63 | 67 |
| RBM | 62 | 59 | 64 |
| Accuracy (%) | |||
|---|---|---|---|
| Classifiers | Control vs. Stress | Control vs. Mitigation | Control vs. Post-Mitigation |
| CNN | 76 | 64 | 73 |
| FFNN | 61 | 52 | 65 |
| DT | 61 | 56 | 64 |
| LSVM | 68 | 64 | 69 |
| RBM | 63 | 56 | 66 |
| Accuracy (%) | |||
|---|---|---|---|
| Classifiers | Control vs. Stress | Control vs. Mitigation | Control vs. Post-Mitigation |
| CNN | 91 | 86 | 94 |
| FFNN | 62 | 57 | 64 |
| DT | 88 | 85 | 89 |
| LSVM | 84 | 80 | 86 |
| RBM | 76 | 70 | 75 |
| Accuracy (%) | |||
|---|---|---|---|
| Classifiers | Control vs. Stress | Control vs. Mitigation | Control vs. Post-Mitigation |
| CNN | 93 | 88 | 96 |
| FFNN | 66 | 61 | 70 |
| DT | 91 | 87 | 94 |
| LSVM | 85 | 82 | 86 |
| RBM | 74 | 71 | 77 |
Disclaimer/Publisher’s Note: The statements, opinions and data contained in all publications are solely those of the individual author(s) and contributor(s) and not of MDPI and/or the editor(s). MDPI and/or the editor(s) disclaim responsibility for any injury to people or property resulting from any ideas, methods, instructions or products referred to in the content. |
© 2025 by the authors. Licensee MDPI, Basel, Switzerland. This article is an open access article distributed under the terms and conditions of the Creative Commons Attribution (CC BY) license (https://creativecommons.org/licenses/by/4.0/).
Share and Cite
Khan, M.N.A.; Zahour, N.; Tariq, U.; Masri, G.; Almadani, I.F.; Al-Nashah, H. Exploring Effects of Mental Stress with Data Augmentation and Classification Using fNIRS. Sensors 2025, 25, 428. https://doi.org/10.3390/s25020428
Khan MNA, Zahour N, Tariq U, Masri G, Almadani IF, Al-Nashah H. Exploring Effects of Mental Stress with Data Augmentation and Classification Using fNIRS. Sensors. 2025; 25(2):428. https://doi.org/10.3390/s25020428
Chicago/Turabian StyleKhan, M. N. Afzal, Nada Zahour, Usman Tariq, Ghinwa Masri, Ismat F. Almadani, and Hasan Al-Nashah. 2025. "Exploring Effects of Mental Stress with Data Augmentation and Classification Using fNIRS" Sensors 25, no. 2: 428. https://doi.org/10.3390/s25020428
APA StyleKhan, M. N. A., Zahour, N., Tariq, U., Masri, G., Almadani, I. F., & Al-Nashah, H. (2025). Exploring Effects of Mental Stress with Data Augmentation and Classification Using fNIRS. Sensors, 25(2), 428. https://doi.org/10.3390/s25020428