Article

Validation of Novel Stride Length Model-Based Approaches to Estimate Distance Covered Based on Acceleration and Pressure Data During Walking

by
Armelle-Myriane Ngueleu
1,*,
Martin J.-D. Otis
2 and
Charles Sebiyo Batcho
1
1
Center for Interdisciplinary Research in Rehabilitation and Social Integration, Centre Intégré Universitaire de Santé et de Services Sociaux de la Capitale-Nationale, School of Rehabilitation Sciences, Faculty of Medicine, Université Laval, 525 Blvd. Wilfrid-Hamel, Quebec City, QC G1M 2S8, Canada
2
Automation and interactive Robotic Laboratory (AIRL), Department of Applied Science, Université de Quebec à Chicoutimi, 555 Blvd. of University, Chicoutimi, QC G7H 2B1, Canada
*
Author to whom correspondence should be addressed.
Sensors 2025, 25(19), 6217; https://doi.org/10.3390/s25196217
Submission received: 30 July 2025 / Revised: 20 September 2025 / Accepted: 1 October 2025 / Published: 7 October 2025
(This article belongs to the Section Wearables)

Abstract

The ability to walk is essential in daily life, making walking outcomes key measures in clinical practice. This study aims to develop and validate two novel stride length model-based approaches for total distance estimation using a smart insole. Eight participants wore a pair of smart insoles. For a period of six minutes, each participant walked back and forth on a predefined 20 m pathway, and the numbers of round trips and strides taken were counted. Two stride length estimation approaches based on the director coefficients of acceleration data (Approach 1) and dynamic time warping (Approach 2) using smart insoles were used. The median accuracies of the total distance using Approach 1 are 98.92% [1.24%] (ICC = 0.992) and 98.69% [2.44%] (ICC = 0.994) for the right and left sides, respectively. For Approach 2, the average accuracies are 98.95% [0.18%] (ICC = 0.996) for the right side and 99.03% [0.14%] (ICC = 0.991) for the left side. The Mann–Whitney U test shows no statistically significant difference between the actual distance and smart insole for the total distance covered. Furthermore, there is no statistically significant difference between Approach 1 and Approach 2 for stride length. Although the sample size was small, the estimated total distance using the novel model-based algorithms appears to be accurate in comparison to the actual total distance.

1. Introduction

Strong evidence showed that physical activity, including walking, has substantial health benefits [1,2,3,4]. Walking is the most commonly reported activity among adults who meet the recommended levels of physical activity [5]. Walking will become increasingly important for public health as the population ages [6]. It is also relevant in the fight against obesity and in increasing daily caloric expenditure. Several parameters can be measured during walking, such as number of strides/steps, distance covered, walking speed, etc.
Different measurement techniques and tools are used in clinical settings and in the community to assess people’s walking ability. For example, in the community, the distance covered is a parameter that is frequently measured for athletes. In a clinical setting, the primary goal of rehabilitation after a stroke is to restore the patient’s ability to walk. Gait analysis can be used at various stages to achieve the following: for the initial assessment of the degree of impairment and to guide the clinician in prescribing treatment; for monitoring rehabilitation outcomes; and for the final assessment of the benefits of treatment [7]. Assessing the distance covered by a patient enables healthcare professionals to better assess the effectiveness of the provided intervention and the patient’s physical recovery progress. Such assessment can be performed through clinical tests, particularly the six-minute walk test (6-MWT) [8].
Distance and stride length estimation can be performed using different spatio–temporal analysis sensors, the most accurate of which are motion capture systems [9,10]. Wearable instrumented technologies based on a single sensor, such as accelerometers, are often used in outdoor settings to estimate the stride length and distance covered. However, the accuracy of these results is limited [11,12]. In fact, studies have shown that accelerometers alone do not provide accurate results for total distance and stride length [11,12]. The combination of two or more additional sensors, such as an accelerometer and a gyroscope, can improve the accuracy of distance and stride length. The PODOSmart insole, equipped with an inertial sensor, estimates stride length based on artificial intelligence algorithms [13]. The Global Positioning System (GPS) is another technology commonly used to determine the distance covered, although distances provided by some GPS devices are underestimated compared to the actual distance covered. Particularly, in indoor settings, several conditions affect the accuracy of the distance estimation, which varies over time [14,15,16].
There are other different approaches to estimate the total distance covered [17,18,19,20,21,22,23]. In clinical setting, the total distance covered during the six-minute walking test can be obtained by multiplying the average stride length by the number of strides. In the literature, stride length is estimated by various methods [24,25,26], which can be divided into two types: direct and indirect methods. The direct method uses the double integration of acceleration [20,23]. The indirect methods use either gait models based on biomechanical models [27,28], empirical relationship models [29,30,31], and inverted pendulum models [32,33,34], or statistical regression models using the relationship between stride length and sensor data [35,36,37,38]. For example, the stride length was estimated based on a linear combination of walking frequency and acceleration variance [21], a linear regression model of stride frequency and stride velocity [22], and an extended/adaptive Kalman filter [18,19]. Another approach for estimating stride length is based on foot displacement [39]. In that study [39], Suzuki et al. estimated the foot trajectories using a quaternion to represent the IMU orientation, and the stride length was calculated from the foot position absolute value.
Although the direct method is one of the best methods in theory, it contains noise, bias, and drift in acceleration data despite the zero-velocity assumption for a reasonable initialization in the integration of acceleration data for each stance phase [37]. In Peruzzi et al. (2011) [40] and Skog et al. (2010) [41], the authors used double integration of foot acceleration with drift compensation at particular points where no velocity was used for stride length estimation. In other studies, drift was compensated for, using a linear model [11,12,42]. An improved stride length estimation approach was developed based on the zero-velocity assumption, acceleration, and angular velocity dedrifting combination [9,10,43,44]. Mariani et al. [9] used a nonlinear drift model, more accurately for the stride length. Rampp et al. [43] used an individualized drift model for stride length estimation. Zrenner et al. [10] successfully estimated stride length with 7.9% of error based on the determination of a continuous integration value correlated with the foot velocity, a stride segmentation using an initial ground contact and a regression model to translate this integration value into a velocity value. The calculation of the foot velocity used in Zrenner et al. [10] was based on a polynomial function of second order, where the constants were estimated on a set of training data with known reference velocity observations using parametric regression analysis [45]. The stride length error reported in [10] can be reduced.
Parametric and nonparametric models exist for the indirect method, using statistical regression models. The most common approach for parametric models is linear regression between the stride length and walking characteristic features. Although nonparametric models are more accurate than parametric models, they require a large number and wide variety of labelled data using a deep learning approach for stride length estimation [46,47,48,49,50,51].
The purpose of the present study is to develop and validate novel model-based algorithms, adapted to smart insoles, to measure stride length and thus estimate total distance walked, with acceleration and pressure data. The assumption is that the approach based on dynamic time warping (DTW) would be more accurate than the approach based on the director coefficients of acceleration data to estimate the total distance, based on the average length stride and number of strides, for clinical requirements. In fact, DTW is an algorithm that measures the similarity between two temporal sequences by finding an optimal alignment that minimizes the cumulative distance between corresponding points regardless of speed and duration, whereas the acceleration director coefficient is a mathematical model.

2. Materials and Methods

2.1. Data Collection

Data from 8 healthy participants (6 males and 2 females), aged 39.8 ± 17.56 years old (range: 21 to 68), weight of 74.63 ± 11.40 kg, height of 173 ± 10.42 cm, and foot size of 29.61 ± 2.25 cm (ranging from 29 to 32 cm) are used in this study. Each participant wore a pair of smart insoles, I-SOL (Gilon, Seongnam, Republic of Korea), and two Gait Up monitors (Gait Up; Lausanne, Switzerland). For synchronization, the smart insole and Gait Up monitors were reset at the same time. Then, they performed the six-minute walking test (6-MWT) on the predefined distance of 20 m pathway back and forth (see Figure 1). The number of round trips were calculated directly for a single foot, and the number of strides (Ns) were determined by a manual step counter using video recording as gold standard. Each participant indicated in advance which foot they would use to start walking, and fluorescent Velcro was attached to the shin of that foot. During the walk, team members incremented the manual counter each time the participant’s Velcro-equipped foot took a stride. For each participant, the total distance was calculated by multiplying the number of round trips by 40 m for a single foot and was used as the actual distance. Once 6-MWT had elapsed, the participant stopped, and a team member measured the distance between the cone and the participant using an odometer. Similarly, if a half turn had also been completed, this was also added. These distances were added to the number of round trips multiplied by 40 m to determine the total distance covered. The number of strides taken was reported in a previous study by Ngueleu et al. [52]. The estimated total distance (Td) using the smart insoles is determined as in Equation (1). The average stride length is estimated using the model-based algorithms described in the following section. The accuracy of the two approaches and Gait Up monitors is determined as in Equation (2), with the outcome representing the total distance (Td) or average stride length (L).
Td = LNs,
Accuracy = (1 − (|actual outcomeestimated outcome|/actual outcome)) × 100%

2.2. Foot-Worn Sensors

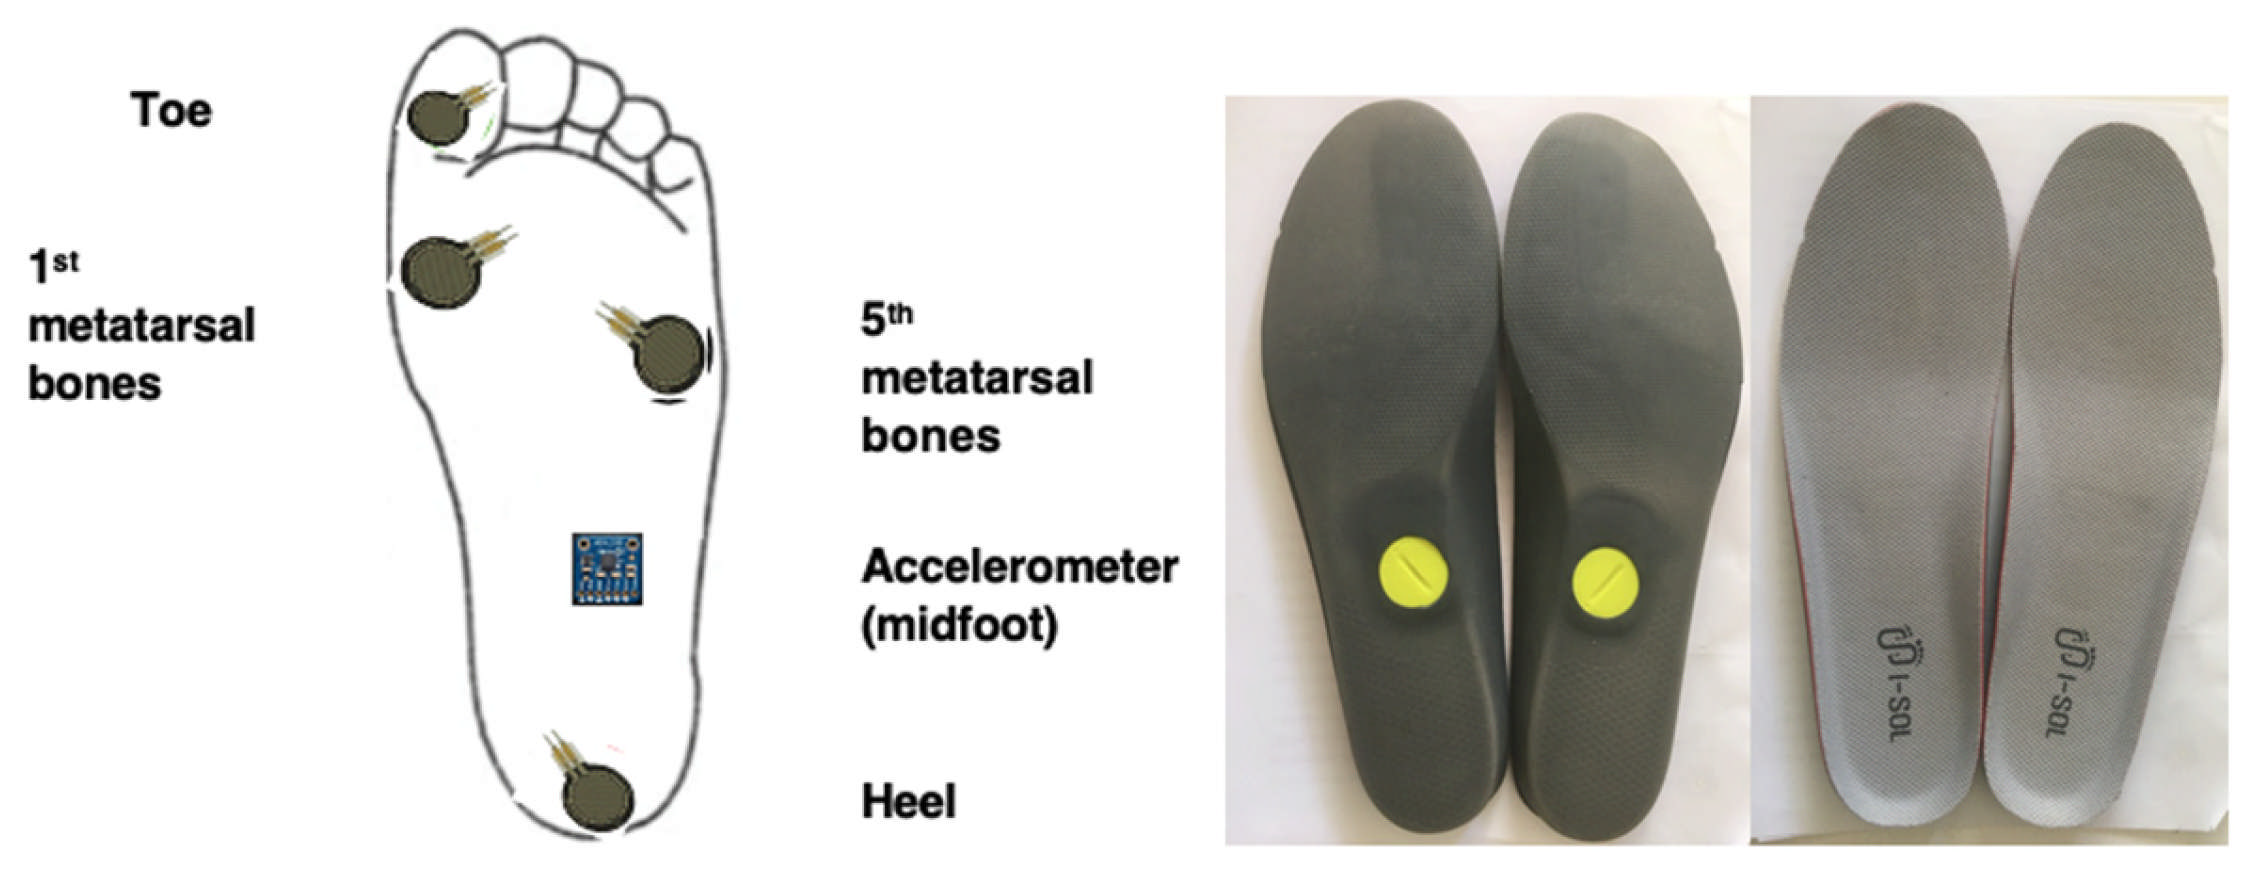
The smart insole ISOL (Gilon, Seongnam, Korean), integrating a 3D accelerometer and four pressure sensors are located mainly under the heel, the great toe, the first, and the fifth metatarsal bones (see Figure 2). The smart insole is a small, low-power, stand-alone device that integrates a microcontroller, Bluetooth communication, and battery. The electronic module is in the midfoot. The smart insoles transmit data via Bluetooth to an application embedded in a tablet or mobile phone. Four US foot sizes, from 8” to 12” of the smart insoles, were used in this study. The acceleration and pressure data are sampled at 40 Hz.
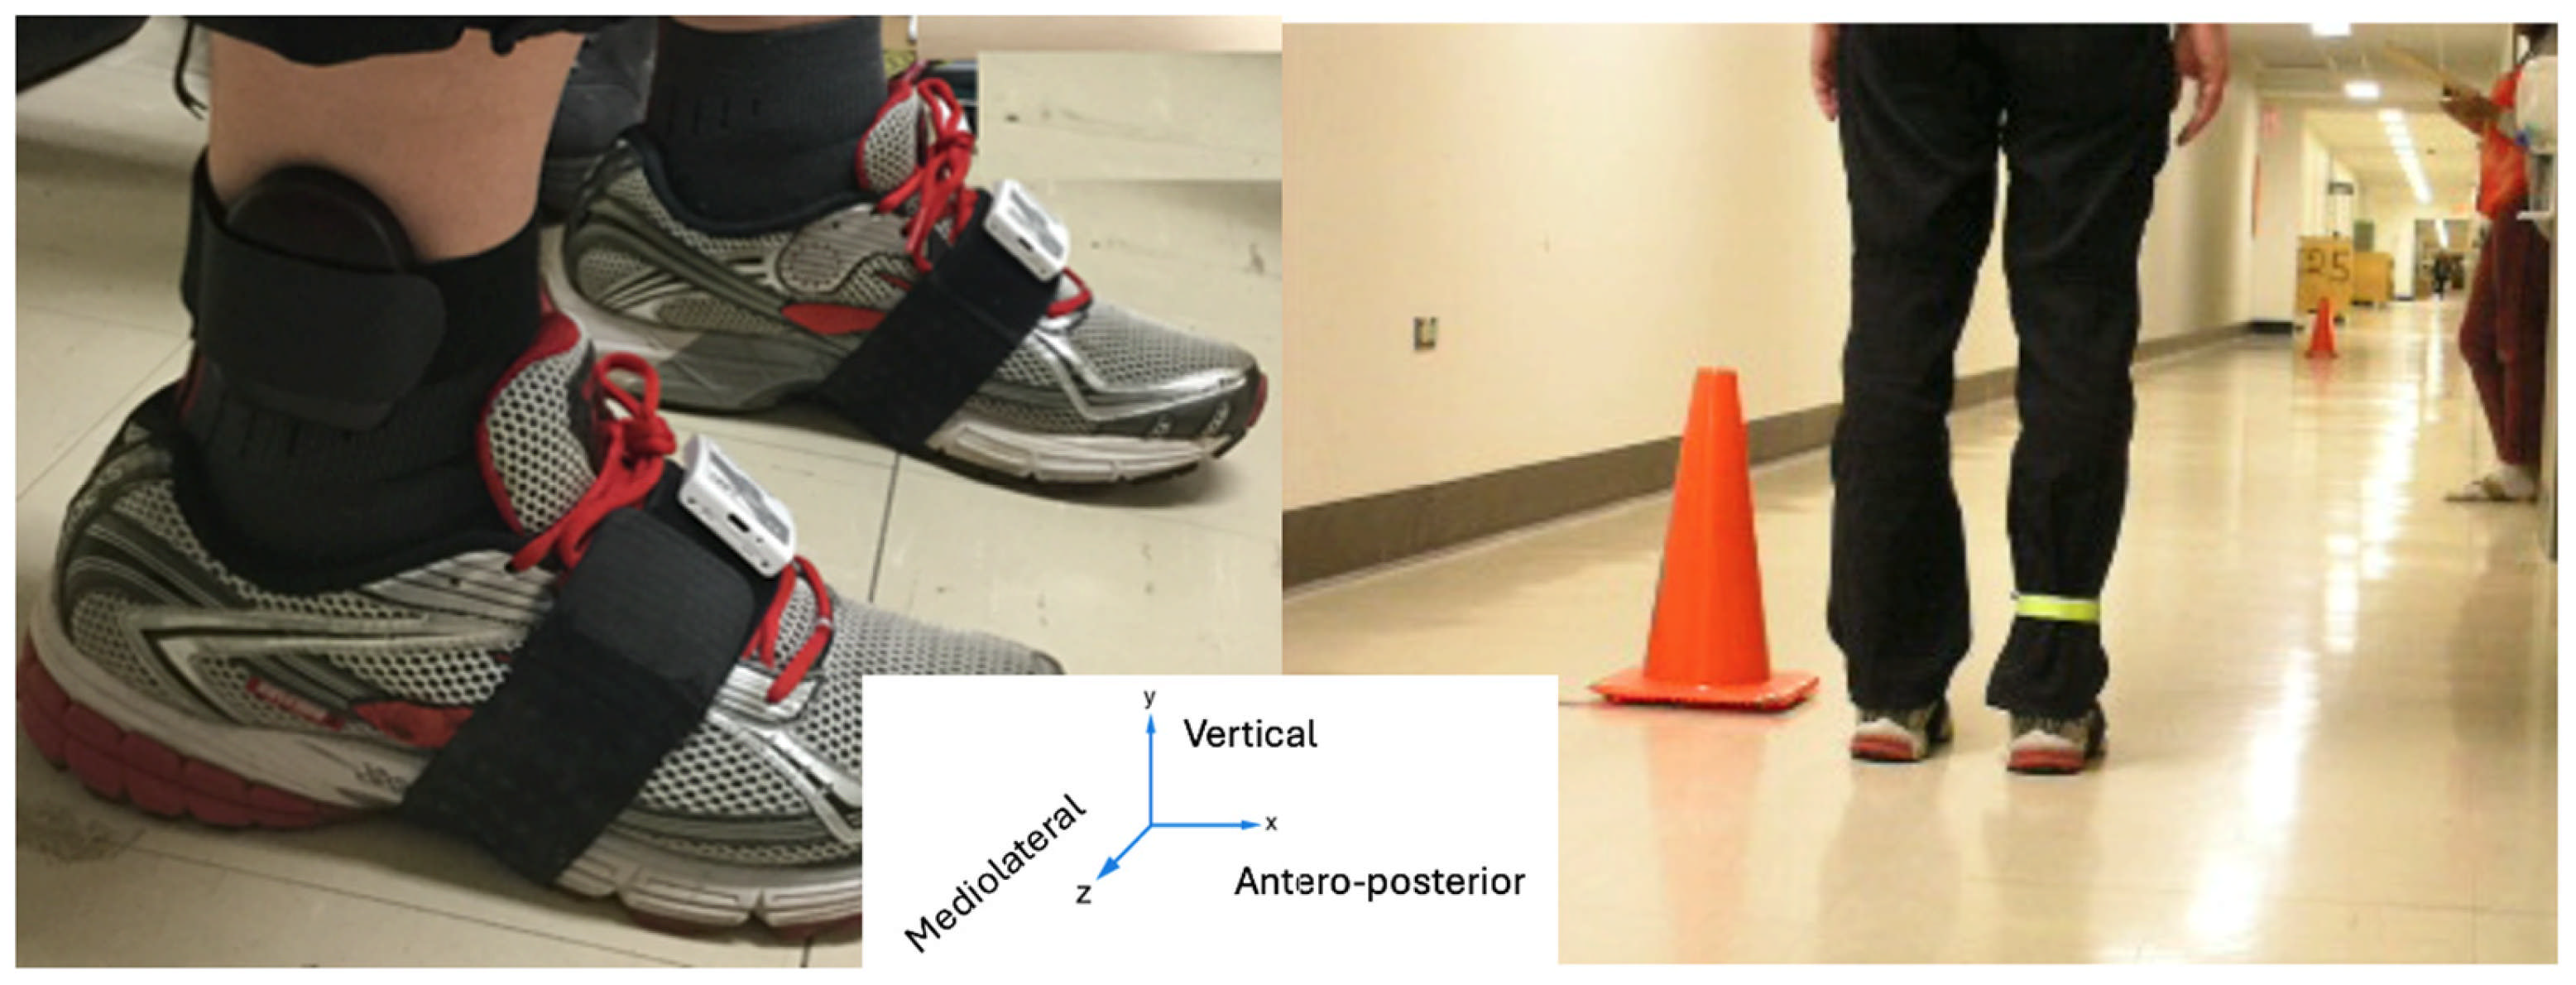
Two Gait Up monitors (firmware version 4.2.5.3, Physilog, Lausanne, Switzerland) were attached to both shoes (see Figure 3). The Gait Up monitors are composed of inertial measurement units embedded with an accelerometer, a gyroscope, and a barometer. The sampling rate of the Gait Up monitors is 200 Hz. The Gait Up monitors were validated for stride length using an eight camera motion capture system (Vicon, Oxford Metrics, Oxford, UK, 200 Hz), which was considered as reference system by Schwameder et al. [53].

2.3. Phase Segmentation of Signal

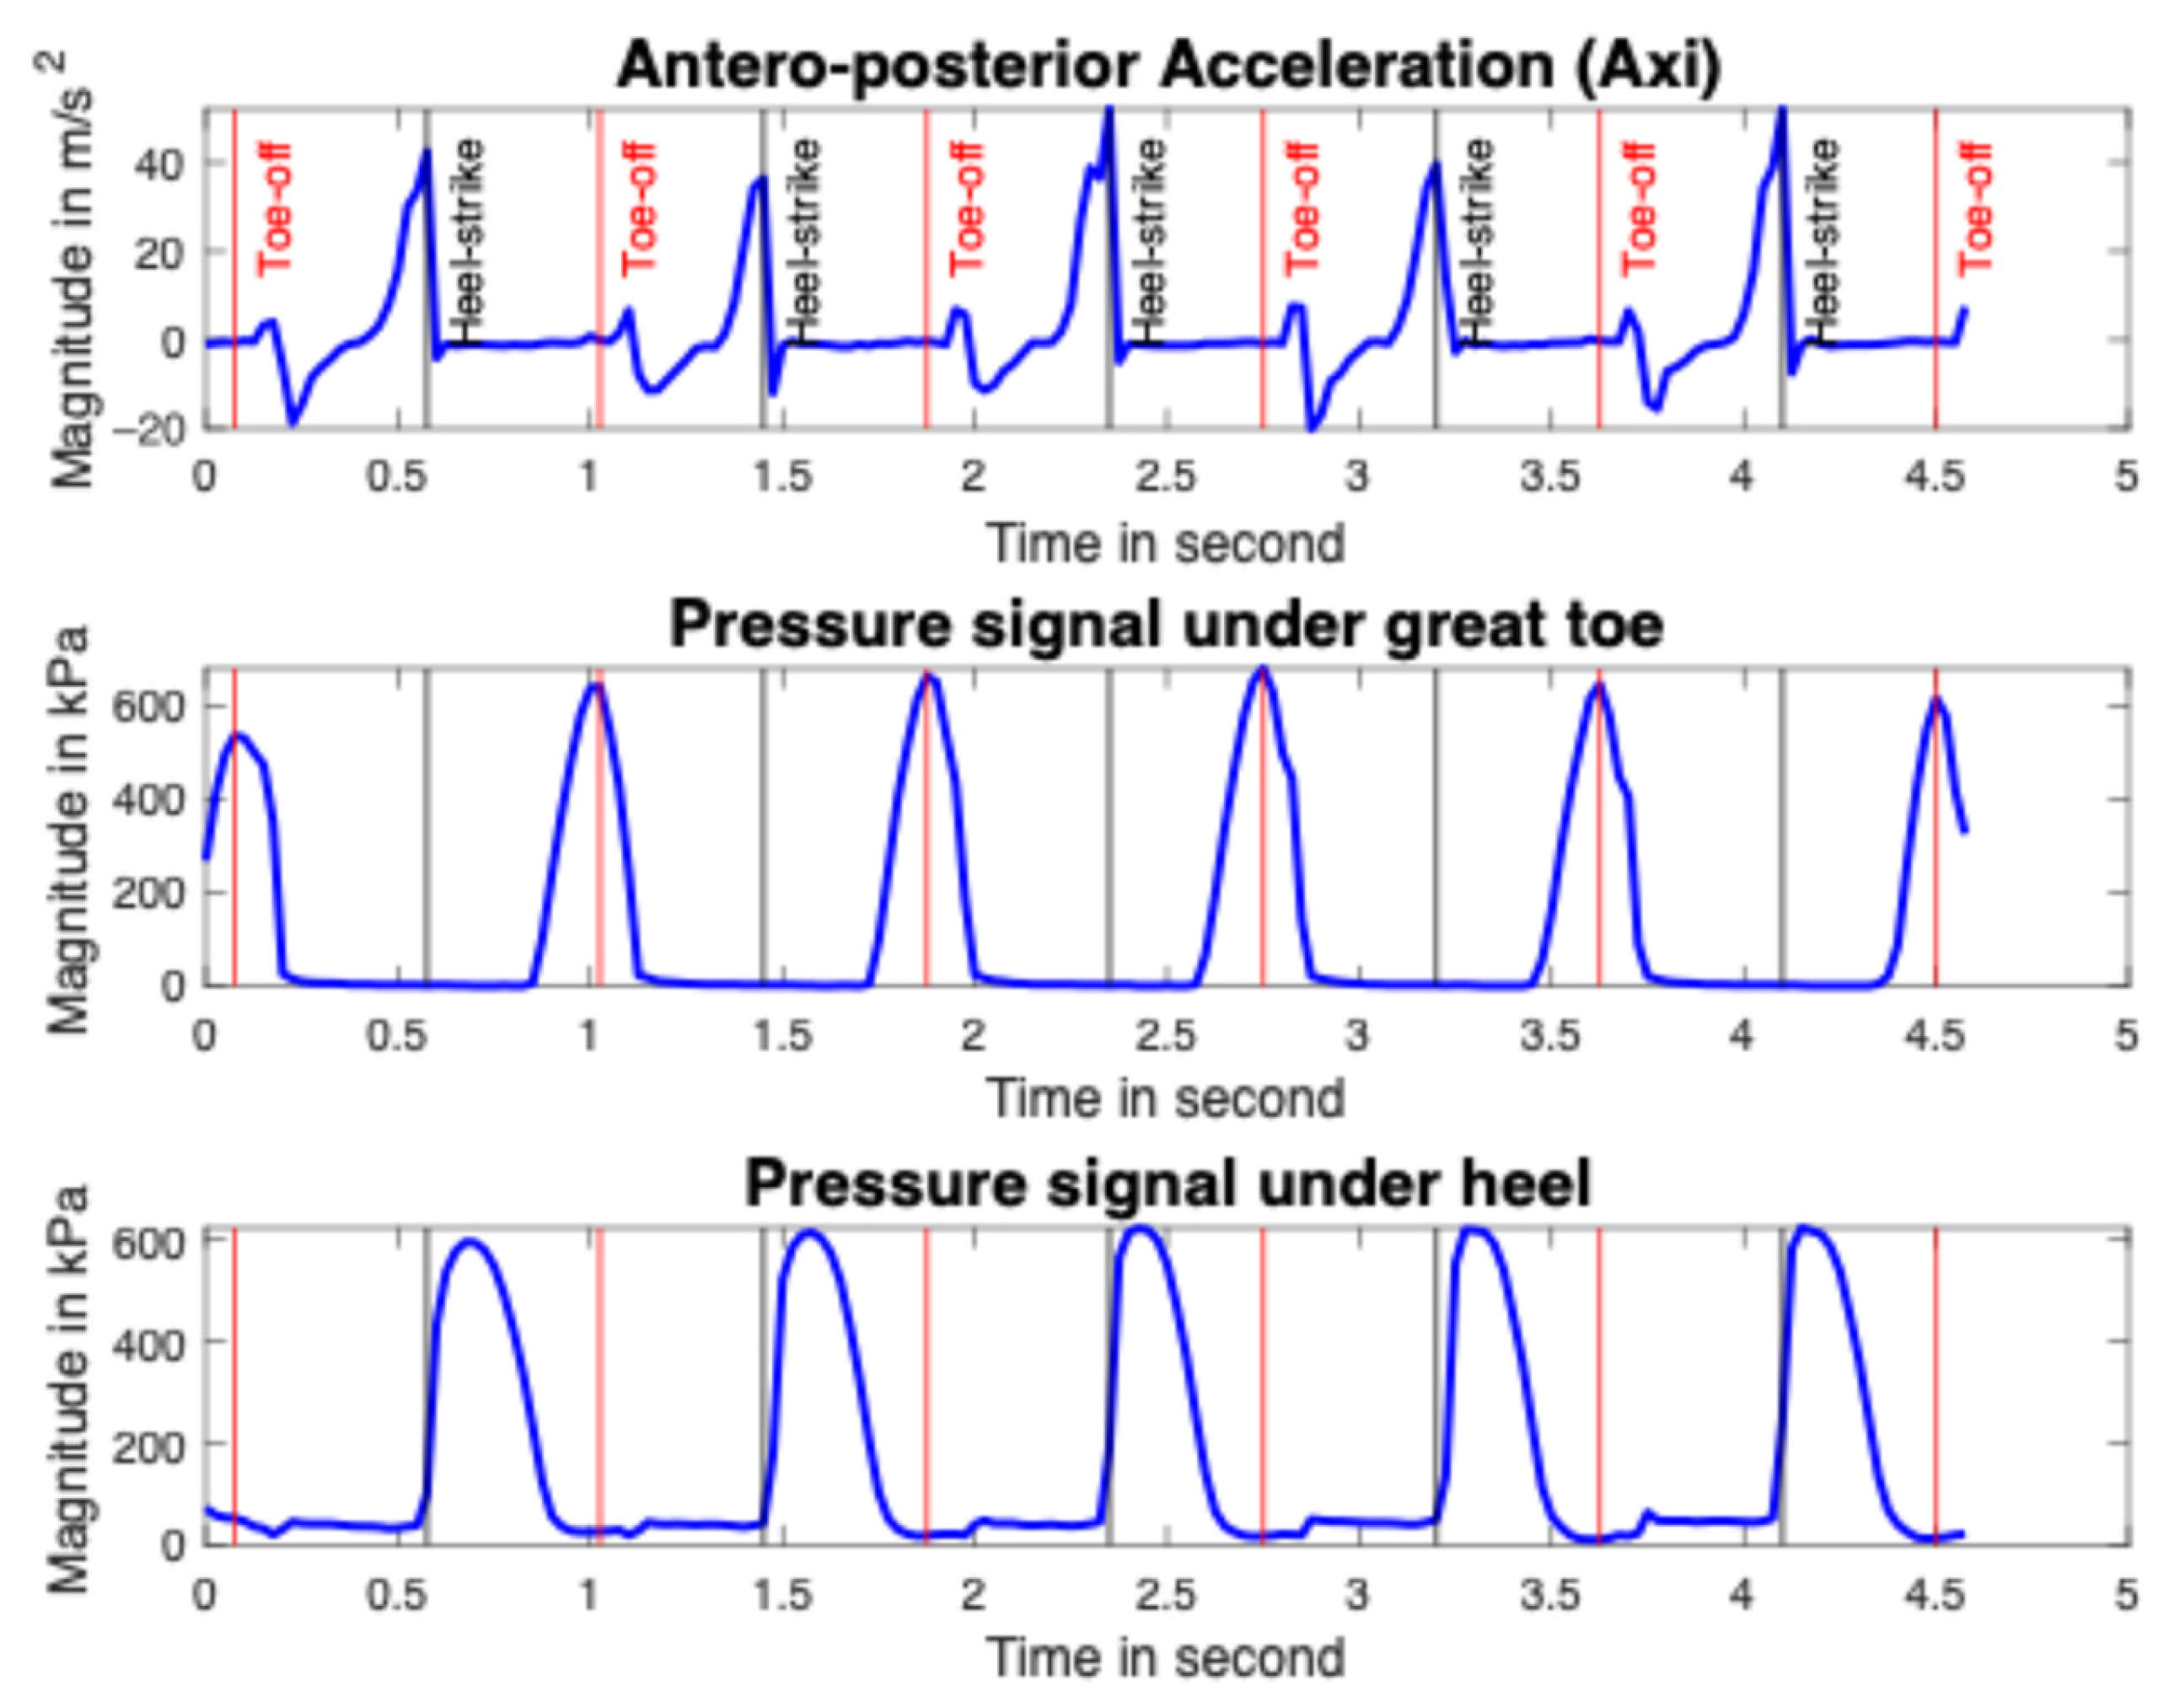
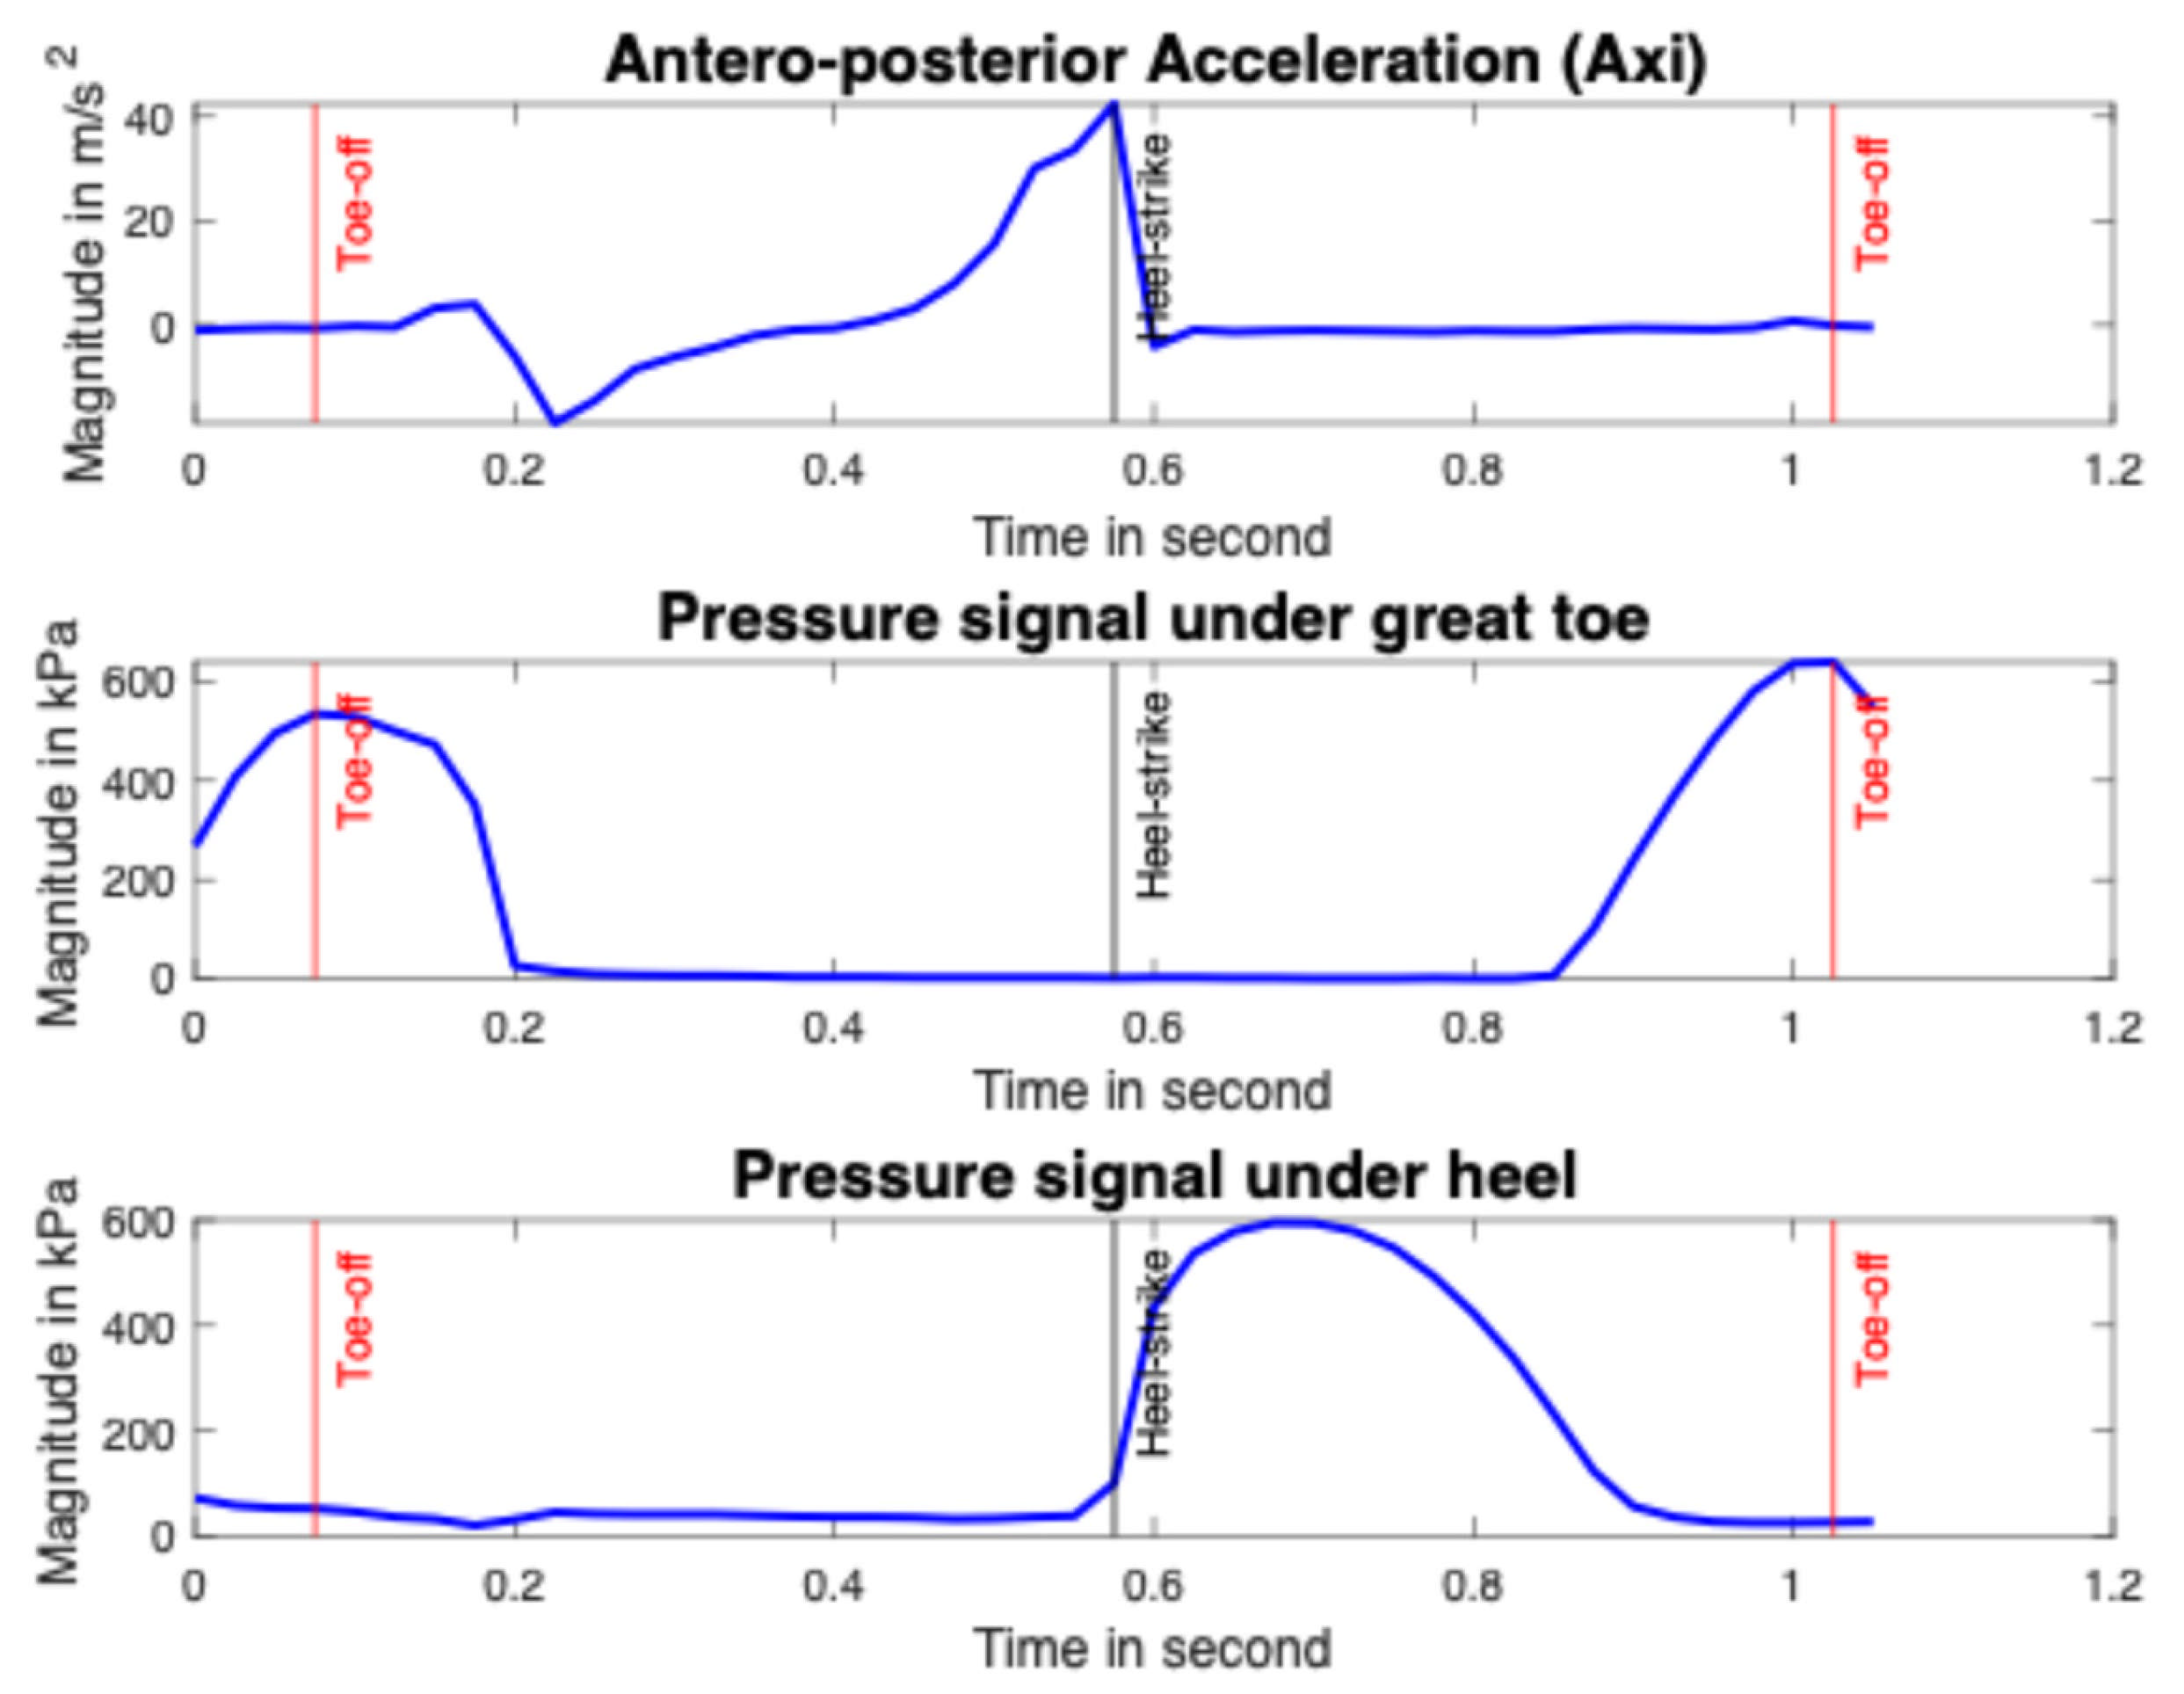
When it comes to smart insoles, gait events around the heel-strike and toe-off were automatically identified using the antero–posterior acceleration, the pressure data under the heel and great toe (see Figure 4 and Figure 5). A toe-off event appeared just at the end of the maximum pressure under the toe, and a heel-strike event occurred at the start of the heel pressure increase [54]. On the acceleration data, the toe-off event fits with the antero-posterior acceleration increasing start and the heel-strike event matches with the maximum antero–posterior acceleration peak [55]. For identification of toe-off events, the function “findpeaks” in the MATLAB software version R2021b (MathWorks, Natick, MA, USA) is used on the pressure under the great toe. The function “islocalmax” is used on the antero–posterior acceleration data for the identification of heel-strike. In fact, the function “islocalmax” returns a logical array, whose elements are 1 (true) when a local maximum is detected in the corresponding element of the acceleration. The function “find” is then used to return a vector containing the linear indices of each non-zero element in logical array. The function “vertcat” is finally used to concatenate arrays vertically.
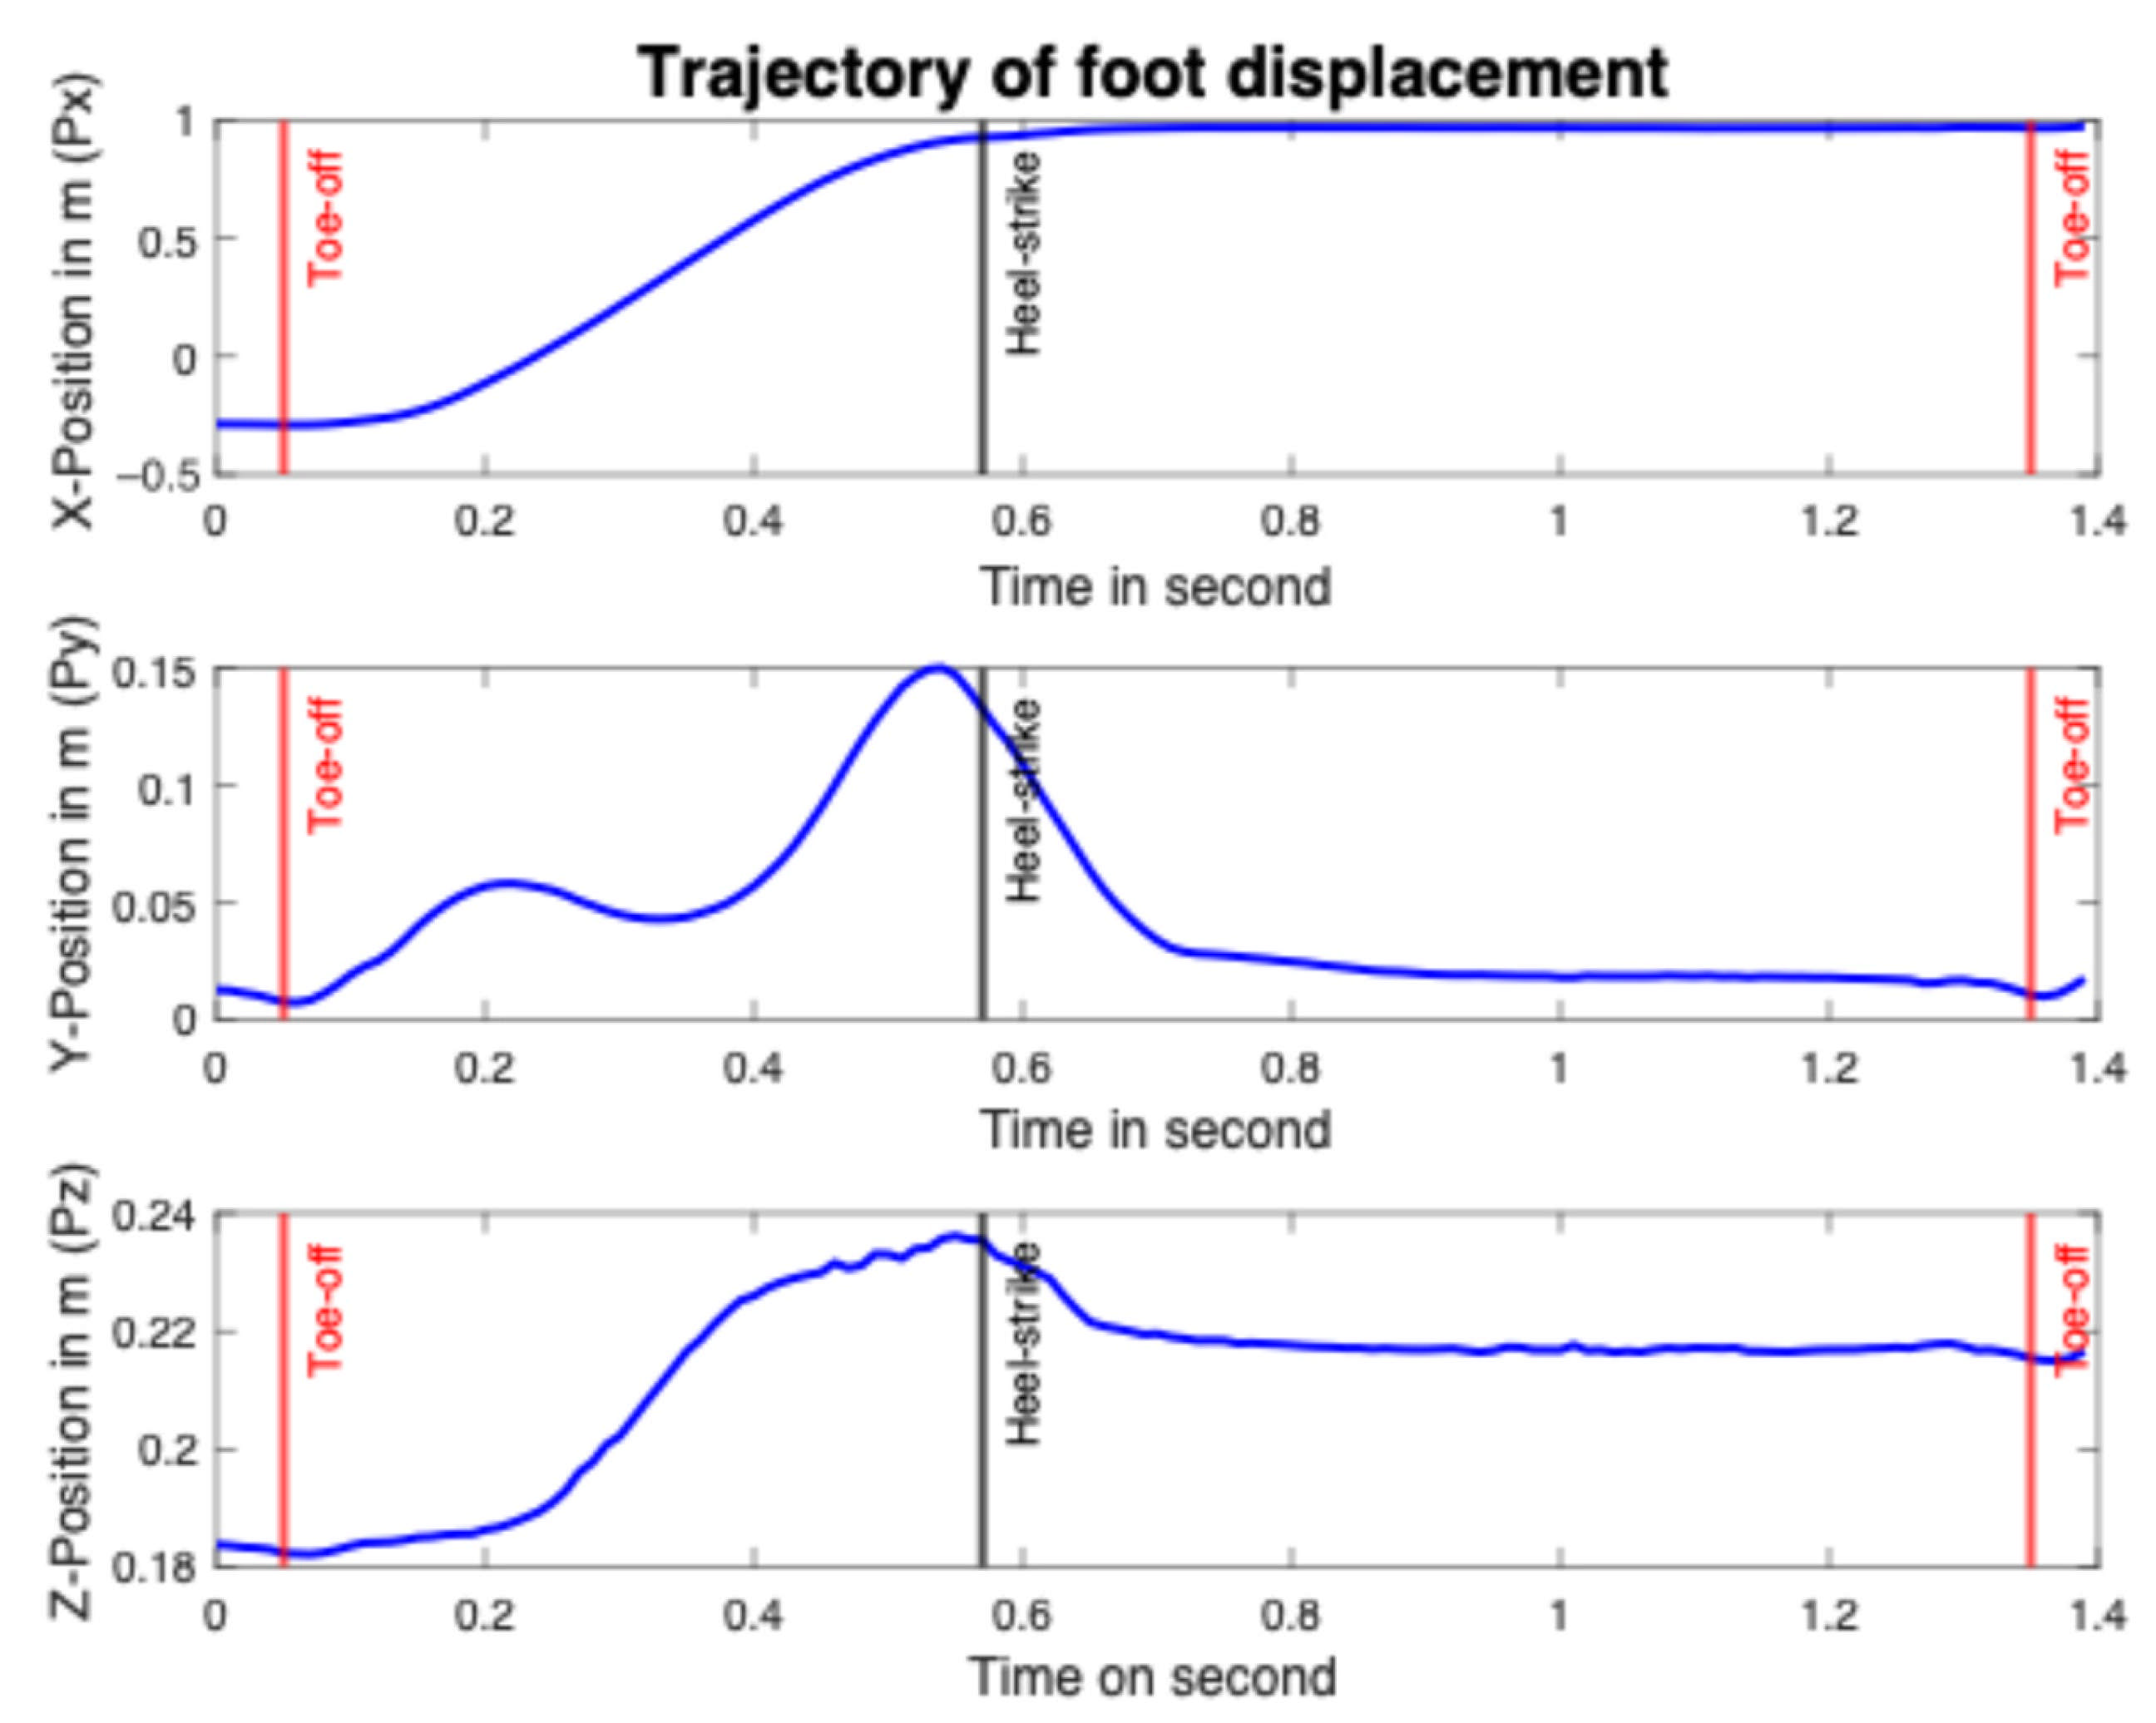
When it comes to the polynomial model, the trajectories of the 3D positions were obtained using the OptiTrack motion capture system (version 1.1, NaturalPoint, Corvallis, OR, USA). Six markers were positioned on the metatarsals (n = 3), cuboid, calcaneus, and talus of a participant. A participant performed six strides at a predefined distance of 3 m back and forth pathway. The sampling rate is 100 Hz. In accordance with the literature, toe-off and heel-strike events were identified in 3D position data [56,57,58,59]. Each toe-off event was defined as the instant of minimum resulting vertical displacement in the time range of 0.1 s to 0.8 s (as seen in Figure 6), and used to segment consecutive gait cycles on vertical position trajectory. Each heel-strike was defined as the instant of the ceiling from the antero–posterior displacement (see Figure 6) [60].

2.4. Stride Length Model-Based Algorithms

Approach 1: This approach is based on the director coefficients of acceleration data using a reference model and smart insoles signals (acceleration and force sensors). The data of the reference model and smart insoles are measured on three axes (3D). However, only the antero–posterior direction is used in this approach. The displacement of position (Pm(t)) for the reference model (subscripted m to describe the model) can be represented as a 5th order polynomial. In this study, the initial position is zero for each toe-off, and the initial and final velocities are also zero [61], allowing to find the final position for the heel-strike. Therefore, the displacement of position becomes a 3rd order polynomial, described in Equation (3), defined as a vector of three elements:
P3 × nm(t) = c1t3 + c2t2 + c3t + c4 = [Pmx Pmy Pmz]T
where cj is a vector of constants (with 1 ≤ j ≤ 4) to find, t is the time over a window (segmented signal of the model) of n samples, T is the period of the corresponding stride cycle defined by two adjacent toe-off events, and Pm(t) is the resulting position model. The first and second derivatives make it possible to find the velocity Vm(t), described in Equation (4) and the acceleration Am(t) described in Equation (5), respectively. The representation of Vm(t) as a second order polynomial was reported in some studies [10,45].
V3 × nm (t) = 3c1t2 + 2c2t + c3 = [Vmx Vmy Vmz]T
A3 × nm (t) = 6c1t + 2c2 = [Amx Amy Amz]T
From these Equations (3)–(5), only x-axis (antero–posterior axis) is used Pmx, Vmx, and Amx. For the Approach 1, the ratio is calculated with the director coefficients of the antero–posterior acceleration of the smart insole (Asx(t), using subscript s for describing the signal acquired from the smart insole) and the reference model (Amx) illustrated in Eqaution (5). The director coefficient of the reference model is 6c1. For the smart insole, the straight line that best fits with the swing phase data (Asxn(t)) for n samples was determined based on the antero–posterior acceleration (Asx(t)) for each gait cycle. The “lsqcurvefit” function was used to determine the director coefficient of Asxn(t)) for each gait cycle. The director coefficients have no units. This ratio (R) is then used to estimate the average stride length (L), as illustrated in Algorithm 1.
Algorithm 1: Model-based algorithm using director coefficients cj of acceleration data for stride length
Input: Acceleration A3 × ns(t) = [Asx, Asy, Asz]T, Ns stride count for the insole, and position P3 × nm (t) = [Pmx, Pmy, Pmz]T for the reference model
Output: Averaged stride length (L)
1: Determine the coefficients of the model position Pmx(t) in Equation (3)
2: Calculate velocity Vmx (t) in Equation (4)
3: Calculate acceleration Amx (t) of model in Equation (5)
4: For number of strides (Ns) do
  5: Segmentation, centering, and determination of the straight line of Asxn(t) of insole
  6: Determine the ratio of director coefficients (R) of the accelerations of model and insole
  7: Calculate mean of this ratio (R)
8: End for
9: Return R
10: Calculate average stride length (L) by multiplying Px and R
Approach 2: This approach is based on the dynamic time warping (DTW) algorithm, which aligns the acceleration data of the reference model with that of the smart insoles. In general, the DTW is an algorithm which can be used to estimate the distance between two data sequences by aligning points [62]. In this approach, DTW is used to estimate the distance by aligning the antero–posterior accelerations of the reference model and the smart insoles. In addition, the coefficient (S) for n samples in Equation (6) is calculated as follows:
S = 1/||Asxn||
where ||Asxn|| represents the absolute value of the antero–posterior acceleration during the swing phase. The estimation of the DTW value (d(t)) between the acceleration data of the reference model (Amxn(t)) and the smart insole (Asxn(t)) for n samples is illustrated in Equation (7) below:
dn(t) = DTW(Amxn(t),Asxn(t))
Next, Equation (8) calculated the coefficient (S) multiplied by mean of d(t) as illustrated below:
E = mean(dn(t))S
where Amxn represents the antero–posterior acceleration of the reference model for n samples and Asxn represents the antero–posterior acceleration of the smart insole for n samples. The average stride length (L) is calculated by multiplying E by the position Px of the model as illustrated in Algorithm 2.
Algorithm 2: Model-based algorithm using the DTW for stride length
Input: Acceleration A3 × nm (t) = [Amx, Amy, Amz]T, Ns stride count for the insole, and position P3 × nm (t) = [Pmx, Pmy, Pmz]T for the reference model
Output: Averaged stride length (L),
1: Determine the coefficients of the model position Pmx(t) in Equation (3)
2: Calculate velocity Vmx(t) of model in Equation (4)
3: Calculate acceleration Amx(t) of model in Equation (5)
4: Determine coefficient (S) in Equation (6)
5: For number of strides do
  6: Segmentation, centering, and determination of the straight line of Asxn(t)
  7: Calculate dn(t) in Equation (7)
  8: Calculate E in Equation (8)
9: End for
10: Return E
11: Determine L by multiplying Px and E

2.5. Statistical Analysis

The average stride length and total distance covered by each participant were calculated separately for the right and left sides for each approach. Thus, the total distance was estimated as illustrated in (1). The intraclass correlation coefficient (ICC) values and confidence intervals (CI) were calculated to determine the relative validity of each stride length and the total distance from the smart insoles or the Gait Up data compared with the actual data. ICC values are interpreted as follows: excellent (>0.90), good (0.75–0.90) moderate (0.50–0.74), and poor (<0.50) [63]. Since the sample size is small and the data distribution is non-normal, non-parametric statistical analyses were performed, particularly Mann–Whitney U tests. The Mann–Whitney U tests were used to determine whether there was a statistically significant difference between 1) Approach 1 and Approach 2 and 2) actual total distance and estimated distance from smart insoles and Gait Up. Data were analyzed using SPSS (version 29.0.2.0 (20); SPSS Inc., IBM, Chicago, IL, USA) and are reported as the median and interquartile. Statistical significance is defined as a p-value of less than 0.05.

3. Results

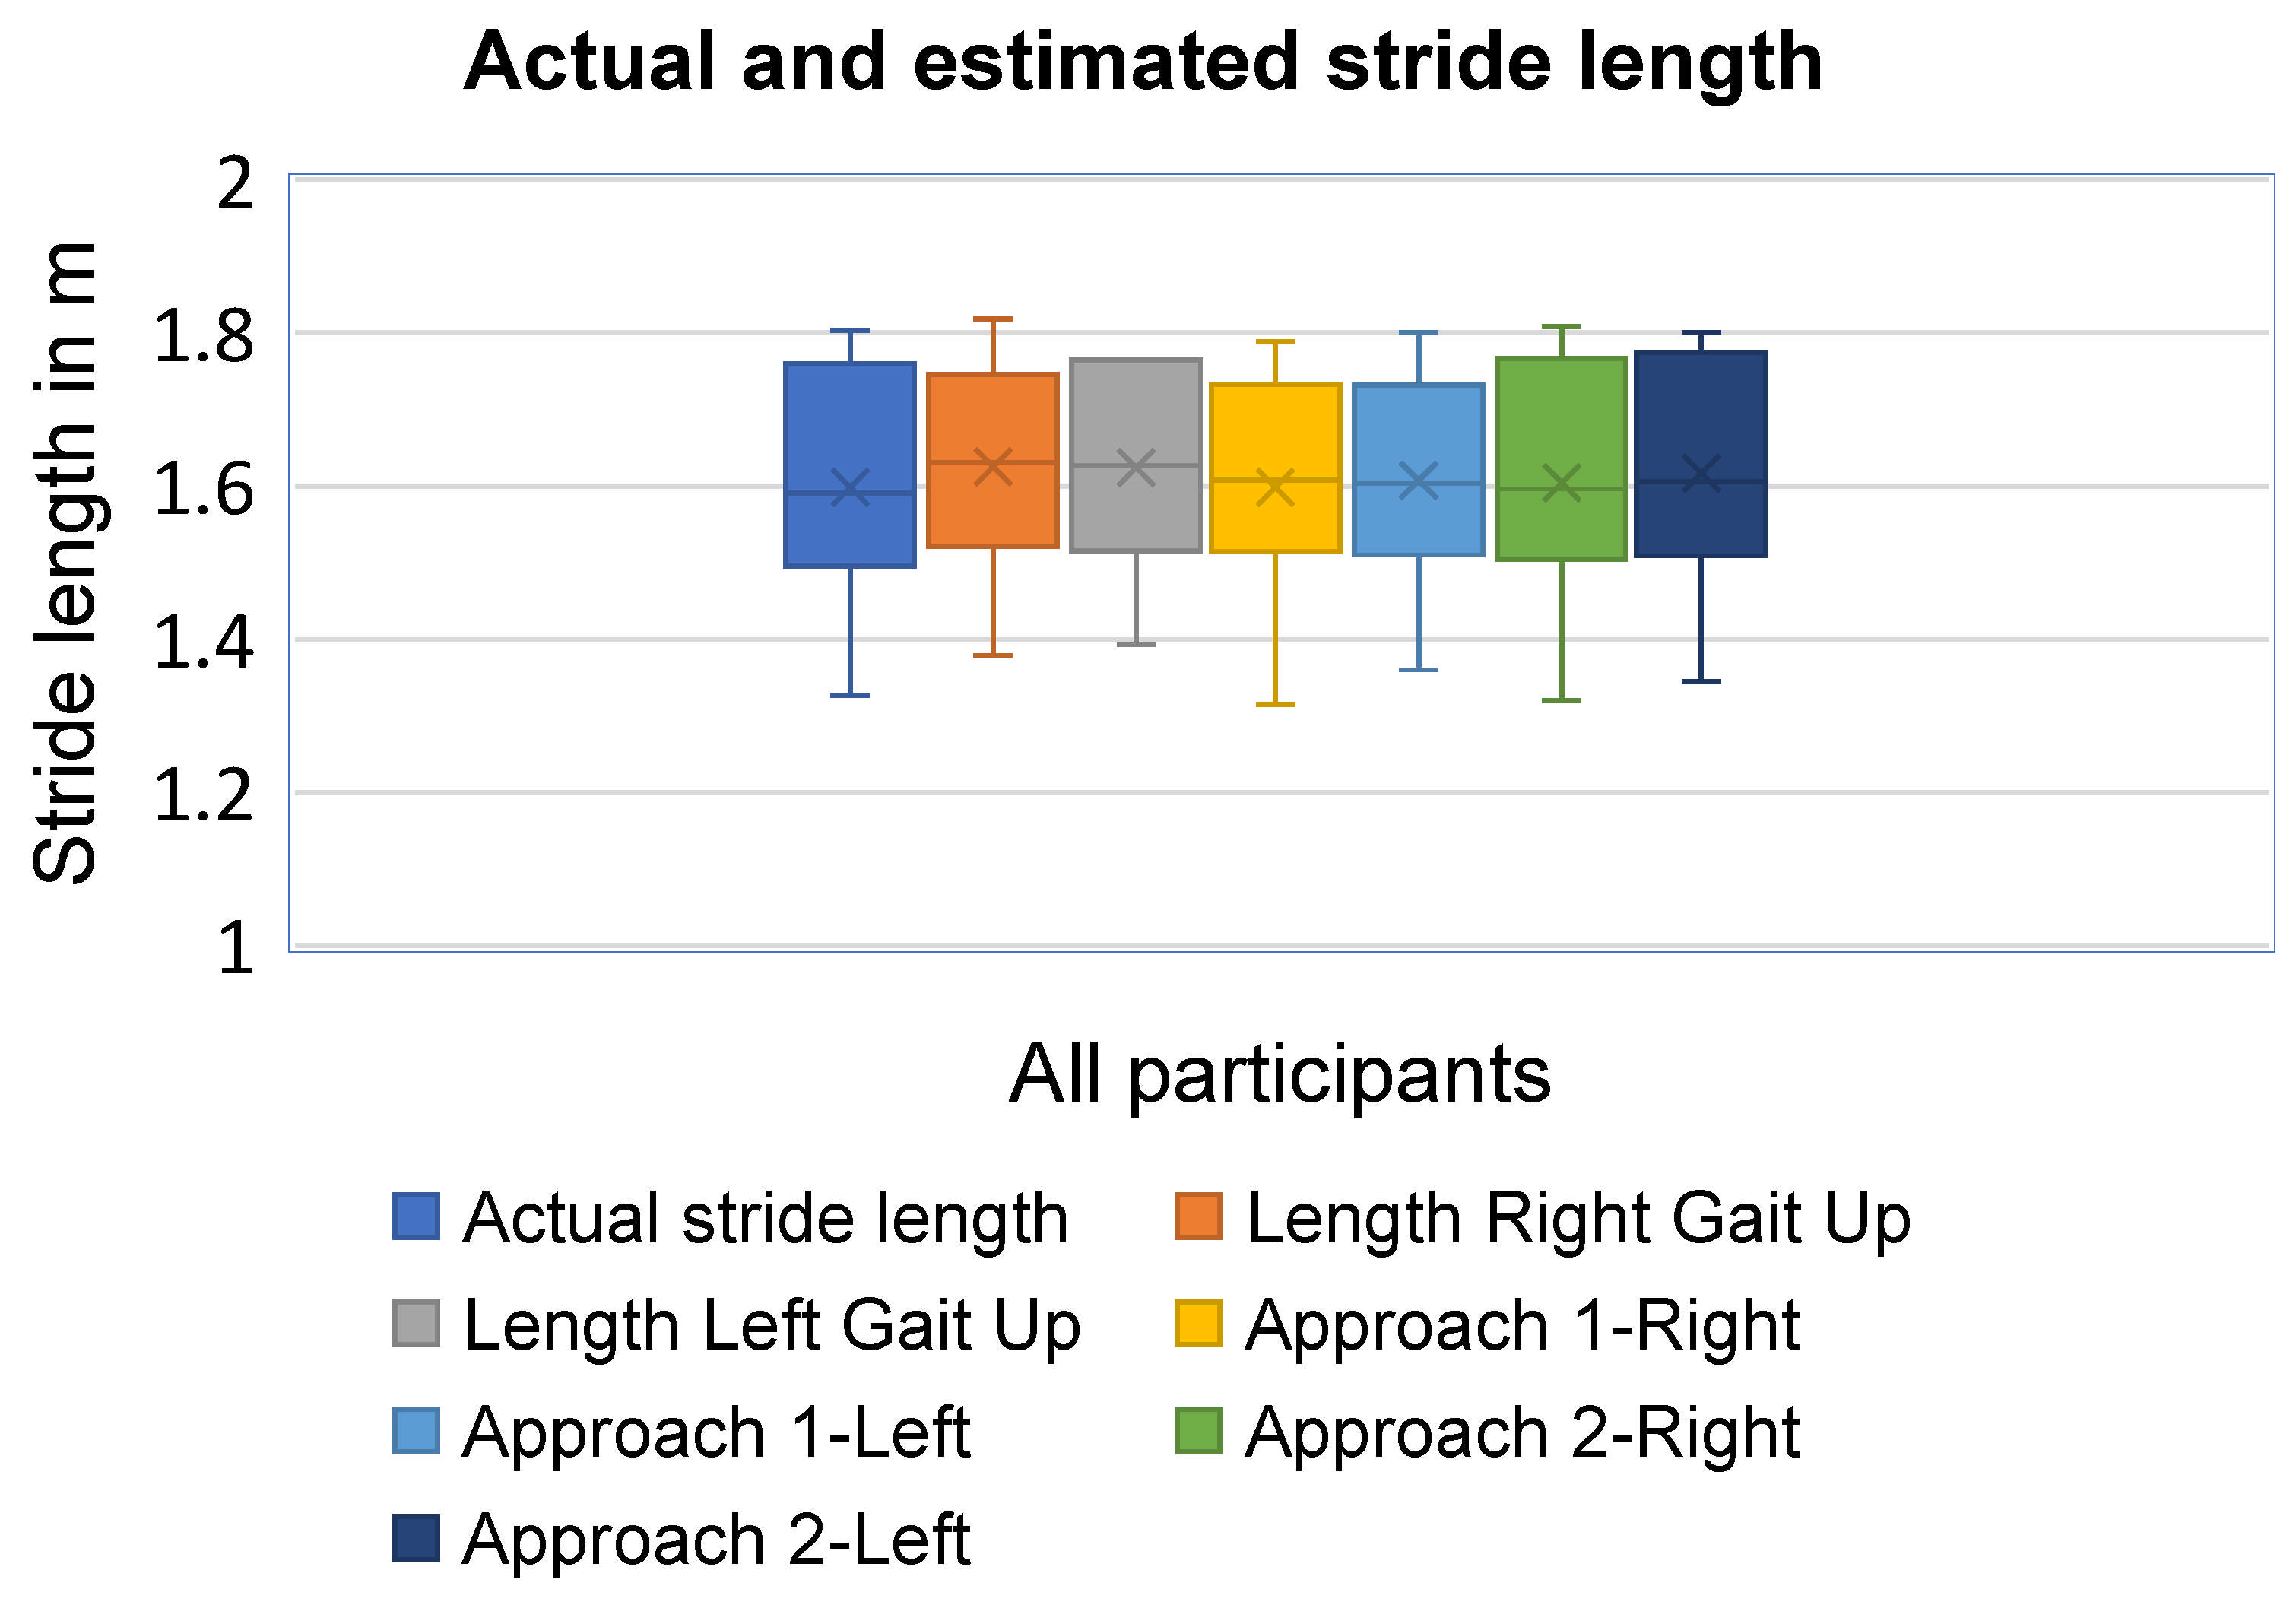
In this study, the actual stride length ranges from 1.327 m to 1.804 m, with a median [interquartile] of 1.591 [0.314] m at self-selected maximal safe walking speeds from 1.62 to 2.22 m/s (see Table 1 and Figure 7). An ICC of 0.977 (CI: 0.876–0.996) for the right side and 0.987 (CI: 0.878–0.996) for the left side are obtained for the stride length estimation using Gait Up monitors. For Approach 1 using smart insoles, the ICC of the stride length is 0.993 (CI: 0.846–0.999) and 0.995 (CI: 0.854–0.999) for the right and left sides, respectively. Similarly, ICC of 0.991 (CI: 0.726–0.999) and 0.993 (CI: 0.674–0.999) are reported for the right and left sides, respectively, using Approach 2 of the smart insoles for stride length estimation. The stride-length accuracies are presented in Table 2. There is no statistically significant difference between the two approaches using smart insoles for the stride length estimation (Mann–Whitney U test = 31.0, p = 0.959 for the right side, and U = 30.0, p = 0.878 for the left side) as illustrated in Table 3.
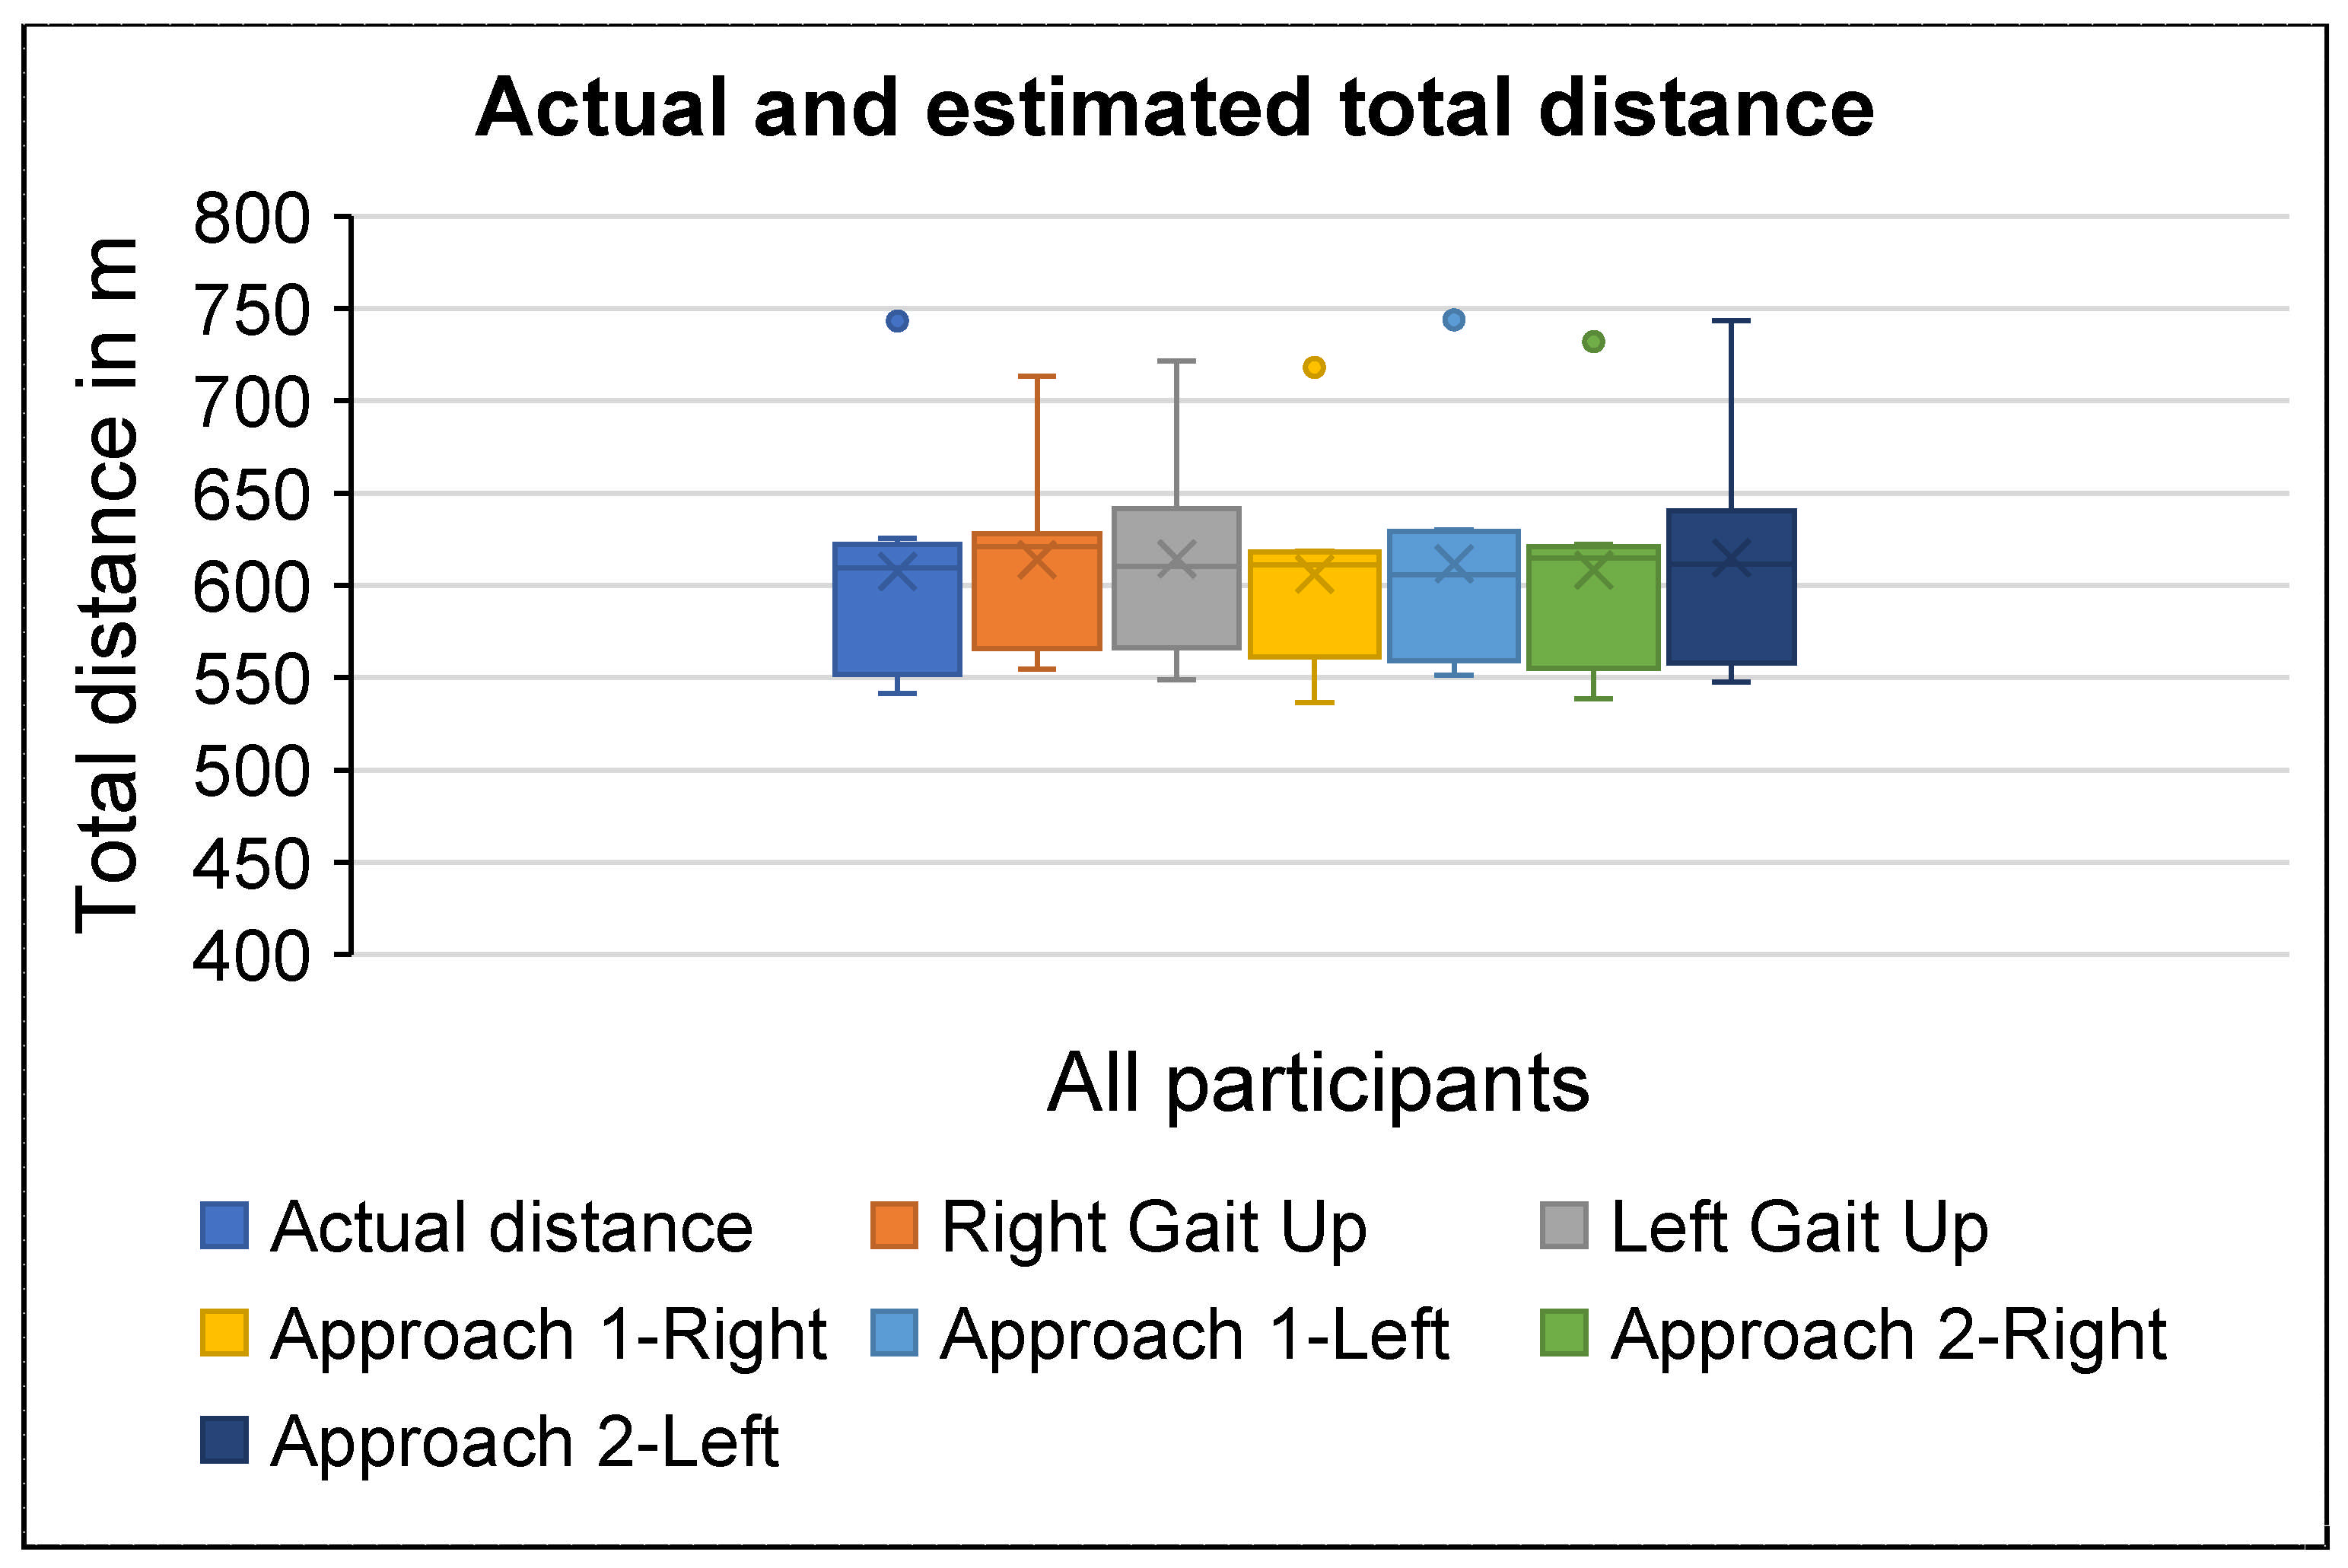
The actual total distance ranges from 541.4 m to 743.2 m with a median [interquartile] of 609.4 [199.4] meters (see Table 4 and Figure 8). The ICC for total distance is 0.980 (CI: 0.908–0.996) and 0.982 (CI: 0.917–0.996) for the right and left sides, respectively, when using the Gait Up monitors. The smart insoles based on Approach 1 yield an ICC of 0.992 (CI: 0.959–0.998) for the right side and 0.994 (CI: (0.972–0.999) for the left side. Furthermore, Approach 2 of the smart insoles provides an ICC of 0.996 (CI: 0.982–0.999) for the right side and 0.991 (CI: 0.941–0.998) for the left side. The total distance accuracy is listed in Table 5. There is no statistically significant difference between the actual distance and each estimated distance (Gait Up: U = 25.0; p = 0.505 (right), U = 27.0 p = 0.645 (left); Approach 1 of insole: U = 31.0; p = 0.959 (right), U = 26.0; p = 0.574 (left); Approach 2 of insole: U = 28.0; p = 0.721 (right) and U = 26.5; p = 0.599 (left)) as illustrated in Table 6.

4. Discussion

This study aimed to develop and validate novel model-based algorithms to estimate stride length and thus total distance using acceleration and pressure data integrated into a smart insole. Phase segmentation of the gait cycle was determined using heel-strike and toe-off events based on force sensors under the heel and great toe bones. The identification of toe-off and heel-strike events based on pressure data was consistent with that reported by Tirosh et al. [64]. In comparison to Suzuki’s study [39] which used only acceleration data, the use of pressure data enabled the detection of the toe-off event at the beginning of the antero–posterior acceleration increase. In Suzuki’s study [39], the toe-off event was detected as the instant of the first peak that appeared on the acceleration signal within the time interval between 0.1 and 0.4 s. The two selected approaches are based on the director coefficients of acceleration data (Approach 1) and dynamic time warping (Approach 2). The results show overall accuracy of over 97% with an ICC of 0.977 and higher for the stride length and the total distance using the Gait Up monitors. For Approach 1 of the smart insoles, the stride length, and total distance accuracies are greater than 98%, with an ICC of over 0.990. Accuracies of >98% with ICC > 0.991 are reported based on Approach 2 for stride length and total distance. There is no statistically significant difference between the reference distance and the estimated distance of either the Gait Up monitors or smart insoles. Altogether, the smart insoles and Gait Up monitors offer high accuracies for stride length and total distance estimation. In addition, the results of these two approaches of smart insoles were compared to those of the Gait Up monitors equipped with an IMU, and no statistically significant differences were observed.
In this study, the stride length is multiplied by the stride count to determine the total distance. However, the stride count used in this study yielded a mean accuracy of 99.90 ± 0.05%, resulting in an average error of 0.10% [52]. Another source of error in estimating total distance based on (1) can be derived from stride length estimation, as reported in this study. These two sources of error should be considered when using total distance estimation based on the formula (1) to interpret the results.
In the present study, the accuracies and ICC values of stride length and total distance are similar. These results show that although there was an error in stride counting, this error does not significantly affect the total distance estimation. Therefore, to determine the total distance that reflects the stride length, the stride count would need to be accurate. As Approach 2 was based on an algorithm and Approach 1 was based on a mathematical model, it was expected that Approach 2 would be more accurate. Contrary to our assumption that Approach 2 would be more accurate than Approach 1, the results of the two approaches are similar. This similarity could be due to the small sample size and the healthy participants with normal gaits.
In the literature, Pham et al. [37] reported distance accuracies of 98.89% to 99.26% using the conditional generative adversarial network-based regression approach and 98.57% using a deep neural network approach. Overall total distance accuracies based on conventional regression methods ranged from 95.88% to 97.91% across several studies [21,22,30,46,48,65]. Based on the gait models, accuracies of 97% [18] for stride length and 95.6% [19] for total distance were reported (see Table 7). For the gait models based on inverted pendulum models, an ICC of 0.89 (CI: 0.77- 0.95) [66] and ICC of 0.756 to 0.929 [67] were reported for stride length. The total distance accuracies based on direct method ranged from 90% to 97% [17,21,23,68,69]. Although several studies estimated stride length using approaches based on biomechanical, empirical, and parametric regression models, significant estimation errors remain, ranging from 3.4% to 16% [10,27,29,70,71,72,73]. The development of novel approaches such as the DTW-based model and the acceleration director coefficient-based model, contributes to reducing stride length estimation errors and, consequently, in the total distance covered. In fact, the approach based on the acceleration director coefficient yielded median errors of 1.08% to 1.2%, and the DTW-based approach had median error of 0.83% for stride length. Similarly, median errors in total distance covered 1.07% to 1.44% for the approach based on the acceleration director coefficient and 0.3% to 1.03% for the DTW-based approach were reported in this study. Zrenner et al. [10] used only the foot acceleration data to estimate stride length, whereas the present study used the foot pressure and acceleration data. In fact, the stride segmentation was based on the initial ground contacts of the acceleration data in their study [10] compared to our study where the stride segmentation was performed using pressure and acceleration data. Furthermore, Zrenner et al. [10] used a quadratic regression model to estimate velocity but the used approach to estimate stride length was not reported, while our study used the director coefficients of acceleration data and DTW to estimate the stride length. Gradl et al. [45] used a method that could be similar to those proposed in this paper. The difference between their method and our method lies in (1) the determination of the integration value (Gradl’s team used smoothing of the raw acceleration signal, whereas this study used the best fitting of straight line of acceleration signal) and (2) the variable of interest which is velocity [45].
In Rampp’s study [43], a mean absolute error of 6.26 ± 5.56 cm with Spearman correlation 0.93 in geriatric people (82.1 ± 6.5 years old) with normal walk. The study’s Mariani was reported mean errors of 0.4 ± 6.1% and 2.1 ± 6.8 with ICC of 0.91 (CI: 0.79–0.96) to estimating stride length in older people (mean age of 17.6 ± 4.6 years) and young people (mean age 26.1 ± 2.8 years), respectively [9]. No statistically significant difference between the young and older people for estimating stride length was reported [9].
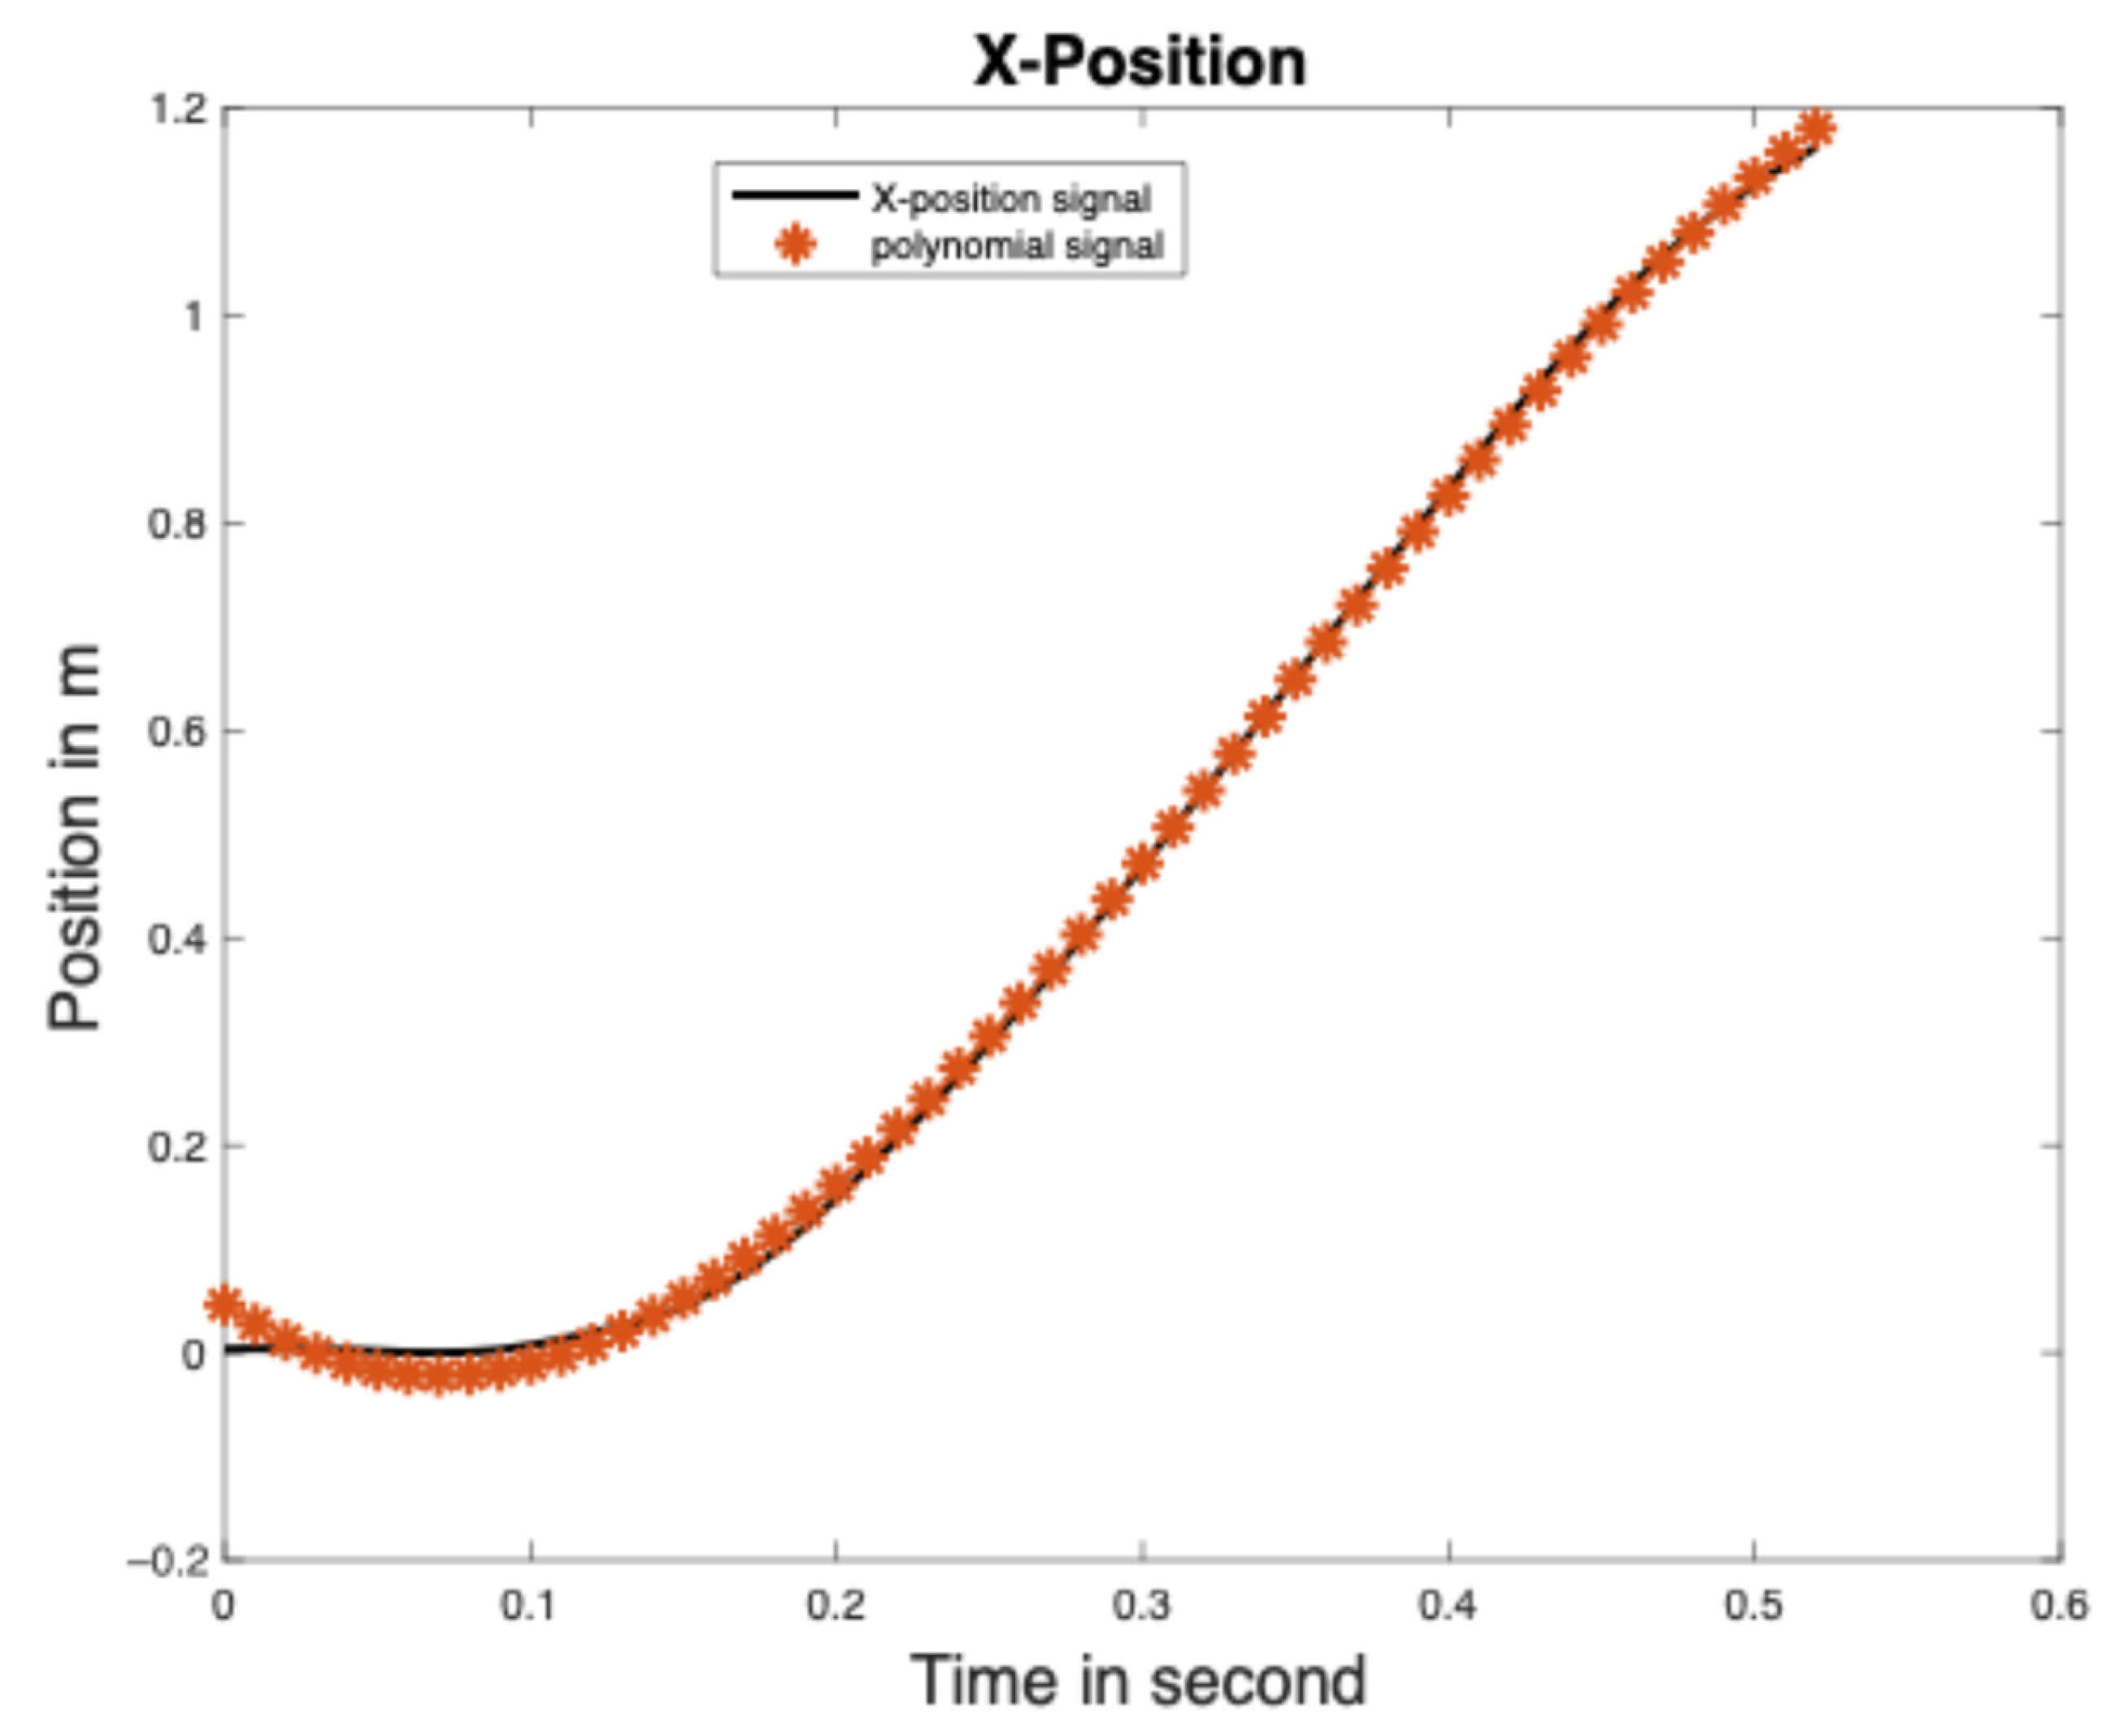
This study had the following three limitations: the error source in the position trajectory of the reference model, during a 180° turn of the predefined pathway, and the use of a single axis of acceleration data to estimate stride length then losing information on rotation. In fact, the error of 4.6 cm appeared in the position/displacement trajectory during the time range of 0.0 s to 0.15 s (see Figure 9) when modelling the position trajectory as a third order polynomial. Another source of error can be derived from the displacement trajectory of the reference model, which was only considered for one participant’s data and differed from the path used by all the participants in this study. The total distance used as the gold standard did not consider the distance performed during a 180° turn, but only on 20 m straight line, yet the path was nearly oval, even with two parallel lines, as illustrated in Figure 1. Therefore, some distances are reduced to the actual total distance. Although the defined sensors positions are approximate, their positions in the interest zones can vary depending on participants’ morphological characteristics. The small sample size of this study does not enable the results to be generalized, although similar sample sizes are reported in the literature [69,74,75,76,77].
Further studies should consider the three axes of acceleration to avoid losing information on rotation when estimating stride length, and a gyroscope should be used in combination. Similarly, a motion capture system should be used as a reference system to estimate total distance covered in order to avoid systematic bias due to the reference distance (by multiplying round trips by 40 m). Before these approaches are used in real-world clinical practice, they will be assessed in people with gait impairments (stroke, Parkinson’s disease, frailty, etc.) to ensure the results can be generalized. Estimating the total distance covered is a parameter used to assess walking performance. Obtaining errors of approximately 1% in the estimation of the total distance covered could contribute to the use of smart insoles as a measurement tool when assessing walking performance in the future.

5. Conclusions

This study enabled the development and validation of two novel model-based approaches for measuring stride length for total distance estimation using a smart insole integrating accelerometer and pressure sensors in healthy participants. These two approaches are based on the director coefficients of the acceleration data (Approach 1) and dynamic time warping (Approach 2). Although the sample size was small and the reference system was not robust, the results showed that the accuracies and ICC values were very high for stride length and total distance estimations using both approaches. These approaches yielded similar results. Compared to model-based approaches in the literature, these two novel approaches appear to be more accurate for stride length and total distance estimation. However, further studies should be conducted, considering the limitations of this study.

Author Contributions

Conceptualization, A.-M.N., C.S.B. and M.J.-D.O.; methodology, A.-M.N., C.S.B. and M.J.-D.O.; software, A.-M.N. and M.J.-D.O.; validation, A.-M.N., C.S.B. and M.J.-D.O.; formal analysis, A.-M.N., C.S.B. and M.J.-D.O.; data curation, A.-M.N., C.S.B. and M.J.-D.O.; writing—original draft preparation, A.-M.N., writing—review and editing, C.S.B. and M.J.-D.O.; supervision, C.S.B. and M.J.-D.O. All authors have read and agreed to the published version of the manuscript.

Funding

A.-M. Ngueleu was supported by a doctoral scholarship from the Center for Interdisciplinary Research in Rehabilitation and Social Integration and Fonds de Recherche du Québec—Société et Culture (FRQSC)—(Grant no.: 2023-B2Z-321482). No additional funding was obtained for this work.

Institutional Review Board Statement

The research was conducted in accordance with the Declaration of Helsinki and the Tri-Council Policy Statement: Ethical Conduct for Research Involving Humans—TCPS 2 (2022). The study protocol was approved by the Research Ethics Committee of Centre Intégré Universitaire de Santé et de Services Sociaux de la Capitale-Nationale (CIUSSS-CN, Quebec, Canada) with number 2017-577. All data were anonymized, and participants obtained compensation of 20 $CAD for this study.

Informed Consent Statement

All participants have provided their consent.

Data Availability Statement

The data are published and available at https://doi.org/10.21227/fy4e-5220.

Acknowledgments

The authors thank all participants of this manuscript and Clinton Enow Tabi for his support during data collection.

Conflicts of Interest

The authors declare no conflicts of interest.

References

  1. Helmrich, S.P.; Ragland, D.R.; Leung, R.W.; Paffenbarger, R.S., Jr. Physical activity and reduced occurrence of non-insulin-dependent diabetes mellitus. N. Engl. J. Med. 1991, 325, 147–152. [Google Scholar] [CrossRef]
  2. Lee, I.-M.; Paffenbarger, R.S., Jr.; Hsieh, C.-c. Physical activity and risk of developing colorectal cancer among college alumni. JNCI J. Natl. Cancer Inst. 1991, 83, 1324–1329. [Google Scholar] [CrossRef] [PubMed]
  3. Paffenbarger, R.S., Jr.; Hyde, R.T.; Wing, A.L.; Lee, I.-M.; Jung, D.L.; Kampert, J.B. The association of changes in physical-activity level and other lifestyle characteristics with mortality among men. N. Engl. J. Med. 1993, 328, 538–545. [Google Scholar] [CrossRef] [PubMed]
  4. Sesso, H.D.; Paffenbarger, R.S., Jr.; Lee, I.-M. Physical activity and coronary heart disease in men: The Harvard Alumni Health Study. Circulation 2000, 102, 975–980. [Google Scholar] [CrossRef] [PubMed]
  5. Simpson, M.E.; Serdula, M.; Galuska, D.A.; Gillespie, C.; Donehoo, R.; Macera, C.; Mack, K. Walking trends among US adults: The behavioral risk factor surveillance system, 1987–2000. Am. J. Prev. Med. 2003, 25, 95–100. [Google Scholar] [CrossRef]
  6. Lee, I.-M.; Buchner, D.M. The importance of walking to public health. Med. Sci. Sports Exerc. 2008, 40, S512–S518. [Google Scholar] [CrossRef] [PubMed]
  7. Cimolin, V.; Galli, M. Summary measures for clinical gait analysis: A literature review. Gait Posture 2014, 39, 1005–1010. [Google Scholar] [CrossRef]
  8. Opasich, C.; Pinna, G.; Mazza, A.; Febo, O.; Riccardi, R.; Riccardi, P.; Capomolla, S.; Forni, G.; Cobelli, F.; Tavazzi, L. Six-minute walking performance in patients with moderate-to-severe heart failure; is it a useful indicator in clinical practice? Eur. Heart J. 2001, 22, 488–496. [Google Scholar] [CrossRef]
  9. Mariani, B.; Hoskovec, C.; Rochat, S.; Büla, C.; Penders, J.; Aminian, K. 3D gait assessment in young and elderly subjects using foot-worn inertial sensors. J. Biomech. 2010, 43, 2999–3006. [Google Scholar] [CrossRef]
  10. Zrenner, M.; Gradl, S.; Jensen, U.; Ullrich, M.; Eskofier, B.M. Comparison of different algorithms for calculating velocity and stride length in running using inertial measurement units. Sensors 2018, 18, 4194. [Google Scholar] [CrossRef]
  11. Sabatini, A.M. Quaternion-based strap-down integration method for applications of inertial sensing to gait analysis. Med. Biol. Eng. Comput. 2005, 43, 94–101. [Google Scholar] [CrossRef]
  12. Sabatini, A.M.; Martelloni, C.; Scapellato, S.; Cavallo, F. Assessment of walking features from foot inertial sensing. IEEE Trans. Biomed. Eng. 2005, 52, 486–494. [Google Scholar] [CrossRef] [PubMed]
  13. Ziagkas, E.; Loukovitis, A.; Zekakos, D.X.; Chau, T.D.-P.; Petrelis, A.; Grouios, G. A novel tool for gait analysis: Validation study of the smart insole podosmart®. Sensors 2021, 21, 5972. [Google Scholar] [CrossRef] [PubMed]
  14. Coutts, A.J.; Duffield, R. Validity and reliability of GPS devices for measuring movement demands of team sports. J. Sci. Med. Sport 2010, 13, 133–135. [Google Scholar] [CrossRef] [PubMed]
  15. Duffield, R.; Reid, M.; Baker, J.; Spratford, W. Accuracy and reliability of GPS devices for measurement of movement patterns in confined spaces for court-based sports. J. Sci. Med. Sport 2010, 13, 523–525. [Google Scholar] [CrossRef]
  16. Waldron, M.; Worsfold, P.; Twist, C.; Lamb, K. Concurrent validity and test–retest reliability of a global positioning system (GPS) and timing gates to assess sprint performance variables. J. Sports Sci. 2011, 29, 1613–1619. [Google Scholar] [CrossRef]
  17. Alvarez, J.C.; González, R.C.; Alvarez, D.; López, A.M.; Rodríguez-Uría, J. Multisensor approach to walking distance estimation with foot inertial sensing. In Proceedings of the 2007 29th Annual International Conference of the IEEE Engineering in Medicine and Biology Society, Lyon, France, 22–26 August 2007; IEEE: New York, NY, USA, 2007; pp. 5719–5722. [Google Scholar]
  18. Bennett, T.; Jafari, R.; Gans, N. An extended kalman filter to estimate human gait parameters and walking distance. In Proceedings of the 2013 American Control Conference, Washington, DC, USA, 17–19 June 2013; IEEE: New York, NY, USA, 2013; pp. 752–757. [Google Scholar]
  19. Meng, X.; Zhang, Z.-Q.; Wu, J.-K.; Wong, W.-C.; Yu, H. Self-contained pedestrian tracking during normal walking using an inertial/magnetic sensor module. IEEE Trans. Biomed. Eng. 2013, 61, 892–899. [Google Scholar] [CrossRef]
  20. Shih, W.-Y.; Chen, L.-Y.; Lan, K.-C. Estimating walking distance with a smart phone. In Proceedings of the 2012 Fifth International Symposium on Parallel Architectures, Algorithms and Programming, Taipei, Taiwan, 17–20 December 2012; IEEE: New York, NY, USA, 2012; pp. 166–171. [Google Scholar]
  21. Shin, S.; Park, C.; Kim, J.; Hong, H.; Lee, J. Adaptive step length estimation algorithm using low-cost MEMS inertial sensors. In Proceedings of the 2007 IEEE Sensors Applications Symposium, San Diego, CA, USA, 6–8 February 2007; IEEE: New York, NY, USA, 2007; pp. 1–5. [Google Scholar]
  22. Wang, J.-S.; Lin, C.-W.; Yang, Y.-T.C.; Ho, Y.-J. Walking pattern classification and walking distance estimation algorithms using gait phase information. IEEE Trans. Biomed. Eng. 2012, 59, 2884–2892. [Google Scholar] [CrossRef]
  23. Wang, Y.; Xu, J.; Xu, X.; Wu, X.; Pottie, G.; Kasier, W. Inertial sensor based motion trajectory visualization and quantitative quality assessment of hemiparetic gait. In Proceedings of the 8th International Conference on Body Area Networks, Boston, MA, USA, 30 September–2 October 2013; pp. 169–172. [Google Scholar]
  24. Díez, L.E.; Bahillo, A.; Otegui, J.; Otim, T. Step length estimation methods based on inertial sensors: A review. IEEE Sens. J. 2018, 18, 6908–6926. [Google Scholar] [CrossRef]
  25. Hutabarat, Y.; Owaki, D.; Hayashibe, M. Recent advances in quantitative gait analysis using wearable sensors: A review. IEEE Sens. J. 2021, 21, 26470–26487. [Google Scholar] [CrossRef]
  26. Vezočnik, M.; Juric, M.B. Average step length estimation models’ evaluation using inertial sensors: A review. IEEE Sens. J. 2018, 19, 396–403. [Google Scholar] [CrossRef]
  27. Miyazaki, S. Long-term unrestrained measurement of stride length and walking velocity utilizing a piezoelectric gyroscope. IEEE Trans. Biomed. Eng. 1997, 44, 753–759. [Google Scholar] [CrossRef] [PubMed]
  28. Tjhai, C.; O’Keefe, K. Step-size estimation using fusion of multiple wearable inertial sensors. In Proceedings of the 2017 International Conference on Indoor Positioning and Indoor Navigation (IPIN), Sapporo, Japan, 18–21 September 2017; IEEE: New York, NY, USA, 2017; pp. 1–8. [Google Scholar]
  29. Kim, J.W.; Jang, H.J.; Hwang, D.-H.; Park, C. A step, stride and heading determination for the pedestrian navigation system. J. Glob. Position. Syst. 2004, 3, 273–279. [Google Scholar] [CrossRef]
  30. Weinberg, H. Using the ADXL202 in Pedometer and Personal Navigation Applications; Analog Devices: Norwood, MA, USA, 2002; Volume 2, pp. 1–6. [Google Scholar]
  31. Xia, H.; Zuo, J.; Liu, S.; Qiao, Y. Indoor localization on smartphones using built-in sensors and map constraints. IEEE Trans. Instrum. Meas. 2018, 68, 1189–1198. [Google Scholar] [CrossRef]
  32. Do, T.-N.; Liu, R.; Yuen, C.; Zhang, M.; Tan, U.-X. Personal dead reckoning using IMU mounted on upper torso and inverted pendulum model. IEEE Sens. J. 2016, 16, 7600–7608. [Google Scholar] [CrossRef]
  33. Jiang, Y.; Li, Z.; Wang, J. Ptrack: Enhancing the applicability of pedestrian tracking with wearables. IEEE Trans. Mob. Comput. 2018, 18, 431–443. [Google Scholar] [CrossRef]
  34. Zijlstra, W.; Hof, A.L. Assessment of spatio-temporal gait parameters from trunk accelerations during human walking. Gait Posture 2003, 18, 1–10. [Google Scholar] [CrossRef]
  35. Bousdar Ahmed, D.; Diaz, E.M.; Garcia Dominguez, J.J. Automatic calibration of the step length model of a pocket INS by means of a foot inertial sensor. Sensors 2020, 20, 2083. [Google Scholar] [CrossRef]
  36. Martinelli, A.; Gao, H.; Groves, P.D.; Morosi, S. Probabilistic context-aware step length estimation for pedestrian dead reckoning. IEEE Sens. J. 2017, 18, 1600–1611. [Google Scholar] [CrossRef]
  37. Pham, T.T.; Suh, Y.S. Conditional generative adversarial network-based regression approach for walking distance estimation using waist-mounted inertial sensors. IEEE Trans. Instrum. Meas. 2022, 71, 2510113. [Google Scholar] [CrossRef]
  38. Wang, A.; Ou, X.; Wang, B. Improved step detection and step length estimation based on pedestrian dead reckoning. In Proceedings of the 2019 IEEE 6th International Symposium on Electromagnetic Compatibility (ISEMC), Nanjing, China, 1–4 November 2019; pp. 1–4. [Google Scholar]
  39. Suzuki, Y.; Hahn, M.E.; Enomoto, Y. Estimation of foot trajectory and stride length during level ground running using foot-mounted inertial measurement units. Sensors 2022, 22, 7129. [Google Scholar] [CrossRef] [PubMed]
  40. Peruzzi, A.; Della Croce, U.; Cereatti, A. Estimation of stride length in level walking using an inertial measurement unit attached to the foot: A validation of the zero velocity assumption during stance. J. Biomech. 2011, 44, 1991–1994. [Google Scholar] [CrossRef] [PubMed]
  41. Skog, I.; Handel, P.; Nilsson, J.-O.; Rantakokko, J. Zero-velocity detection—An algorithm evaluation. IEEE Trans. Biomed. Eng. 2010, 57, 2657–2666. [Google Scholar] [CrossRef] [PubMed]
  42. Bamberg, S.J.M.; Benbasat, A.Y.; Scarborough, D.M.; Krebs, D.E.; Paradiso, J.A. Gait analysis using a shoe-integrated wireless sensor system. IEEE Trans. Inf. Technol. Biomed. 2008, 12, 413–423. [Google Scholar] [CrossRef]
  43. Rampp, A.; Barth, J.; Schülein, S.; Gaßmann, K.-G.; Klucken, J.; Eskofier, B.M. Inertial sensor-based stride parameter calculation from gait sequences in geriatric patients. IEEE Trans. Biomed. Eng. 2014, 62, 1089–1097. [Google Scholar] [CrossRef]
  44. Yang, S.; Mohr, C.; Li, Q. Ambulatory running speed estimation using an inertial sensor. Gait Posture 2011, 34, 462–466. [Google Scholar] [CrossRef]
  45. Gradl, S.; Zrenner, M.; Schuldhaus, D.; Wirth, M.; Cegielny, T.; Zwick, C.; Eskofier, B.M. Movement speed estimation based on foot acceleration patterns. In Proceedings of the 2018 40th Annual International Conference of the IEEE Engineering in Medicine and Biology Society (EMBC), Honolulu, HI, USA, 18–21 July 2018; IEEE: New York, NY, USA, 2018; pp. 3505–3508. [Google Scholar]
  46. Díaz, S.; Disdier, S.; Labrador, M.A. Step length and step width estimation using wearable sensors. In Proceedings of the 2018 9th IEEE Annual Ubiquitous Computing, Electronics & Mobile Communication Conference (UEMCON), New York, NY, USA, 8–10 November 2018; IEEE: New York, NY, USA, 2018; pp. 997–1001. [Google Scholar]
  47. Gu, F.; Khoshelham, K.; Yu, C.; Shang, J. Accurate step length estimation for pedestrian dead reckoning localization using stacked autoencoders. IEEE Trans. Instrum. Meas. 2018, 68, 2705–2713. [Google Scholar] [CrossRef]
  48. Hannink, J.; Kautz, T.; Pasluosta, C.F.; Barth, J.; Schülein, S.; Gaßmann, K.-G.; Klucken, J.; Eskofier, B.M. Mobile stride length estimation with deep convolutional neural networks. IEEE J. Biomed. Health Inform. 2017, 22, 354–362. [Google Scholar] [CrossRef]
  49. Klein, I.; Asraf, O. StepNet—Deep learning approaches for step length estimation. IEEE Access 2020, 8, 85706–85713. [Google Scholar] [CrossRef]
  50. Sui, J.-D.; Chang, T.-S. IMU based deep stride length estimation with self-supervised learning. IEEE Sens. J. 2021, 21, 7380–7387. [Google Scholar] [CrossRef]
  51. Wang, Q.; Luo, H.; Ye, L.; Men, A.; Zhao, F.; Huang, Y.; Ou, C. Personalized stride-length estimation based on active online learning. IEEE Internet Things J. 2020, 7, 4885–4897. [Google Scholar] [CrossRef]
  52. Ngueleu, A.-M.; Batcho, C.S.; Otis, M.J.-D. Comparison and validation of pressure and acceleration time-domain waveform models of a smart insole for accurate step count in healthy people. In Proceedings of the 9th International Conference on Bioinformatics Research and Applications, Berlin, Germany, 18–20 September 2022; pp. 129–134. [Google Scholar]
  53. Schwameder, H.; Andress, M.; Graf, E.; Strutzenberger, G. Validation of an IMU-System (Gait-Up) to identify gait parameters in normal and induced limping walking conditions. In Proceedings of the ISBS-Conference Proceedings Archive, Poitiers, France, 29 June–3 July 2015. [Google Scholar]
  54. Wang, B.; Rajput, K.S.; Tam, W.-K.; Tung, A.K.; Yang, Z. FreeWalker: A smart insole for longitudinal gait analysis. In Proceedings of the 2015 37th Annual International Conference of the IEEE Engineering in Medicine and Biology Society (EMBC), Milan, Italy, 25–29 August 2015; IEEE: New York, NY, USA, 2015; pp. 3723–3726. [Google Scholar]
  55. Yeh, Y.-H.; Yan, J.-L.; Gu, M.-X.; Chen, Y.-W.; Lee, T.-S. Frequency-domain analysis for accurate and robust gait cycle time detection with clinical data. In Proceedings of the 2022 44th Annual International Conference of the IEEE Engineering in Medicine & Biology Society (EMBC), Glasgow, UK, 11–15 July 2022; IEEE: New York, NY, USA, 2022; pp. 4200–4204. [Google Scholar]
  56. Asogwa, C.O.; Nagano, H.; Wang, K.; Begg, R. Using Deep Learning to Predict Minimum Foot–Ground Clearance Event from Toe-Off Kinematics. Sensors 2022, 22, 6960. [Google Scholar] [CrossRef] [PubMed]
  57. Begg, R.; Best, R.; Dell’Oro, L.; Taylor, S. Minimum foot clearance during walking: Strategies for the minimisation of trip-related falls. Gait Posture 2007, 25, 191–198. [Google Scholar] [CrossRef]
  58. Lai, D.T.; Taylor, S.B.; Begg, R.K. Prediction of foot clearance parameters as a precursor to forecasting the risk of tripping and falling. Hum. Mov. Sci. 2012, 31, 271–283. [Google Scholar] [CrossRef]
  59. Ojeda, L.V.; Zaferiou, A.M.; Cain, S.M.; Vitali, R.V.; Davidson, S.P.; Stirling, L.A.; Perkins, N.C. Estimating stair running performance using inertial sensors. Sensors 2017, 17, 2647. [Google Scholar] [CrossRef]
  60. Moufawad El Achkar, C.; Lenoble-Hoskovec, C.; Paraschiv-Ionescu, A.; Major, K.; Büla, C.; Aminian, K. Physical behavior in older persons during daily life: Insights from instrumented shoes. Sensors 2016, 16, 1225. [Google Scholar] [CrossRef]
  61. Lin, C.; Chang, P.; Luh, J. Formulation and optimization of cubic polynomial joint trajectories for industrial robots. IEEE Trans. Autom. Control 1983, 28, 1066–1074. [Google Scholar] [CrossRef]
  62. Giorgino, T. Computing and visualizing dynamic time warping alignments in R: The dtw package. J. Stat. Softw. 2009, 31, 1–24. [Google Scholar] [CrossRef]
  63. Koo, T.K.; Li, M.Y. A guideline of selecting and reporting intraclass correlation coefficients for reliability research. J. Chiropr. Med. 2016, 15, 155–163. [Google Scholar] [CrossRef]
  64. Tirosh, O.; Begg, R.; Passmore, E.; Knopp-Steinberg, N. Wearable textile sensor sock for gait analysis. In Proceedings of the 2013 Seventh International Conference on Sensing Technology (ICST), Wellington, New Zealand, 3–5 December 2013; IEEE: New York, NY, USA, 2013; pp. 618–622. [Google Scholar]
  65. Guo, Y.; Sun, Y.; Luo, H.; Guizani, N. Accurate indoor localization based on crowd sensing. Wirel. Commun. Mob. Comput. 2016, 16, 2852–2868. [Google Scholar] [CrossRef]
  66. Dalton, A.; Khalil, H.; Busse, M.; Rosser, A.; van Deursen, R.; ÓLaighin, G. Analysis of gait and balance through a single triaxial accelerometer in presymptomatic and symptomatic Huntington’s disease. Gait Posture 2013, 37, 49–54. [Google Scholar] [CrossRef] [PubMed]
  67. Godfrey, A.; Del Din, S.; Barry, G.; Mathers, J.C.; Rochester, L. Within trial validation and reliability of a single tri-axial accelerometer for gait assessment. In Proceedings of the 2014 36th Annual International Conference of the IEEE Engineering in Medicine and Biology Society, Chicago, IL, USA, 26–30 August 2014; IEEE: New York, NY, USA, 2014; pp. 5892–5895. [Google Scholar]
  68. Del Din, S.; Godfrey, A.; Rochester, L. Validation of an accelerometer to quantify a comprehensive battery of gait characteristics in healthy older adults and Parkinson’s disease: Toward clinical and at home use. IEEE J. Biomed. Health Inform. 2015, 20, 838–847. [Google Scholar] [CrossRef] [PubMed]
  69. Truong, P.H.; Lee, J.; Kwon, A.-R.; Jeong, G.-M. Stride counting in human walking and walking distance estimation using insole sensors. Sensors 2016, 16, 823. [Google Scholar] [CrossRef]
  70. Aminian, K.; Najafi, B.; Büla, C.; Leyvraz, P.-F.; Robert, P. Spatio-temporal parameters of gait measured by an ambulatory system using miniature gyroscopes. J. Biomech. 2002, 35, 689–699. [Google Scholar] [CrossRef]
  71. González, R.; Alvarez, D.; López, A.; Alvarez, J. Ambulatory estimation of mean step length during unconstrained walking by means of COG accelerometry. Comput. Methods Biomech. Biomed. Eng. 2009, 12, 721–726. [Google Scholar] [CrossRef]
  72. Lueken, M.; Loeser, J.; Weber, N.; Bollheimer, C.; Leonhardt, S.; Ngo, C. Model-based step length estimation using a pendant-integrated mobility sensor. IEEE Trans. Neural Syst. Rehabil. Eng. 2021, 29, 2655–2665. [Google Scholar] [CrossRef]
  73. Zijlstra, W.; Hof, A.L. Displacement of the pelvis during human walking: Experimental data and model predictions. Gait Posture 1997, 6, 249–262. [Google Scholar] [CrossRef]
  74. Fulk, G.D.; Edgar, S.R.; Bierwirth, R.; Hart, P.; Lopez-Meyer, P.; Sazonov, E. Identifying activity levels and steps of people with stroke using a novel shoe-based sensor. J. Neurol. Phys. Ther. 2012, 36, 100–107. [Google Scholar] [CrossRef]
  75. Lin, F.; Wang, A.; Song, C.; Xu, W.; Li, Z.; Li, Q. A comparative study of smart insole on real-world step count. In Proceedings of the 2015 IEEE Signal Processing in Medicine and Biology Symposium (SPMB), Philadelphia, PA, USA, 12 December 2015; IEEE: New York, NY, USA, 2015; pp. 1–6. [Google Scholar]
  76. Piau, A.; Charlon, Y.; Campo, E.; Vellas, B.; Nourhashemi, F. A smart insole to promote healthy aging for frail elderly individuals: Specifications, design, and preliminary results. JMIR Rehabil. Assist. Technol. 2015, 2, e4084. [Google Scholar] [CrossRef]
  77. Rodriguez, A.; Balsamo, D.; Luo, Z.; Beeby, S.P.; Merrett, G.V.; Weddell, A.S. Intermittently-powered energy harvesting step counter for fitness tracking. In Proceedings of the 2017 IEEE Sensors Applications Symposium (SAS), Glassboro, NJ, USA, 13–15 March 2017; IEEE: New York, NY, USA, 2017; pp. 1–6. [Google Scholar]
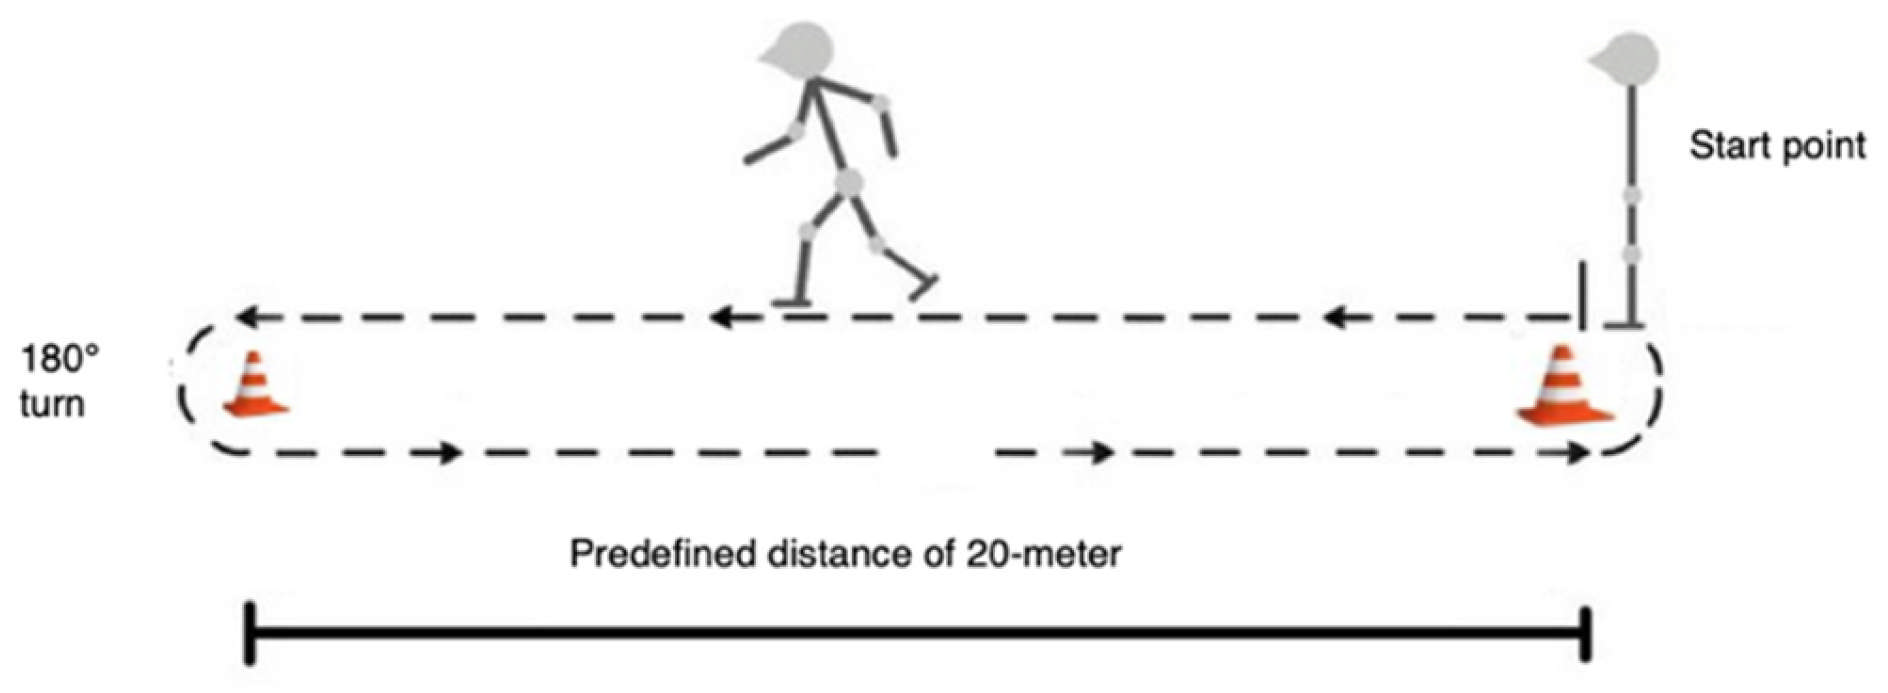
Figure 1. Pathway of walking performed by all participants.
Sensors 25 06217 g001
Figure 2. Sites of sensors under the smart insoles.
Sensors 25 06217 g002
Figure 3. A pair of Gait Up monitors worn by a participant.
Sensors 25 06217 g003
Figure 4. Identification of the heel-strike (in black) and toe-off (in red) events on acceleration and pressure (under heel and great toe) signals.
Sensors 25 06217 g004
Figure 5. Signal identification of Figure 4 shows the toe-off and heel-strike events on a gait cycle.
Sensors 25 06217 g005
Figure 6. Identification of toe-off and heel-stride events on a gait cycle measured from Natural Point motion capture.
Sensors 25 06217 g006
Figure 7. Stride lengths for gait up, smart insole, and actual stride length.
Sensors 25 06217 g007
Figure 8. Total distance for Gait Up, smart insole, and actual total distance.
Sensors 25 06217 g008
Figure 9. Representation of error source appeared in the position trajectory between polynomial signal and motion capture signal.
Sensors 25 06217 g009
Table 1. Stride lengths of all participants estimated using Gait Up, smart insole, and actual stride length.
ParticipantsActual OutcomesGait UpSmart Insole
Number of StridesStride Length (m)Number of Stride RightNumber of Stride LeftStride Length Right (m)Stride Length Left (m)Number of Stride RightNumber of Stride LeftApproach 1-Stride Length Right (m)Approach 1-Stride Length Left (m)Approach 2-Stride Length Right (m)Approach 2-Stride Length Left (m)
P13681.663683681.6981.6853673681.6811.6821.6681.673
P23621.6903603611.7481.7653613631.6901.7291.7231.772
P33651.4903633651.5351.5043643661.5221.5061.5031.503
P43801.5133783771.5641.5493803871.5341.5221.5251.538
P53411.7833403401.8191.7653423421.7891.7331.8081.775
P64121.8044104091.7401.7644114131.7471.8011.7811.800
P74111.5224114101.5171.5694094131.5121.5251.5101.529
P84081.3274024021.3791.3934084071.3151.3601.3201.345
Median3741.591373372.51.6311.627373.5377.51.6081.6041.5971.606
Interquartile490.29350480.2310.26148500.2350.2270.2780.272
Table 2. Stride length accuracies of smart insoles and Gait Up monitors compared to actual stride length.
Stride Length Accuracies
Gait UpSmart Insoles
ParticipantsRightLeftApproach 1-RightApproach 1-LeftApproach 2-RightApproach 2-Left
P197.77%98.56%98.92%99.64%98.68%99.04%
P296.57%95.56%97.40%97.10%96.86%96.63%
P396.98%99.06%97.58%99.33%97.38%99.13%
P496.63%97.62%99.41%98.48%99.21%98.28%
P597.98%98.99%98.88%98.99%98.54%98.49%
P696.45%97.78%98.23%99.28%97.84%99.06%
P799.67%96.91%97.77%98.42%97.63%98.23%
P896.08%95.03%99.02%99.40%99.25%99.25%
Median96.80%97.70%98.92%98.80%99.17%99.17%
Interquartile1.32%3.43%1.44%2.30%2.35%2.50%
Table 3. Intraclass correlation coefficients and Mann–Whitney U test for stride length.
SidesFor Stride Length
Intraclass Correlation Coefficient (CI)Mann–Whitney U Test
Smart InsoleGait UpSmart Insole
Approach 1Approach 2Approach 1 and Approach 2
RightICC = 0.993 (0.846–0.999ICC = 0.991 (0.726–0.999)ICC = 0.977 (0.876–0.996)U = 31.0 (p = 0.959)
LeftICC = 0.995 (0.854–0.999)ICC = 0.993 (0.674–0.999)ICC = 0.987 (0.878–0.996)U = 30.0 (p = 0.878)
CI: confidence interval; p: p-value.
Table 4. Total distance covered in meters of all participants using Gait Up, smart insole, and actual total distance.
Partici-
pants (P)
Actual
Distance (m)
Gait UpSmart Insole
RightLeftApproach 1-RightApproach 1-LeftApproach 2-RightApproach 2-Left
P1610.88624.86620.08616.93618.98612.16615.66
P2611.78629.28637.17610.09627.63622.00643.24
P3543.85557.21548.96554.01551.20547.09550.10
P4574.94591.19583.97582.92575.32579.5581.36
P5608.00618.46600.1611.84592.69618.34607.05
P6743.25713.4721.48718.02743.81731.99743.4
P7625.54623.49643.29618.41629.83617.59631.48
P8541.42554.36559.99536.52553.52538.56547.42
Median609.44620.97610.09610.96605.83614.87611.36
Interquartile81.6966.2894.3364.478.6370.5081.38
Table 5. Total distance accuracies of the smart insole and Gait Up monitors compared to actual.
Total Distance Accuracies
Gait UpSmart Insoles
ParticipantsRightLeftApproach 1-RightApproach
1-Left
Approach
2-Right
Approach
2-Left
P197.71%98.49%99.01%98.67%99.79%99.22%
P297.14%95.85%99.72%97.41%98.33%94.86%
P397.54%99.06%98.13%98.65%99.40%98.85%
P497.17%98.43%98.61%99.93%99.21%98.88%
P598.28%98.70%99.37%97.48%98.30%99.84%
P695.98%97.07%96.61%99.92%98.49%99.98%
P799.67%97.16%98.86%99.32%98.73%99.05%
P897.61%96.57%99.10%97.76%99.47%98.89%
Median97.58%97.80%98.93%98.66%98.97%99.97%
Interquartile1.14%2,13%1.24%2.44%0.18%0.14%
Table 6. Intraclass correlation coefficients and Mann–Whitney U test for total distance covered.
SidesTotal Distance Covered
Intraclass Correlation Coefficient (CI)Mann–Whitney U Test
Smart InsoleGait UpSmart InsoleGait Up
Approach 1Approach 2Approach 1Approach 2
RightICC = 0.992 (0.959–0.998)ICC = 0.996 (0.982–0.999)ICC = 0.980 (0.908–0.996U = 31.0; p = 0.959U = 28.0; p = 0.721U = 25.0; p = 0.505
LeftICC = 0.994 (0.972–0.999)ICC = 0.991 (0.941–0.998)ICC = 0.982 (0.917–0.996)U = 26.0; p = 0.574U = 26.5; p = 0.599U = 27.0; p = 0.645
CI: confidence interval; p: p-value.
Table 7. Comparison of gait model-based approaches accuracies.
AuthorApproachesResults
Bennett et al. [18]Modeling human leg as a two-link revolute robot, then using extended Kalman filter (EKF) to estimate the displacement in a straight line Accuracy of 97% on linear displacement
Meng et al. [19]Self-contained pedestrian tracking approach using a foot-mounted inertial and magnetic sensor module with traditional zero velocity updates and stride information to further correct the acceleration double integration driftsFor short distance: position error of 0.44 ± 0.20 m on straight line of 10 m and 15 m, 0.45 ± 0.08 m on 180° turn, and 0.40 ± 0.07 m on circle of radius 3 m
For long distance of 3 min indoor walking, position error of 4.33 ± 1.77 m and 3.88 ± 0.35 m for 6 min outdoor walking
Miyazaki et al. [27]Simplified two-segment leg model and implemented a stride length estimation algorithm based on a single gyroscope Relative estimation error of 15%
Kim et al. [29]Analyzing
the relationship between stride, step period, and
acceleration.
Calculated accuracies of 96.59% (error: 3.40%) for 1st test and 95.83 (error: 4.17%) for 2nd test
Xia et al. [31]A non-linear step length estimation model based on statistics proposed by [30] where
Step = k·4√αz − max − αz–min
Not reported
Aminian et al. [70]Stride length estimation using sensor units at thigh and shank in combination with a double-inverted pendulum model Root mean square error (RMSE) of 7.2% (0.07 m)
Zijlstra et al. [73]Inverted pendulum to model the center of mass (CoM) trajectory86% to 94% of accuracy for stride length
Zijlstra et al. [34]Empirical approximation of the geometric model to estimate the stride length due to changes of vertical displacement of the CoMUnderestimation of stride length for all participants
Gonzalez et al. [71]Model by extracting additional features from the acceleration signal to further improve the step length estimationStride length error of 16%
Lueken et al. [72]Model of the inverted pendulum and idea of double integration of the antero–posterior acceleration Stride length error from 8.52% to 12.87%
Lueken et al. [72]Kalman filter and idea of double integration of the antero–posterior accelerationStride length error from 7.95% to 15.00%
Zrenner et al. [10]Parametric regression model based on accelerationStride length error 7.9%
Ziagskas et al. [13]Artificial intelligence algorithmsICC = 0.939 for left side and ICC = 0.939 for right side
Our Approach 1Model based on director coefficients of acceleration dataFor stride length, right: 98.92% (error:
1.08%) and left: 98.80% (error: 1.20%)
For total distance, right: 98.9 (3.10)% (error: 1.08%) and left: 98.69 (2.50%) (error: 1.31%)
Our Approach 2Model based on the dynamic time warpingFor stride length, right: 99.17% (error: 0.83%) and left: 98.17% (error: 0.83%)
For total distance, right: 98.95 (0.10)% (error: 1.05%) and left: 99.03 (5.10)% (error: 0.97%)
Disclaimer/Publisher’s Note: The statements, opinions and data contained in all publications are solely those of the individual author(s) and contributor(s) and not of MDPI and/or the editor(s). MDPI and/or the editor(s) disclaim responsibility for any injury to people or property resulting from any ideas, methods, instructions or products referred to in the content.