Author Contributions
Conceptualization, M.H.S., M.A., K.F.A.H. and A.E.F.; methodology, M.H.S., M.A., K.F.A.H. and A.E.F.; software, M.H.S., K.F.A.H. and A.E.F.; validation, M.H.S., M.A., K.F.A.H. and A.E.F.; formal analysis, M.H.S., M.A., K.F.A.H. and A.E.F.; investigation, M.H.S., M.A., K.F.A.H. and A.E.F.; resources, M.H.S., K.F.A.H. and A.E.F.; data curation, M.H.S., K.F.A.H. and A.E.F.; writing—original draft preparation, M.H.S. and K.F.A.H.; writing—review and editing, M.H.S., M.A., K.F.A.H., A.E.F. and Á.F.V.; visualization, M.H.S., M.A., K.F.A.H. and A.E.F.; supervision, M.A. and K.F.A.H.; project administration, M.H.S., M.A., K.F.A.H., A.E.F. and Á.F.V.; funding acquisition, Á.F.V. All authors have read and agreed to the published version of the manuscript.
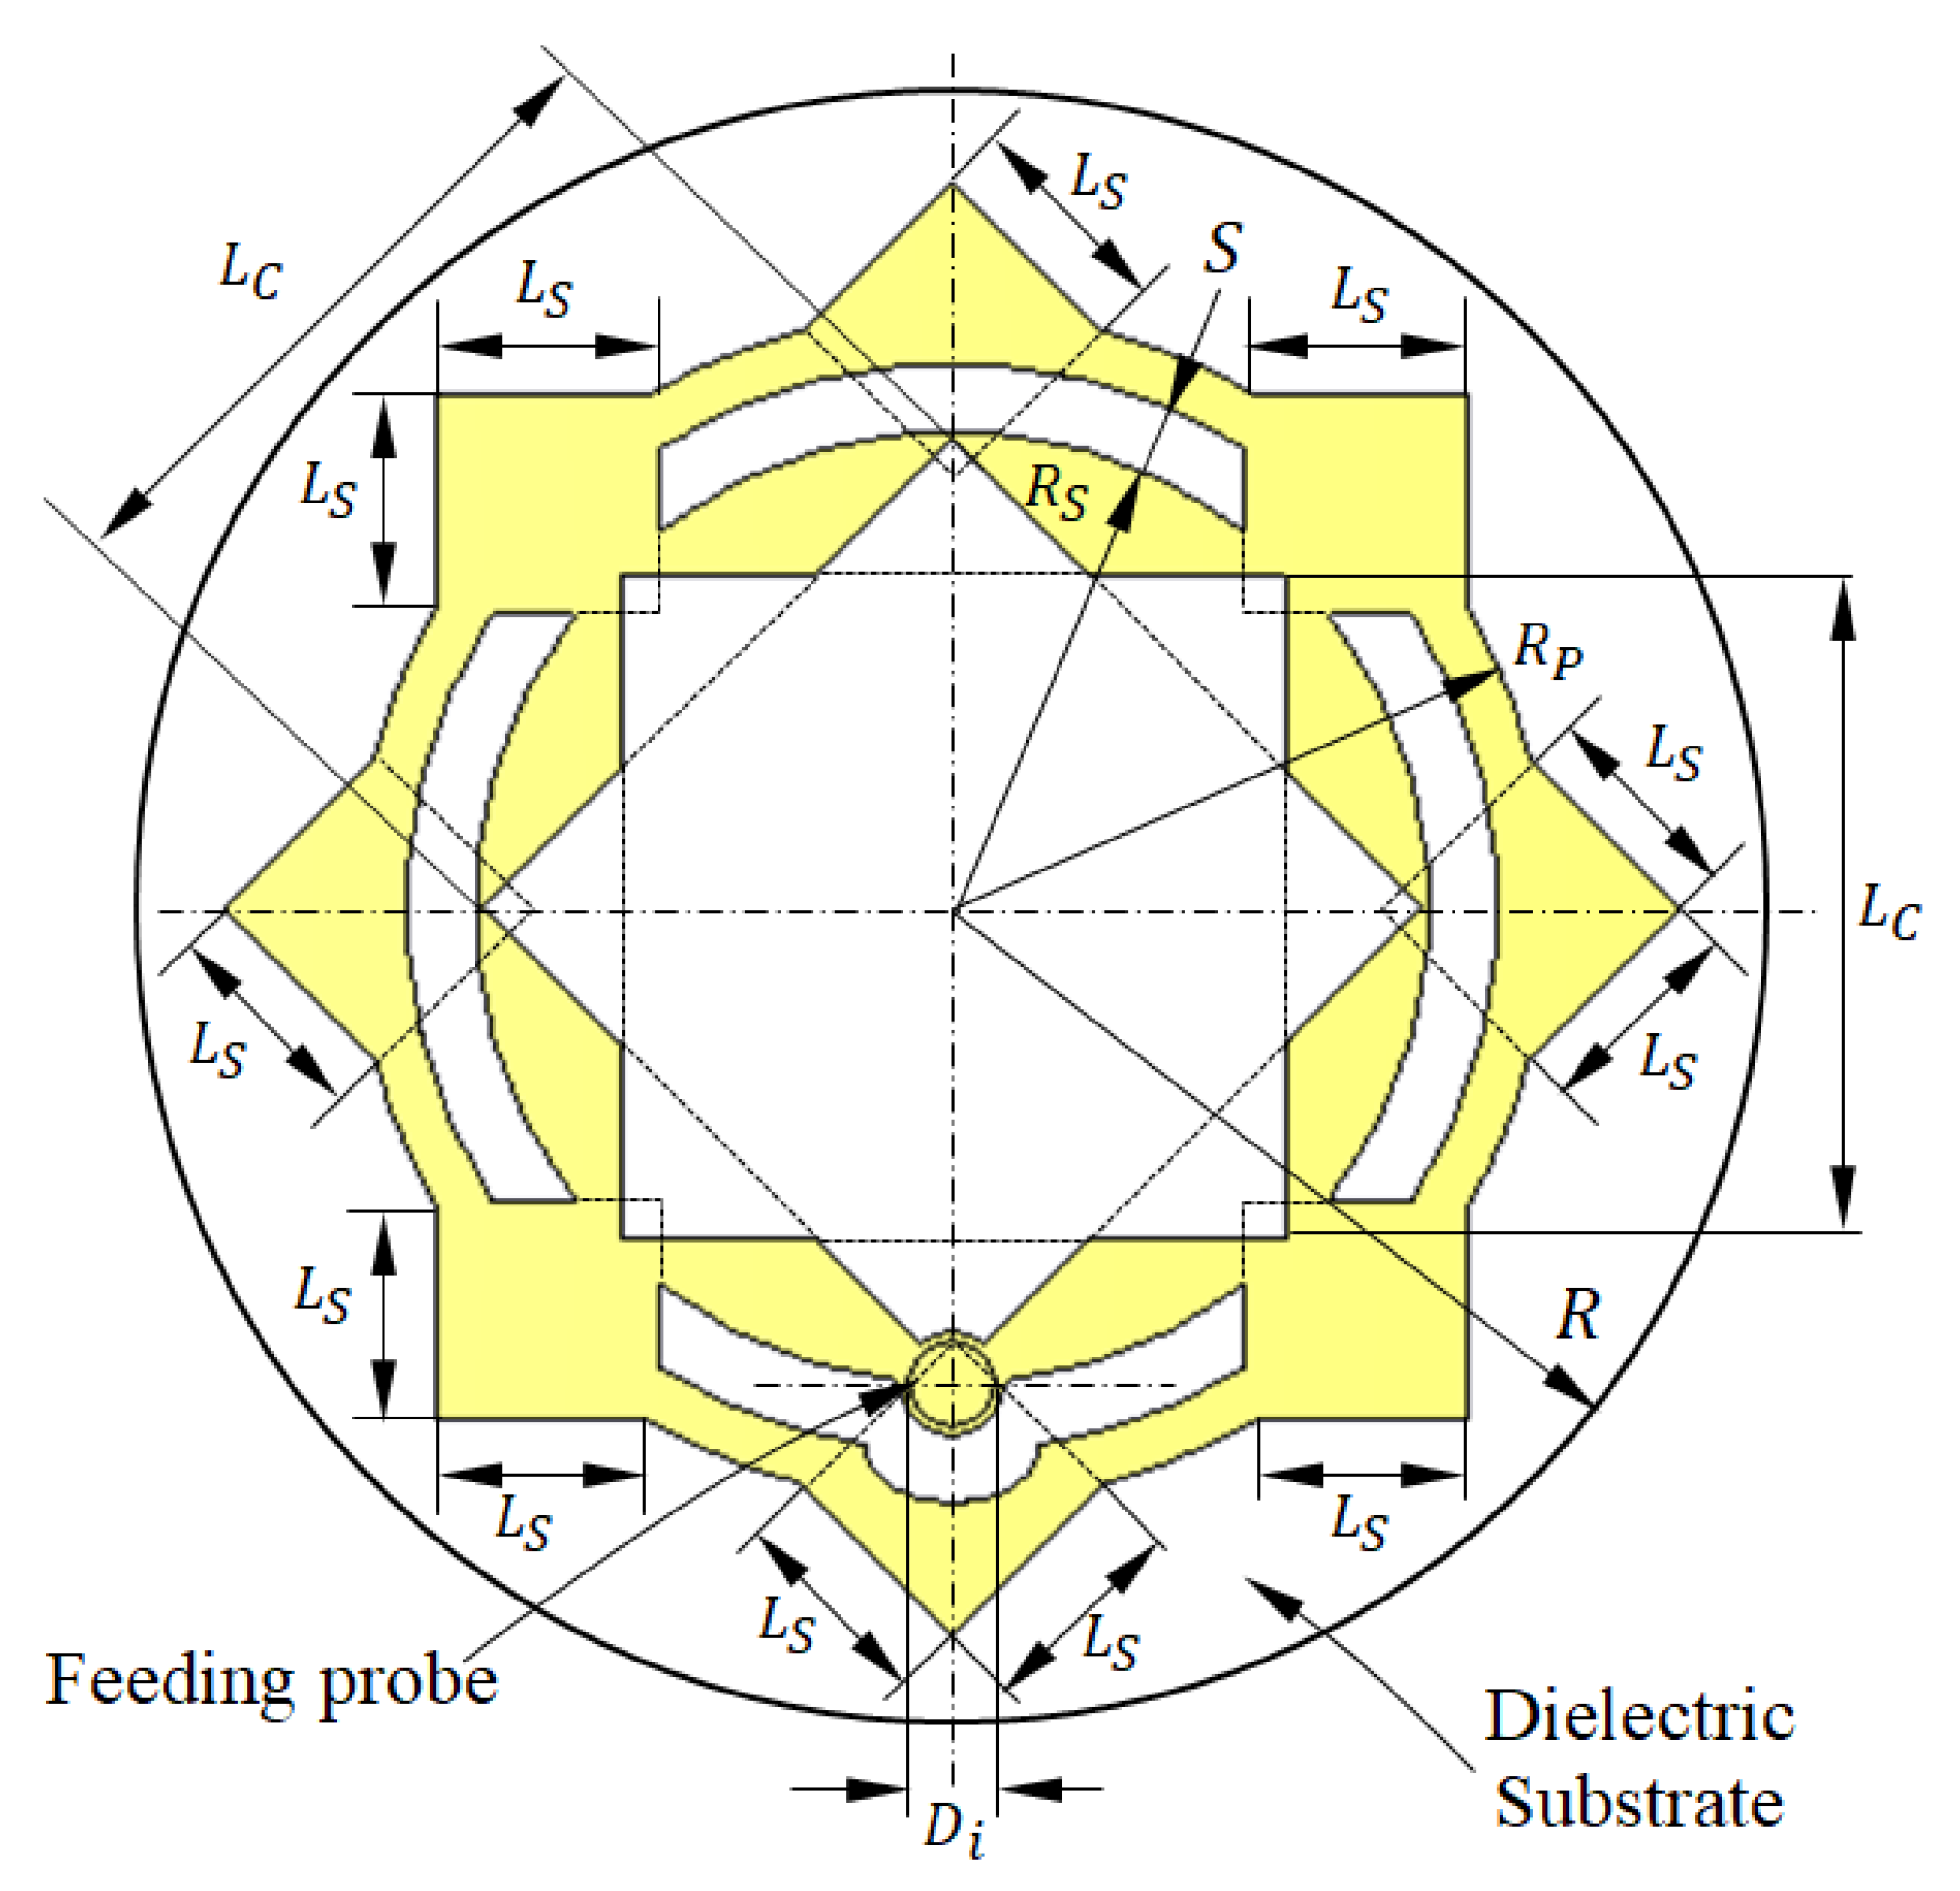
Figure 1.
Design and dimensional parameters of the radiating patch of the antenna proposed for breast cancer detection.
Figure 1.
Design and dimensional parameters of the radiating patch of the antenna proposed for breast cancer detection.
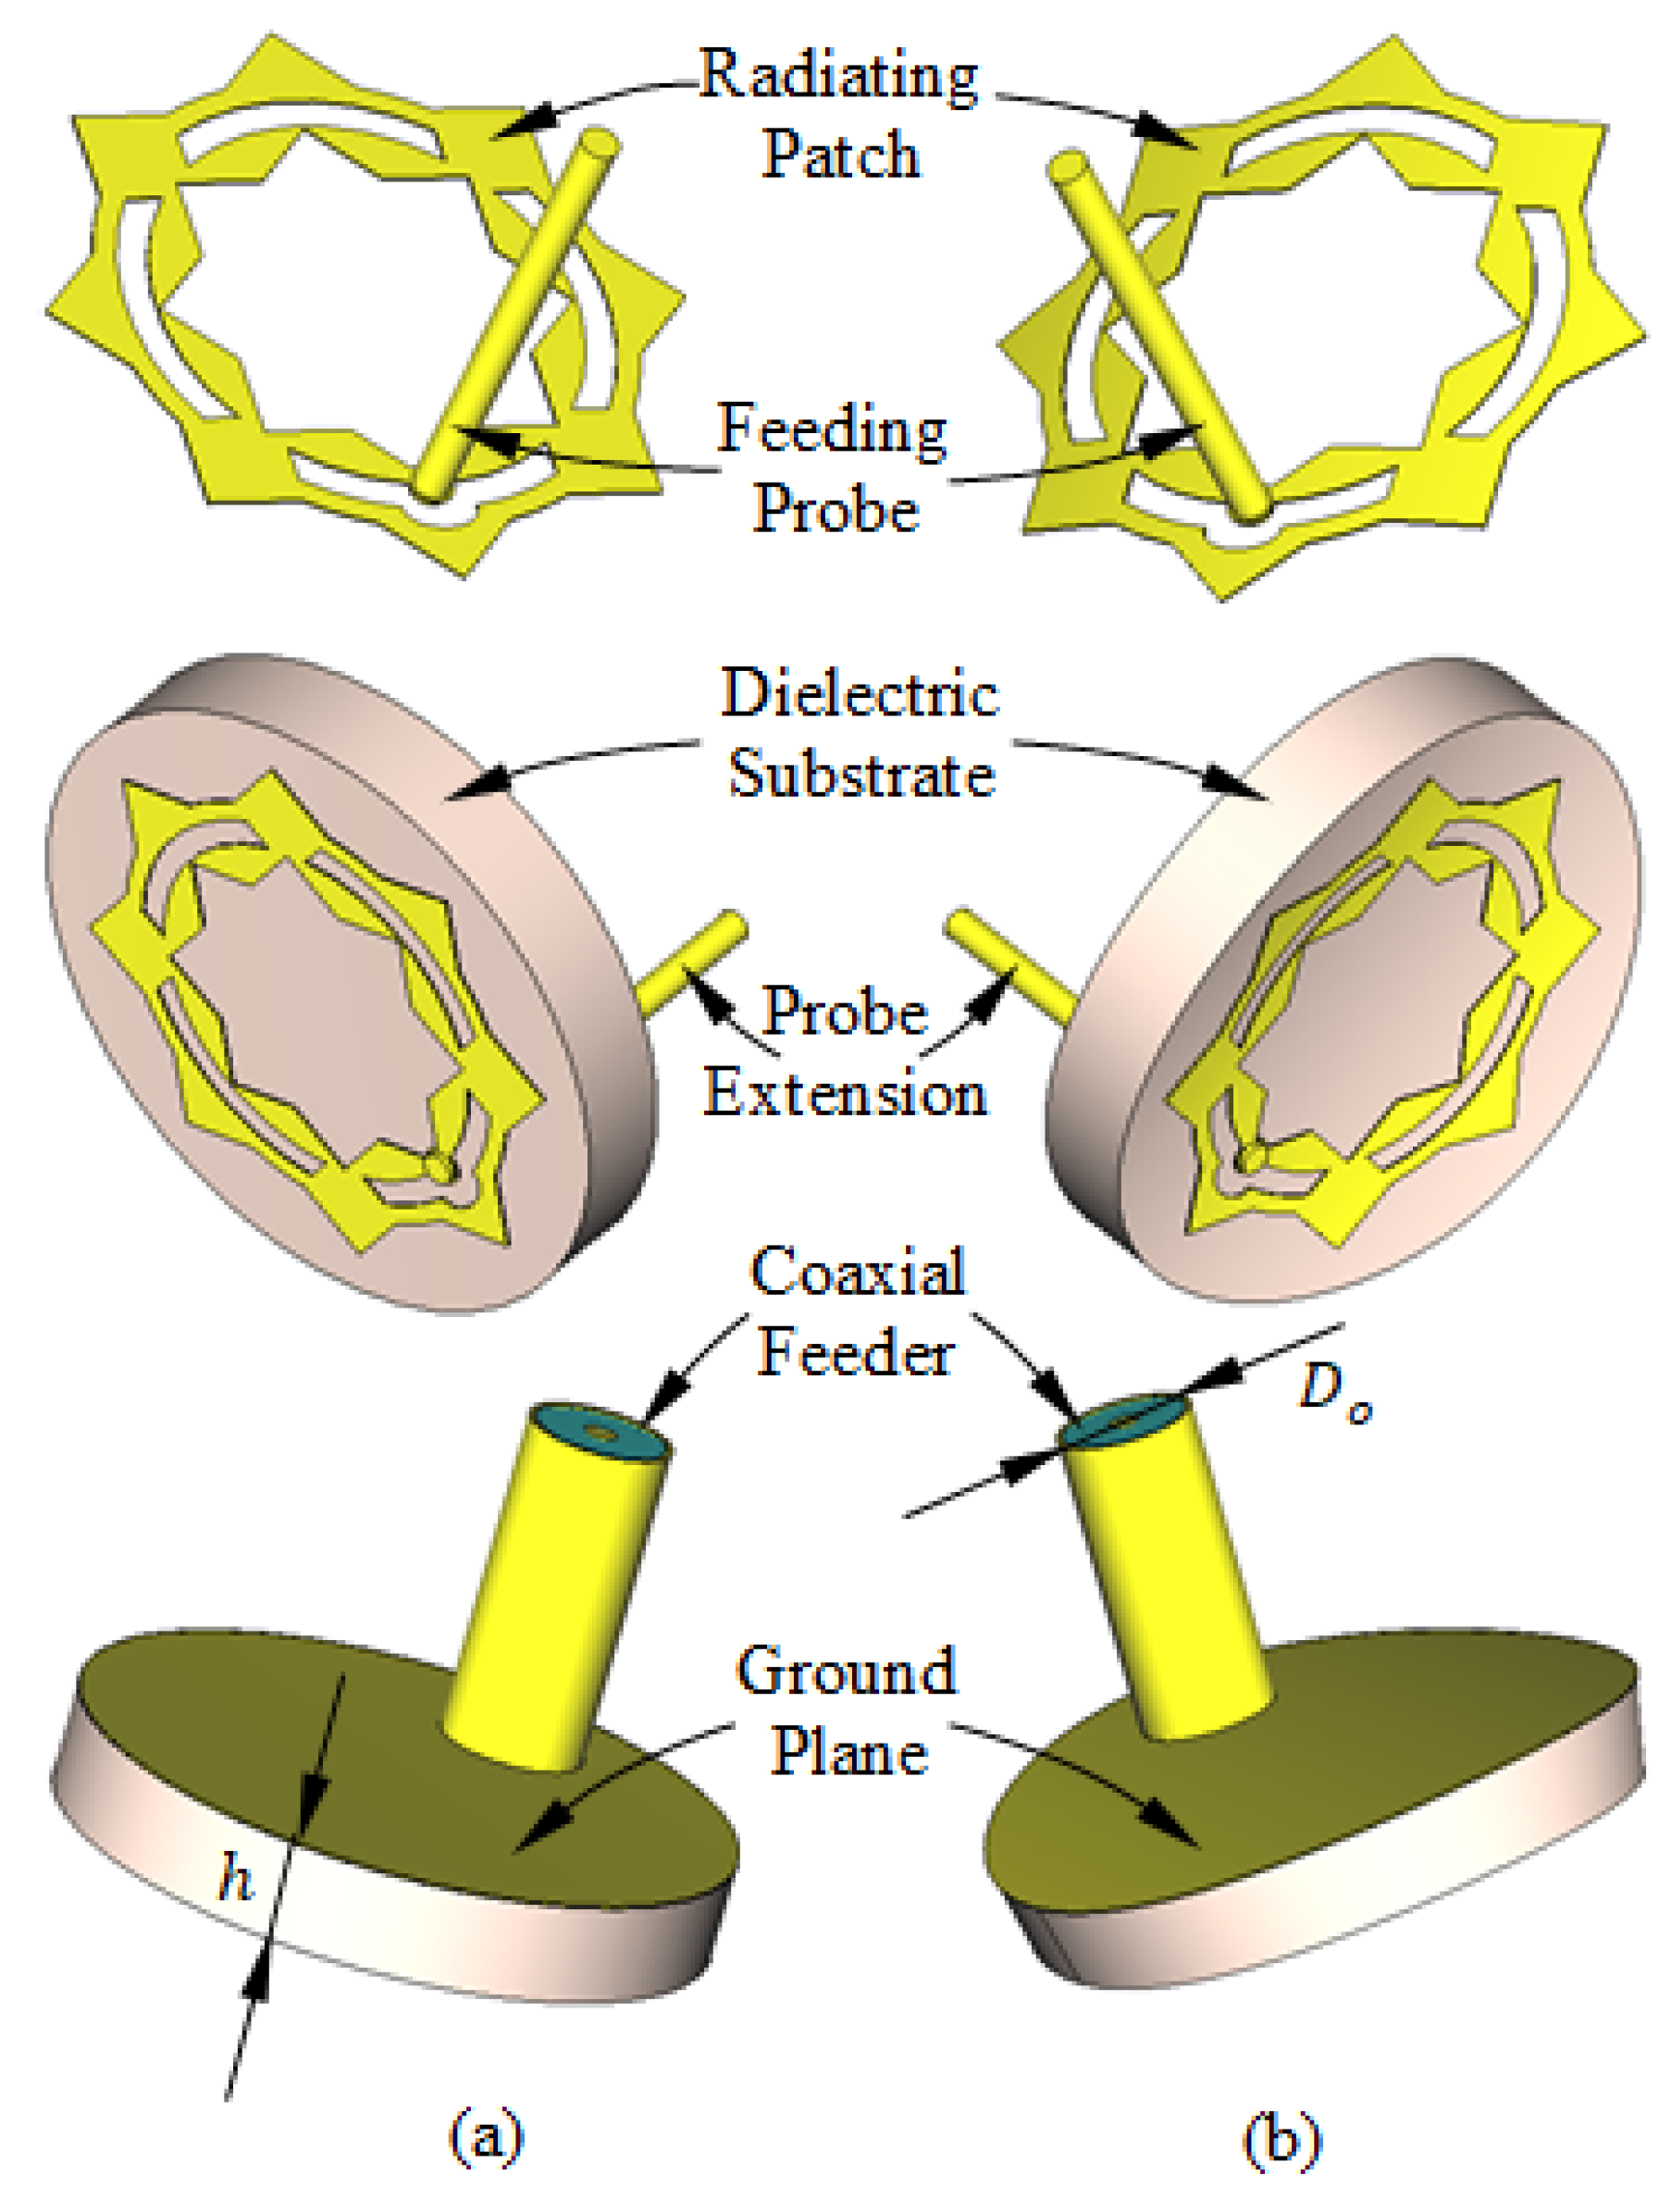
Figure 2.
Structure of the antenna proposed for breast cancer detection. (a) Flat antenna. (b) Curved antenna.
Figure 2.
Structure of the antenna proposed for breast cancer detection. (a) Flat antenna. (b) Curved antenna.
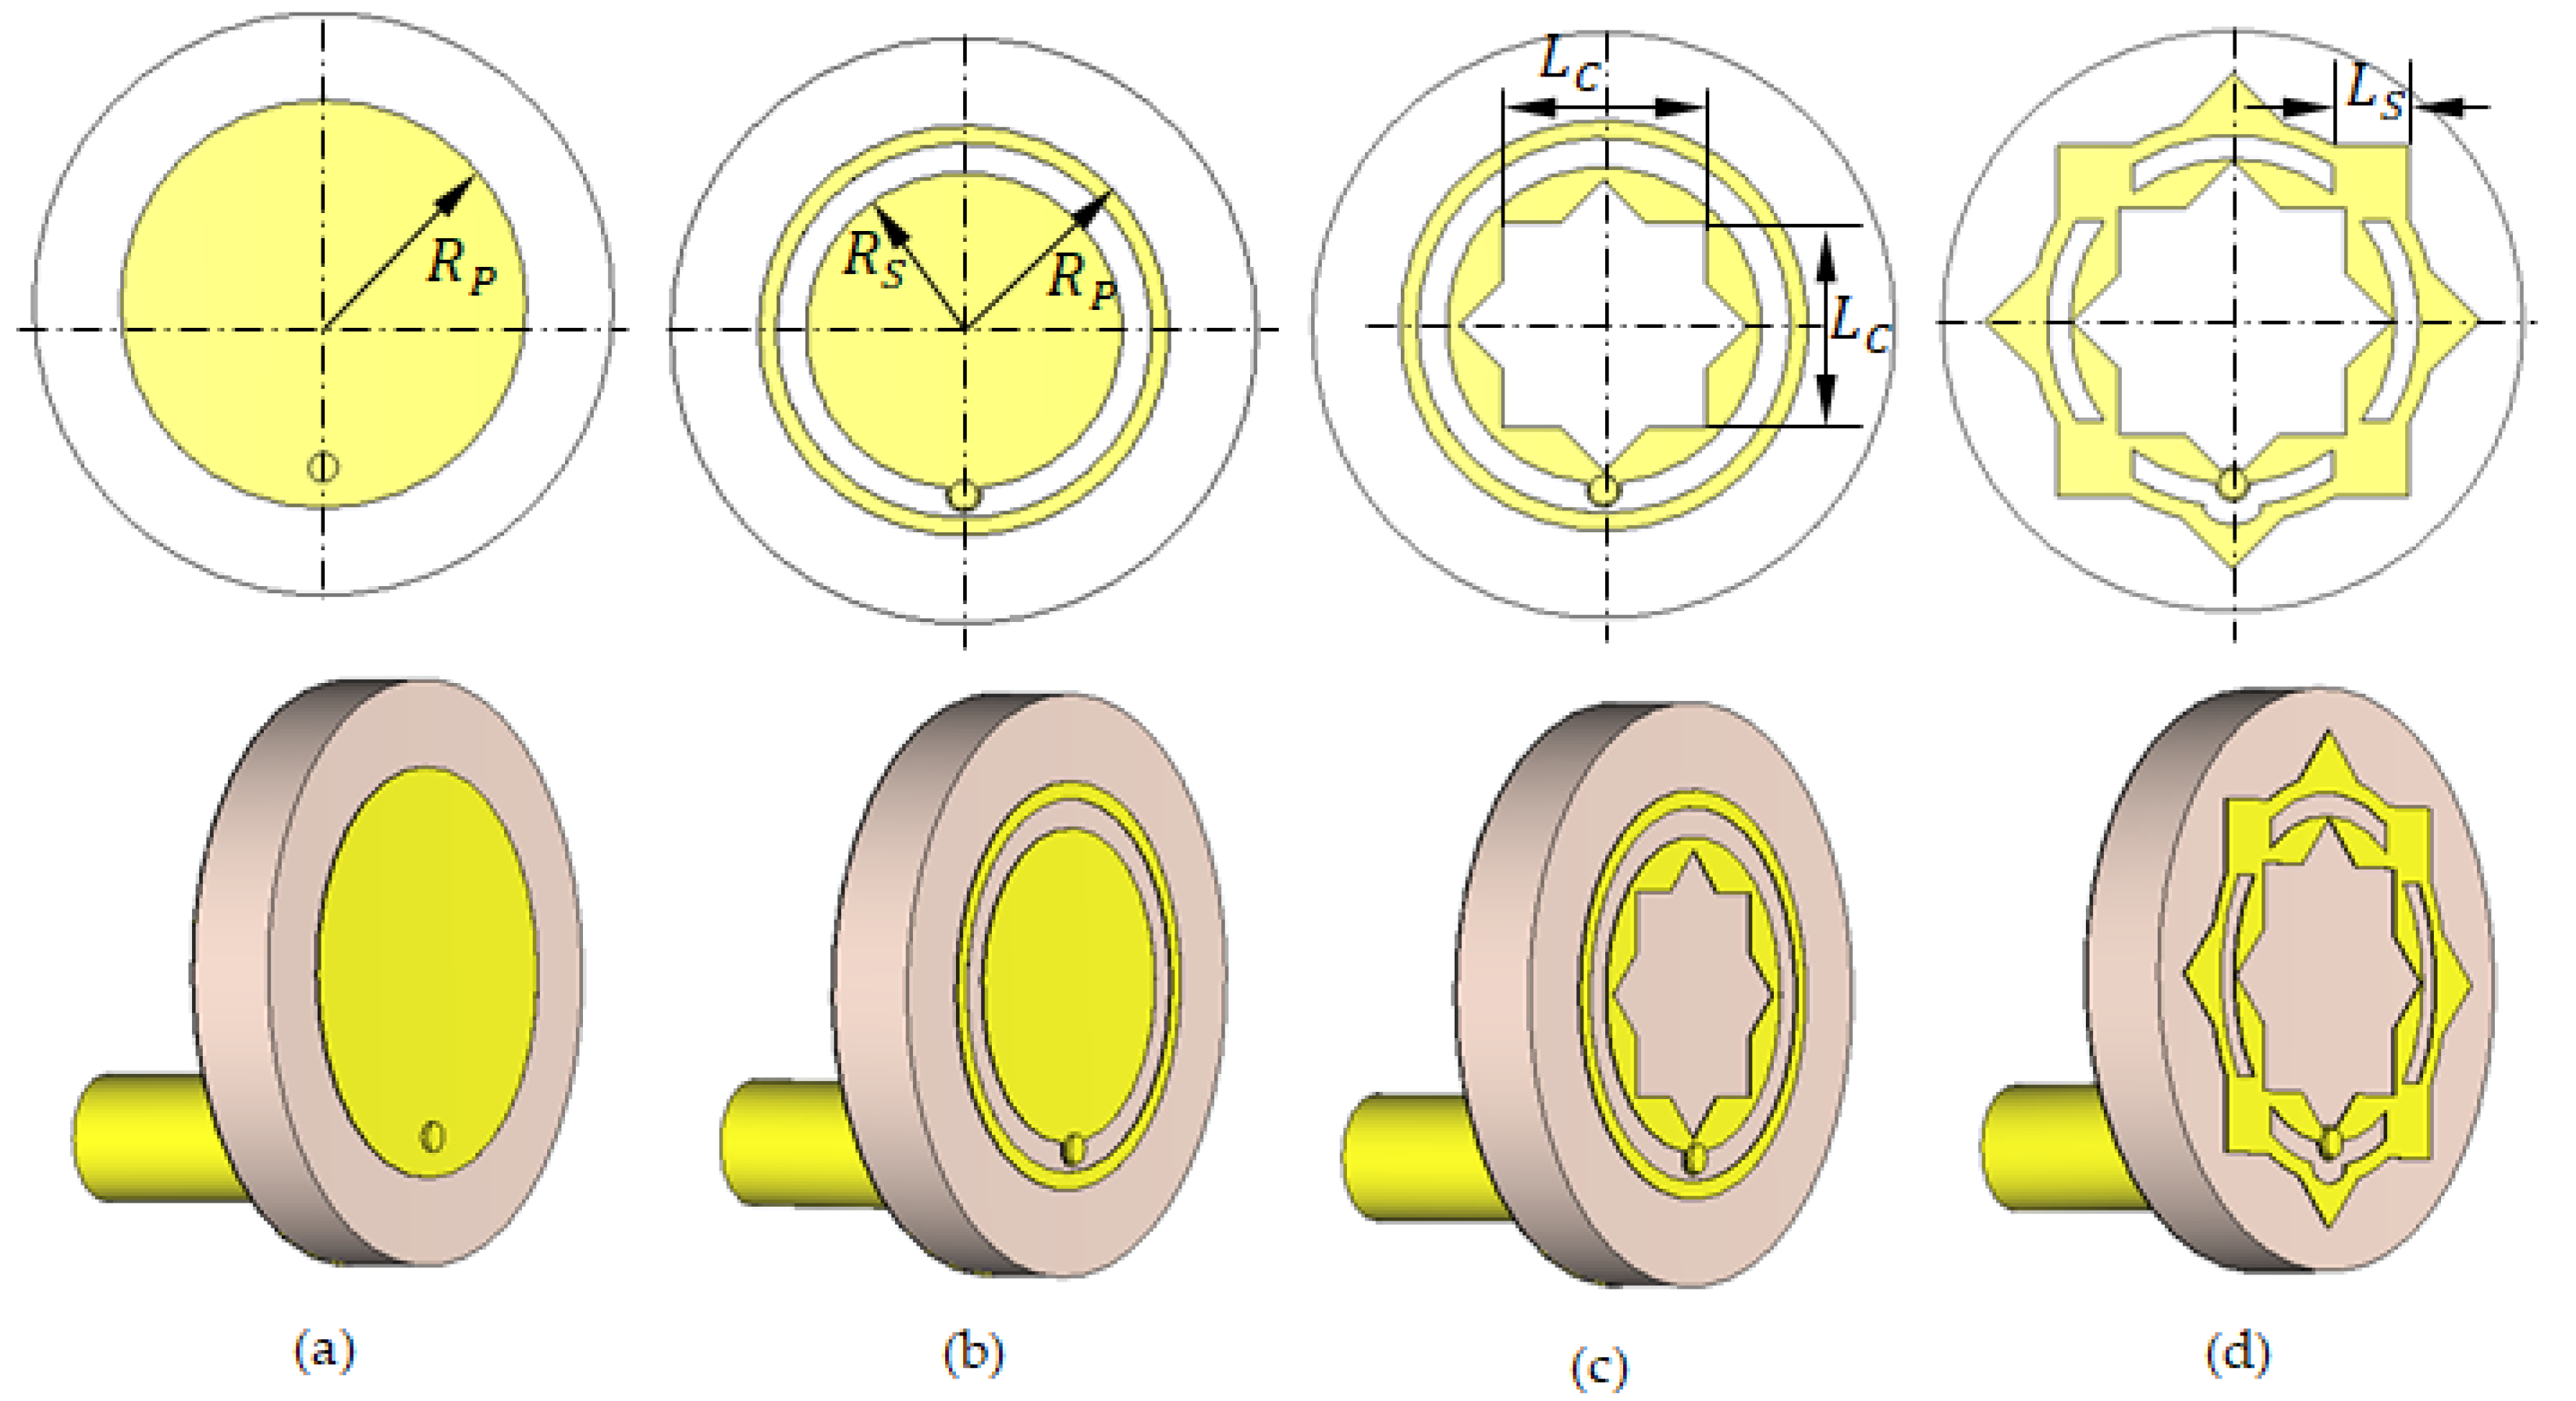
Figure 3.
Geometries of the progressive design stages of the proposed antenna: (a) Stage 1. (b) Stage 2. (c) Stage 3. (d) Stage 4 (Final).
Figure 3.
Geometries of the progressive design stages of the proposed antenna: (a) Stage 1. (b) Stage 2. (c) Stage 3. (d) Stage 4 (Final).
Figure 4.
Continuous improvement of the frequency response of the reflection coefficient with the progressive design stages of the proposed antenna (see
Figure 3).
Figure 4.
Continuous improvement of the frequency response of the reflection coefficient with the progressive design stages of the proposed antenna (see
Figure 3).
Figure 8.
Sketched drawing of the flat model of a portion of the human breast employed for simulation of the proposed antenna.
Figure 8.
Sketched drawing of the flat model of a portion of the human breast employed for simulation of the proposed antenna.
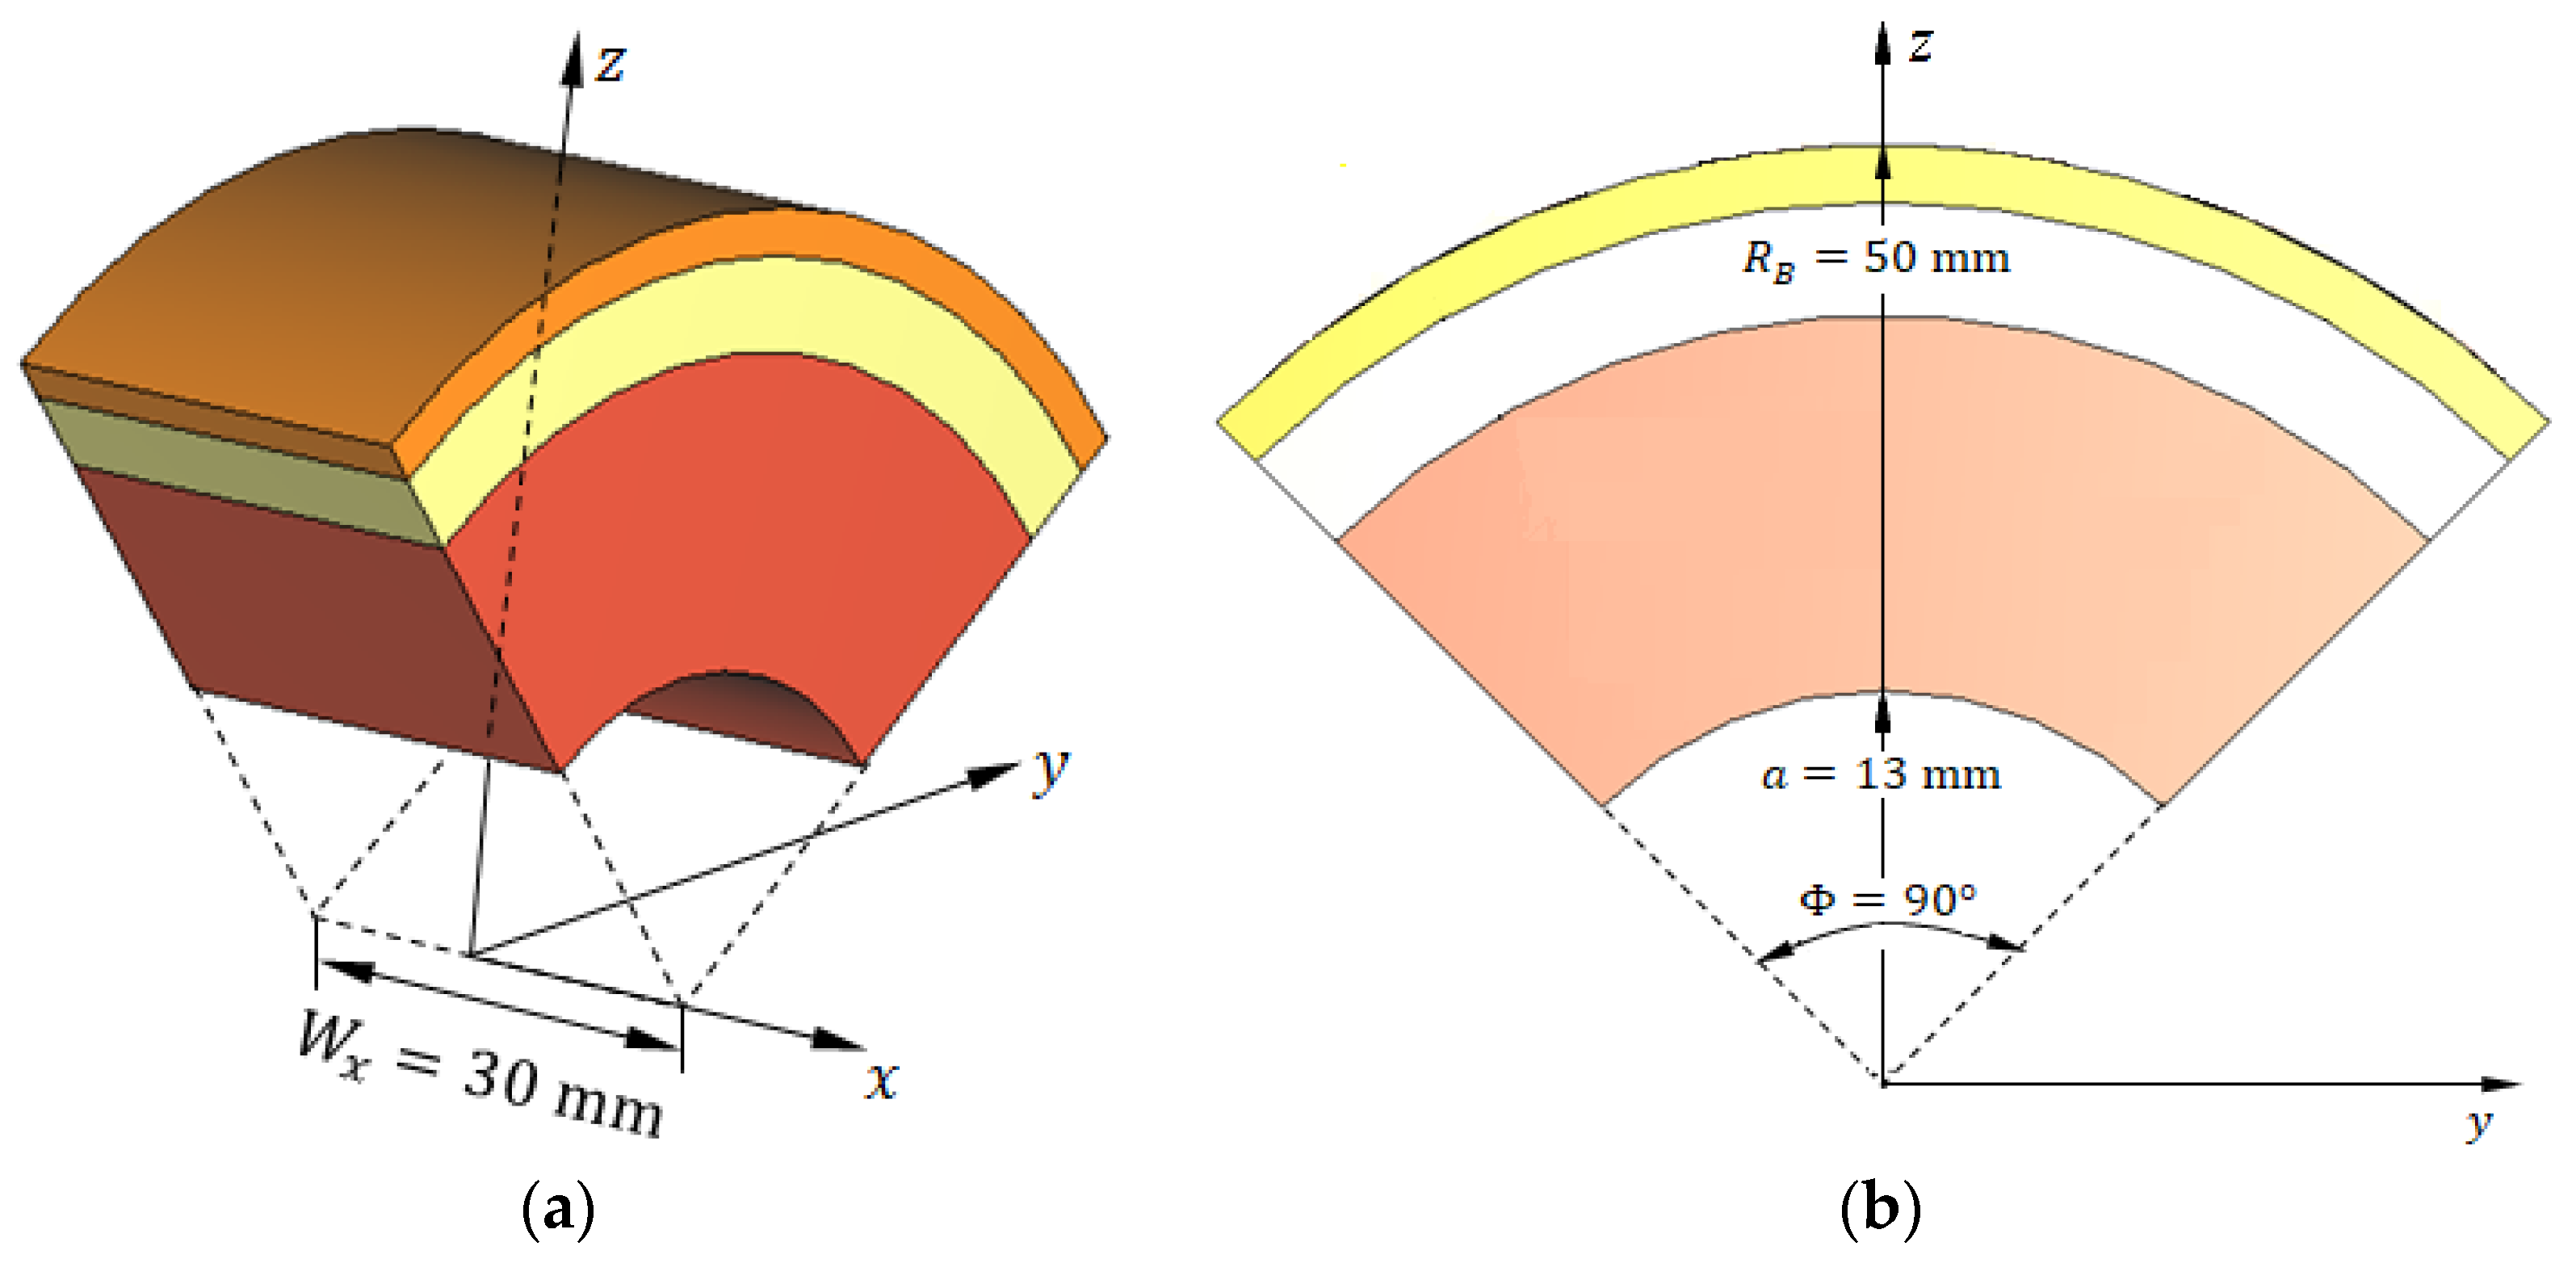
Figure 9.
Sketched drawing of the curved model for a sector of the human breast employed for simulation of the proposed antenna.
Figure 9.
Sketched drawing of the curved model for a sector of the human breast employed for simulation of the proposed antenna.
Figure 10.
Variation in the dielectric constant of the different tissue types over the frequency band 8–14 GHz.
Figure 10.
Variation in the dielectric constant of the different tissue types over the frequency band 8–14 GHz.
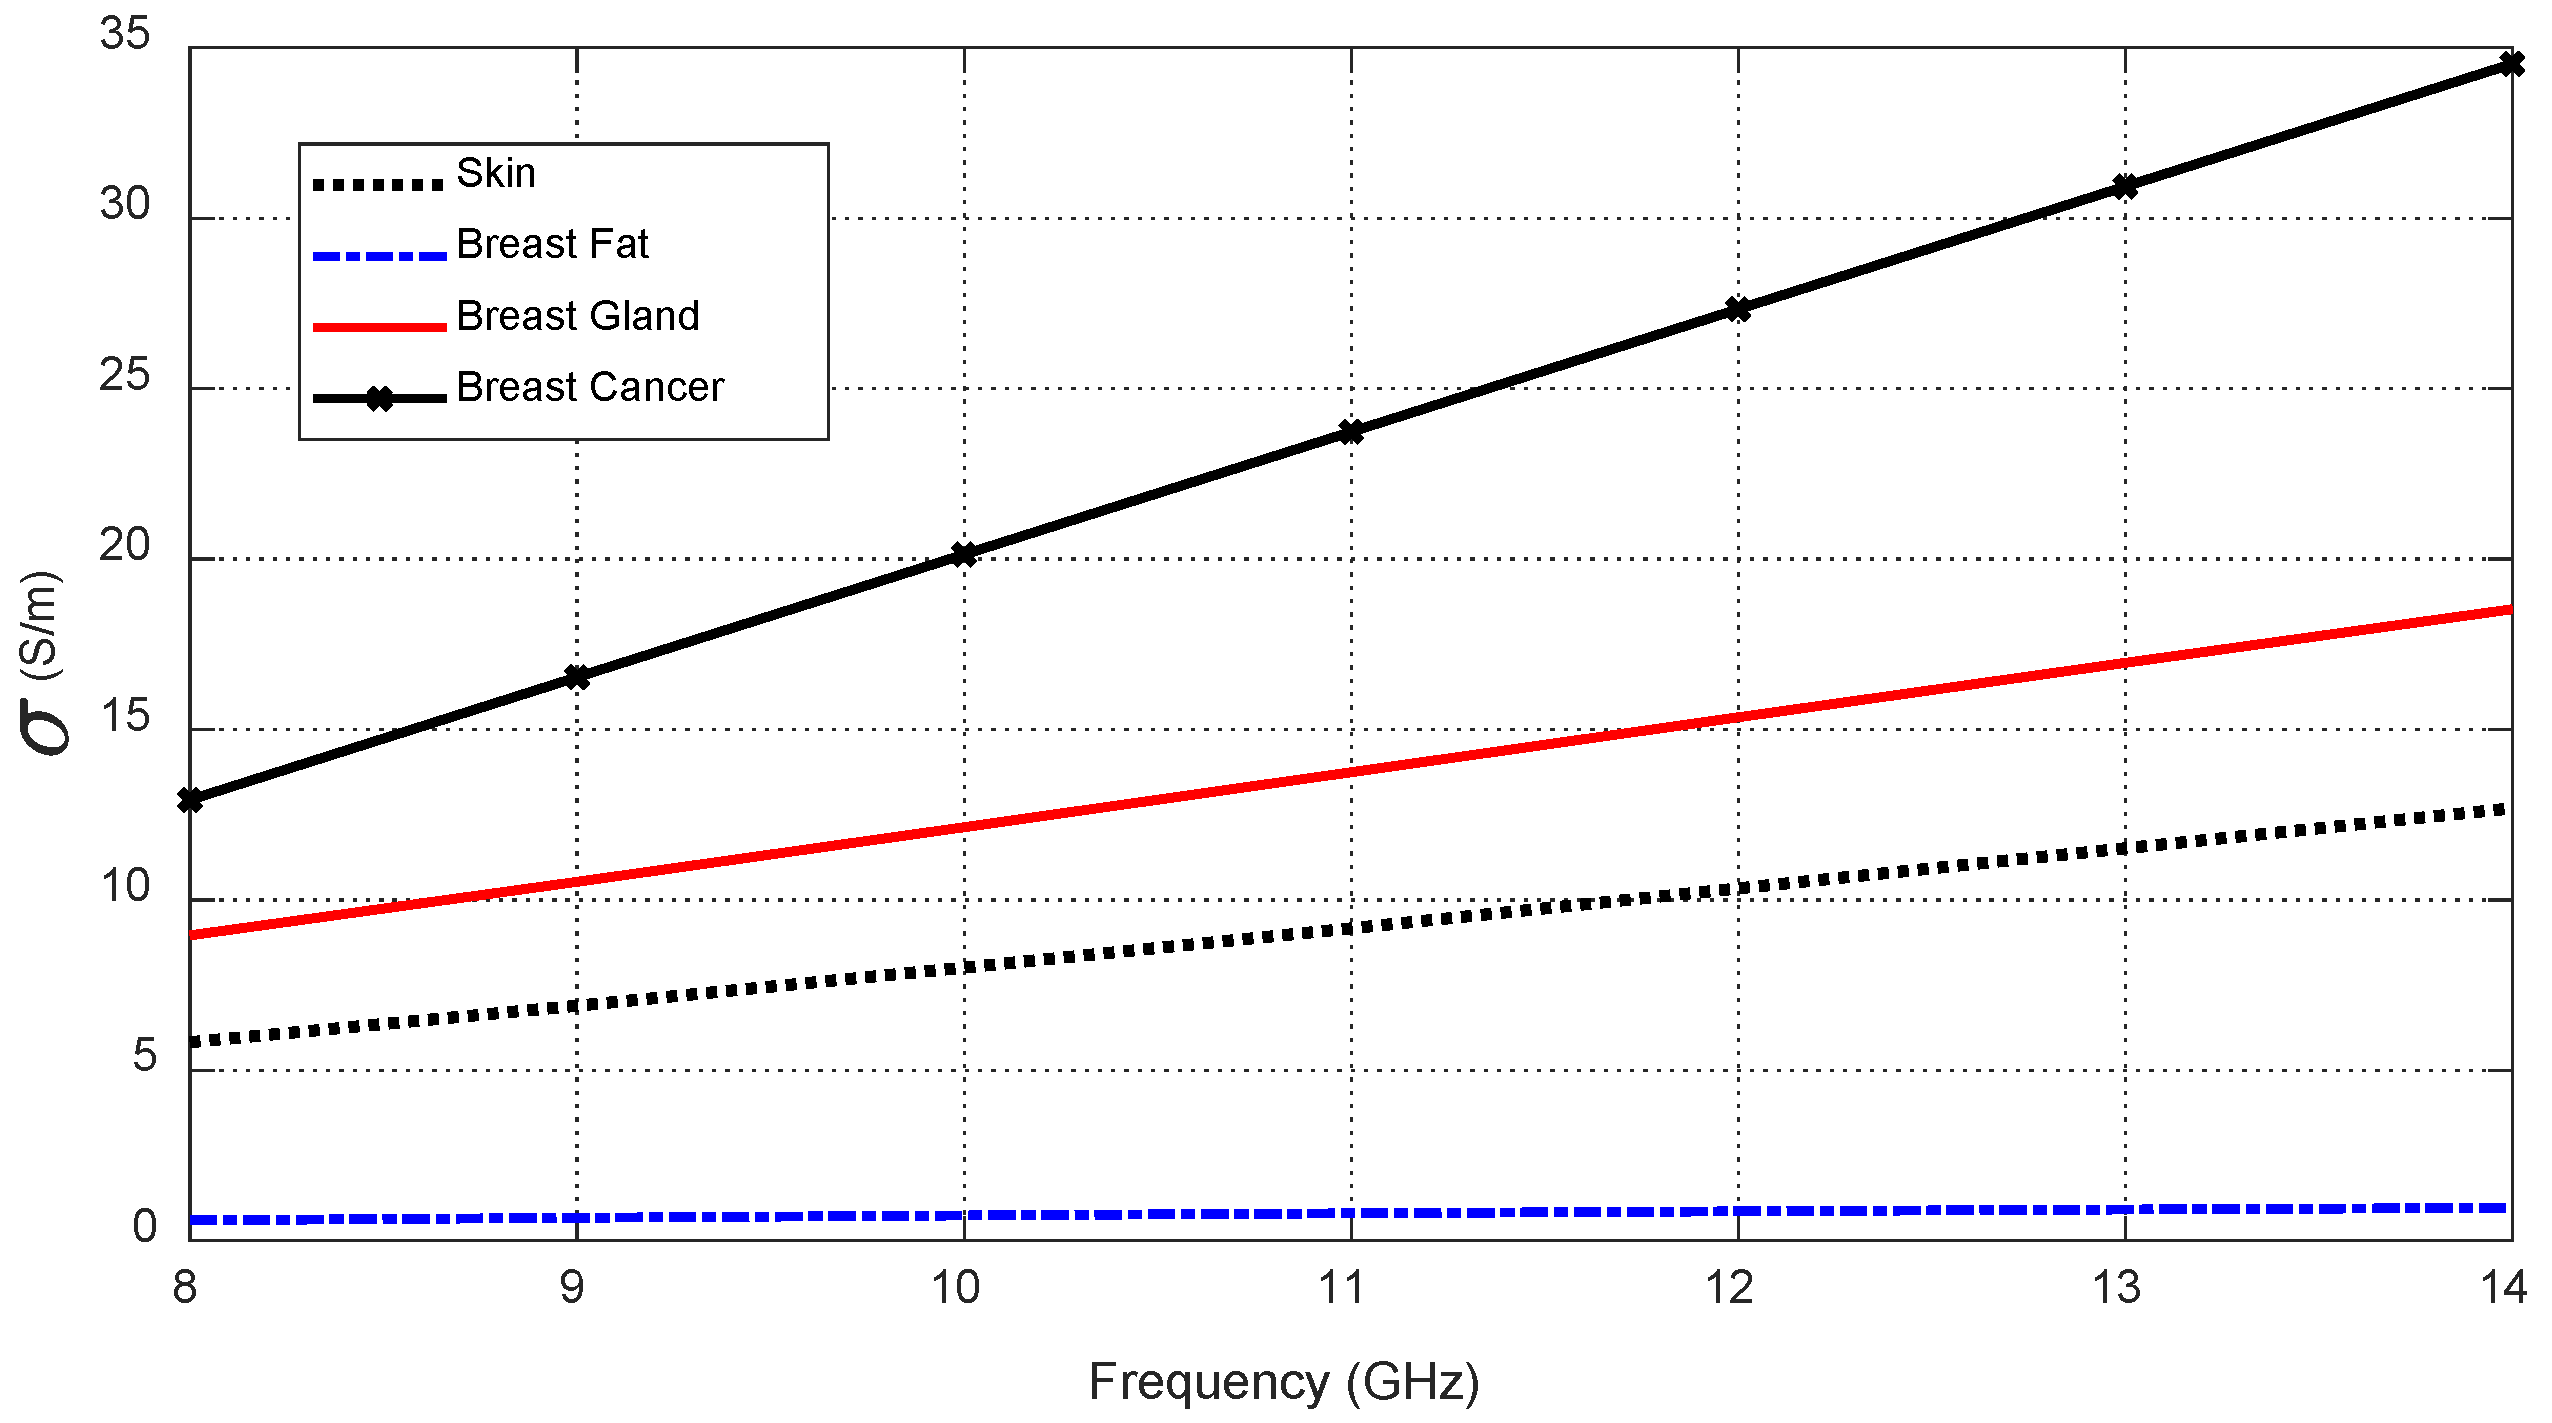
Figure 11.
Variation in the electric conductivity of the different tissue types over the frequency band 8–14 GHz.
Figure 11.
Variation in the electric conductivity of the different tissue types over the frequency band 8–14 GHz.
Figure 12.
SAR distribution in the tissues of the curved breast model (radius of curvature = 5 cm) when the input power of the antenna is .
Figure 12.
SAR distribution in the tissues of the curved breast model (radius of curvature = 5 cm) when the input power of the antenna is .
Figure 13.
Fabricated prototype of the proposed on-skin antenna. (a) View of the patch side. (b) View of the ground side.
Figure 13.
Fabricated prototype of the proposed on-skin antenna. (a) View of the patch side. (b) View of the ground side.
Figure 14.
The VNA of the Agilent-FieldFox® model N9918A is used to measure over the frequency band (2–26 GHz) while the antenna is being placed on the skin and bent with a radius of curvature .
Figure 14.
The VNA of the Agilent-FieldFox® model N9918A is used to measure over the frequency band (2–26 GHz) while the antenna is being placed on the skin and bent with a radius of curvature .
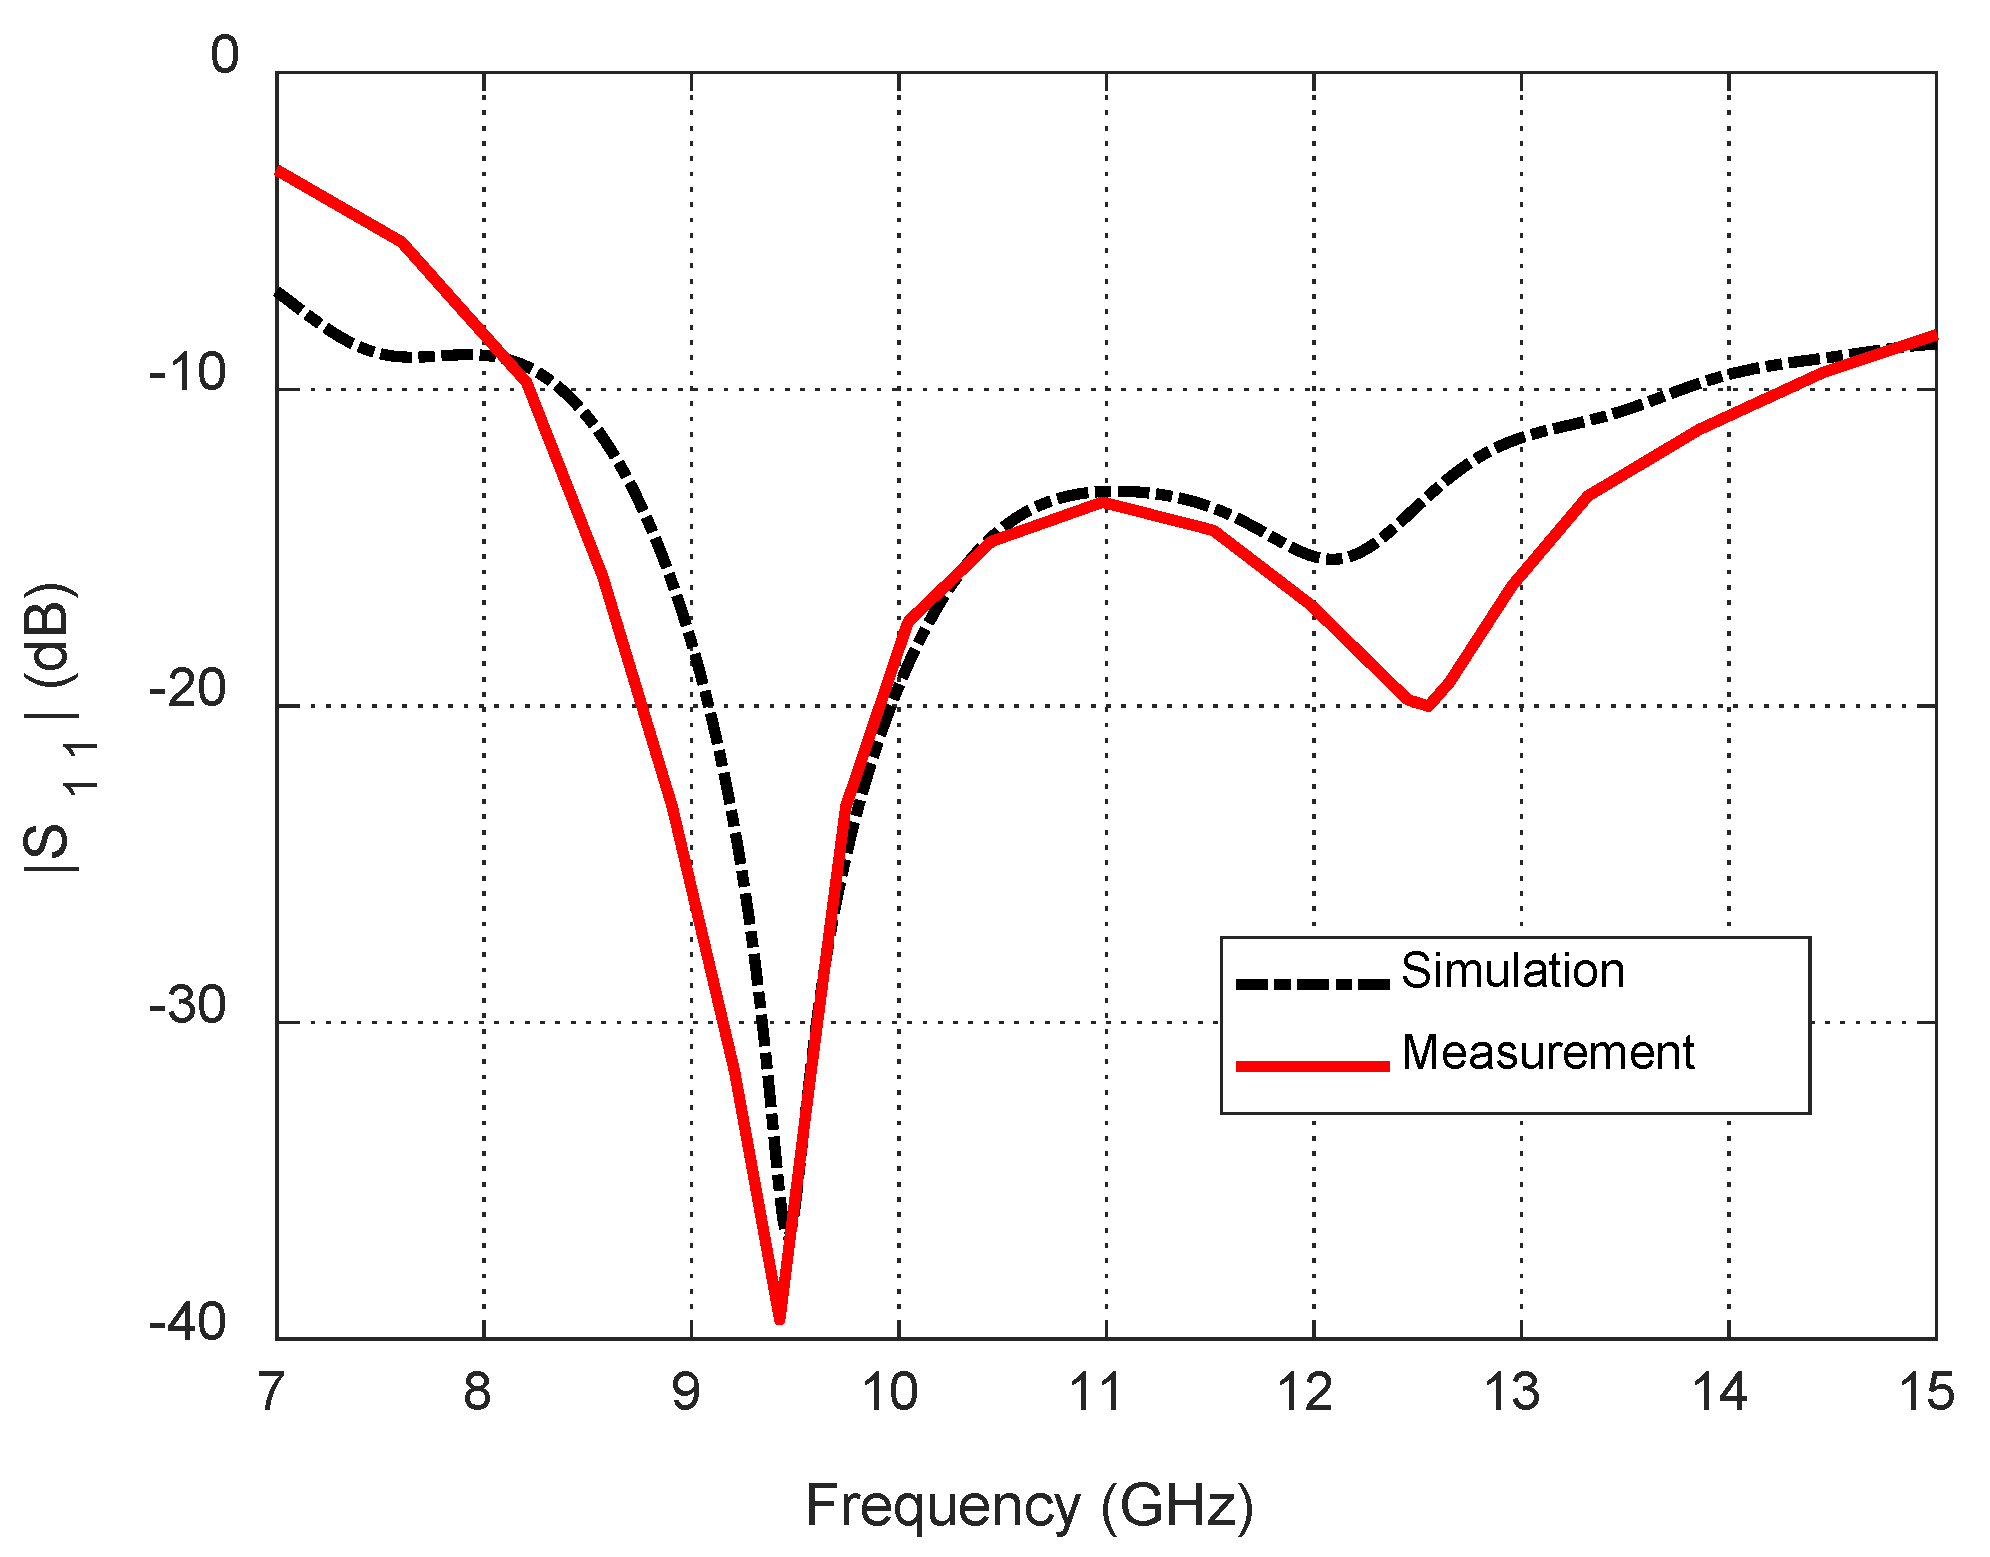
Figure 15.
Dependence of the reflection coefficient magnitude, , on the frequency for the blended-corner strip-dipole antenna when fed through the proposed balun.
Figure 15.
Dependence of the reflection coefficient magnitude, , on the frequency for the blended-corner strip-dipole antenna when fed through the proposed balun.
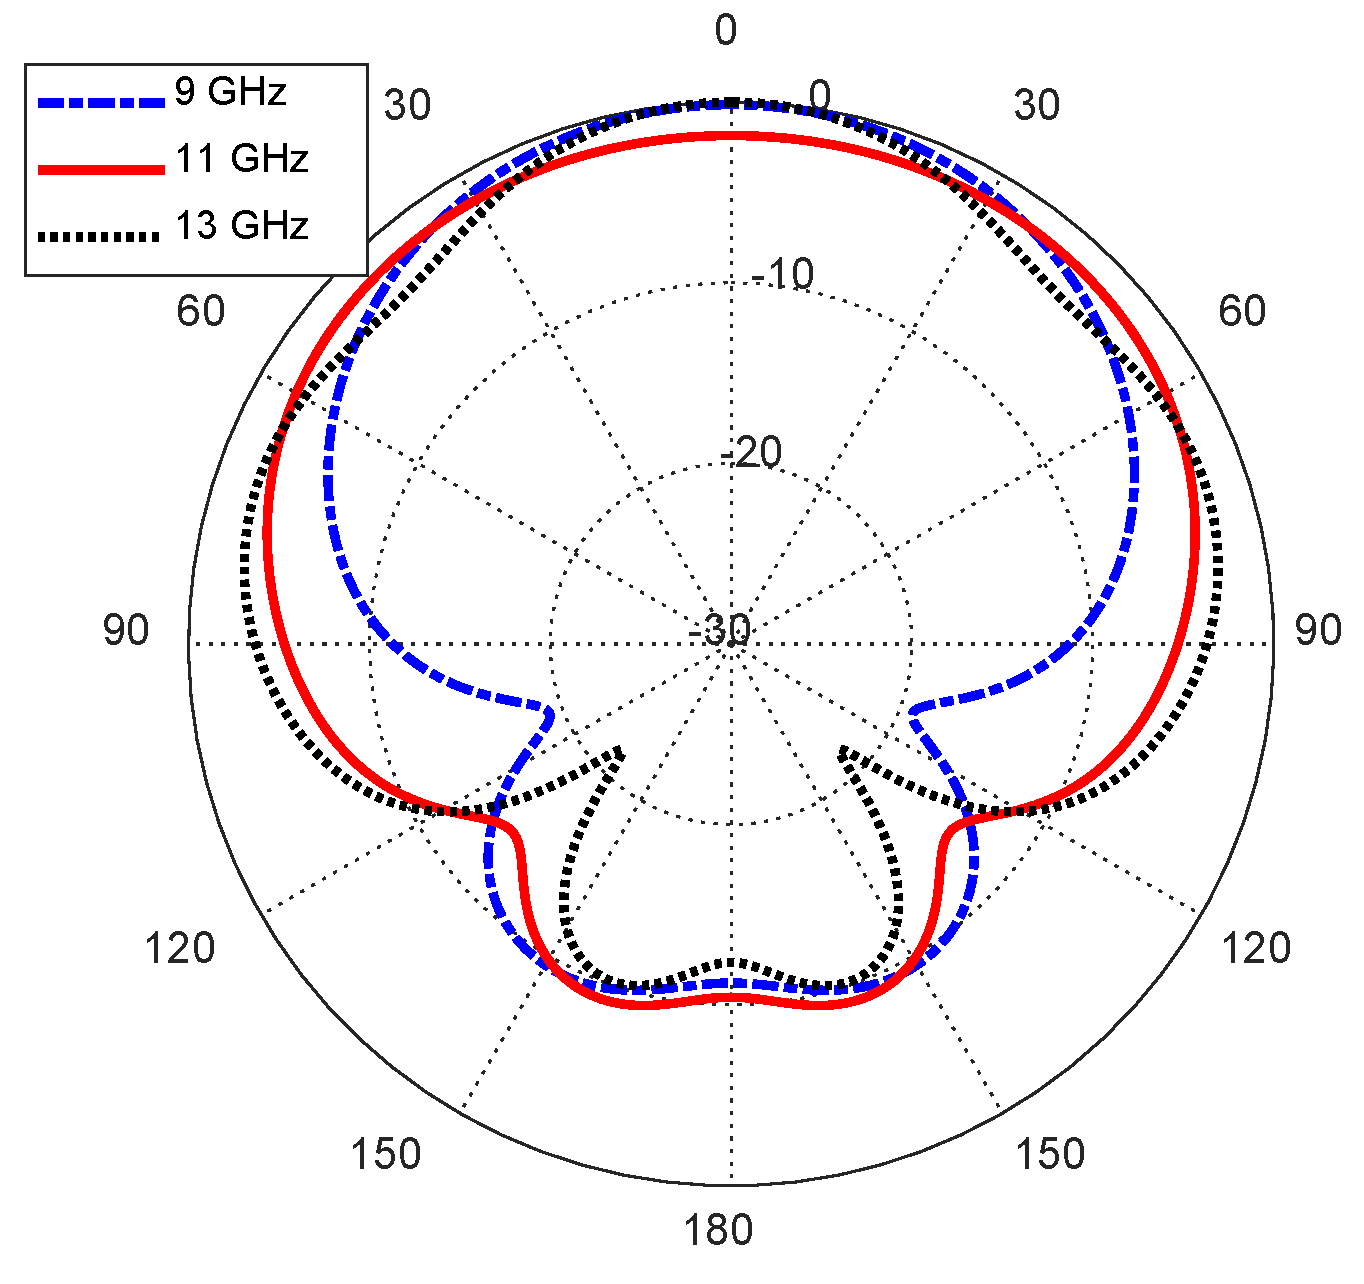
Figure 16.
Radiation patterns of the curved antenna on the curved body model in the elevation plane .
Figure 16.
Radiation patterns of the curved antenna on the curved body model in the elevation plane .
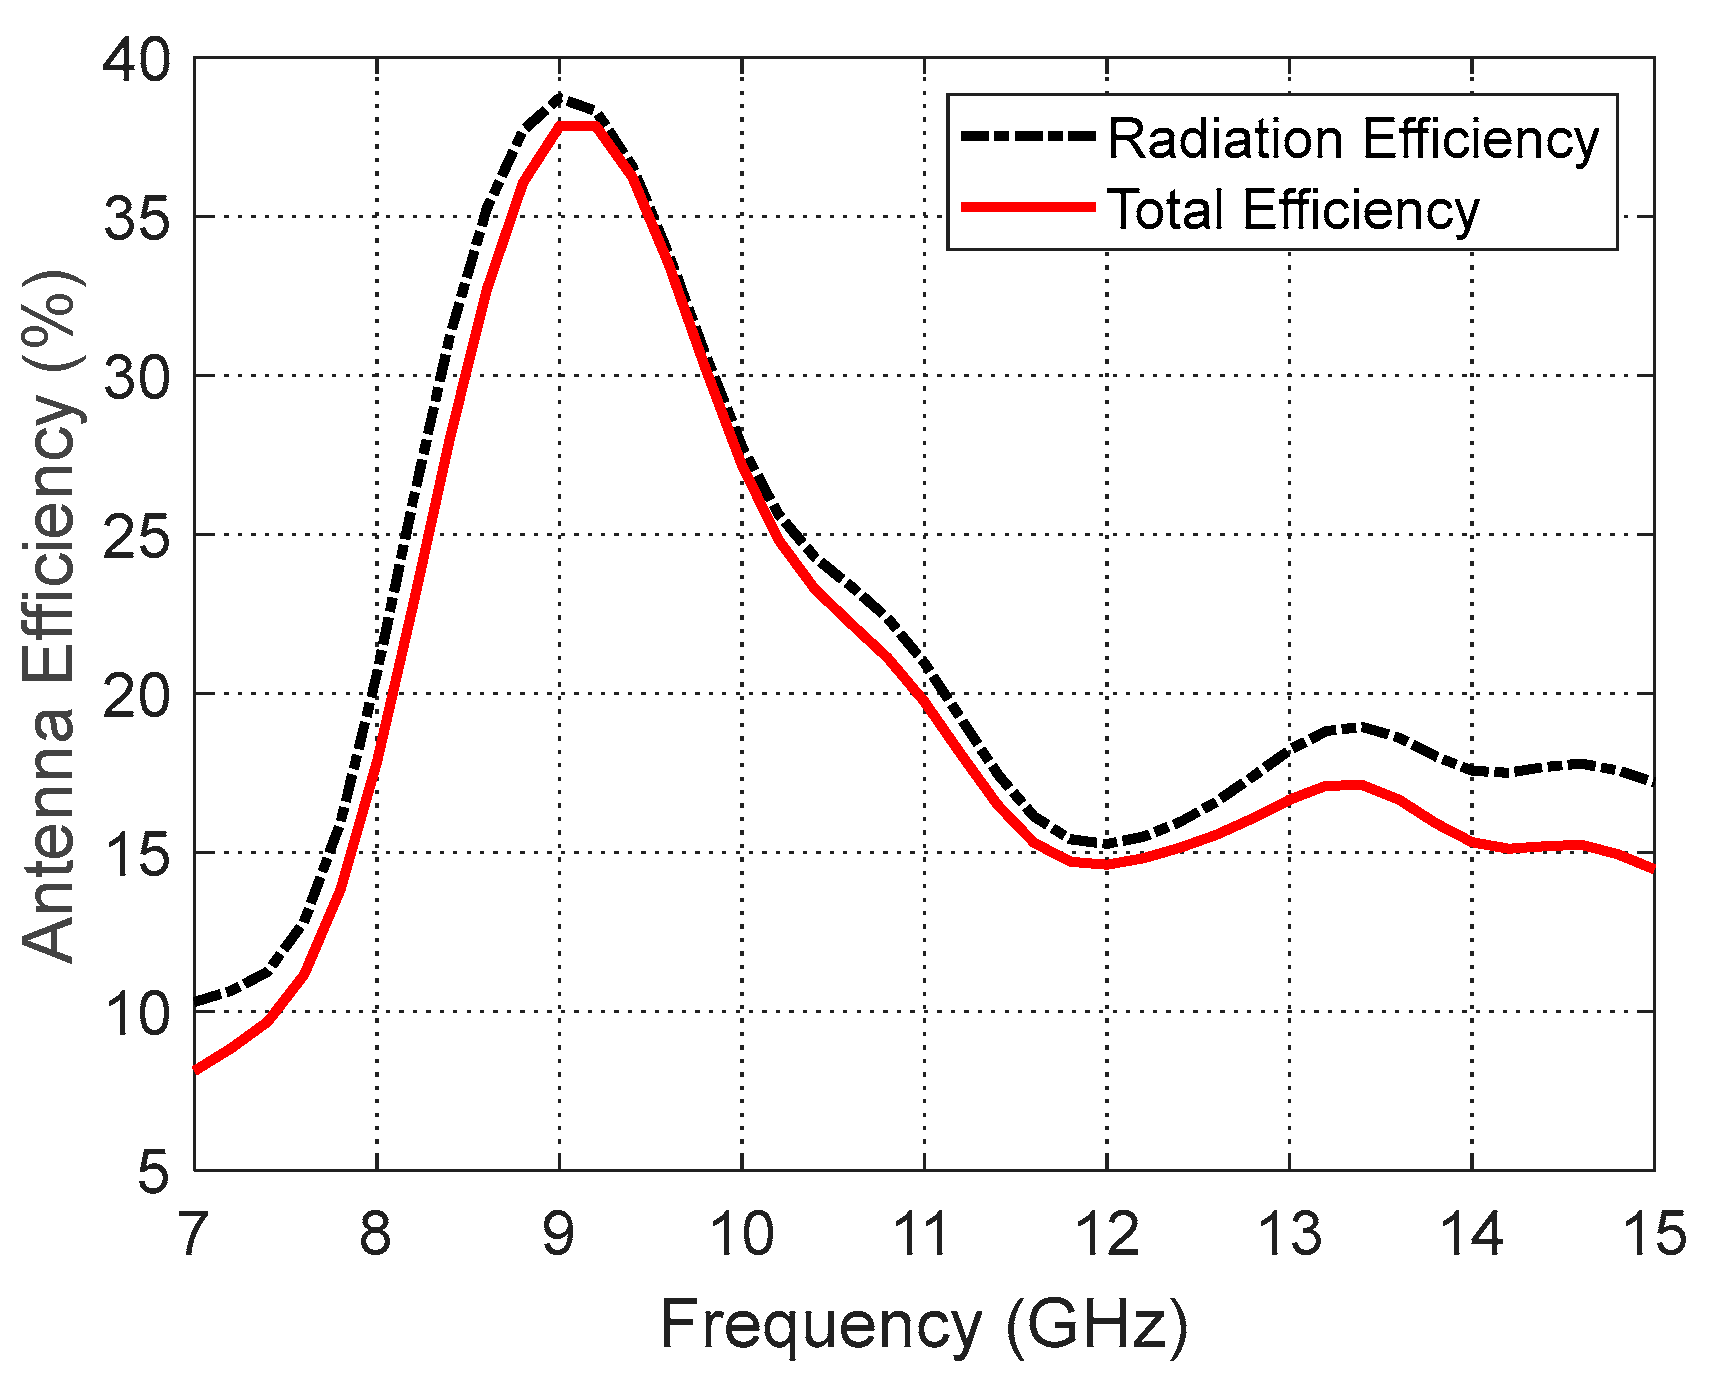
Figure 17.
Variation in the total and radiation efficiencies of the curved antenna on a curved human model over the operational frequency band.
Figure 17.
Variation in the total and radiation efficiencies of the curved antenna on a curved human model over the operational frequency band.
Figure 18.
Variation in the maximum directivity and gain of the curved antenna on a curved human model over the operational frequency band.
Figure 18.
Variation in the maximum directivity and gain of the curved antenna on a curved human model over the operational frequency band.
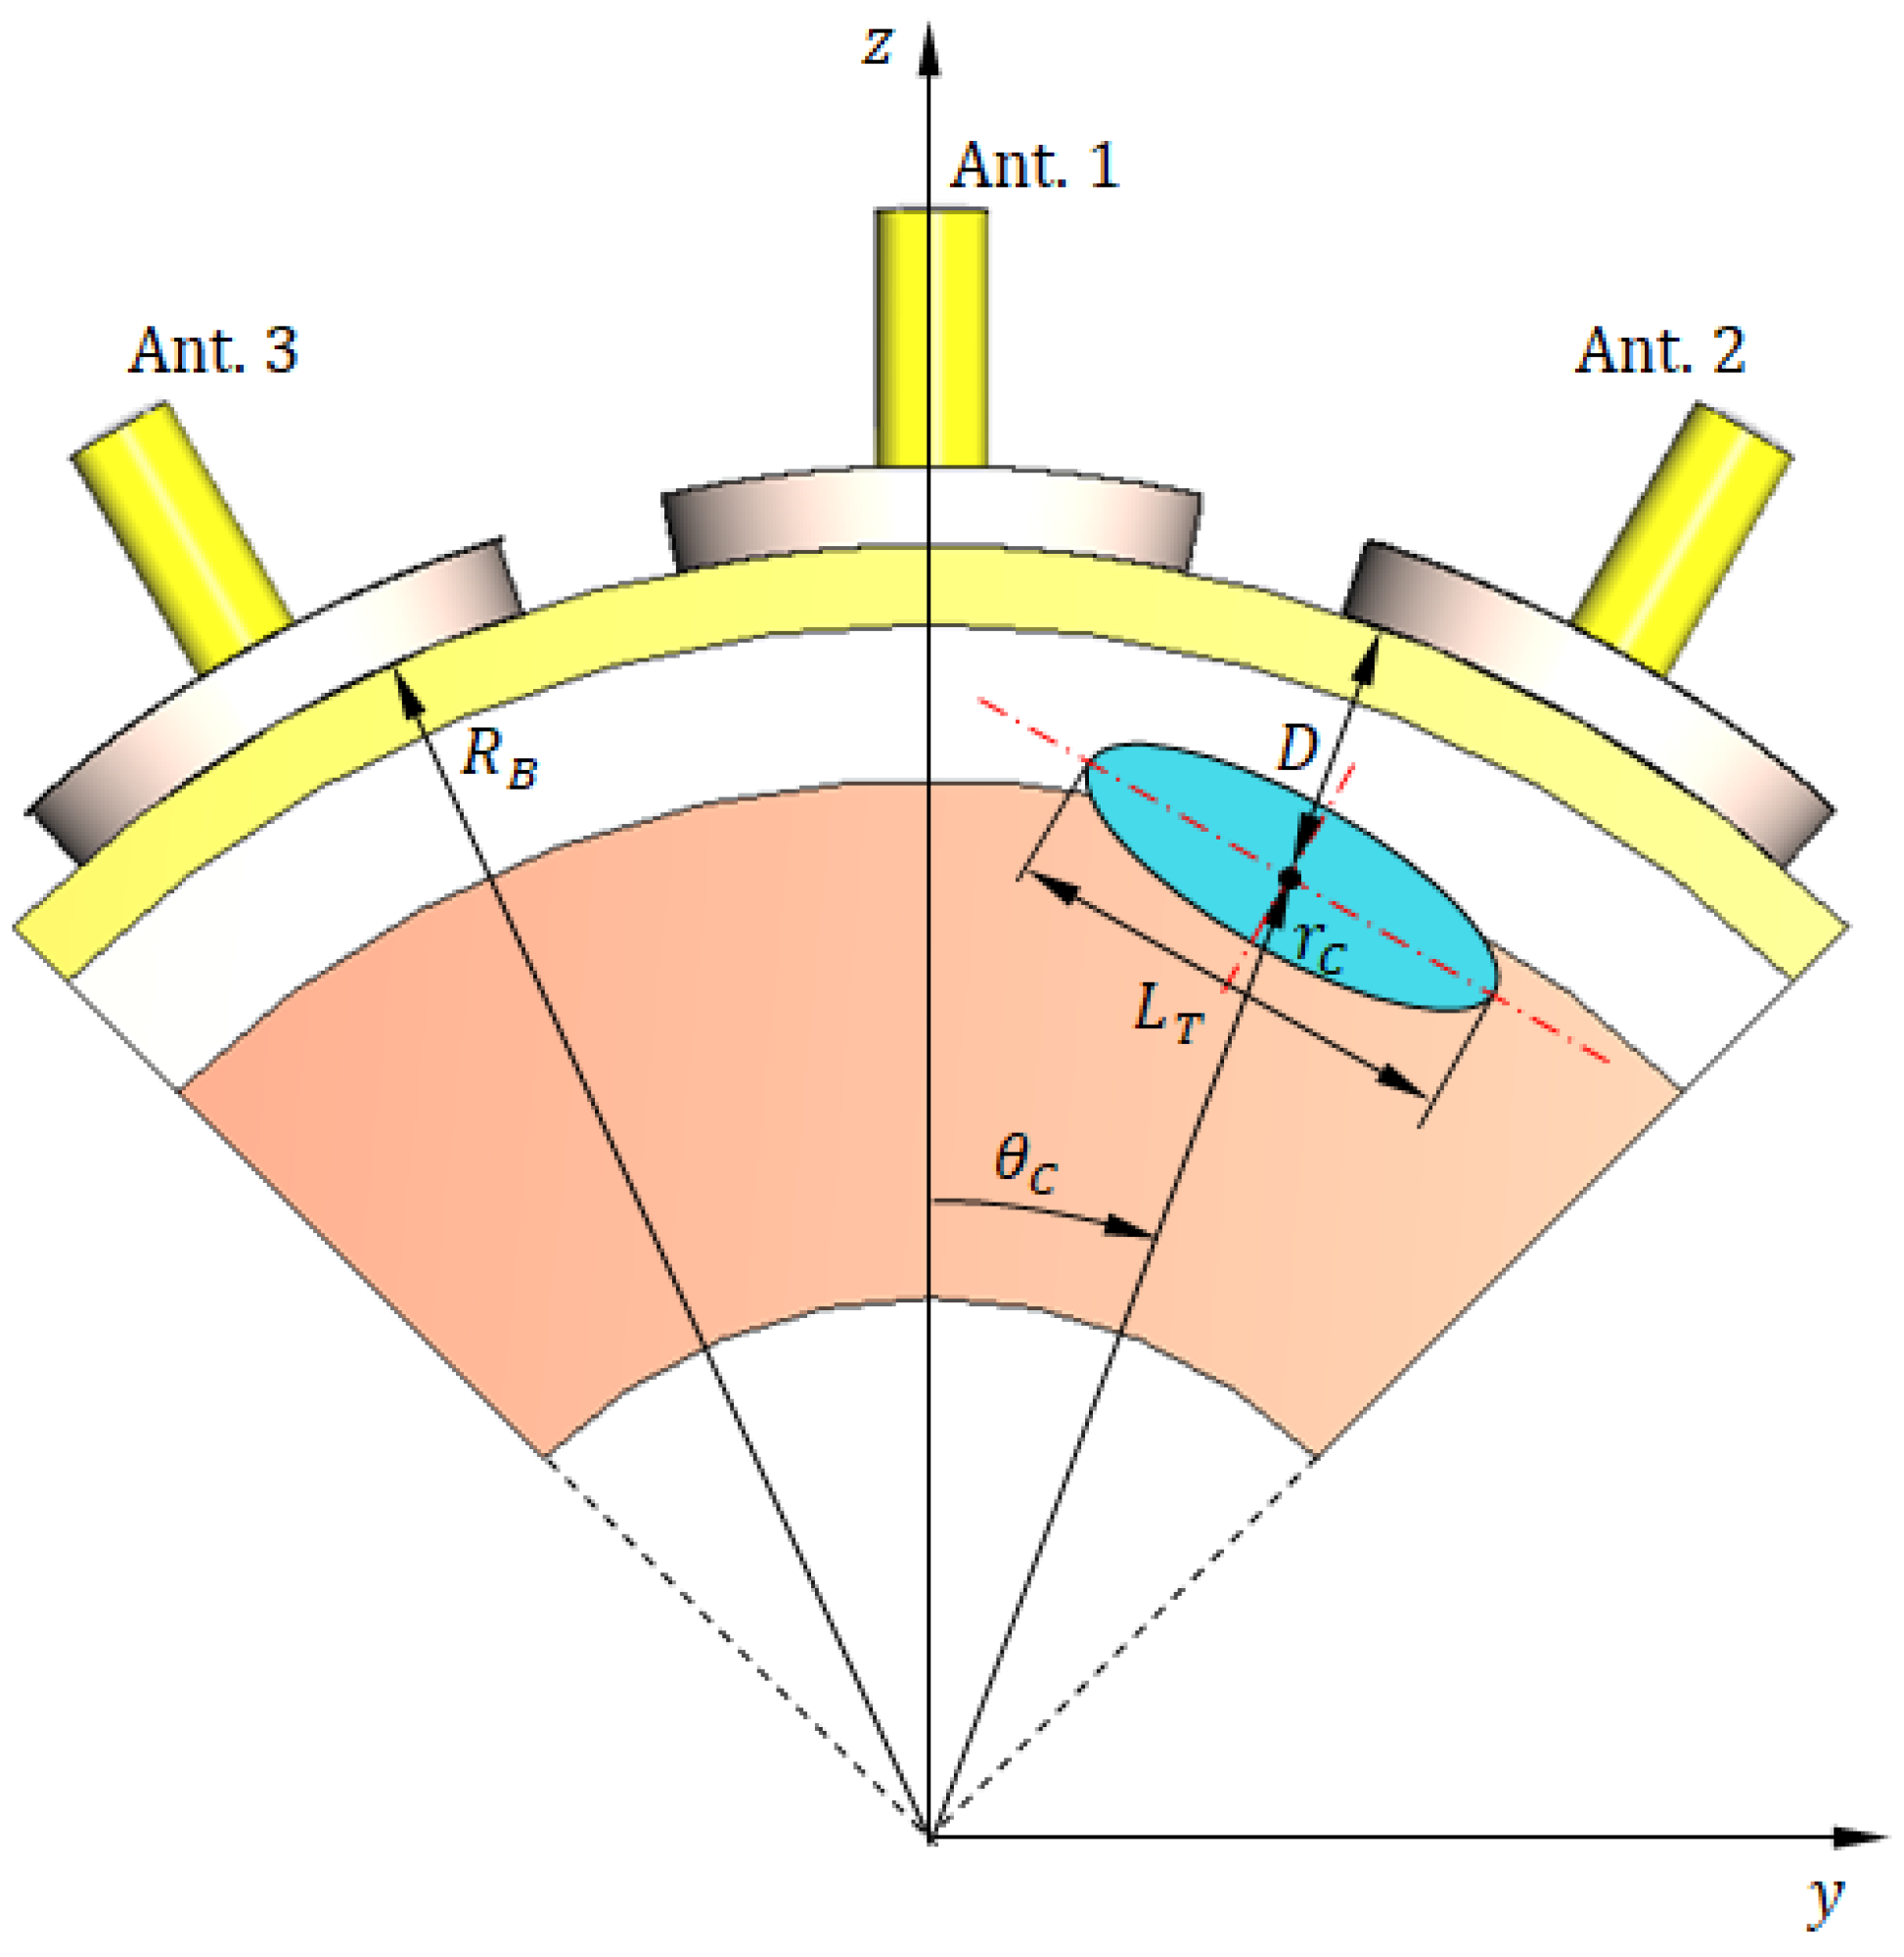
Figure 19.
A 3D view showing vertical cross-section of the hemispherical breast model, where the radar scanning plane coincides with the tumor plane (). The antenna system consists of six elements uniformly distributed along the perimeter. The tumor is positioned in the mid-angular sector between antennas 2 and 3.
Figure 20.
Truncated hemispherical breast model used for simulation. (a) Three-dimensional perspective view showing the truncated sector bounded by five surfaces. (b) Vertical cross-section illustrating the skin, breast fat, and glandular tissue layers, as well as the embedded ellipsoidal tumor. This reduced geometry enables focused simulation of tumor detection using three antennas while preserving the fidelity of electromagnetic interactions.
Figure 21.
The reduced (truncated) model of the breast for simulation of breast cancer detection scenario. (a) A 3D view showing three antennas in direct contact with the skin surface. (b) Vertical section showing the three antennas with angular separation and other important dimensions.
Figure 21.
The reduced (truncated) model of the breast for simulation of breast cancer detection scenario. (a) A 3D view showing three antennas in direct contact with the skin surface. (b) Vertical section showing the three antennas with angular separation and other important dimensions.
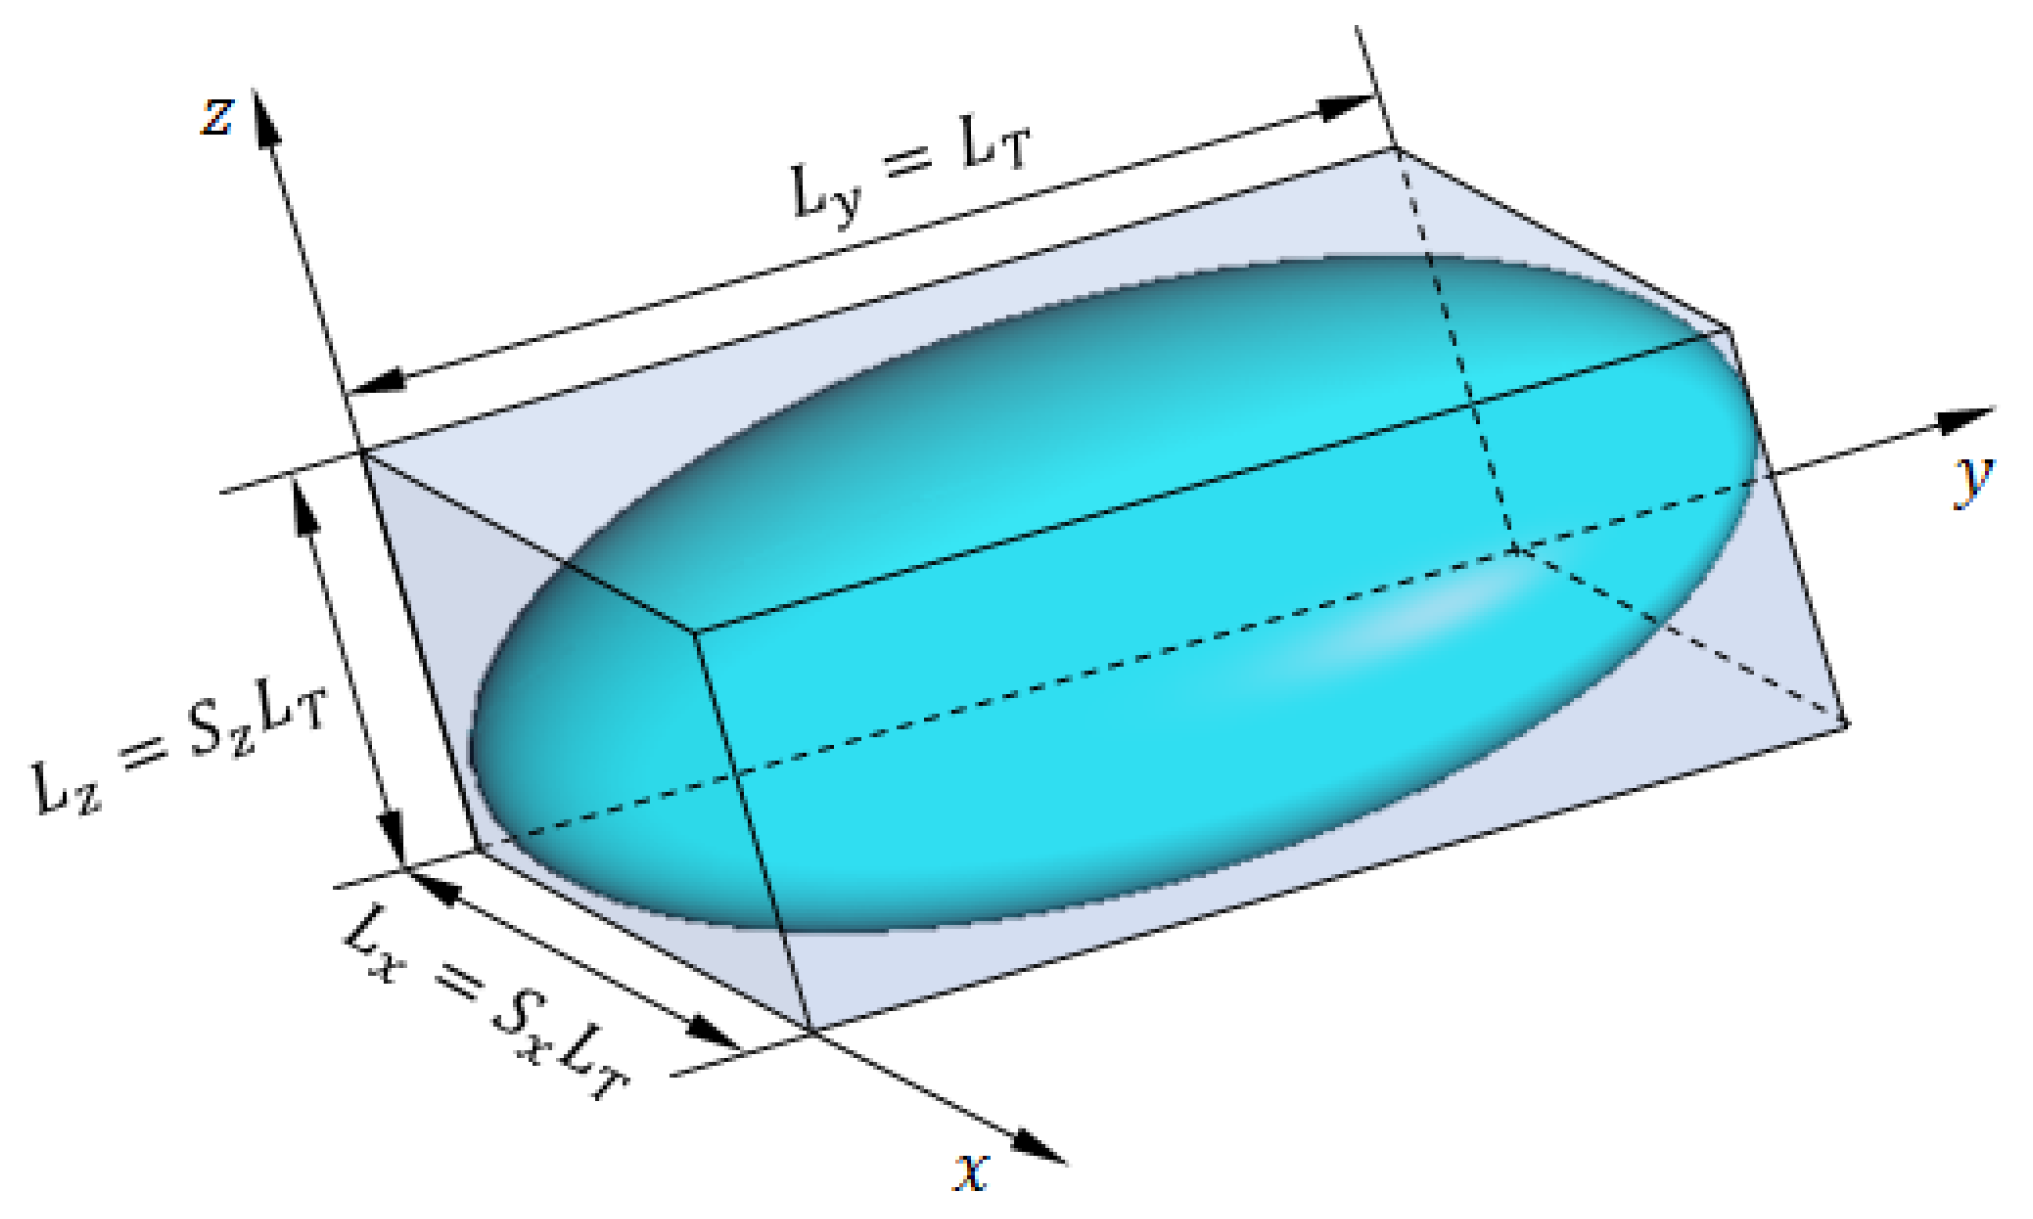
Figure 22.
The ellipsoidal model of breast tumor tissues.
Figure 22.
The ellipsoidal model of breast tumor tissues.
Figure 23.
Sensitivity profiles showing the normalized change in S-parameter magnitude () across all six antennas for selected tumor positions.
Figure 23.
Sensitivity profiles showing the normalized change in S-parameter magnitude () across all six antennas for selected tumor positions.
Figure 24.
Frequency response of the magnitudes of the self-scattering parameters
,
, and
, for the antenna system placed on the breast model (free from tumor), as shown in
Figure 21.
Figure 24.
Frequency response of the magnitudes of the self-scattering parameters
,
, and
, for the antenna system placed on the breast model (free from tumor), as shown in
Figure 21.
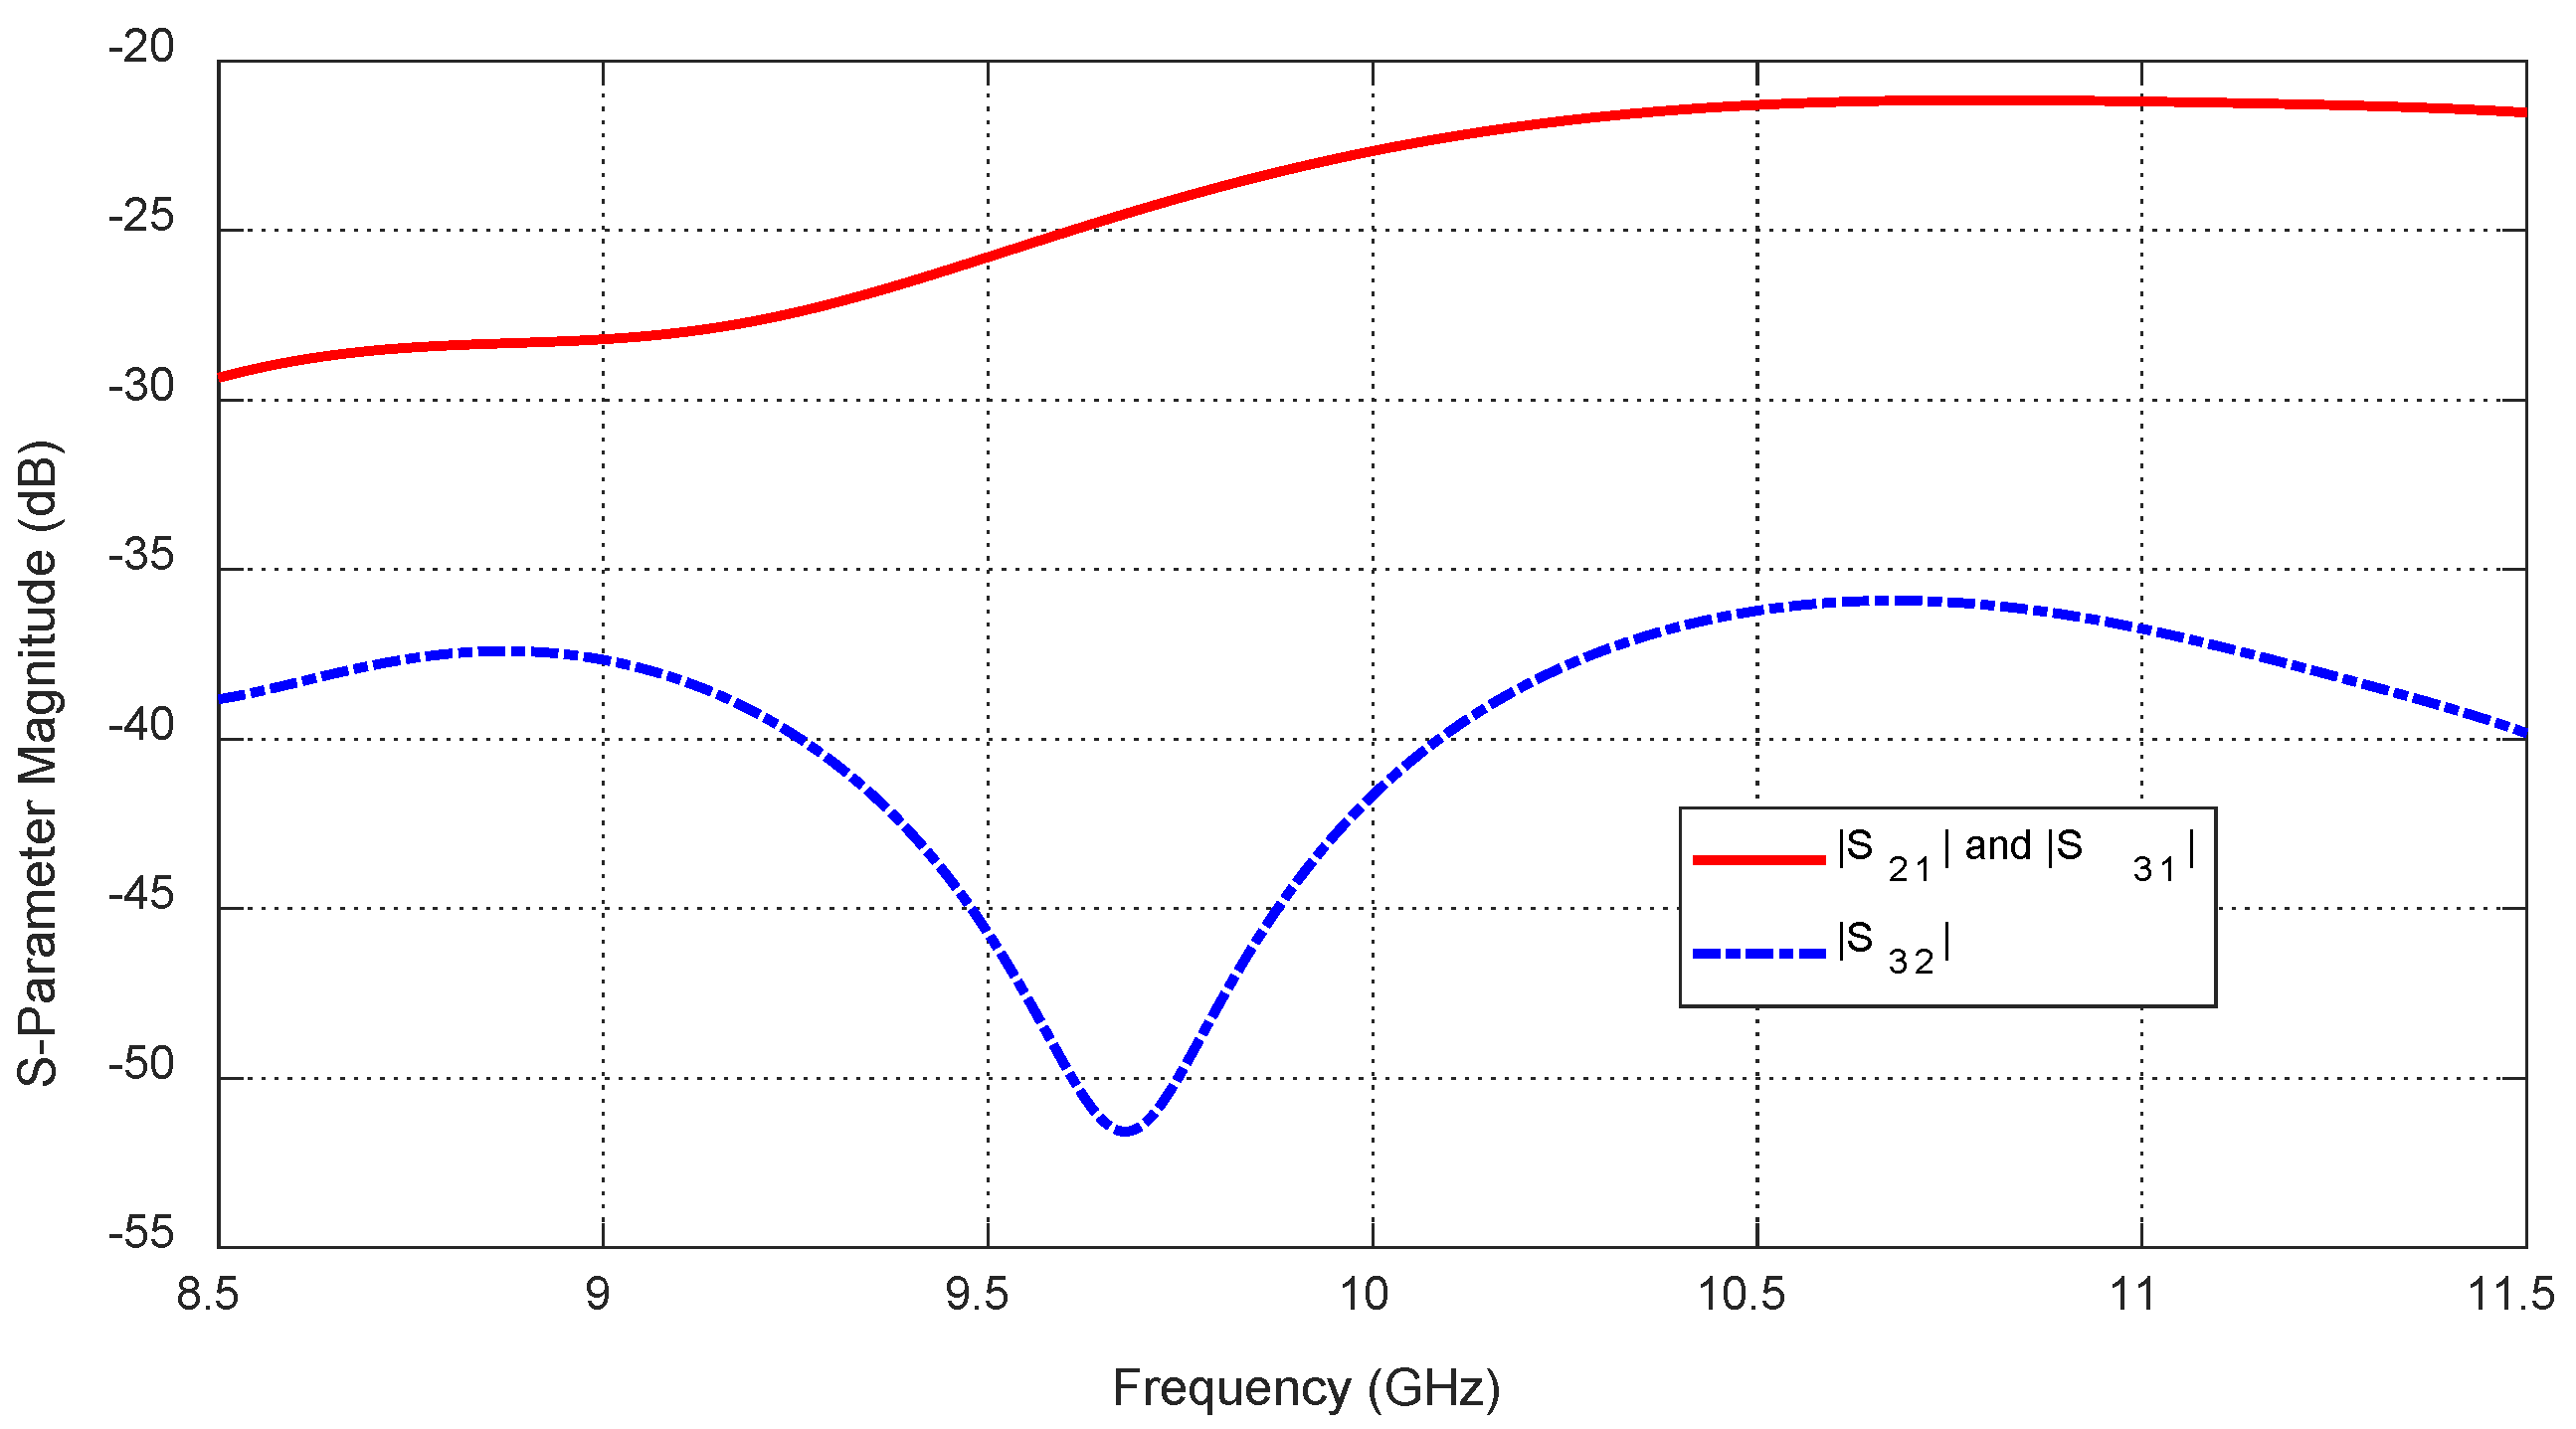
Figure 25.
Frequency response of the magnitudes of the mutual-scattering parameters
,
, and
, for the antenna system placed on the breast model (free from tumor), as shown in
Figure 21.
Figure 25.
Frequency response of the magnitudes of the mutual-scattering parameters
,
, and
, for the antenna system placed on the breast model (free from tumor), as shown in
Figure 21.
Figure 26.
The aim of the tumor target detection algorithm is to accurately identify the embedded tumor location () and size () using the mutual coupling parameters and , obtained from the antenna system over the frequency band 8.5–11.5 GHz.
Figure 26.
The aim of the tumor target detection algorithm is to accurately identify the embedded tumor location () and size () using the mutual coupling parameters and , obtained from the antenna system over the frequency band 8.5–11.5 GHz.
Figure 27.
Variation in the frequency response of , for different values of the angular position, , of an ellipsoidal tumor of major length embedded at a depth of below the skin surface of a hemispherical breast model.
Figure 27.
Variation in the frequency response of , for different values of the angular position, , of an ellipsoidal tumor of major length embedded at a depth of below the skin surface of a hemispherical breast model.
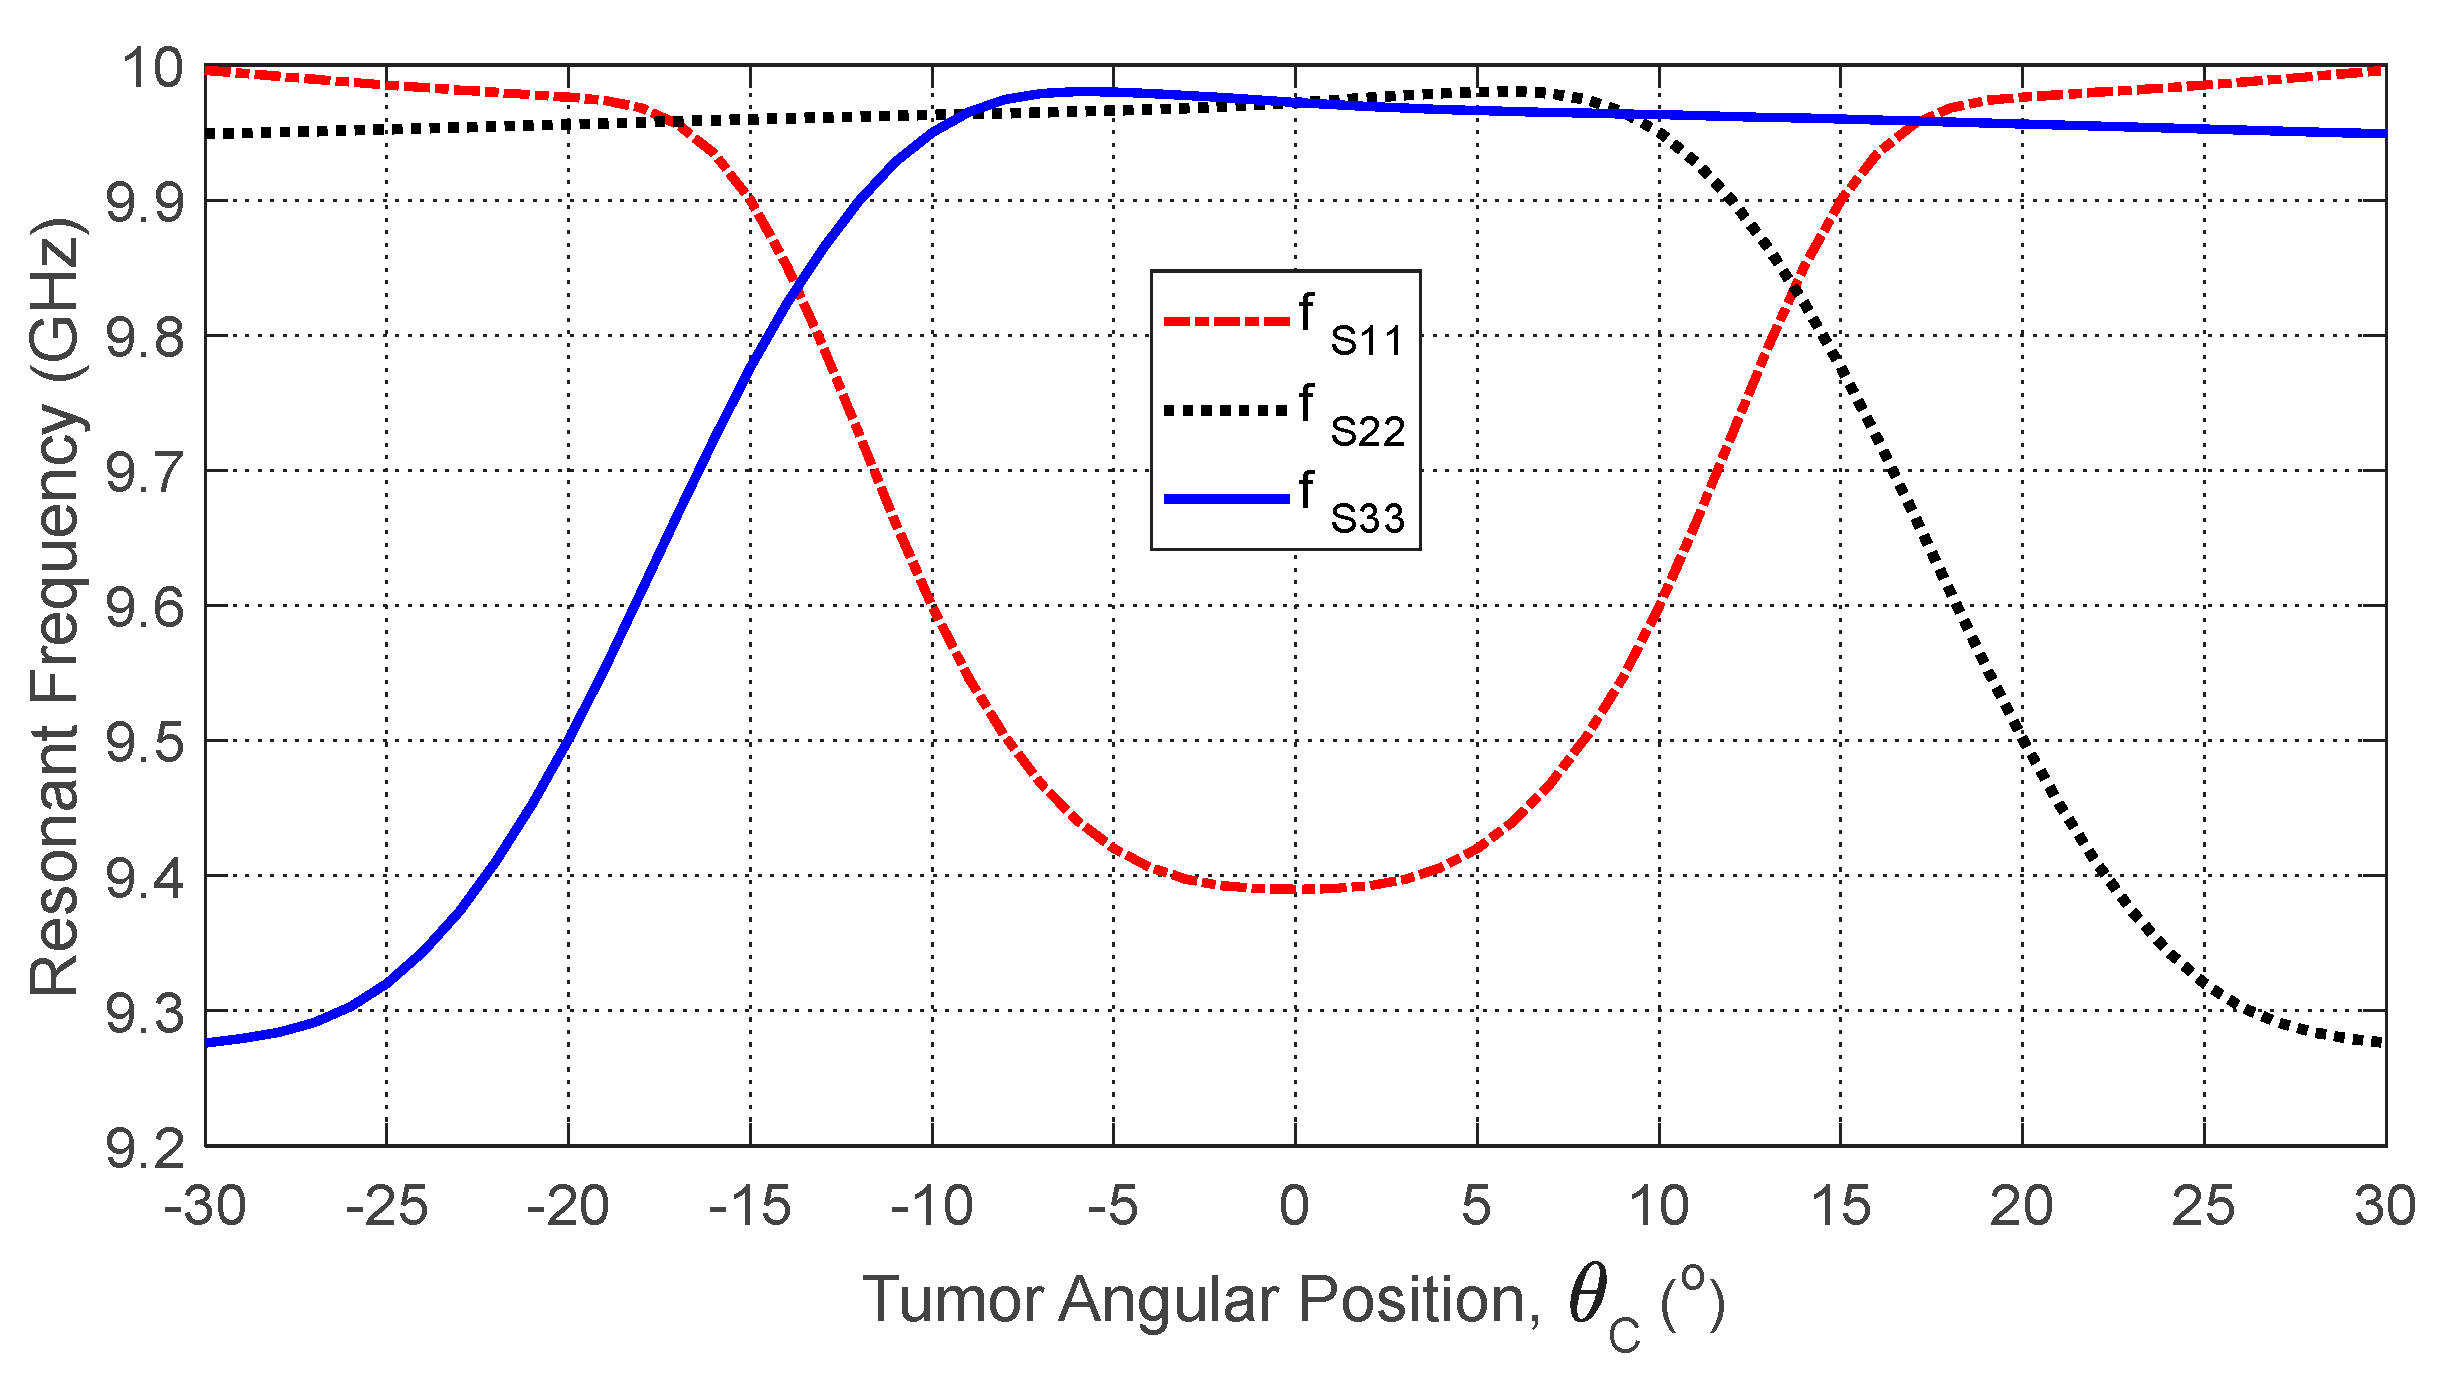
Figure 28.
Variation in the resonant frequencies corresponding to the minima of the self S-parameters , , and with varying the angular position, , of an ellipsoidal tumor of major length embedded at a depth of below the skin surface of a hemispherical breast model.
Figure 28.
Variation in the resonant frequencies corresponding to the minima of the self S-parameters , , and with varying the angular position, , of an ellipsoidal tumor of major length embedded at a depth of below the skin surface of a hemispherical breast model.
Figure 29.
Dependence of the mutual S-parameters and (averaged over the frequency range 10–11 GHz) on the angular position of a spheroidal tumor of length embedded at a depth of below the skin surface.
Figure 29.
Dependence of the mutual S-parameters and (averaged over the frequency range 10–11 GHz) on the angular position of a spheroidal tumor of length embedded at a depth of below the skin surface.
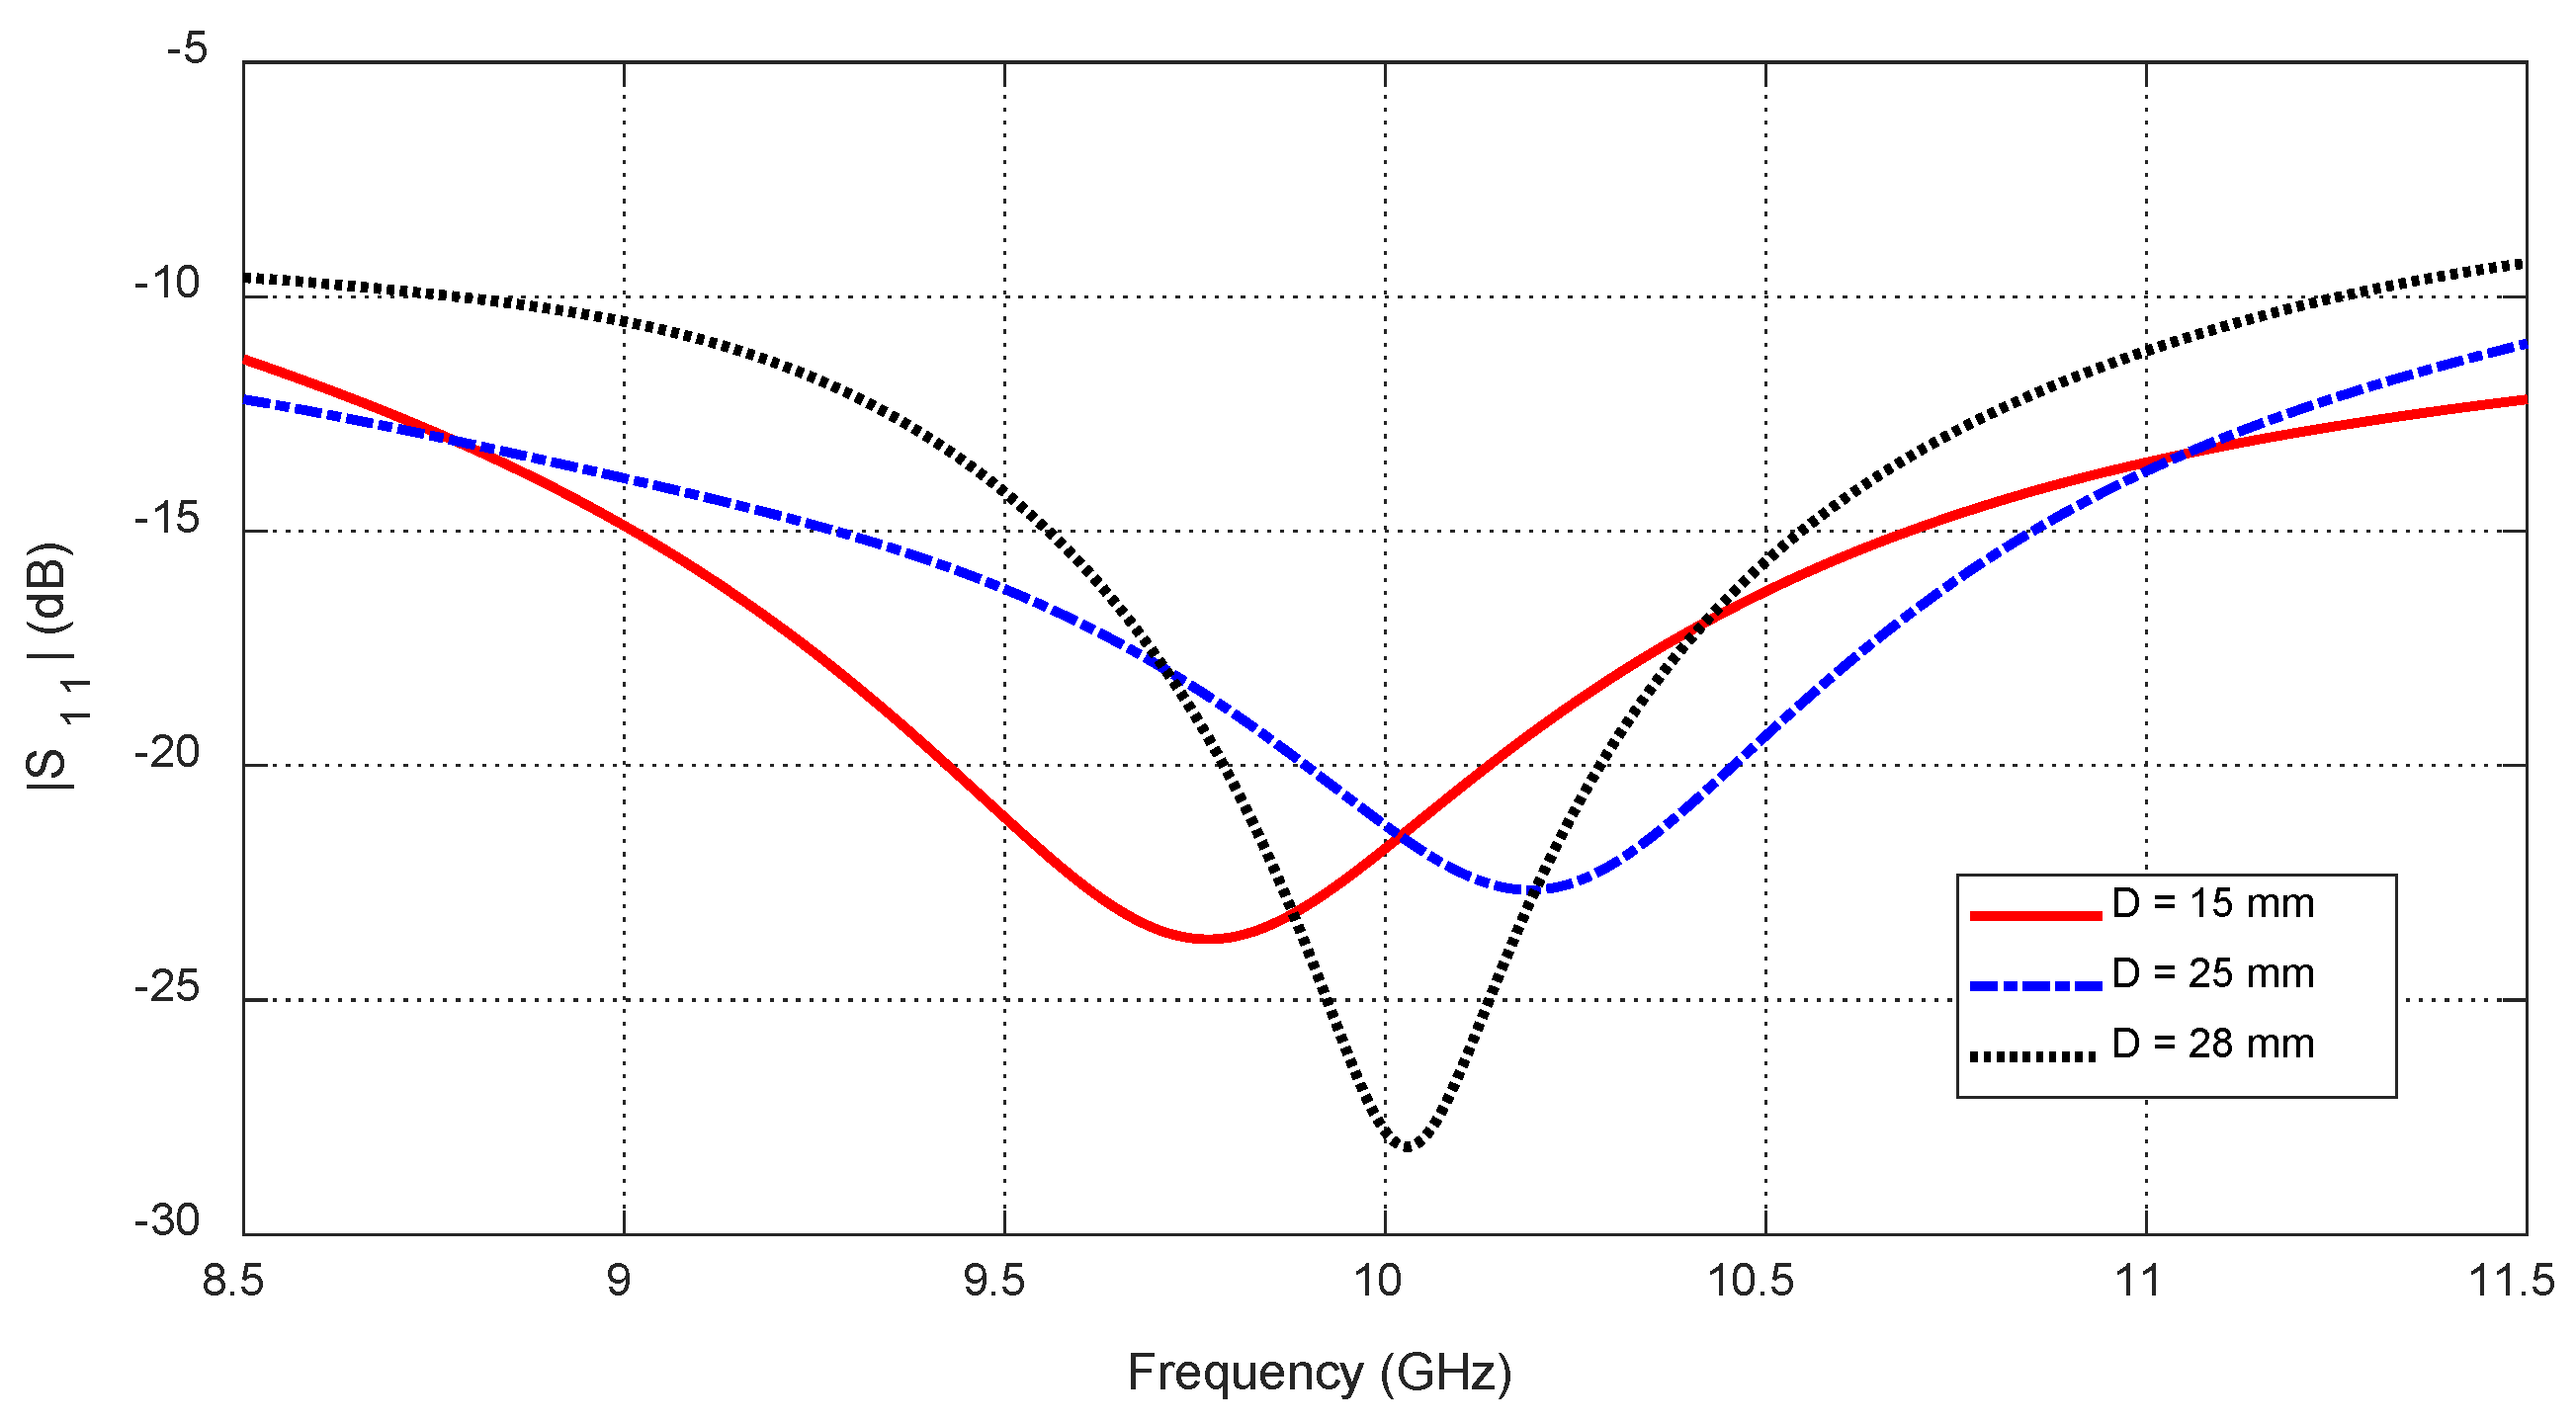
Figure 30.
Frequency responses of for different values of the depth, , beneath the skin surface of a hemispherical breast model at which an ellipsoidal tumor of major length is embedded at the angular position .
Figure 30.
Frequency responses of for different values of the depth, , beneath the skin surface of a hemispherical breast model at which an ellipsoidal tumor of major length is embedded at the angular position .
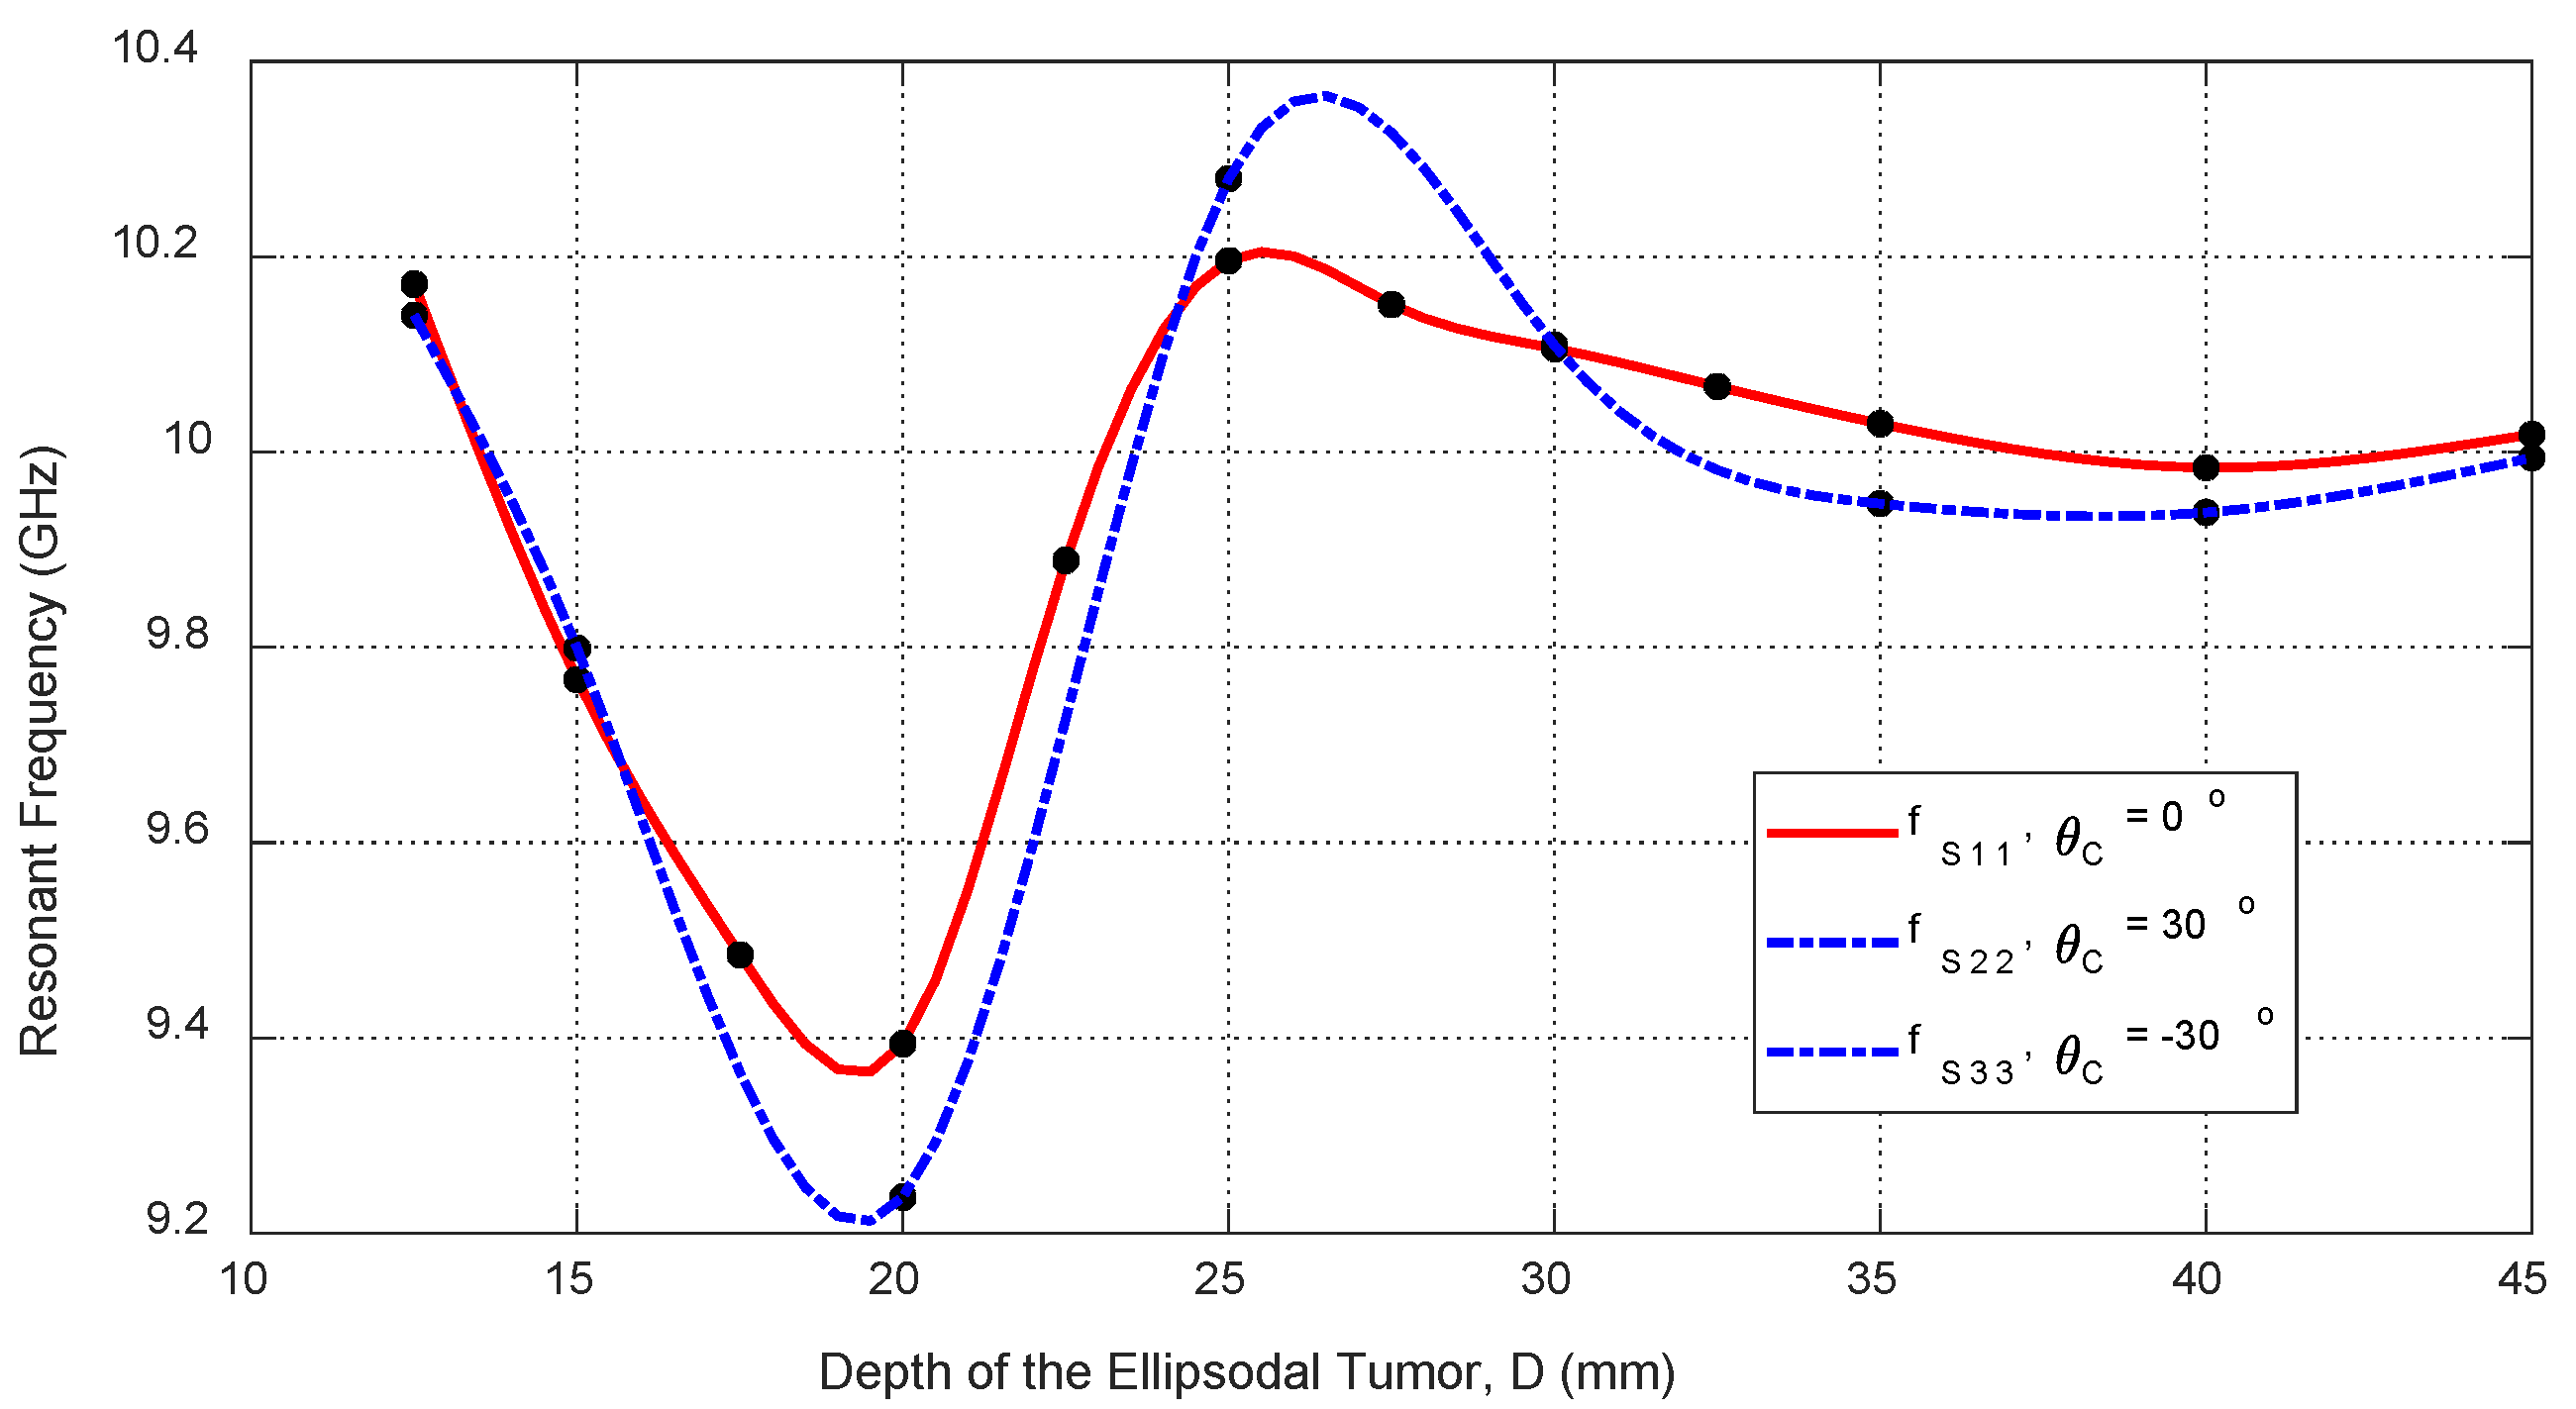
Figure 31.
Variation in the resonant frequencies corresponding to the minima of the self S-parameters , , and with varying the depth, , beneath the skin surface of a hemispherical breast model at which an ellipsoidal tumor of major length is embedded at the angular positions , , and , respectively.
Figure 31.
Variation in the resonant frequencies corresponding to the minima of the self S-parameters , , and with varying the depth, , beneath the skin surface of a hemispherical breast model at which an ellipsoidal tumor of major length is embedded at the angular positions , , and , respectively.
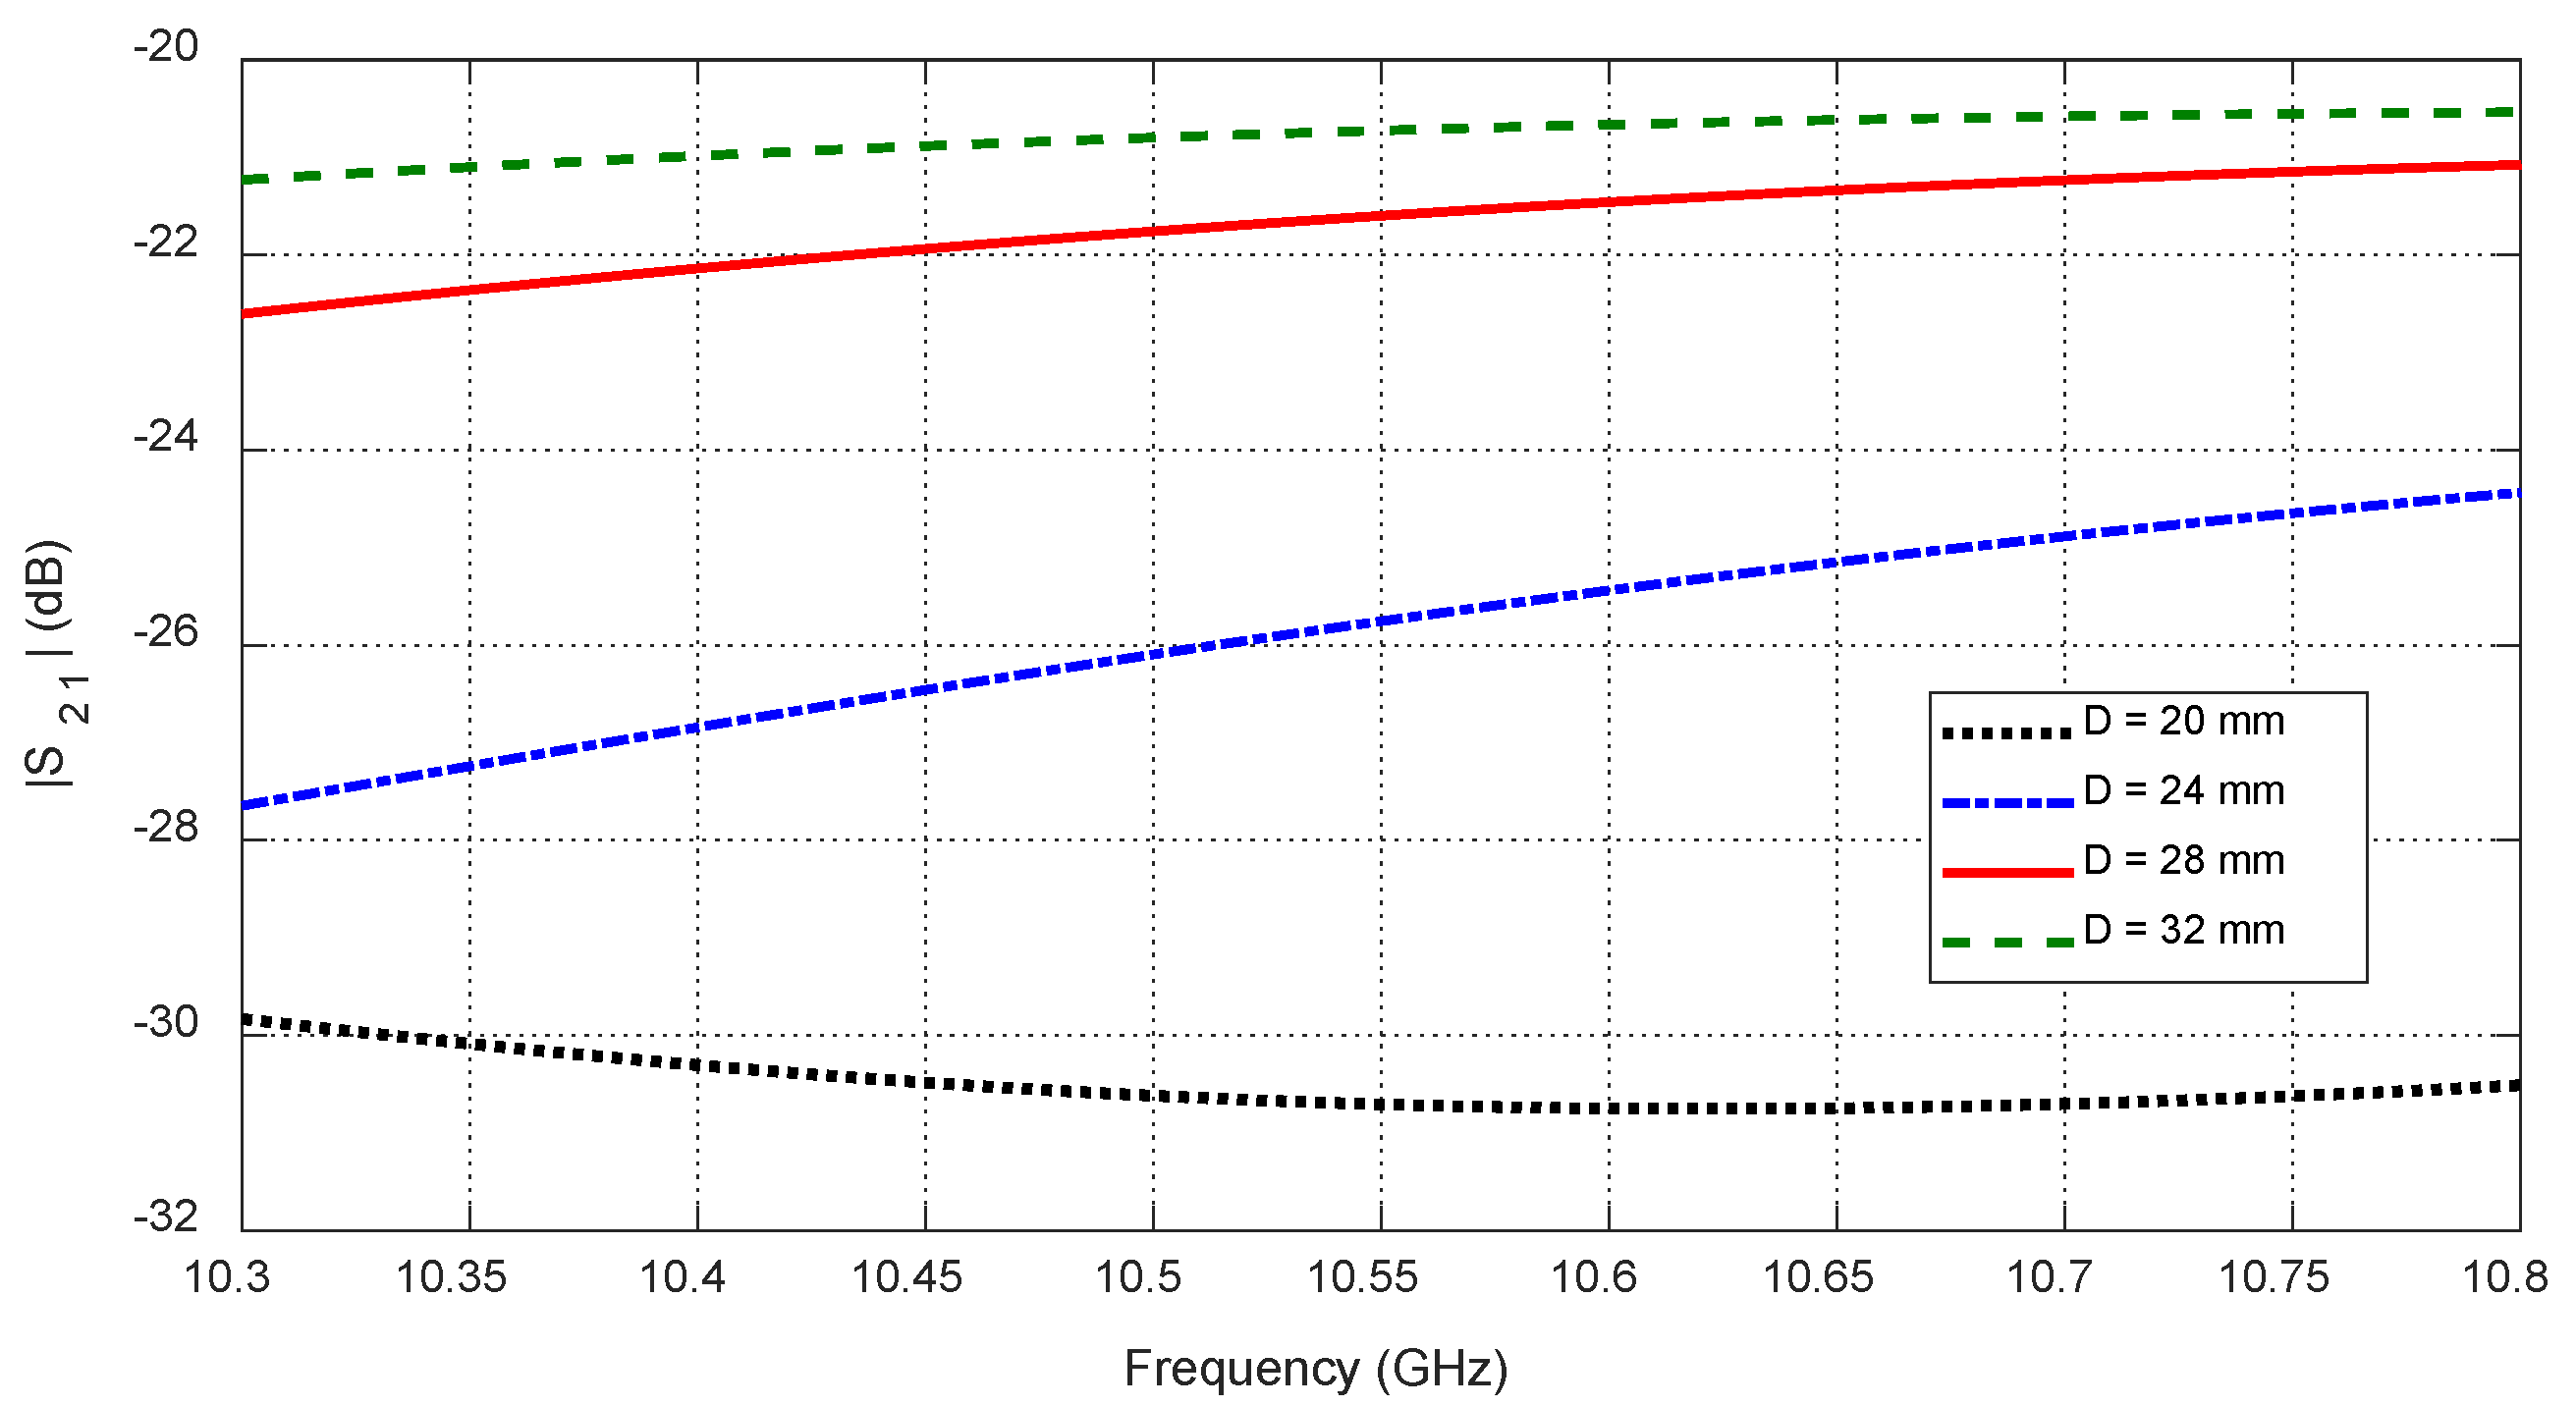
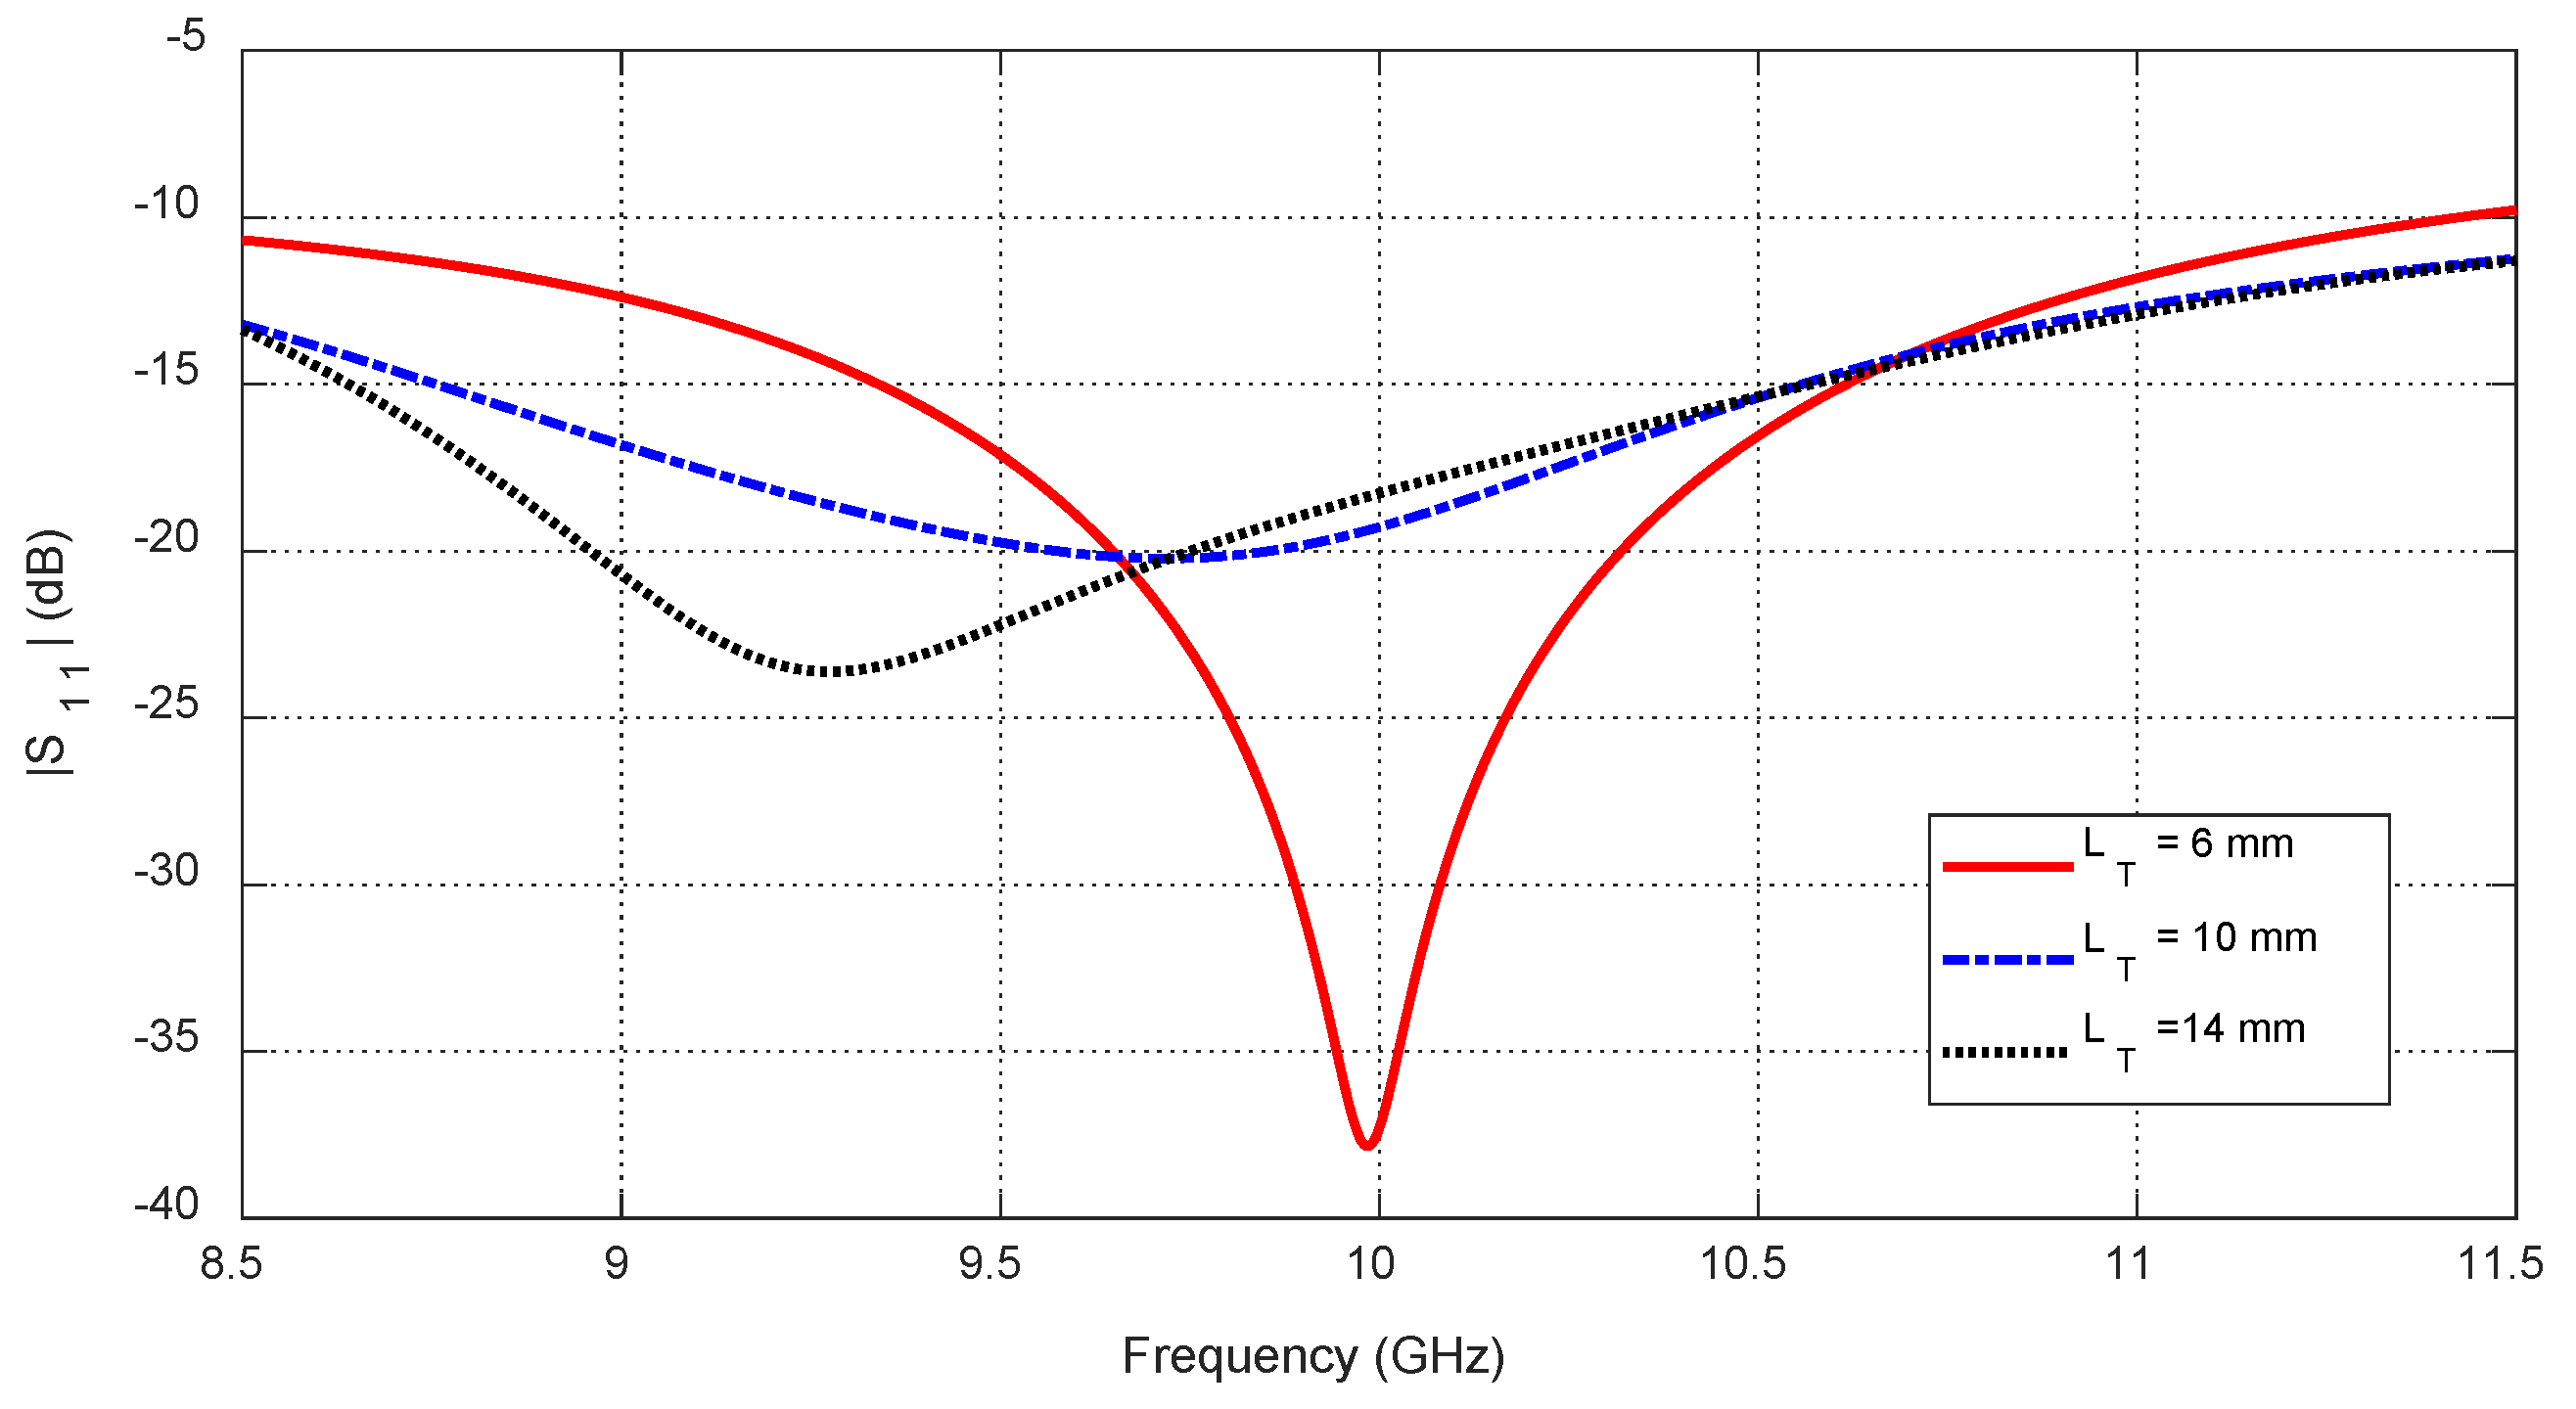
Figure 32.
Variation in the mutual scattering parameter with the frequency for different values of the depth, , at which a spheroidal tumor of length is embedded below the skin surface at the angular position .
Figure 32.
Variation in the mutual scattering parameter with the frequency for different values of the depth, , at which a spheroidal tumor of length is embedded below the skin surface at the angular position .
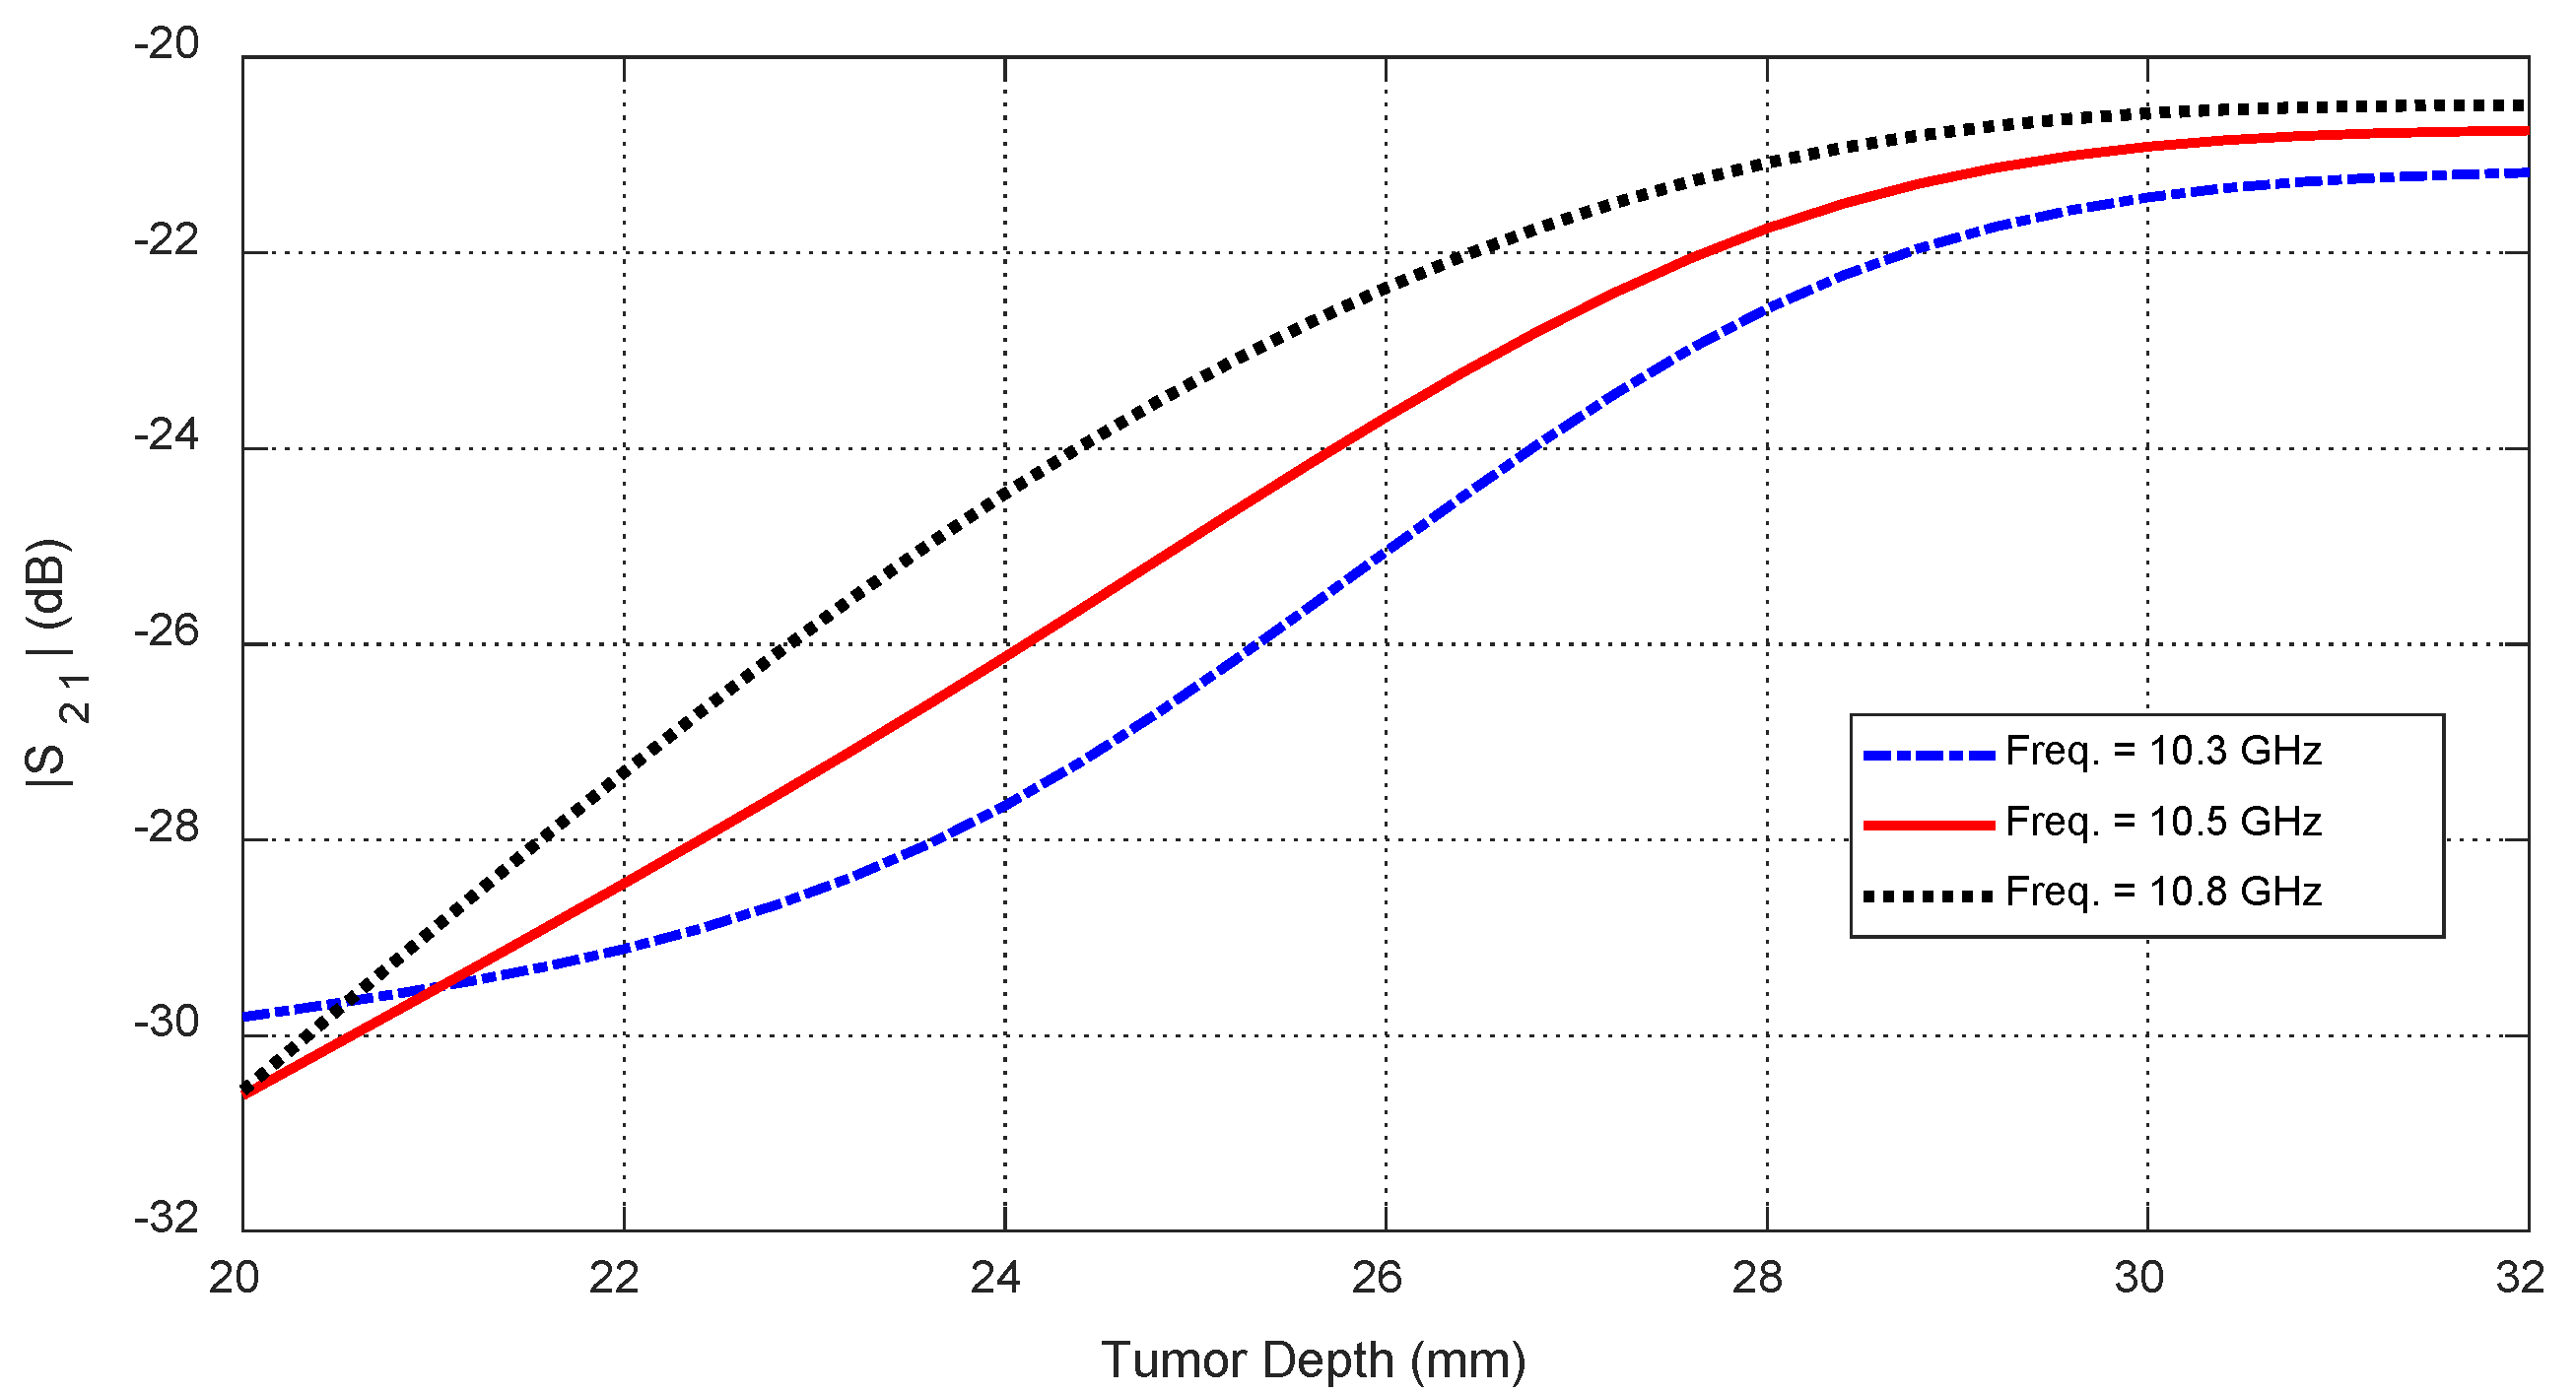
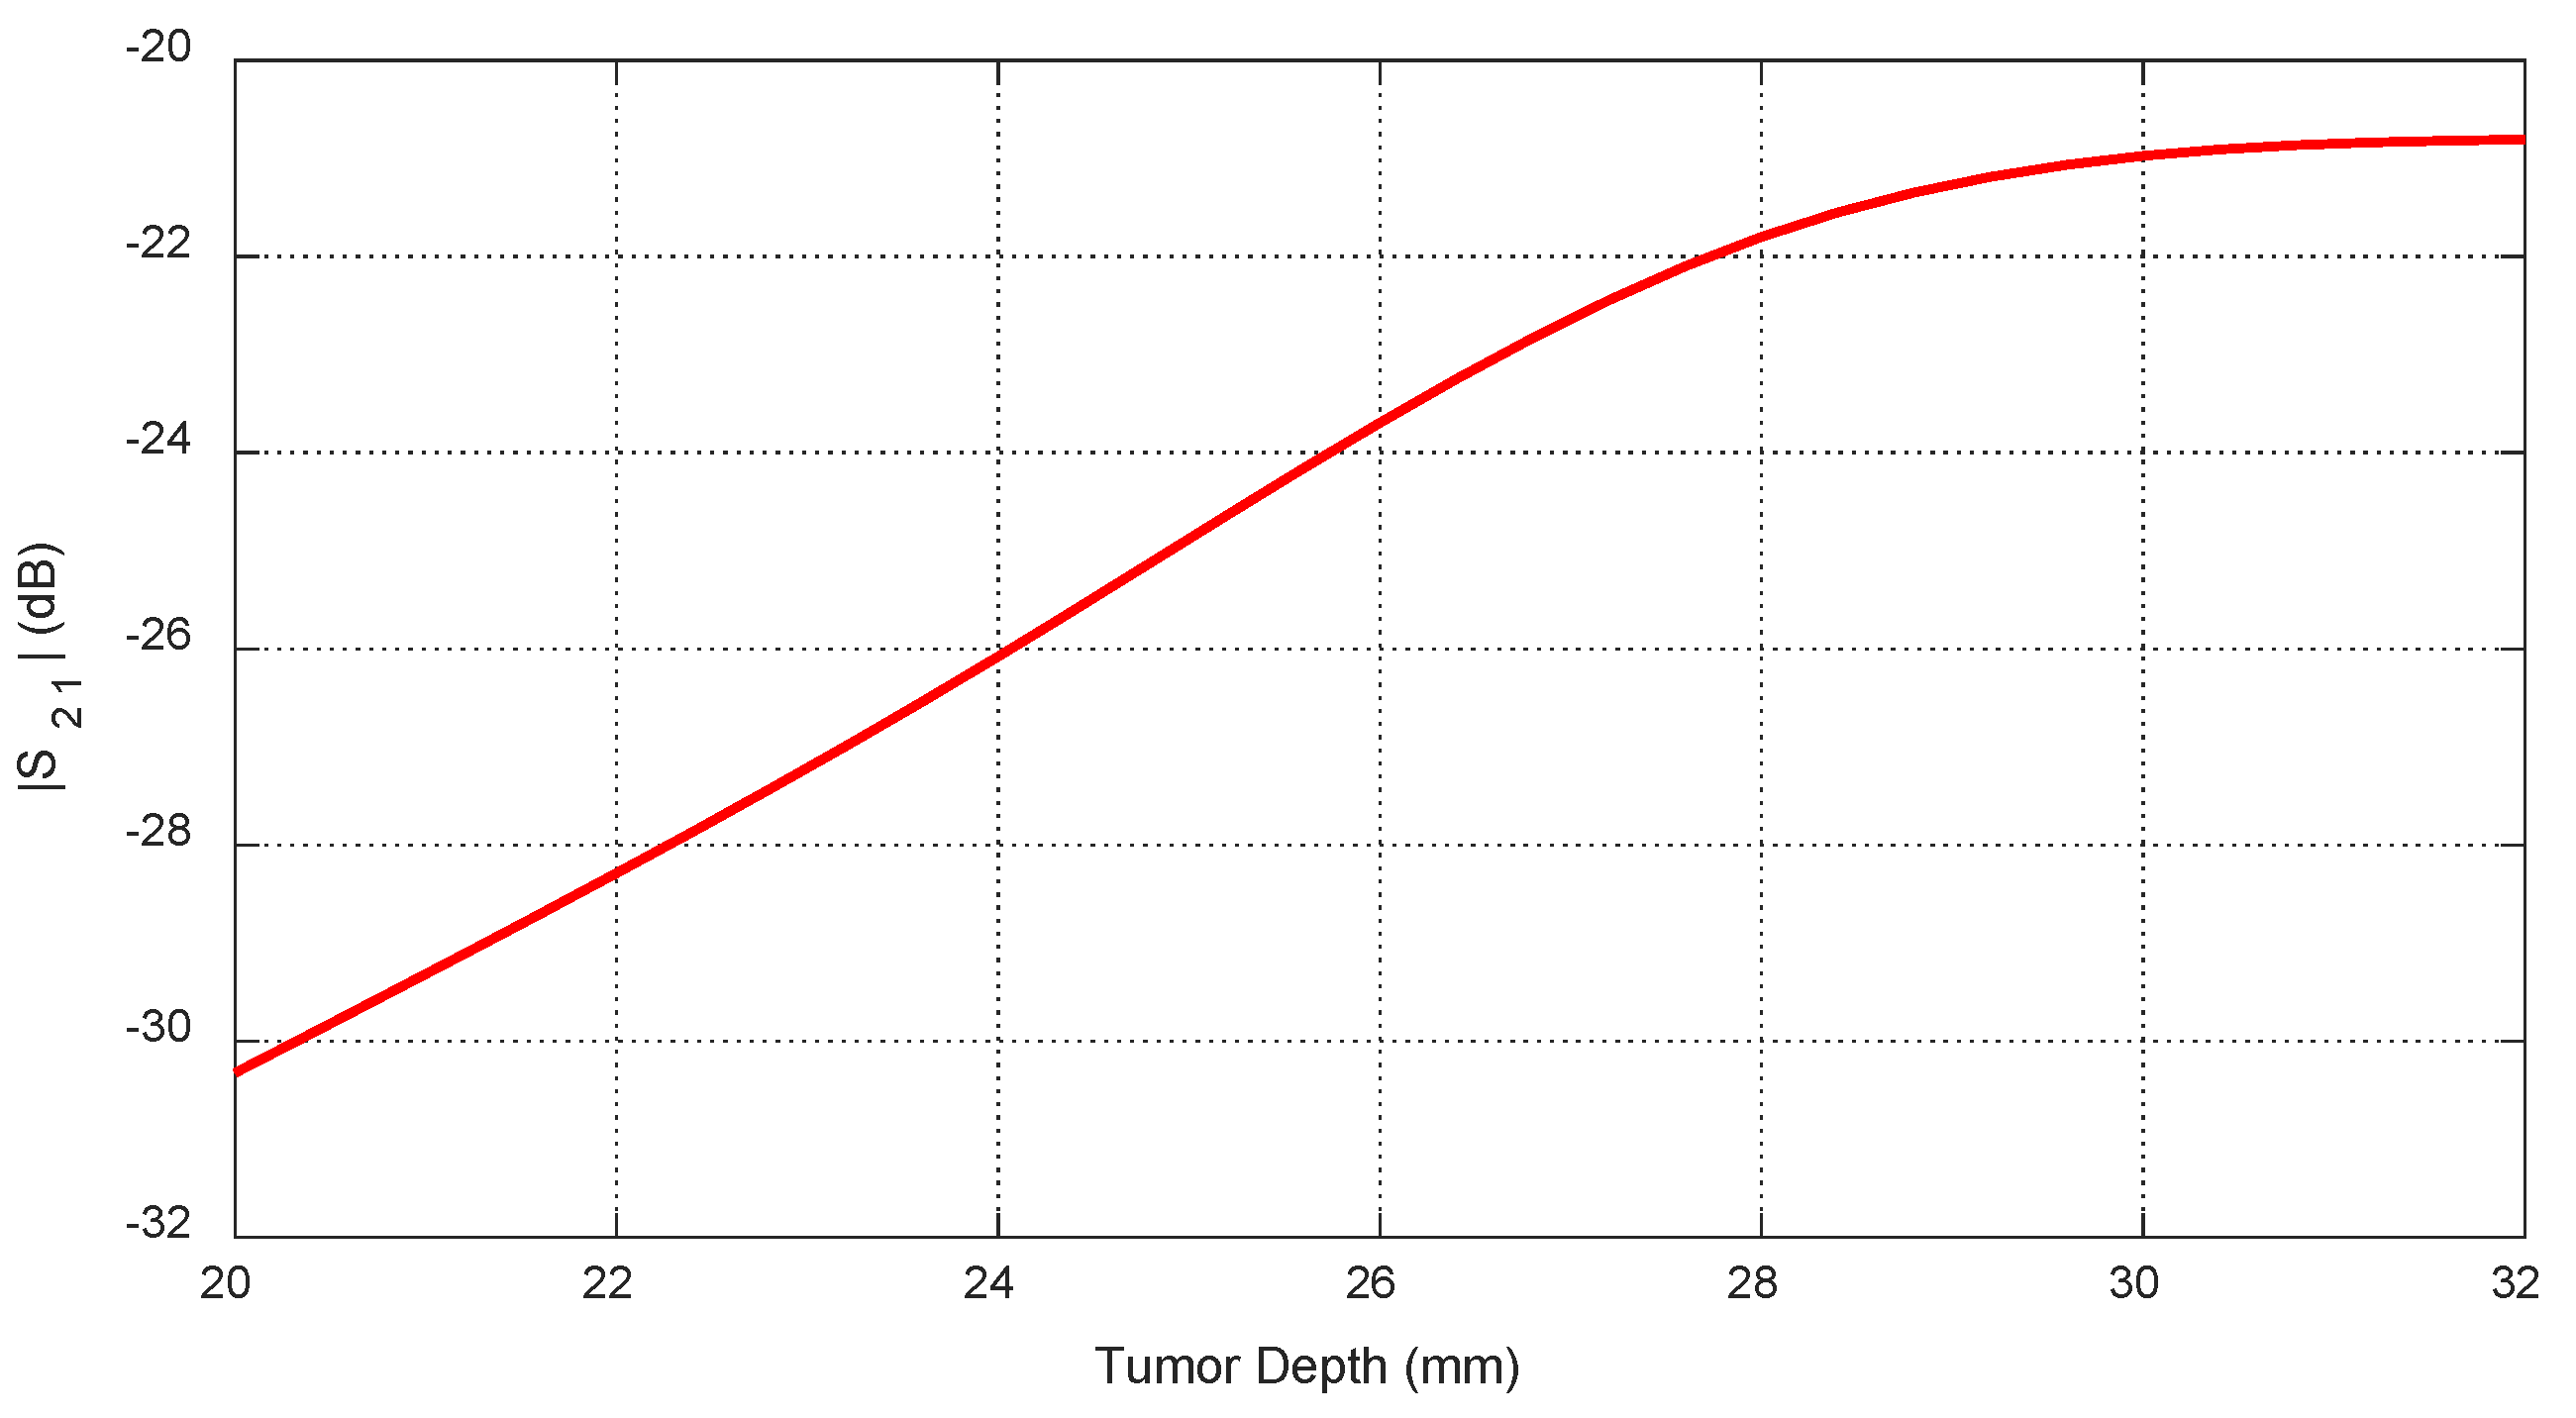
Figure 33.
Dependence of the mutual scattering parameter on the depth below the skin surface at which an ellipsoidal tumor of major length is embedded at the angular position .
Figure 33.
Dependence of the mutual scattering parameter on the depth below the skin surface at which an ellipsoidal tumor of major length is embedded at the angular position .
Figure 34.
Dependence of , averaged over the frequency range 10–11 GHz, on the depth, , beneath the skin surface, where a spheroidal tumor of length is embedded at an angular position .
Figure 34.
Dependence of , averaged over the frequency range 10–11 GHz, on the depth, , beneath the skin surface, where a spheroidal tumor of length is embedded at an angular position .
Figure 35.
The frequency responses of for different values of the major length () of an ellipsoidal tumor embedded at a depth of beneath the skin surface of a hemispherical breast model at the angular position .
Figure 35.
The frequency responses of for different values of the major length () of an ellipsoidal tumor embedded at a depth of beneath the skin surface of a hemispherical breast model at the angular position .
Figure 36.
Variation in the resonant frequencies corresponding to the minima of the self S-parameters , , and with varying the major length () of an ellipsoidal tumor embedded at a depth of beneath the skin surface of a hemispherical breast model at the angular positions , , and , respectively.
Figure 36.
Variation in the resonant frequencies corresponding to the minima of the self S-parameters , , and with varying the major length () of an ellipsoidal tumor embedded at a depth of beneath the skin surface of a hemispherical breast model at the angular positions , , and , respectively.
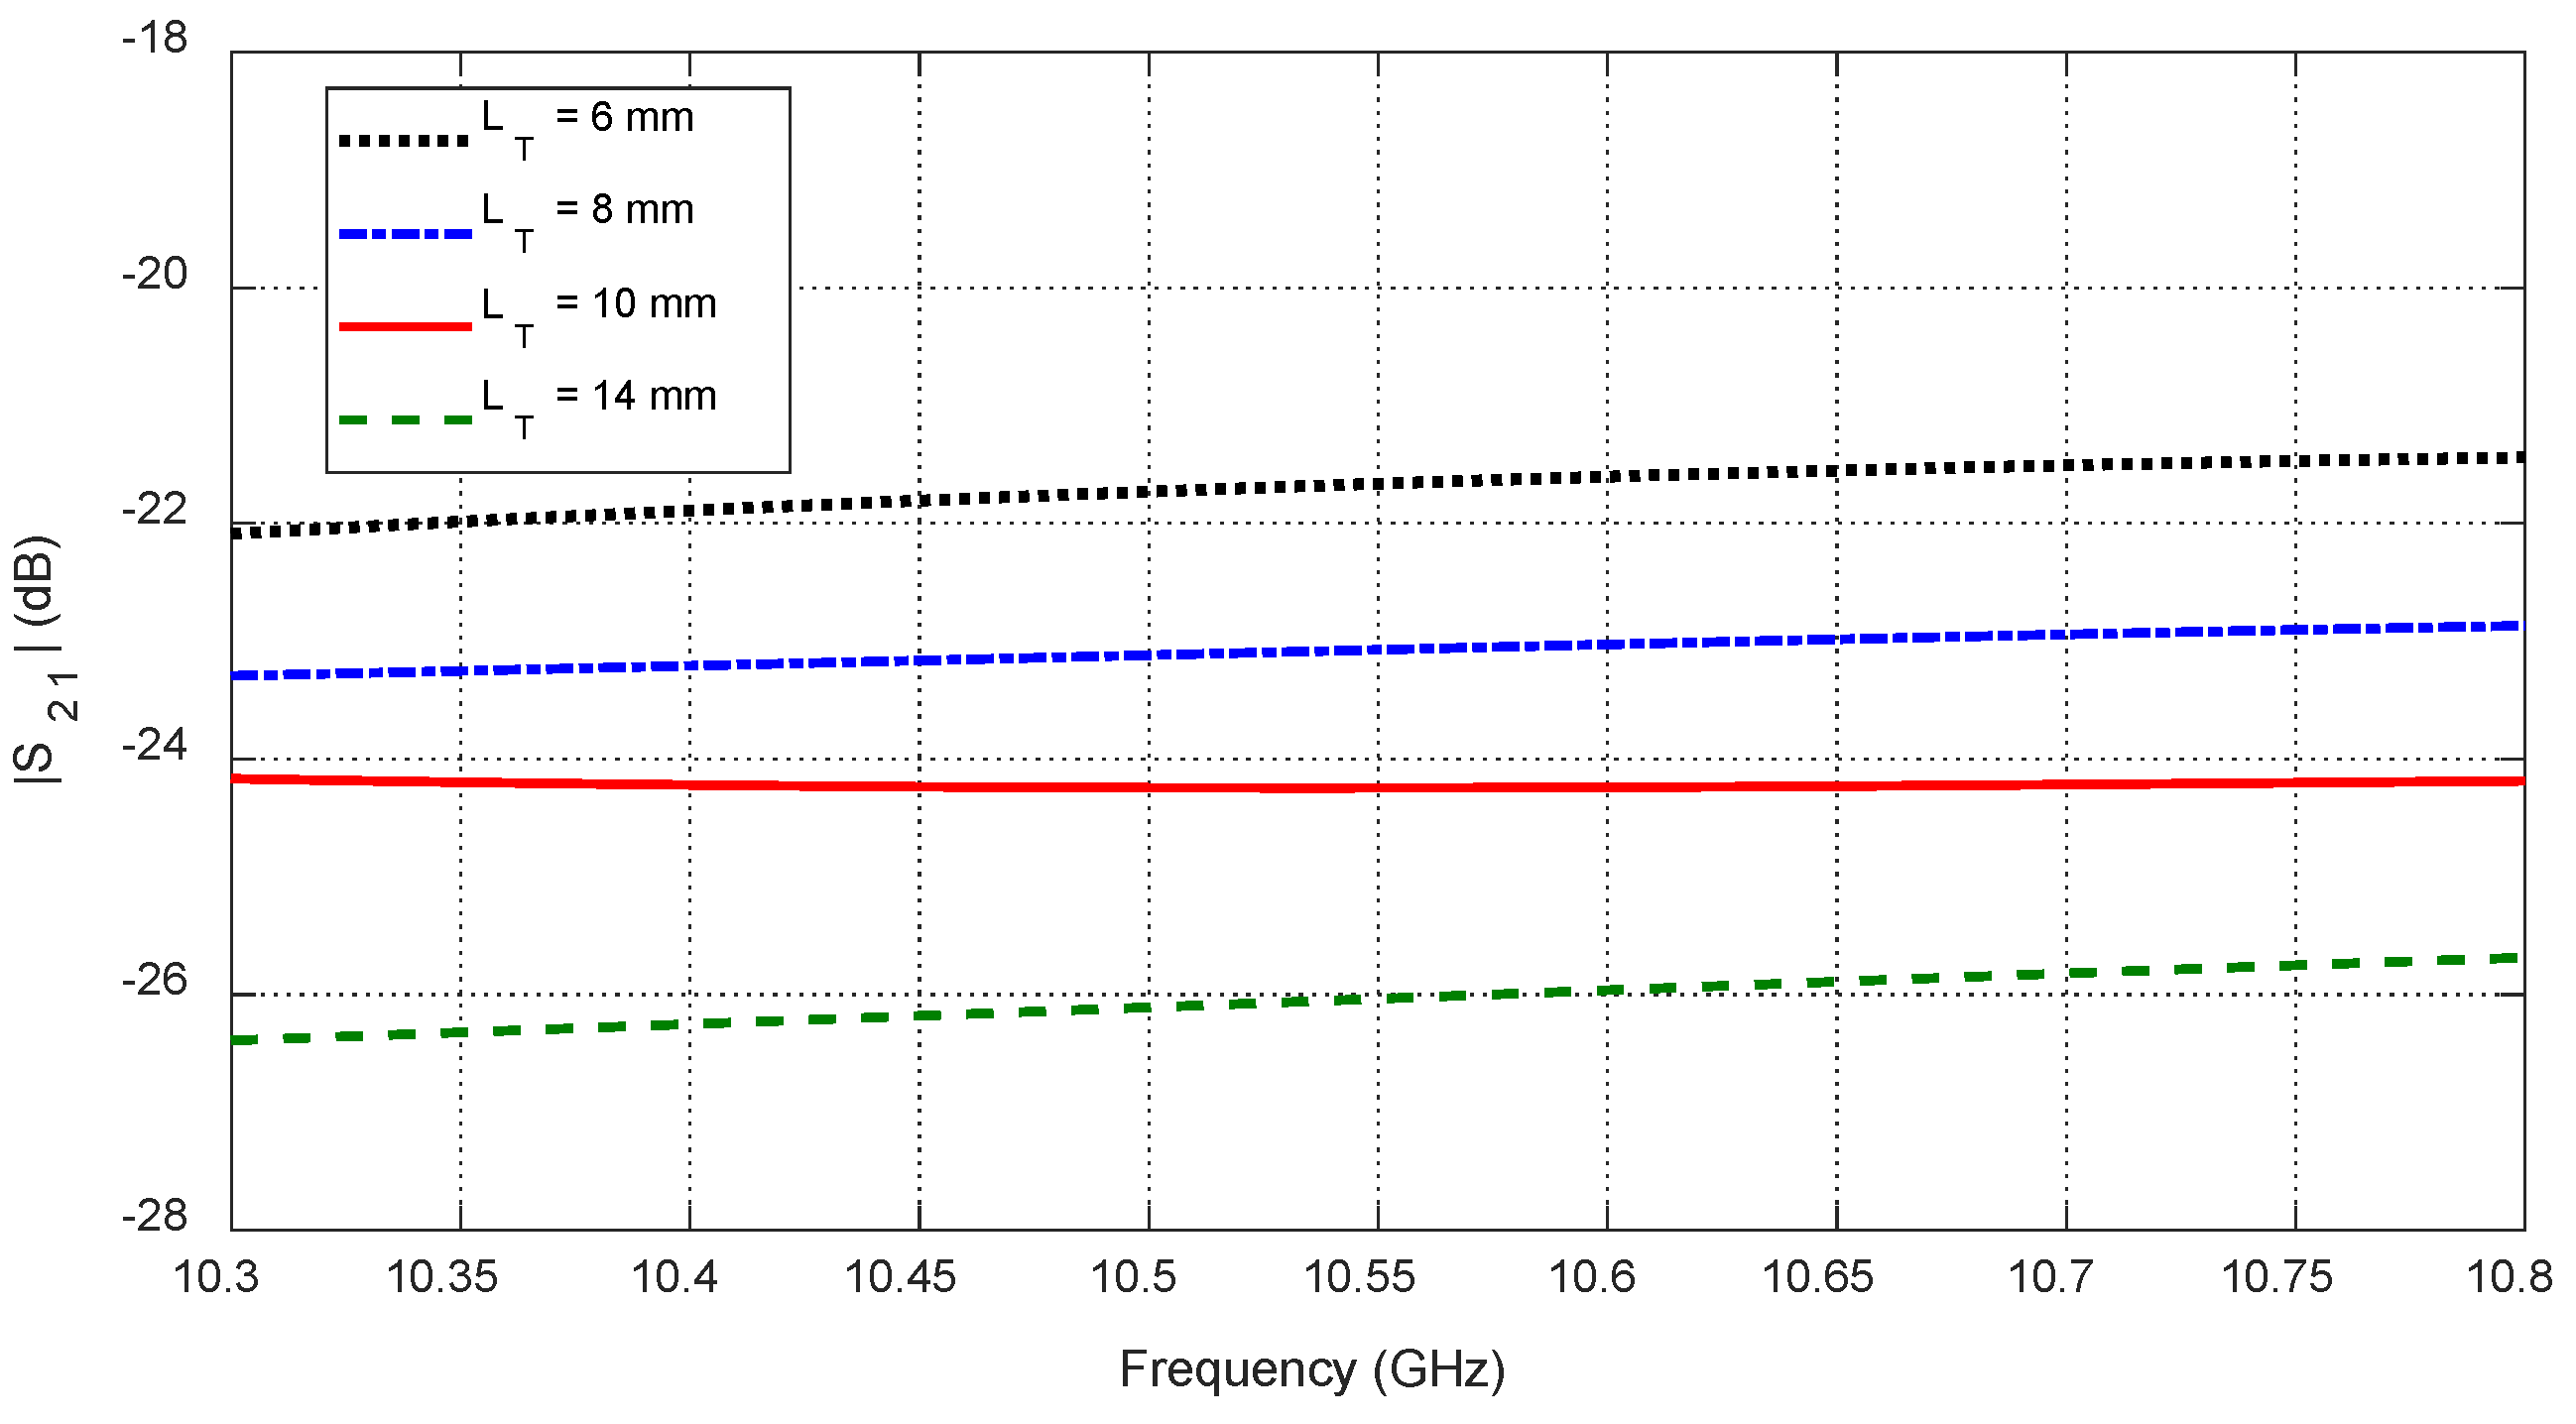
Figure 37.
Variation in the mutual scattering parameter with the frequency for different values of a spheroidal tumor length, , when embedded at the angular position and depth below the skin surface.
Figure 37.
Variation in the mutual scattering parameter with the frequency for different values of a spheroidal tumor length, , when embedded at the angular position and depth below the skin surface.
Figure 38.
Dependence of the mutual S-parameter on the major length, , of an ellipsoidal tumor embedded at the angular position and depth beneath the skin surface.
Figure 38.
Dependence of the mutual S-parameter on the major length, , of an ellipsoidal tumor embedded at the angular position and depth beneath the skin surface.
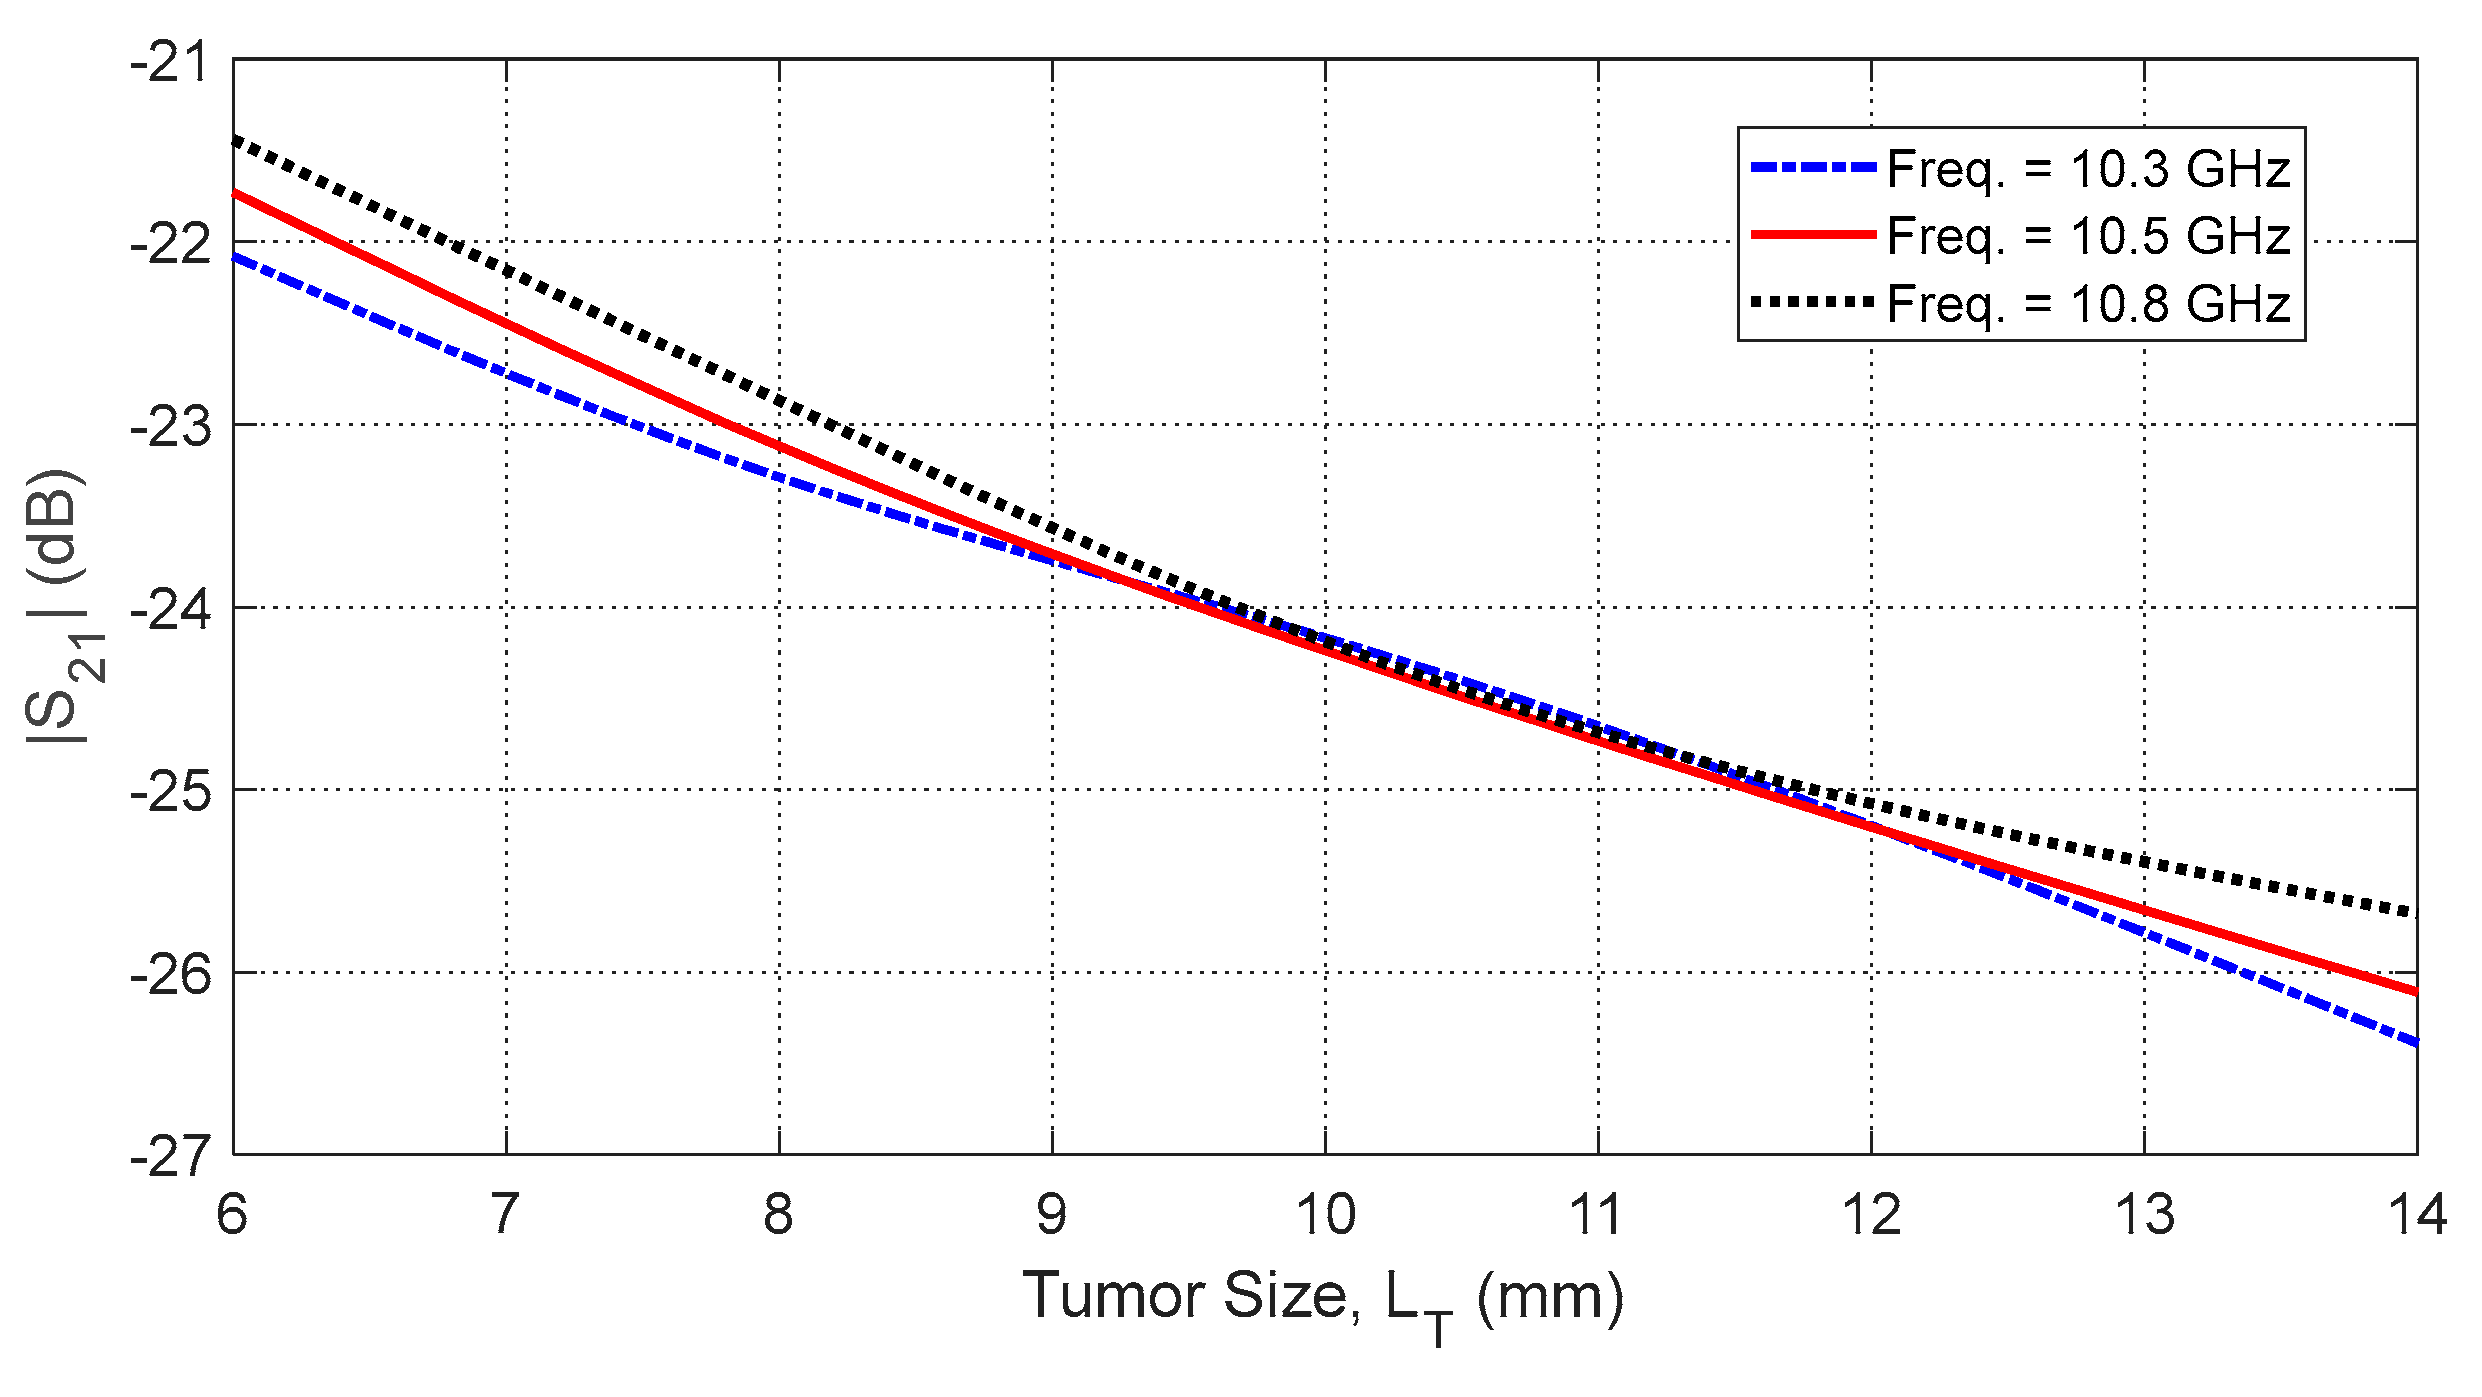
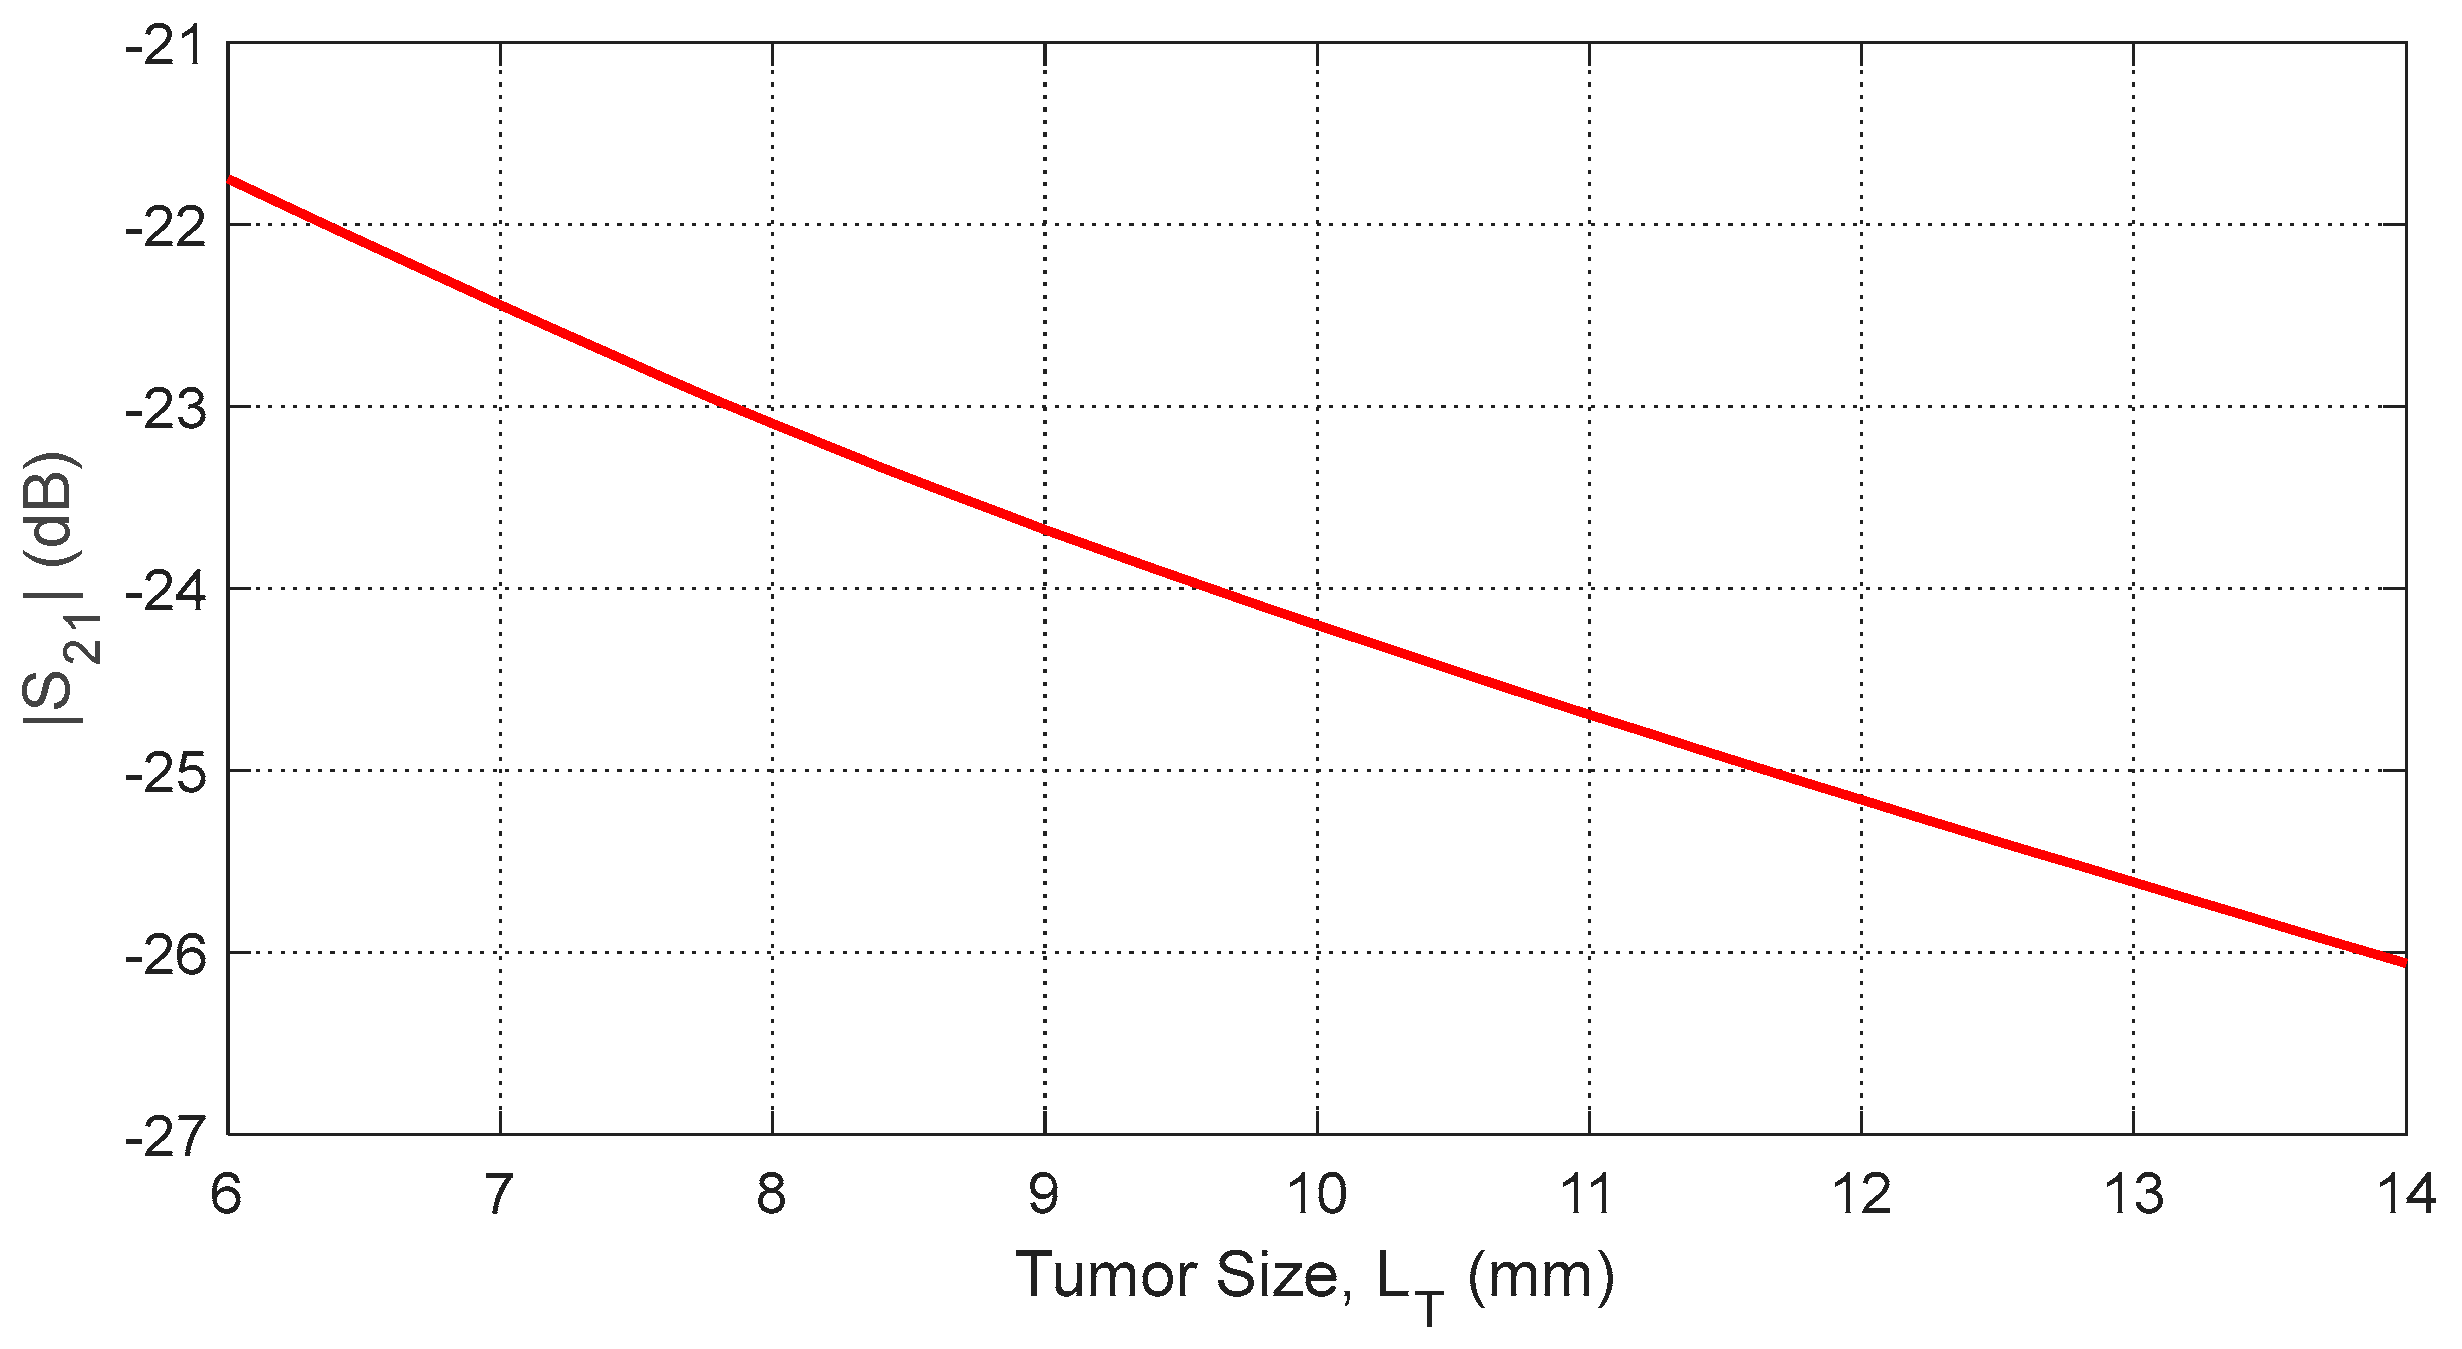
Figure 39.
Dependence of , averaged over the frequency range 10–11 GHz, on the length, , of a spheroidal tumor embedded at angular position and depth beneath the skin surface.
Figure 39.
Dependence of , averaged over the frequency range 10–11 GHz, on the length, , of a spheroidal tumor embedded at angular position and depth beneath the skin surface.
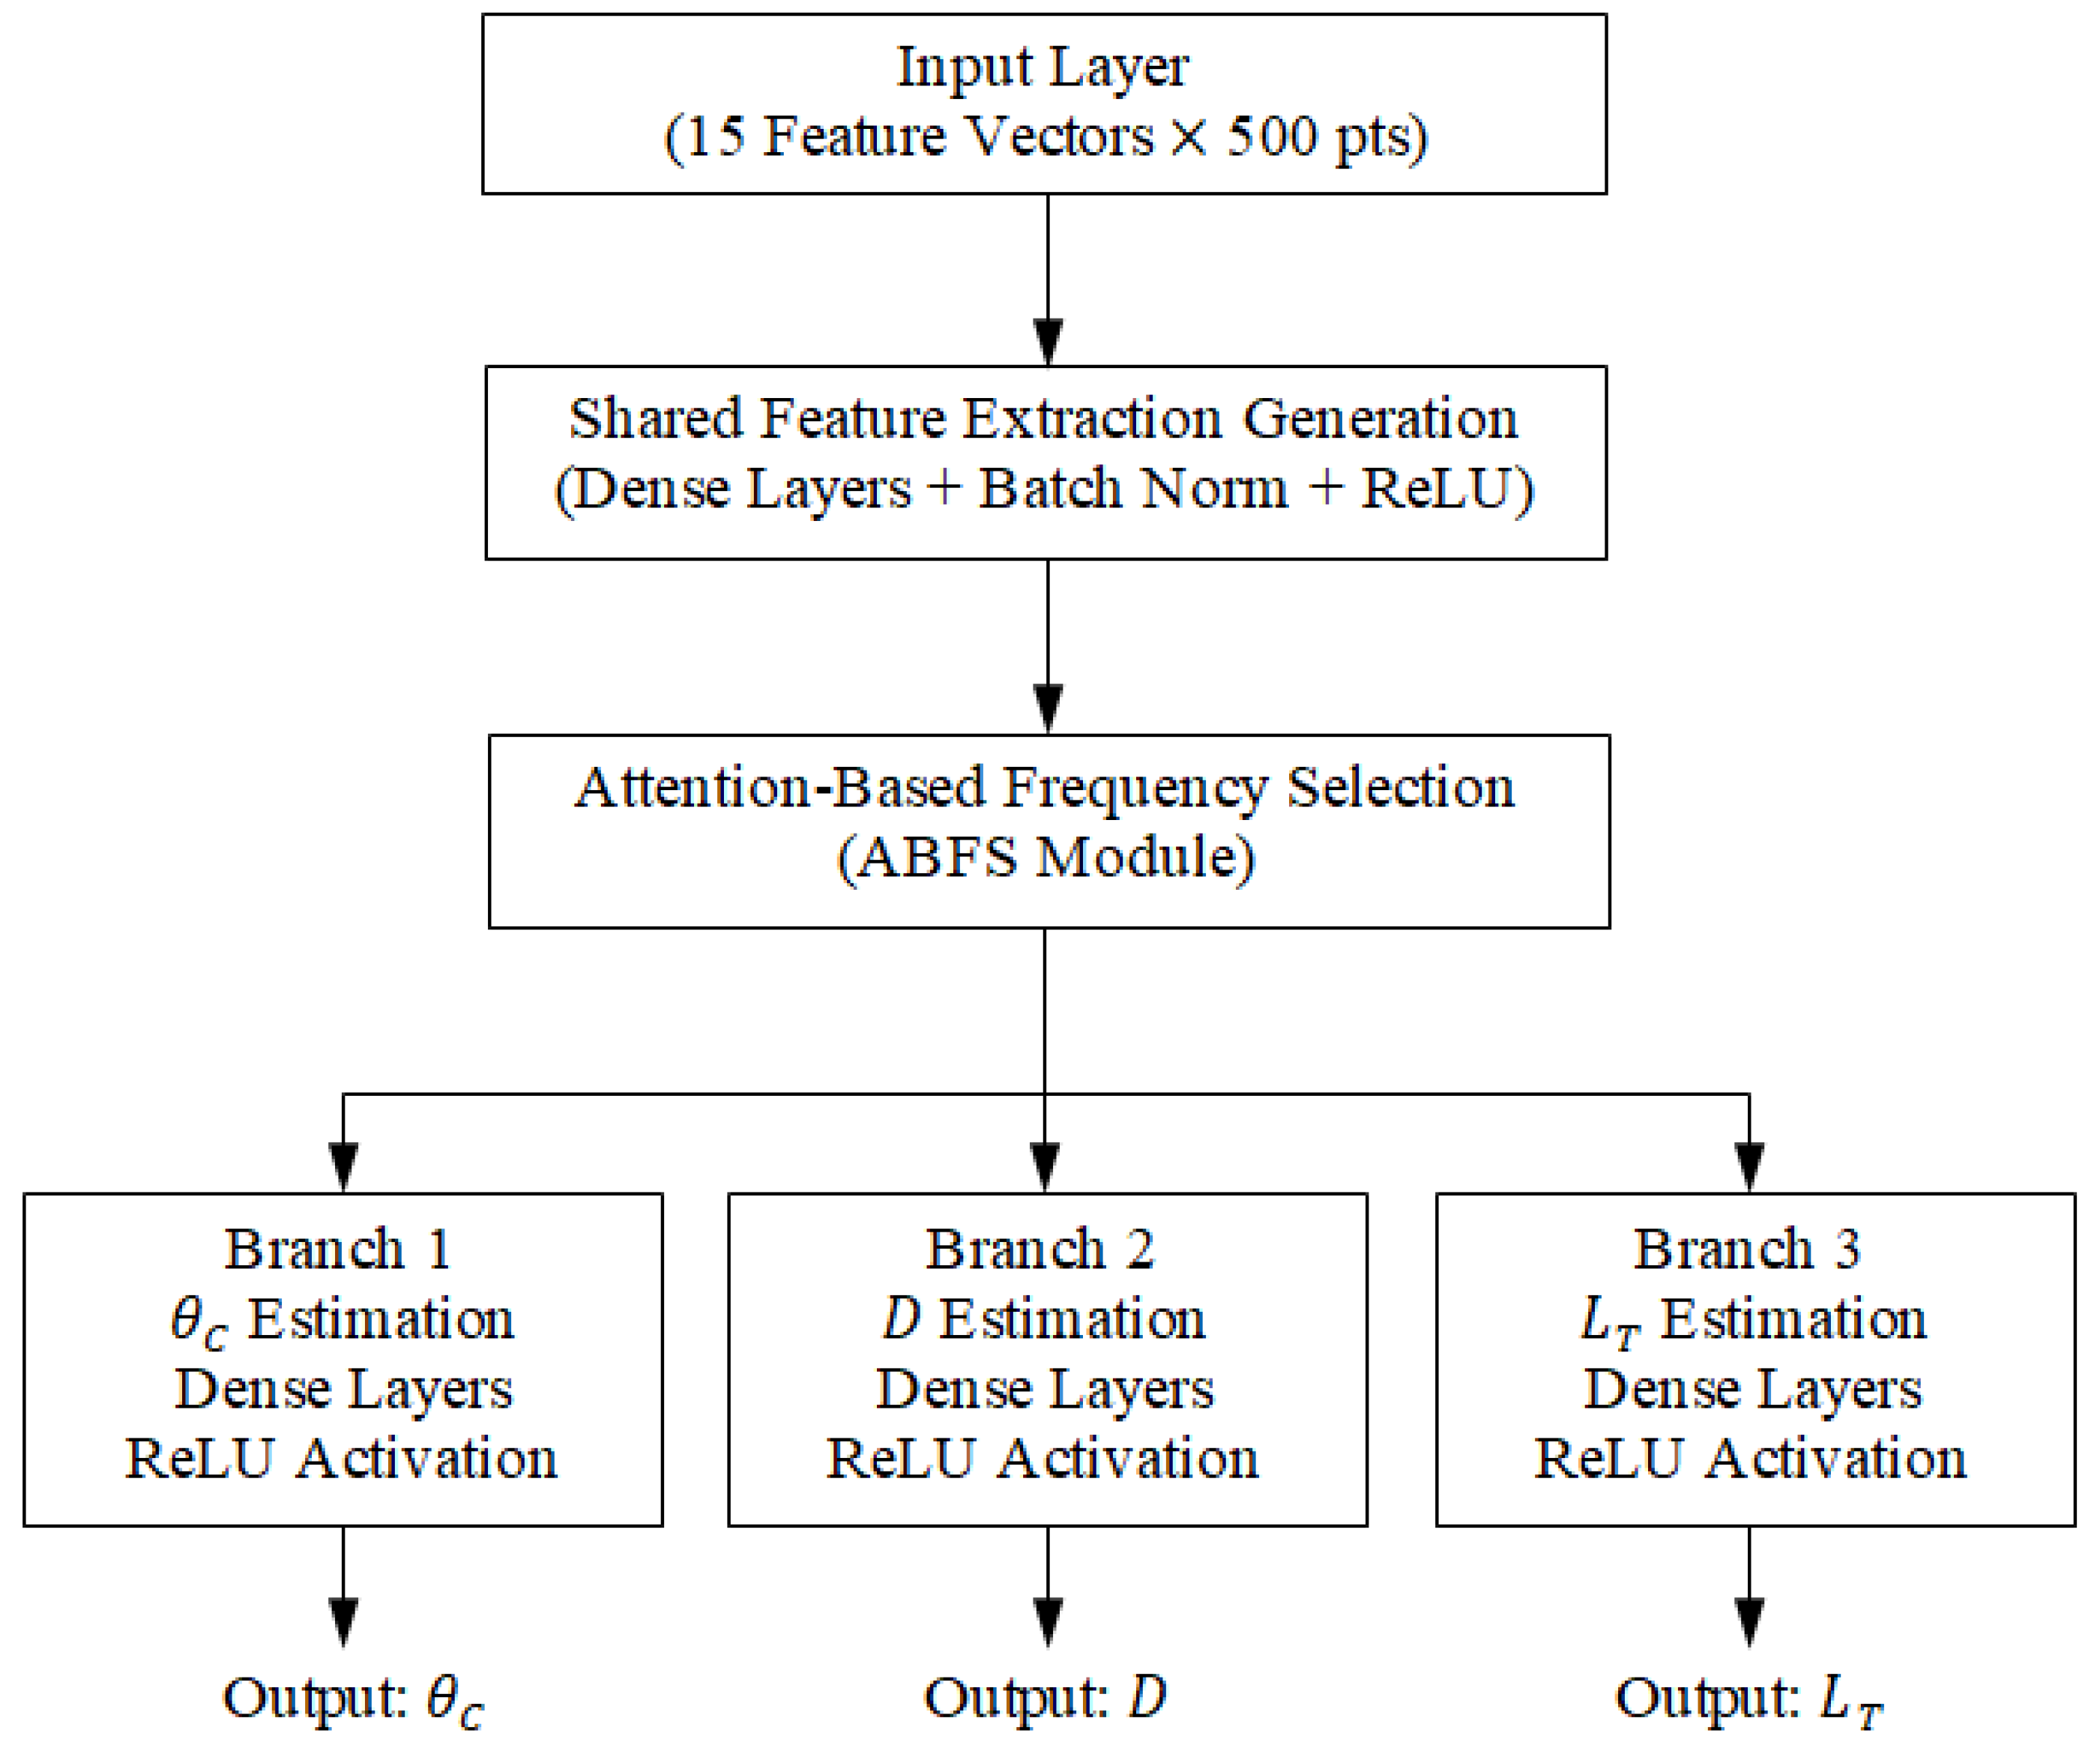
Figure 40.
Schematic diagram of the proposed multi-branch deep neural network architecture for breast tumor parameter estimation.
Figure 40.
Schematic diagram of the proposed multi-branch deep neural network architecture for breast tumor parameter estimation.
Figure 41.
Experimental setup for measuring the electric properties of breast phantom materials.
Figure 41.
Experimental setup for measuring the electric properties of breast phantom materials.
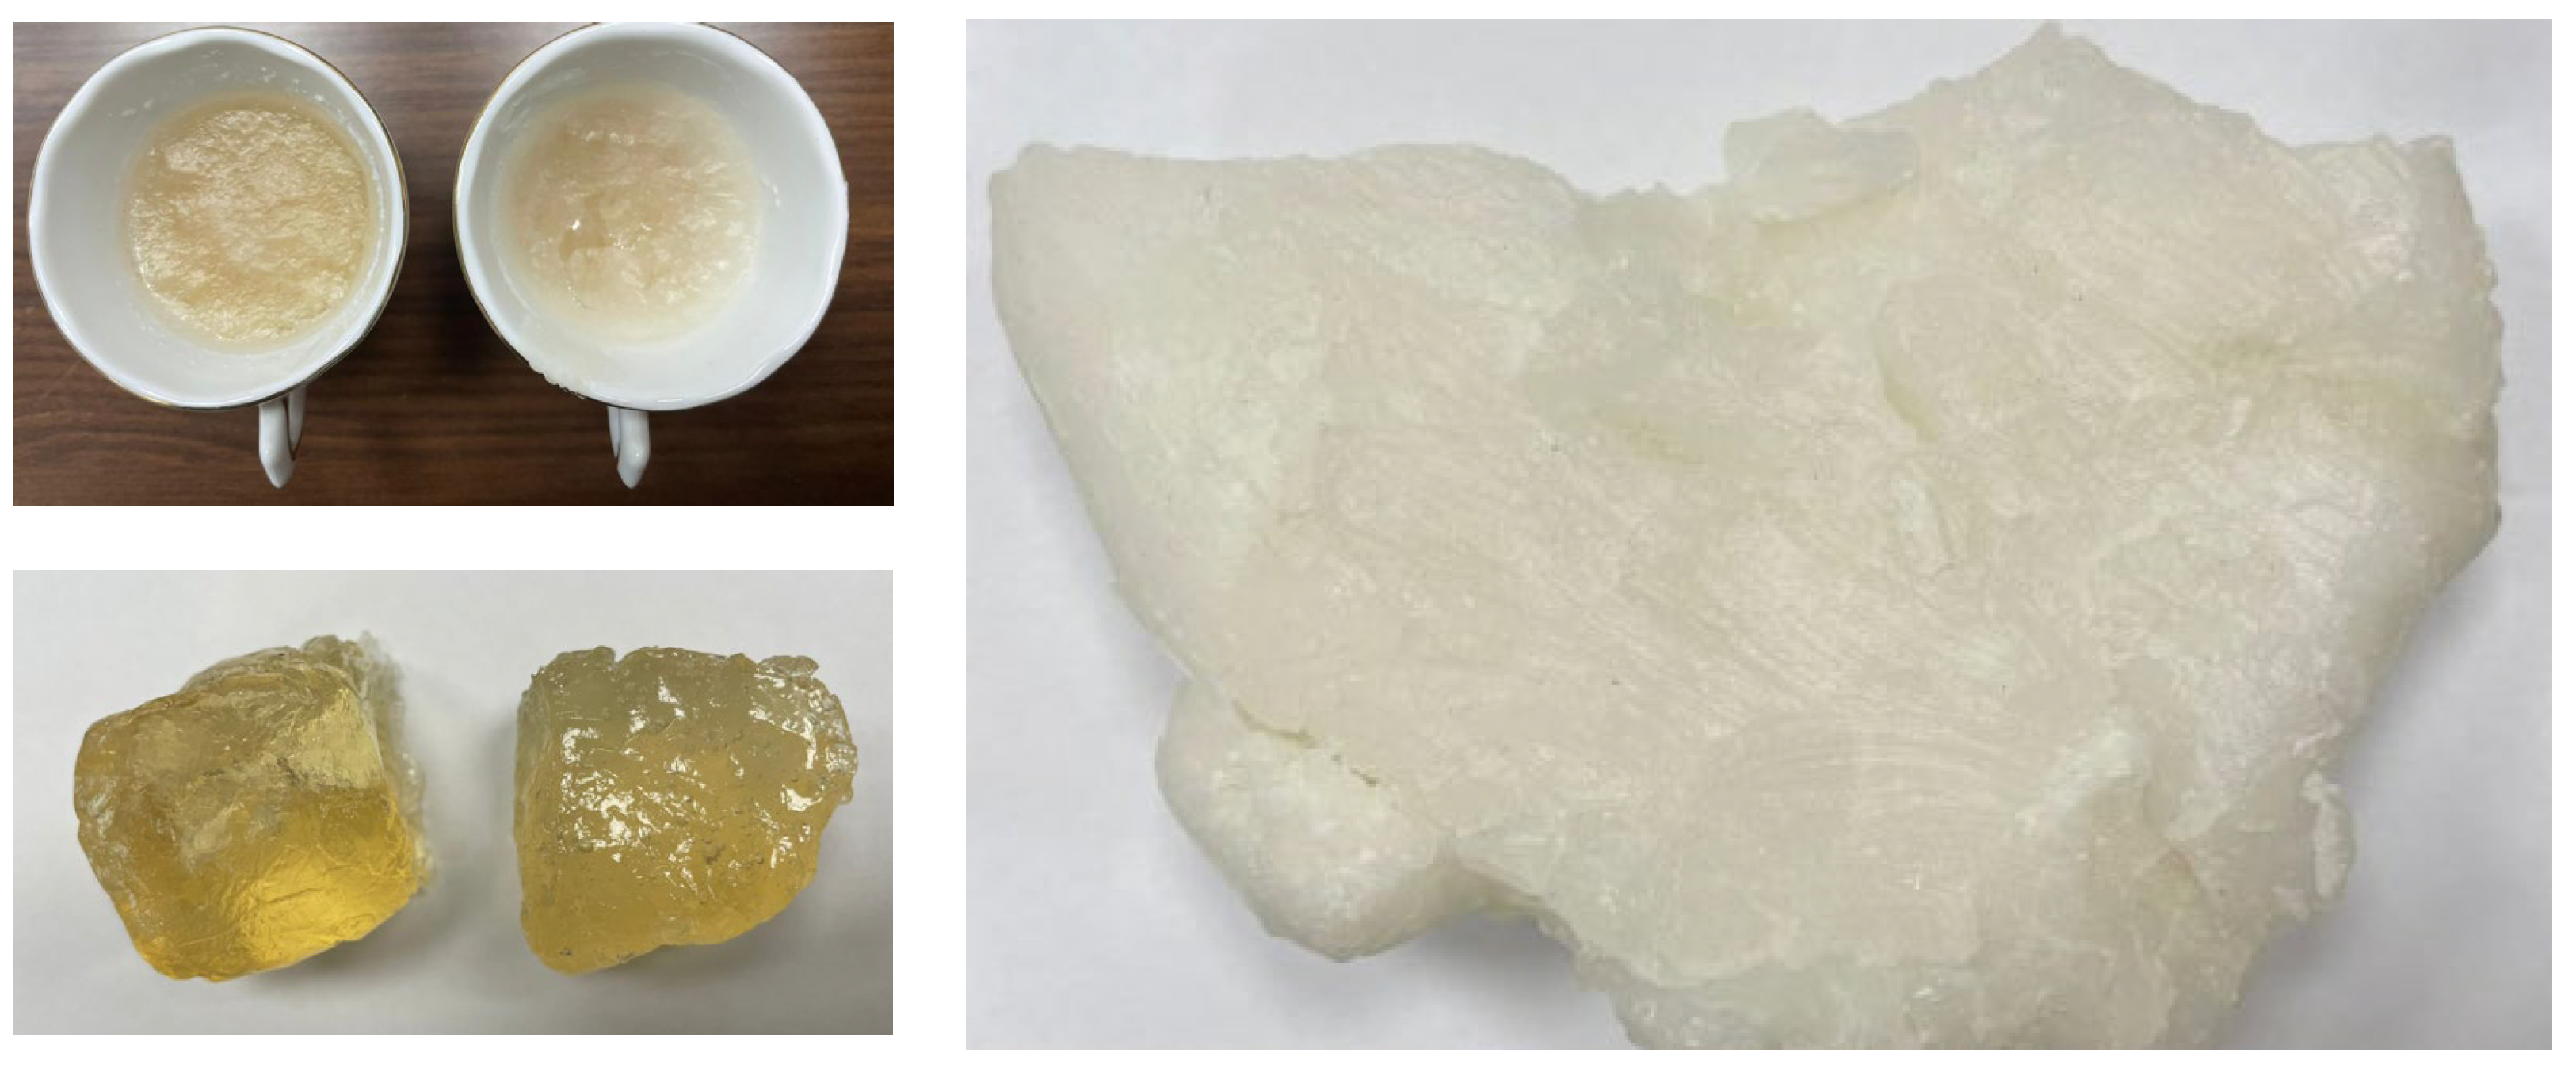
Figure 42.
Samples of fabricated materials for skin and fatty tissues used in realistic breast phantoms.
Figure 42.
Samples of fabricated materials for skin and fatty tissues used in realistic breast phantoms.
Table 1.
Optimum dimensions of the antenna proposed for breast cancer detection.
Table 1.
Optimum dimensions of the antenna proposed for breast cancer detection.
| Parameter | | | | | | | | |
| Value (mm) | | | | | | | | |
Table 2.
Comparison of the proposed octagram ring antenna with representative flexible antennas for biomedical sensing, highlighting its compact size and broad operating bandwidth.
Table 2.
Comparison of the proposed octagram ring antenna with representative flexible antennas for biomedical sensing, highlighting its compact size and broad operating bandwidth.
| Reference | Geometry | Substrate | Freq. Band (GHz) | Max SAR (W/kg) | Dimensions (mm) |
|---|
| [23] | Circular Ring | PDMS | 2.3–3.1 | 1.42 | 40 × 35 × 1 |
| [24] | Star-Shaped | Kapton | 2.2–2.9 | 1.65 | 50 × 50 × 1.2 |
| This Work | Octagram Ring + Slots | Rogers RO3003 | 8.3–13.3 | 1.6 | 10 × 10 × 0.25 |
Table 3.
Electric properties of the different tissues of the breast model over the frequency band 8–14 GHz [
25].
Table 3.
Electric properties of the different tissues of the breast model over the frequency band 8–14 GHz [
25].
| Frequency (GHz) | Skin | Breast Fat | Breast Gland |
|---|
| | | | | |
|---|
| | | | | | |
| | | | | | |
| | | | | | |
Table 4.
Electric properties of the cancerous breast tissues over the frequency band 8–14 GHz (deduced from [
26]).
Table 4.
Electric properties of the cancerous breast tissues over the frequency band 8–14 GHz (deduced from [
26]).
| Frequency (GHz) | Cancerous Breast Tissues |
|---|
| |
|---|
| | 12.93 |
| | 23.73 |
| | 34.53 |
Table 5.
Comparison among the characteristics of the antenna proposed in the present work and those of other antennas presented in recent publications.
Table 5.
Comparison among the characteristics of the antenna proposed in the present work and those of other antennas presented in recent publications.
| Placement | Flexibility | Gain (dBi) | Frequency Band (GHz) | ) | Work |
|---|
| On-Body | No | 8 | 3.75–4.25 | | [27] |
| On-Body | Yes | NA | 2.0–8.8 | | [28] |
| Proximity | No | 4.5 | 1.55–1.68 | | [29] |
| On-Body | No | NA | 2.8–3.3, 4.9–6.3 | | [30] |
| On-Body | No | NA | 0.75–4.0 | | [31] |
| On-Body | Yes | 2.2 | 8.3–14.3 | | [Present] |
Table 6.
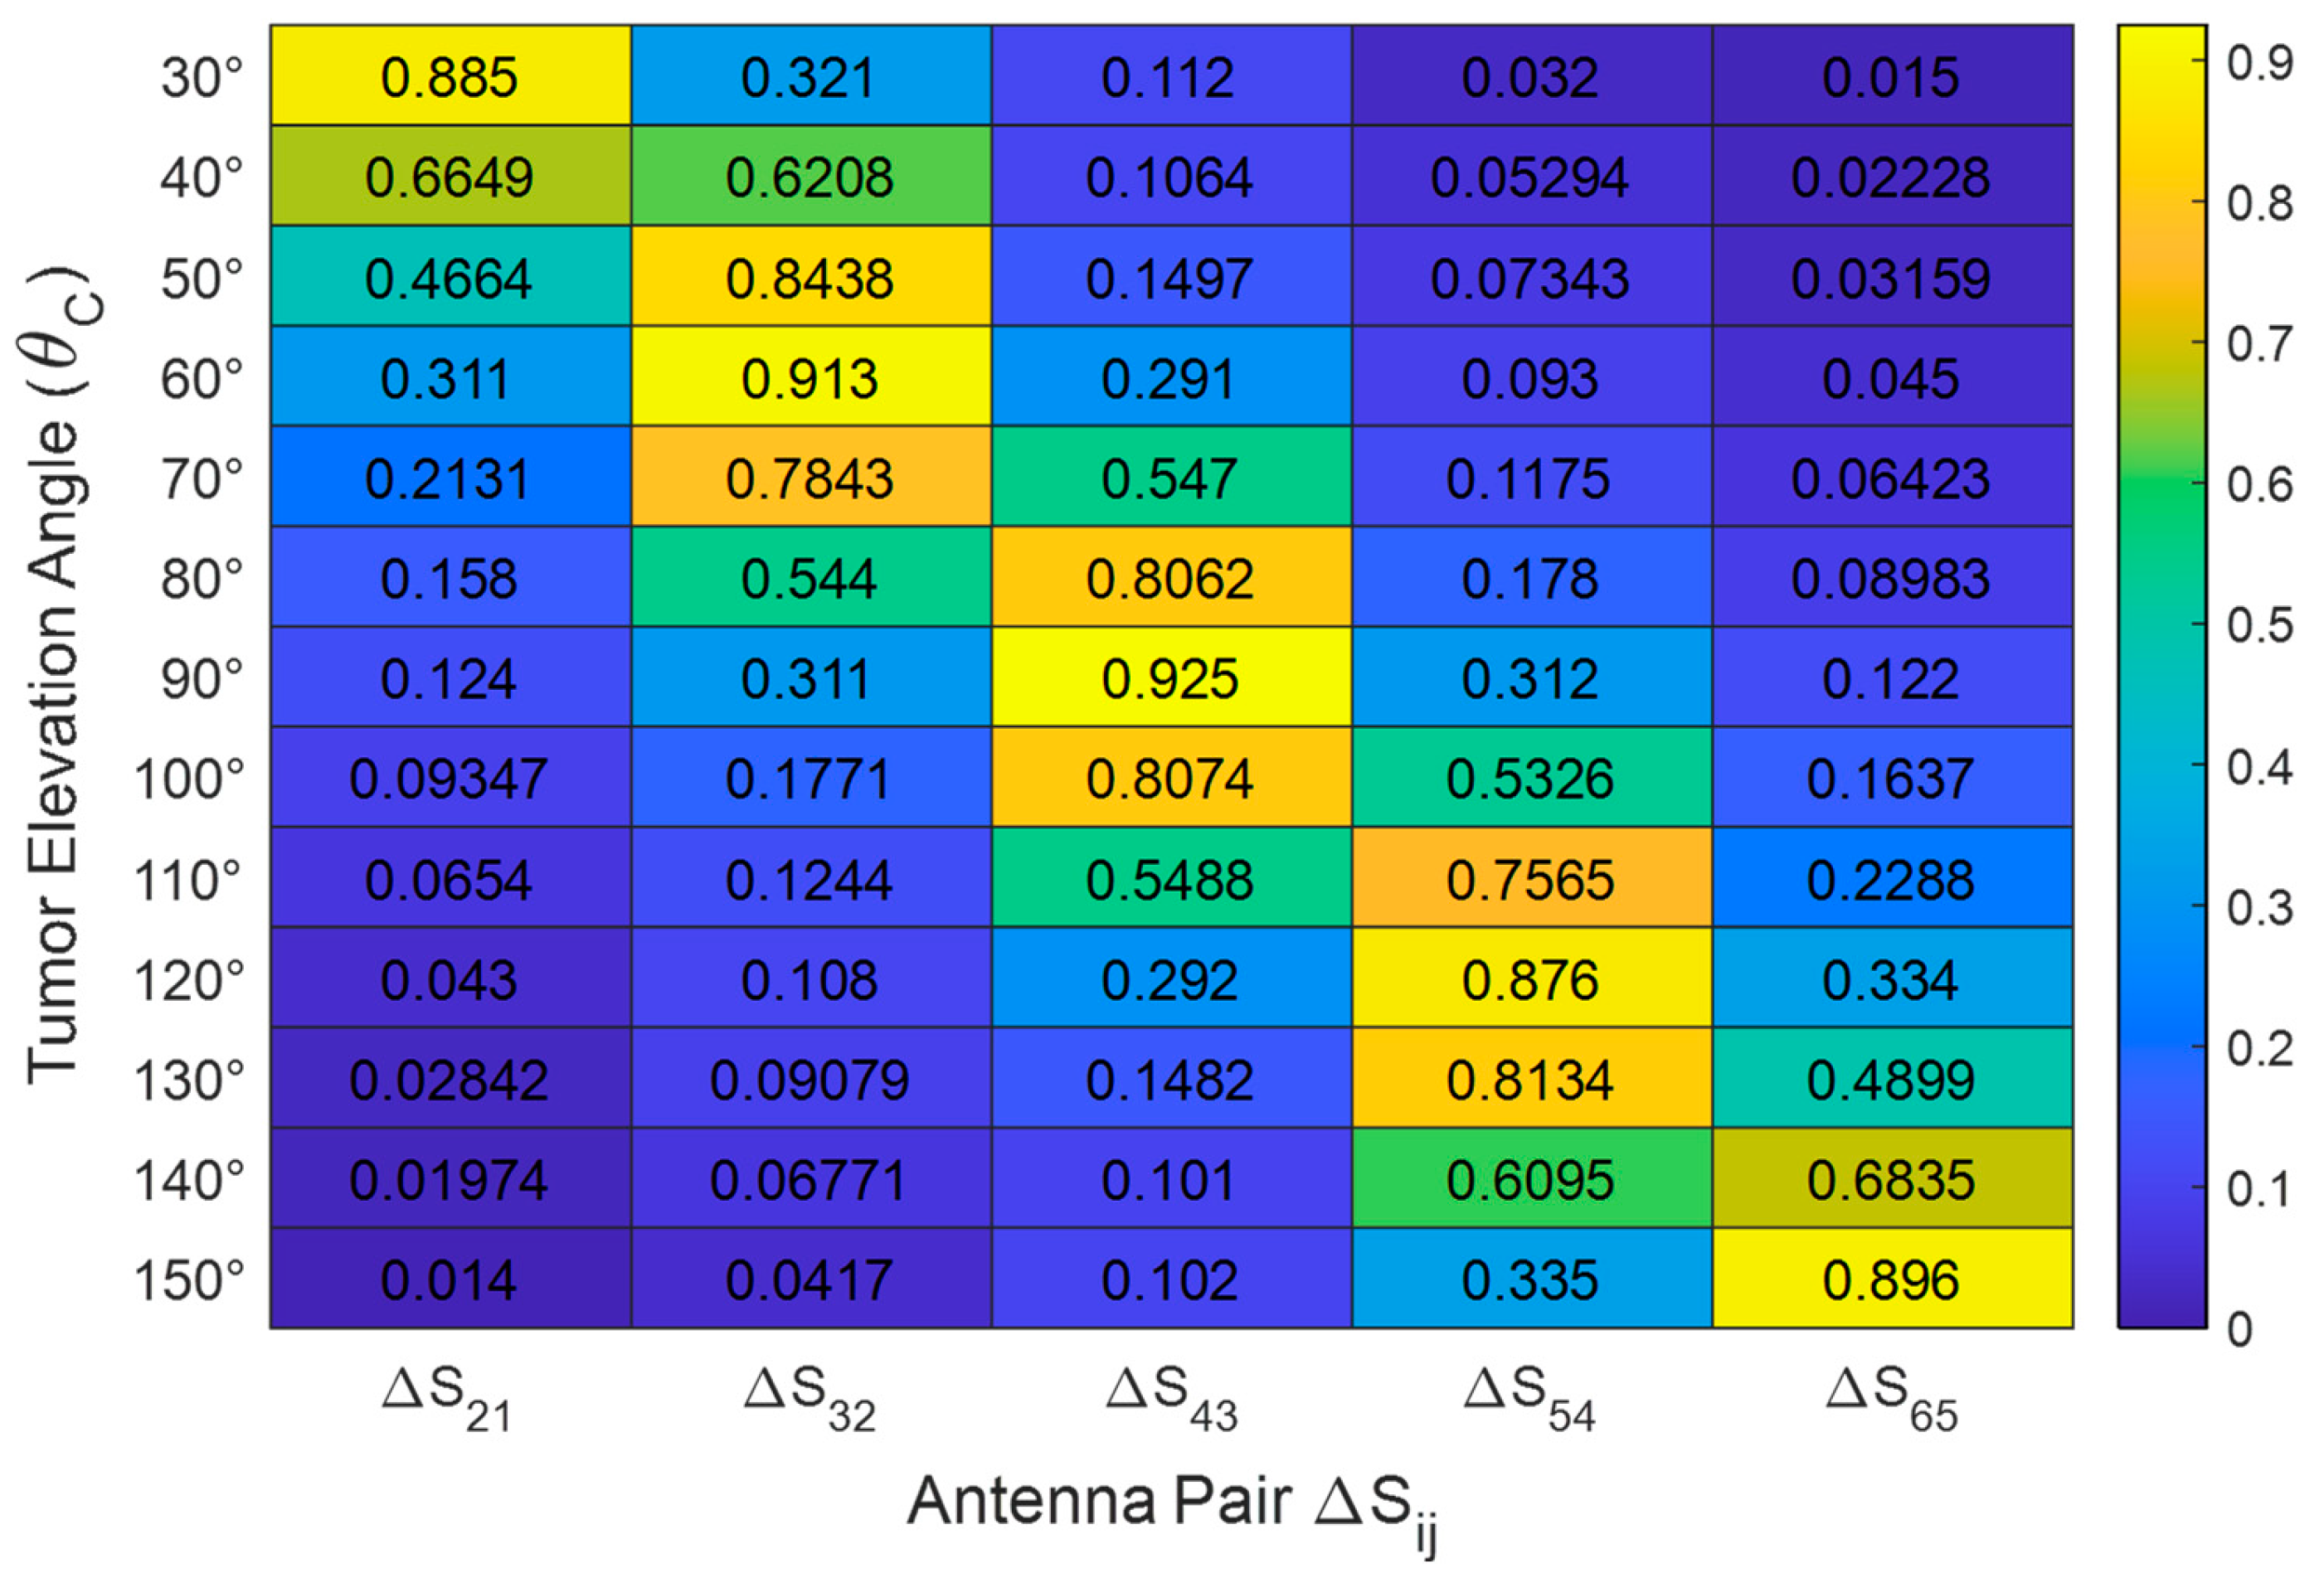
Normalized change in mutual S-parameter magnitude () as a function of tumor elevation angle . Simulations performed for an ellipsoidal tumor of major length and radial distance inside a breast phantom of radius .
Table 6.
Normalized change in mutual S-parameter magnitude () as a function of tumor elevation angle . Simulations performed for an ellipsoidal tumor of major length and radial distance inside a breast phantom of radius .
| | | | | |
|---|
| 0.88 | 0.32 | 0.11 | 0.03 | 0.01 |
| 0.31 | 0.91 | 0.29 | 0.09 | 0.04 |
| 0.12 | 0.28 | 0.92 | 0.31 | 0.11 |
| 0.04 | 0.1 | 0.29 | 0.87 | 0.33 |
| 0.01 | 0.04 | 0.10 | 0.33 | 0.89 |
Table 7.
Performance comparison of ABFS and classical attention models.
Table 7.
Performance comparison of ABFS and classical attention models.
| Model | Azimuth Error (°) | Elevation Error (°) | Radial Distance Error (mm) | Size Error (mm) | Dice Score |
|---|
| SE-Net [32] | 7.4 | 6.9 | 5.1 | 2.7 | 0.81 |
| CBAM [33] | 6.8 | 6.3 | 4.6 | 2.3 | 0.84 |
| TEA [34] | 6.1 | 5.9 | 4.0 | 2.1 | 0.85 |
| ABFS (Proposed) | 3.3 | 4.2 | 2.8 | 1.5 | 0.92 |
Table 8.
Tumor parameter prediction performance metrics (simulation dataset).
Table 8.
Tumor parameter prediction performance metrics (simulation dataset).
| Tumor Parameter | RMSE (mm or Degrees) | |
|---|
| Angular Position () | 4.2° | 0.93 |
| Depth () | 2.8 mm | 0.95 |
| Major Length (T) | 1.5 mm | 0.96 |
Table 9.
Performance comparison of the proposed ABFS model with related AI-enabled microwave breast imaging approaches.
Table 9.
Performance comparison of the proposed ABFS model with related AI-enabled microwave breast imaging approaches.
| Work | Data Type | Dice Score | Radial Distance Error (mm) | Size Estimation RMSE (mm) | Inference Time per Case (ms) |
|---|
| [35] | Simulated monostatic radar data | 0.87 | | N/A | ~50–100 |
| [36] | Multi-antenna S-parameter dataset | 0.85 | N/A | | ~30–80 |
| Proposed | Multi-antenna S-parameter dataset | 0.92 | 2.8 | 1.5 | |


 ,
, 


