
Kinematic Biomarkers of Limb Shortening and Compensations in Hemiparetic Gait: A Systematic Review

 ,
,
Abstract
Highlights
- There is a lack of standardized and systematic descriptions for limb shortening and compensatory movements in hemiparetic gait.
- We proposed a set of relevant biomarkers to enhance standardization by systematically describing the deficit of shortening and the compensatory movements.
Abstract
1. Introduction
2. Materials and Methods
2.1. Search Strategy
2.2. Eligibility Criteria
2.3. Study Selection Process
2.4. Data Collection Process and Data Items
2.5. Study Risk of Bias Assessment
2.6. Synthesis Methods
2.7. Effect Size
3. Results
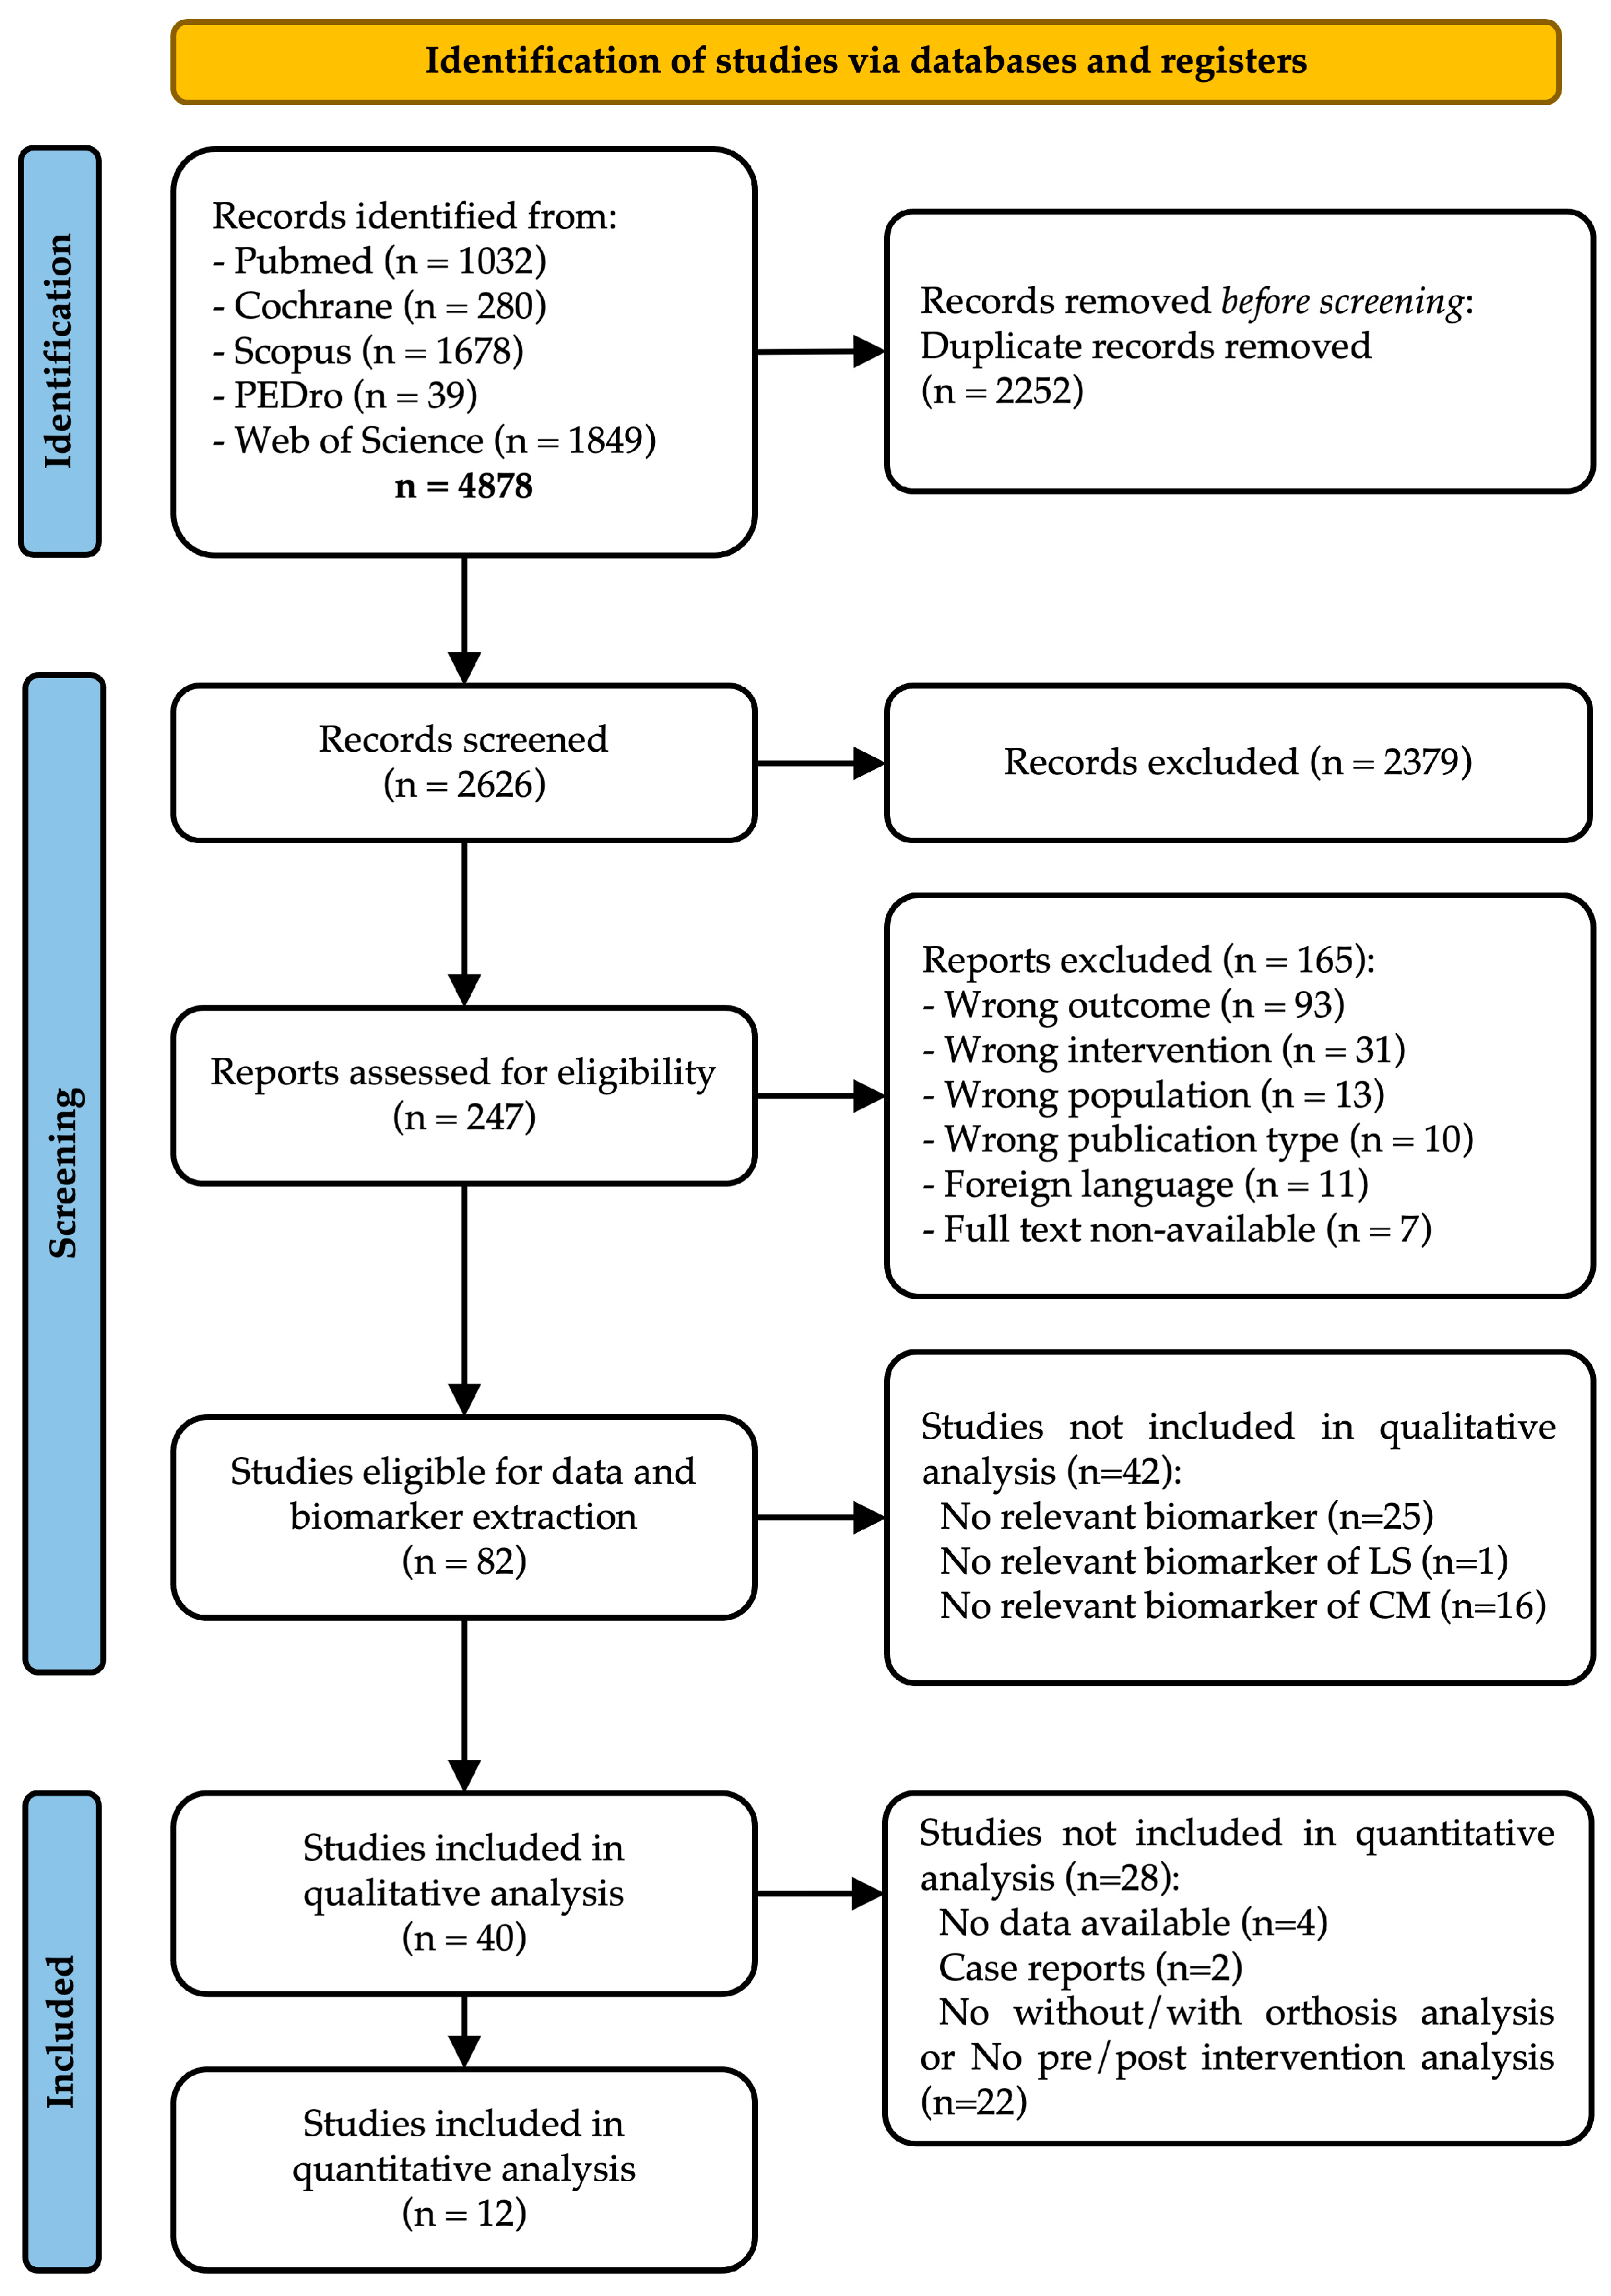
3.1. Study Selection
3.2. Population and Studies Characteristics
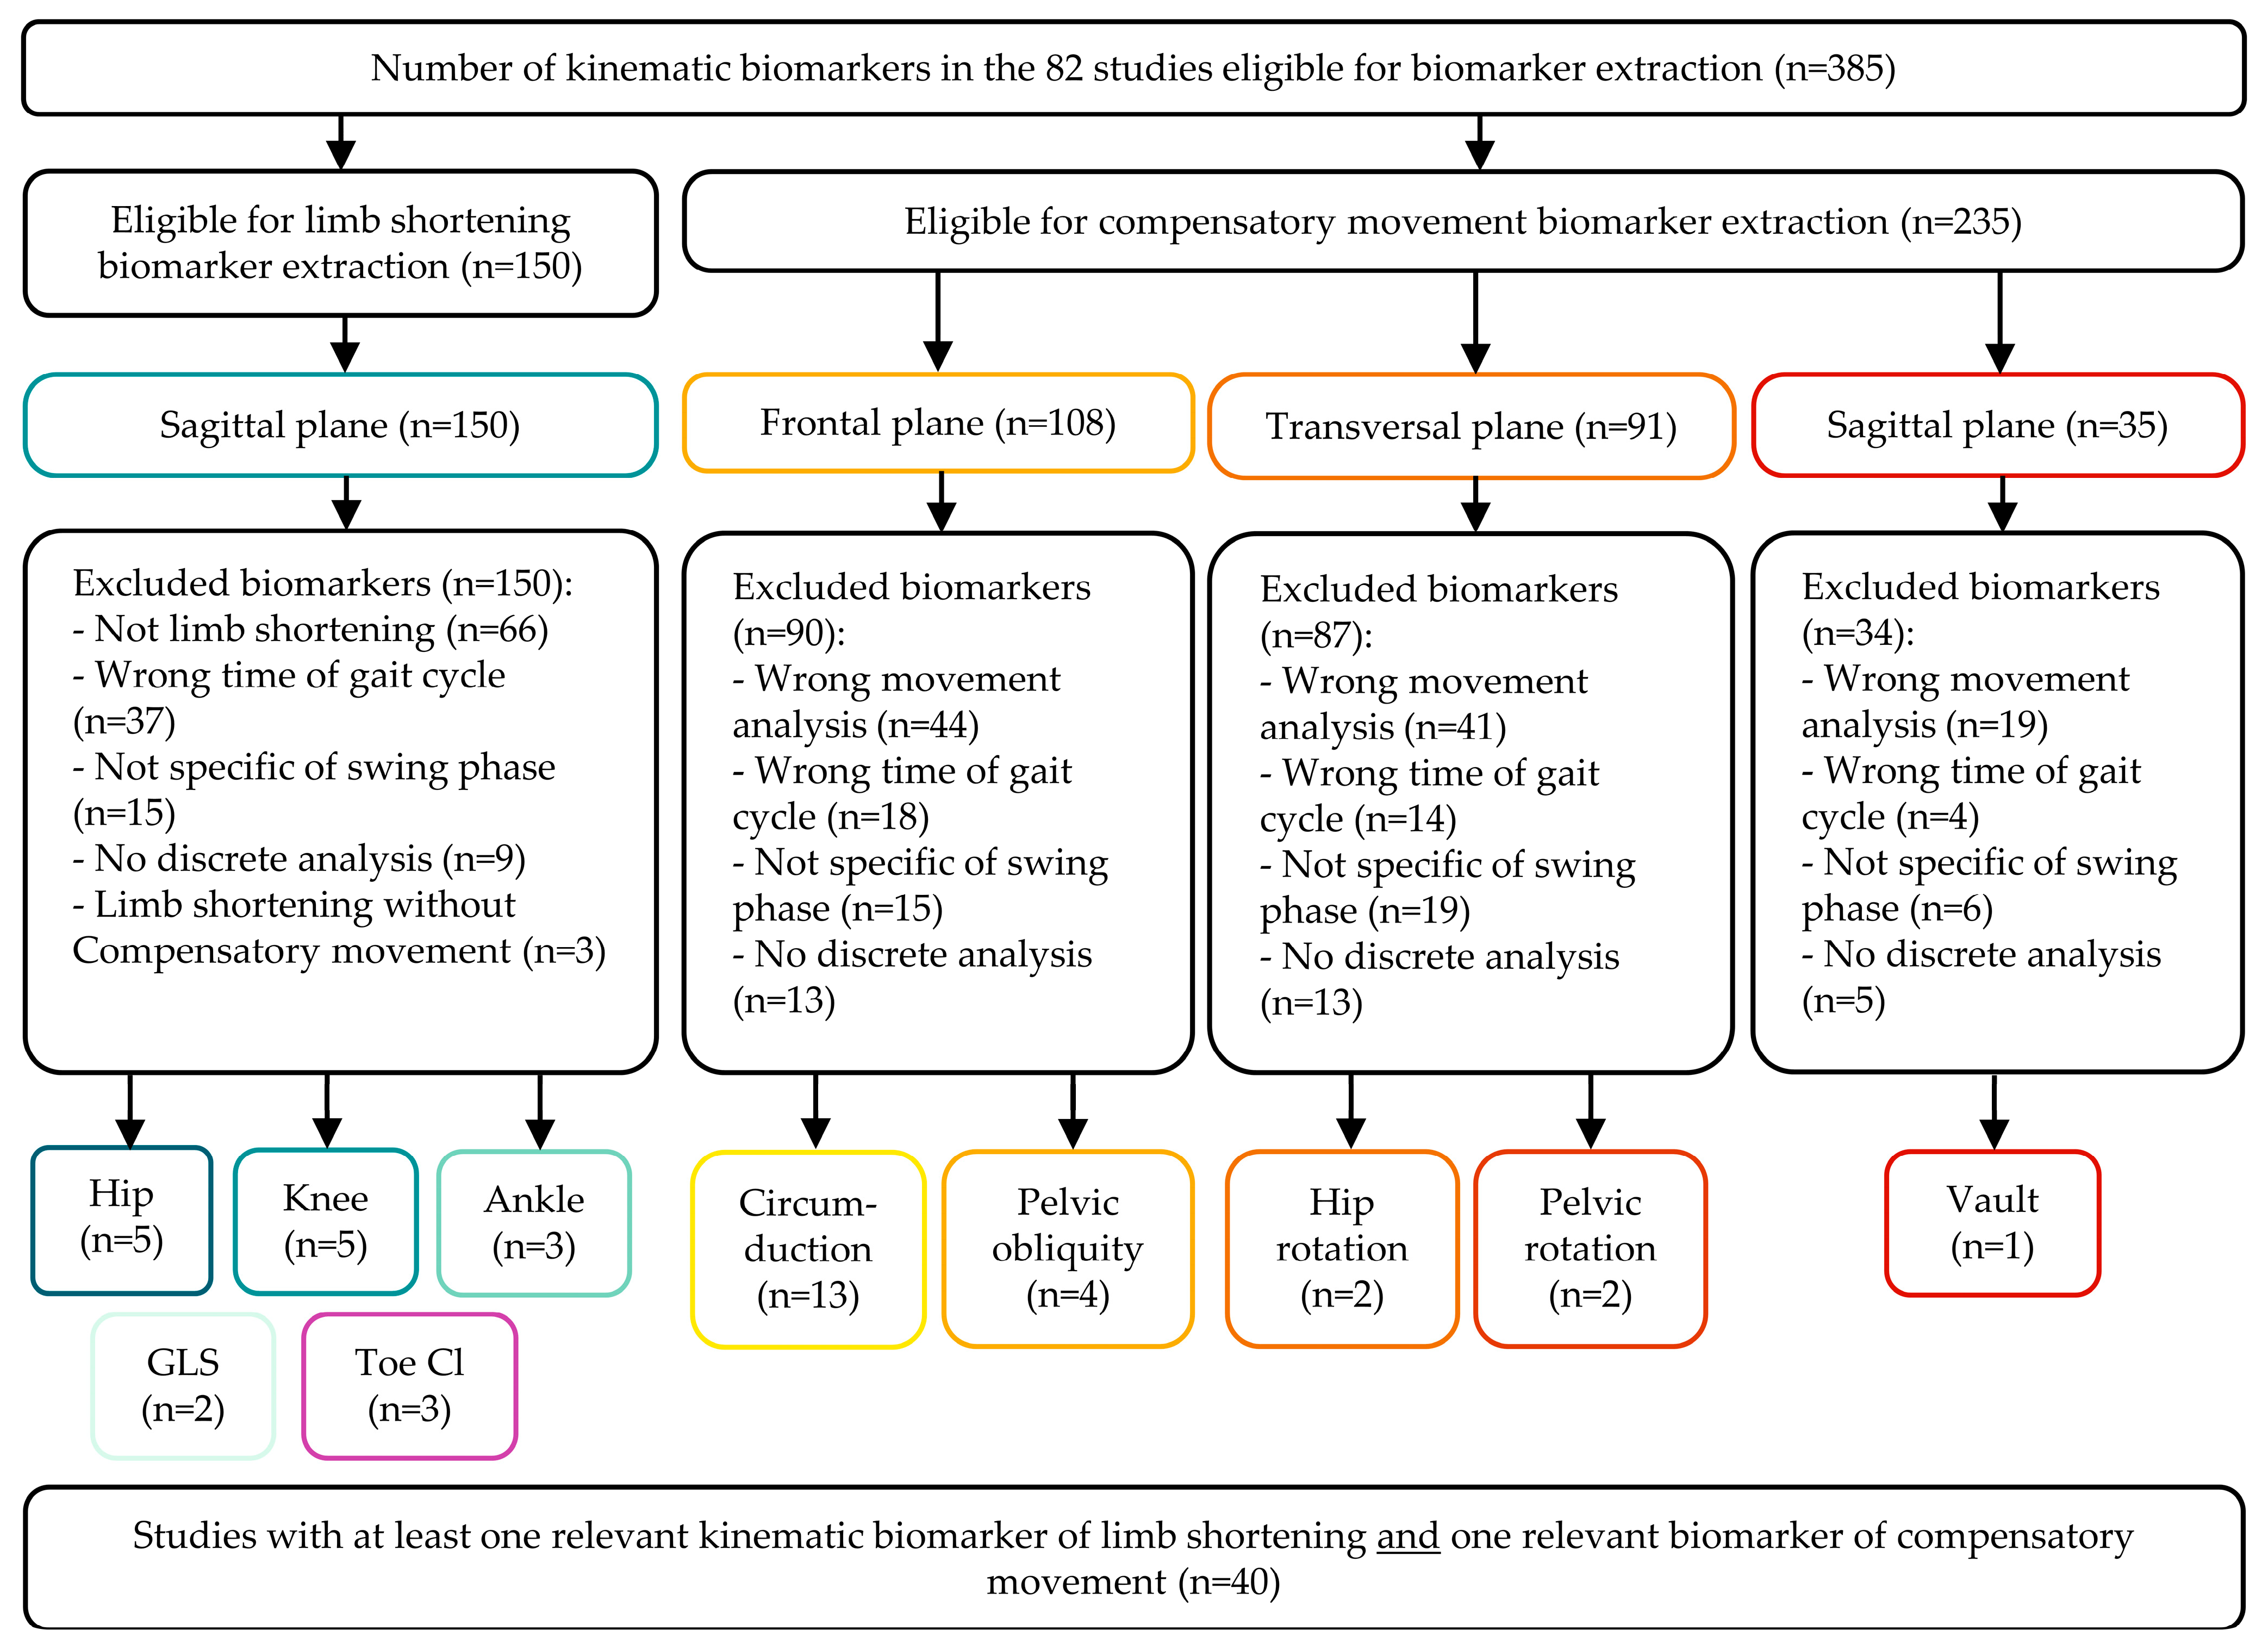
3.3. Selected Biomarkers
3.3.1. Limb Shortening
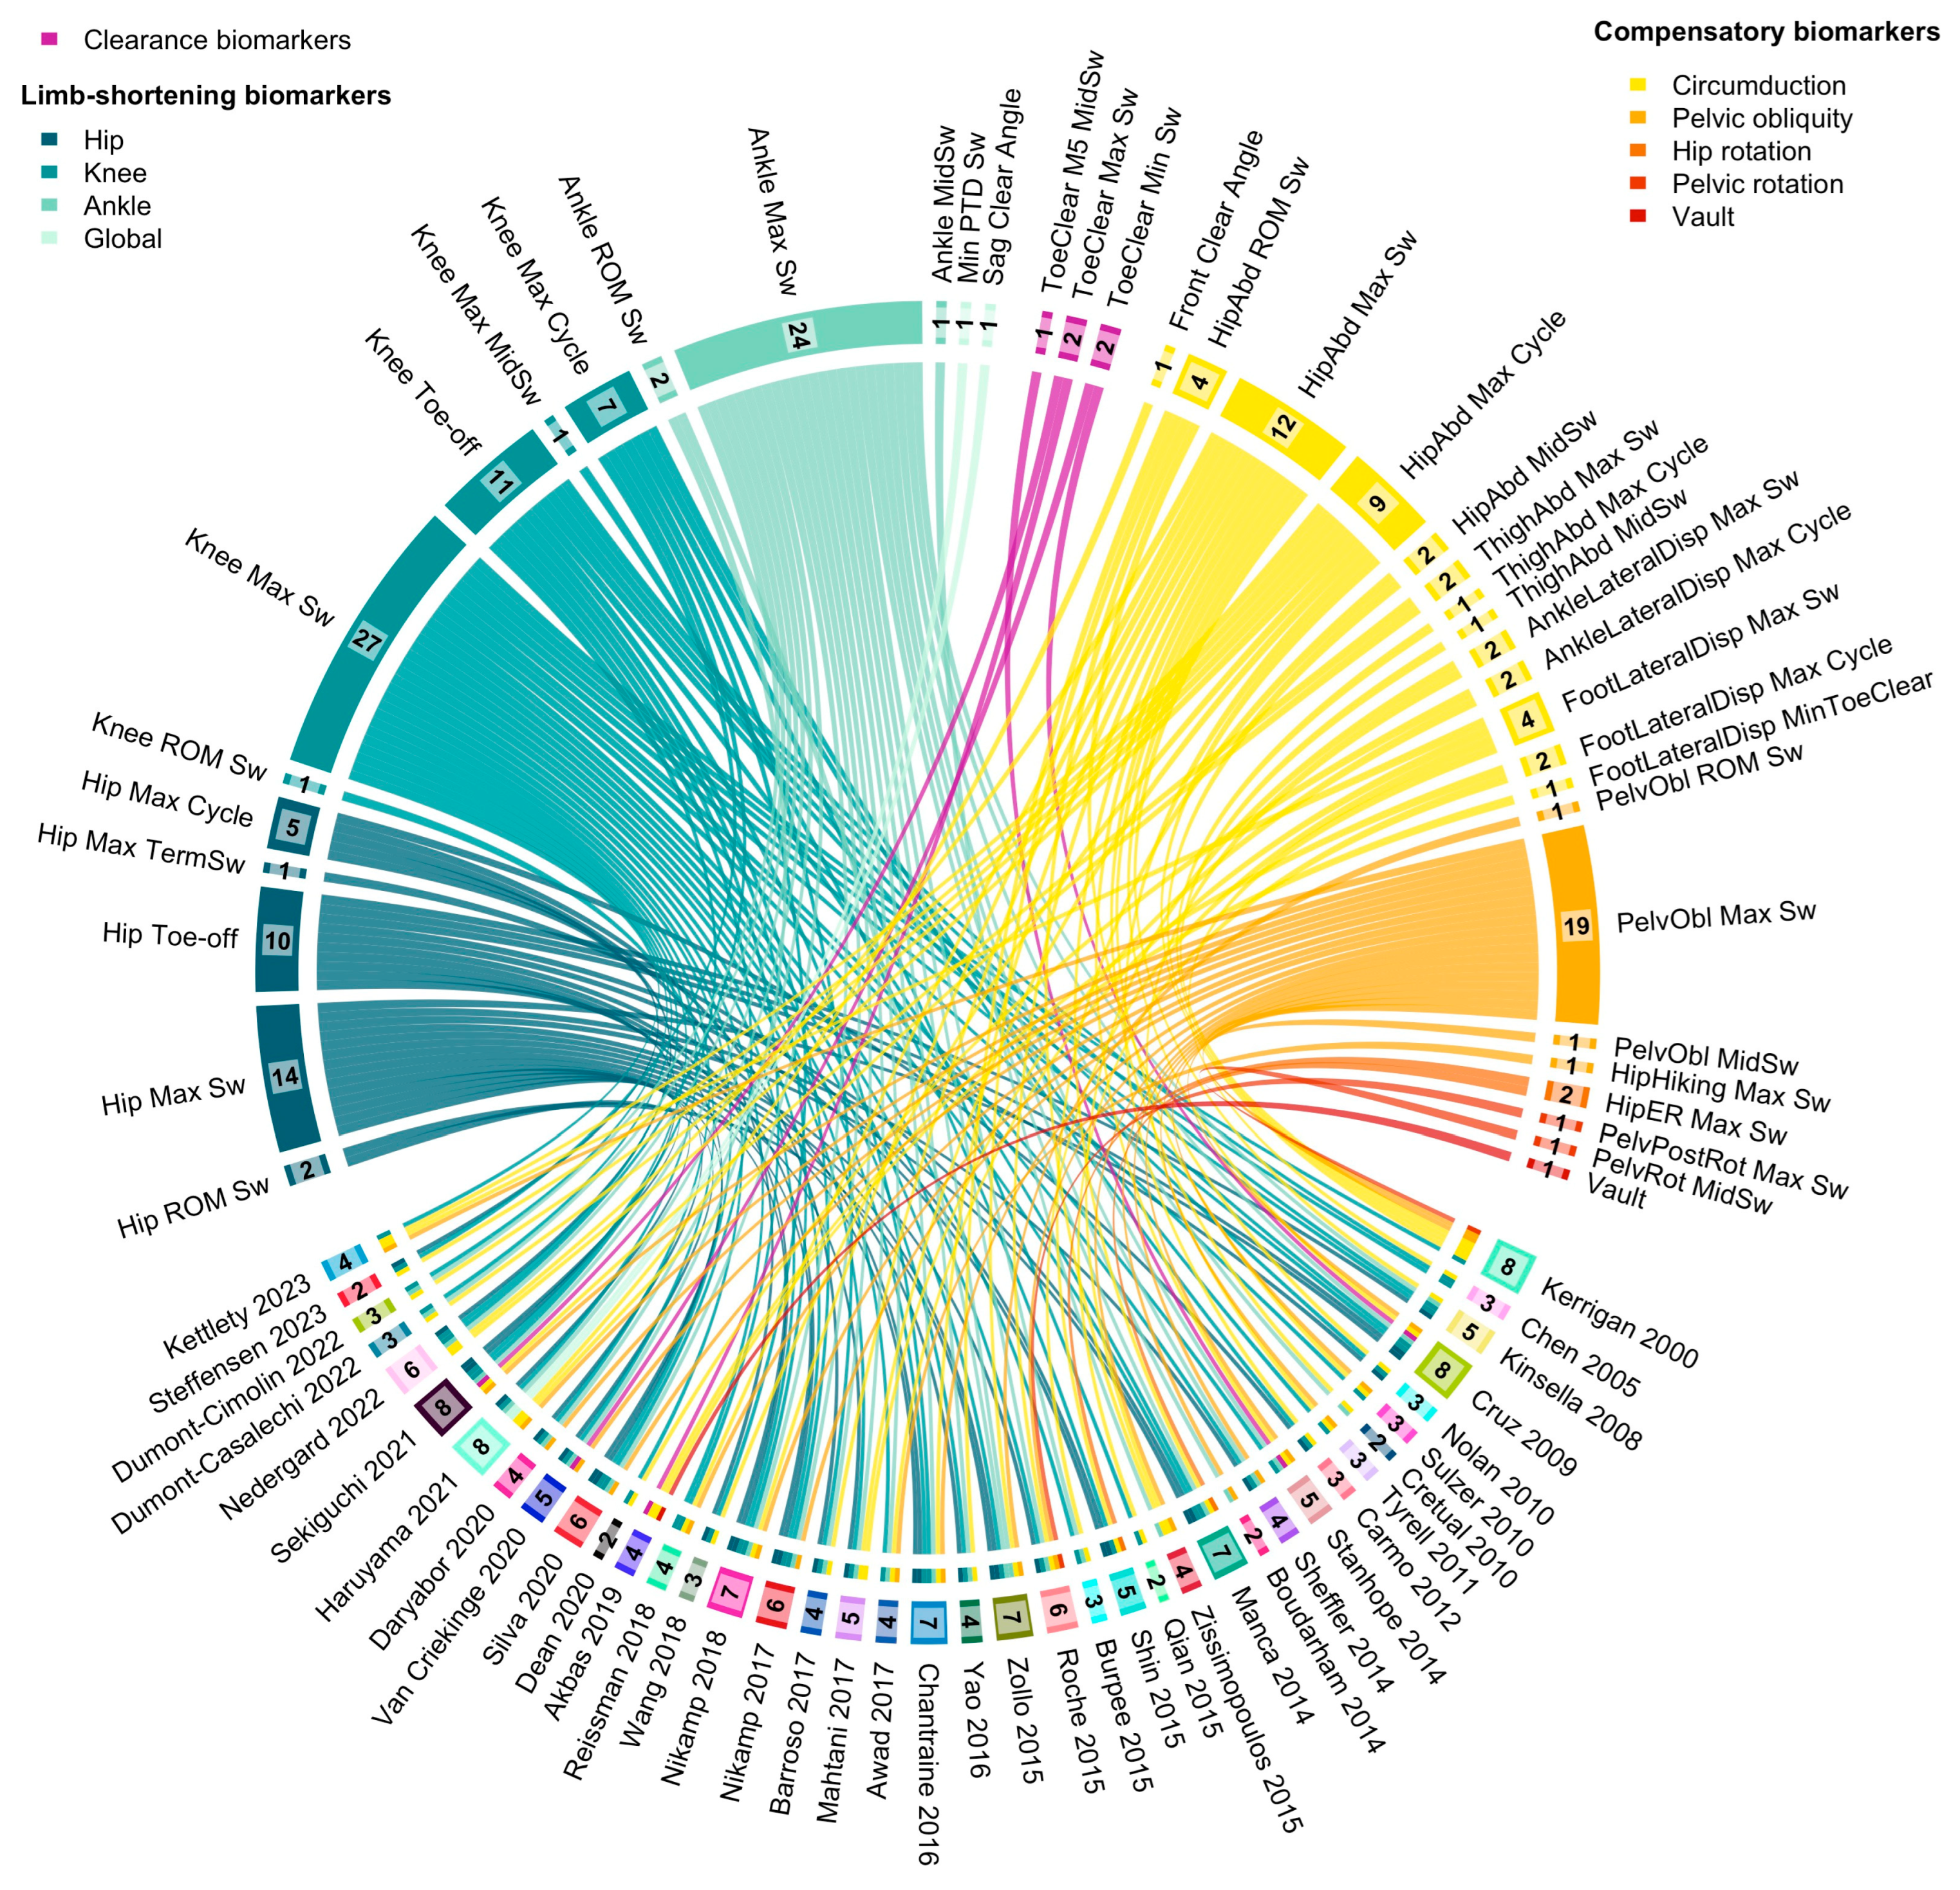
3.3.2. Toe Clearance
3.3.3. Compensatory Movements
3.4. Quantitative Analysis
4. Discussion
4.1. Respective Contributions of Joints on Limb Shortening
4.2. Toe Clearance and Global Limb Shortening
4.3. Compensatory Movements
4.4. Quantitative Analysis
4.5. Limitations
4.6. Perspectives
5. Conclusions
Supplementary Materials
Author Contributions
Funding
Data Availability Statement
Conflicts of Interest
Abbreviations
| 3D-IGA | Three-dimensional instrumental gait analysis |
| AFO | Ankle–foot orthosis |
| ASIS | Anterior superior iliac spine |
| DAFO | Dynamic ankle–foot orthosis |
| FES | Functional electrical stimulation |
| M2 | Second metatarsal |
| M5 | Fifth metatarsal |
| MOCAP | Motion capture system |
| PBMT-SMF | Photobiomodulation therapy combined with static magnetic field. |
| PTD | Pelvic–toe distance |
| RCT | Randomised controlled trial |
| ROM | Range of motion |
| SKG | Stiff–knee gait |
| TBI | Traumatic brain injury |
Appendix A
Research Strategy
References
- Whittle, M. Gait Analysis: An Introduction; Butterworth-Heinemann: Oxford, UK; Boston, MA, USA, 1991; ISBN 978-0-7506-0045-3. [Google Scholar]
- Jørgensen, H.S.; Nakayama, H.; Raaschou, H.O.; Olsen, T.S. Recovery of Walking Function in Stroke Patients: The Copenhagen Stroke Study. Arch. Phys. Med. Rehabil. 1995, 76, 27–32. [Google Scholar] [CrossRef] [PubMed]
- Balaban, B.; Tok, F. Gait Disturbances in Patients with Stroke. PM R 2014, 6, 635–642. [Google Scholar] [CrossRef] [PubMed]
- Woolley, S.M. Characteristics of Gait in Hemiplegia. Top. Stroke Rehabil. 2001, 7, 1–18. [Google Scholar] [CrossRef] [PubMed]
- Olney, S.J.; Richards, C. Hemiparetic Gait Following Stroke. Part I: Characteristics. Gait Posture 1996, 4, 136–148. [Google Scholar] [CrossRef]
- Moosabhoy, M.A.; Gard, S.A. Methodology for Determining the Sensitivity of Swing Leg Toe Clearance and Leg Length to Swing Leg Joint Angles during Gait. Gait Posture 2006, 24, 493–501. [Google Scholar] [CrossRef] [PubMed]
- Perry, J. Gait Analysis: Normal and Pathological Function; SLACK: San Francisco, CA, USA, 1992; ISBN 978-1-55642-192-1. [Google Scholar]
- Zhang, F.; Bohlen, P.; Lewek, M.D.; Huang, H. Prediction of Intrinsically Caused Tripping Events in Individuals with Stroke. IEEE Trans. Neural Syst. Rehabil. Eng. 2017, 25, 1202–1210. [Google Scholar] [CrossRef] [PubMed]
- Kramer, S.; Johnson, L.; Bernhardt, J.; Cumming, T. Energy Expenditure and Cost During Walking after Stroke: A Systematic Review. Arch. Phys. Med. Rehabil. 2016, 97, 619–632.e1. [Google Scholar] [CrossRef] [PubMed]
- Sheffler, L.R.; Bailey, S.N.; Gunzler, D.; Chae, J. Effect of Body Mass Index on Hemiparetic Gait. PM R 2014, 6, 908–913. [Google Scholar] [CrossRef] [PubMed]
- Whittle, M. Gait Analysis: An Introduction; Butterworth-Heinemann: Oxford, UK, 2007; ISBN 978-0-7506-8883-3. [Google Scholar]
- Milot, M.-H.; Nadeau, S.; Gravel, D.; Bourbonnais, D. Effect of Increases in Plantarflexor and Hip Flexor Muscle Strength on the Levels of Effort during Gait in Individuals with Hemiparesis. Clin. Biomech. (Bristol, Avon) 2008, 23, 415–423. [Google Scholar] [CrossRef] [PubMed]
- Kesar, T.M.; Perumal, R.; Jancosko, A.; Reisman, D.S.; Rudolph, K.S.; Higginson, J.S.; Binder-Macleod, S.A. Novel Patterns of Functional Electrical Stimulation Have an Immediate Effect on Dorsiflexor Muscle Function during Gait for People Poststroke. Phys. Ther. 2010, 90, 55–66. [Google Scholar] [CrossRef] [PubMed]
- Stoquart, G.G.; Detrembleur, C.; Palumbo, S.; Deltombe, T.; Lejeune, T.M. Effect of Botulinum Toxin Injection in the Rectus Femoris on Stiff-Knee Gait in People with Stroke: A Prospective Observational Study. Arch. Phys. Med. Rehabil. 2008, 89, 56–61. [Google Scholar] [CrossRef] [PubMed]
- Bleyenheuft, C.; Cockx, S.; Caty, G.; Stoquart, G.; Lejeune, T.; Detrembleur, C. The Effect of Botulinum Toxin Injections on Gait Control in Spastic Stroke Patients Presenting with a Stiff-Knee Gait. Gait Posture 2009, 30, 168–172. [Google Scholar] [CrossRef] [PubMed]
- Roche, N.; Boudarham, J.; Hardy, A.; Bonnyaud, C.; Bensmail, B. Use of Gait Parameters to Predict the Effectiveness of Botulinum Toxin Injection in the Spastic Rectus Femoris Muscle of Stroke Patients with Stiff Knee Gait. Eur. J. Phys. Rehabil. Med. 2015, 51, 10. [Google Scholar]
- Wada, Y.; Otaka, Y.; Mukaino, M.; Tsujimoto, Y.; Shiroshita, A.; Kawate, N.; Taito, S. The Effect of Ankle-Foot Orthosis on Ankle Kinematics in Individuals after Stroke: A Systematic Review and Meta-Analysis. PM R 2022, 14, 828–836. [Google Scholar] [CrossRef] [PubMed]
- Choo, Y.J.; Chang, M.C. Effectiveness of an Ankle–Foot Orthosis on Walking in Patients with Stroke: A Systematic Review and Meta-Analysis. Sci. Rep. 2021, 11, 15879. [Google Scholar] [CrossRef] [PubMed]
- Daryabor, A.; Arazpour, M.; Aminian, G.; Baniasad, M.; Yamamoto, S. Design and Evaluation of an Articulated Ankle Foot Orthosis with Plantarflexion Resistance on the Gait: A Case Series of 2 Patients with Hemiplegia. J. Biomed. Phys. Eng. 2020, 10, 119–128. [Google Scholar] [CrossRef] [PubMed]
- de l’Escalopier, N.; Voisard, C.; Michaud, M.; Moreau, A.; Jung, S.; Tervil, B.; Vayatis, N.; Oudre, L.; Ricard, D. Evaluation Methods to Assess the Efficacy of Equinovarus Foot Surgery on the Gait of Post-Stroke Hemiplegic Patients: A Literature Review. Front. Neurol. 2022, 13, 1042667. [Google Scholar] [CrossRef] [PubMed]
- Varvarousis, D.N.; Martzivanou, C.; Dimopoulos, D.; Dimakopoulos, G.; Vasileiadis, G.I.; Ploumis, A. The Effectiveness of Botulinum Toxin on Spasticity and Gait of Hemiplegic Patients after Stroke: A Systematic Review and Meta-Analysis. Toxicon 2021, 203, 74–84. [Google Scholar] [CrossRef] [PubMed]
- Van Criekinge, T.; Heremans, C.; Burridge, J.; Deutsch, J.E.; Hammerbeck, U.; Hollands, K.; Karthikbabu, S.; Mehrholz, J.; Moore, J.L.; Salbach, N.M.; et al. Standardized Measurement of Balance and Mobility Post-Stroke: Consensus-Based Core Recommendations from the Third Stroke Recovery and Rehabilitation Roundtable. Int. J. Stroke 2024, 19, 158–168. [Google Scholar] [CrossRef] [PubMed]
- Wonsetler, E.C.; Miller, E.L.; Huey, K.L.; Frye, S.E.; Bowden, M.G. Association between Altered Hip Extension and Kinetic Gait Variables. Am. J. Phys. Med. Rehabil. 2018, 97, 131–133. [Google Scholar] [CrossRef] [PubMed]
- Figueiredo, J.; Moreno, J.C.; Matias, A.C.; Pereira, F.; Santos, C.P. Outcome Measures and Motion Capture Systems for Assessing Lower Limb Orthosis-Based Interventions after Stroke: A Systematic Review. Disabil. Rehabil. Assist. Technol. 2021, 16, 674–683. [Google Scholar] [CrossRef] [PubMed]
- Li, J.; Kwong, P.W.; Lin, W.; Fong, K.N.; Wu, W.; Sidarta, A. Assessment of Ambulation Functions through Kinematic Analysis in Individuals with Stroke: A Systematic Review. Eur. J. Phys. Rehabil. Med. 2025, 61, 28–40. [Google Scholar] [CrossRef] [PubMed]
- Gu, Z.; Gu, L.; Eils, R.; Schlesner, M.; Brors, B. Circlize Implements and Enhances Circular Visualization in R. Bioinformatics 2014, 30, 2811–2812. [Google Scholar] [CrossRef] [PubMed]
- Krzywinski, M.; Schein, J.; Birol, I.; Connors, J.; Gascoyne, R.; Horsman, D.; Jones, S.J.; Marra, M.A. Circos: An Information Aesthetic for Comparative Genomics. Genome Res. 2009, 19, 1639–1645. [Google Scholar] [CrossRef] [PubMed]
- Cumming, G. The New Statistics: Why and How. Psychol. Sci. 2014, 25, 7–29. [Google Scholar] [CrossRef] [PubMed]
- Borenstein, M.; Hedges, L.V.; Higgins, J.P.T.; Rothstein, H.R. Introduction to Meta-Analysis; John Wiley & Sons, Inc.: Hoboken, NJ, USA, 2009. [Google Scholar]
- Nedergård, H.; Schelin, L.; Liebermann, D.G.; Johansson, G.M.; Häger, C.K. Core Sets of Kinematic Variables to Consider for Evaluation of Gait Post-Stroke. Front. Hum. Neurosci. 2022, 15, 820104. [Google Scholar] [CrossRef] [PubMed]
- Cretual, A.; Bervet, K.; Ballaz, L. Gillette Gait Index in Adults. Gait Posture 2010, 32, 307–310. [Google Scholar] [CrossRef] [PubMed]
- Silva, M.R.E.; Jacinto, J. Velocity Determinants in Spastic Patients after Stroke-A Gait Analysis Study. Neurol. Int. 2020, 12, 48–54. [Google Scholar] [CrossRef] [PubMed]
- Qian, J.; Rong, K.; Qian, Z.; Wen, C.; Zhang, S. Effects of a Multichannel Dynamic Functional Electrical Stimulation System on Hemiplegic Gait and Muscle Forces. J. Phys. Ther. Sci. 2015, 27, 3541–3544. [Google Scholar] [CrossRef] [PubMed]
- Cruz, T.H.; Dhaher, Y.Y. Impact of Ankle-Foot-Orthosis on Frontal Plane Behaviors Post-Stroke. Gait Posture 2009, 30, 312–316. [Google Scholar] [CrossRef] [PubMed]
- Boudarham, J.; Pradon, D.; Roche, N.; Bensmail, D.; Zory, R. Effects of a Dynamic-Ankle-Foot Orthosis (Liberté®) on Kinematics and Electromyographic Activity during Gait in Hemiplegic Patients with Spastic Foot Equinus. NeuroRehabilitation 2014, 35, 369–379. [Google Scholar] [CrossRef] [PubMed]
- Zissimopoulos, A.; Fatone, S.; Gard, S. Effects of Ankle-Foot Orthoses on Mediolateral Foot-Placement Ability during Post-Stroke Gait. Prosthet. Orthot. Int. 2015, 39, 372–379. [Google Scholar] [CrossRef] [PubMed]
- Zollo, L.; Zaccheddu, N.; Ciancio, A.L.; Morrone, M.; Bravi, M.; Santacaterina, F.; Milazzo, M.L.; Guglielmelli, E.; Sterzi, S. Comparative Analysis and Quantitative Evaluation of Ankle-Foot Orthoses for Foot Drop in Chronic Hemiparetic Patients. Eur. J. Phys. Rehabil. Med. 2015, 51, 12. [Google Scholar]
- Nikamp, C.D.M.; Hobbelink, M.S.H.; van der Palen, J.; Hermens, H.J.; Rietman, J.S.; Buurke, J.H. A Randomized Controlled Trial on Providing Ankle-Foot Orthoses in Patients with (Sub-)Acute Stroke: Short-Term Kinematic and Spatiotemporal Effects and Effects of Timing. Gait Posture 2017, 55, 15–22. [Google Scholar] [CrossRef] [PubMed]
- Nikamp, C.D.M.; van der Palen, J.; Hermens, H.J.; Rietman, J.S.; Buurke, J.H. The Influence of Early or Delayed Provision of Ankle-Foot Orthoses on Pelvis, Hip and Knee Kinematics in Patients with Sub-Acute Stroke: A Randomized Controlled Trial. Gait Posture 2018, 63, 260–267. [Google Scholar] [CrossRef] [PubMed]
- Sulzer, J.S.; Gordon, K.E.; Dhaher, Y.Y.; Peshkin, M.A.; Patton, J.L. Preswing Knee Flexion Assistance Is Coupled with Hip Abduction in People with Stiff-Knee Gait after Stroke. Stroke 2010, 41, 1709–1714. [Google Scholar] [CrossRef] [PubMed]
- Awad, L.N.; Bae, J.; Kudzia, P.; Long, A.; Hendron, K.; Holt, K.G.; O’Donnell, K.; Ellis, T.D.; Walsh, C.J. Reducing Circumduction and Hip Hiking During Hemiparetic Walking Through Targeted Assistance of the Paretic Limb Using a Soft Robotic Exosuit. Am. J. Phys. Med. Rehabil. 2017, 96, S157–S164. [Google Scholar] [CrossRef] [PubMed]
- Shin, Y.-K.; Chong, H.J.; Kim, S.J.; Cho, S.-R. Effect of Rhythmic Auditory Stimulation on Hemiplegic Gait Patterns. Yonsei Med. J. 2015, 56, 1703. [Google Scholar] [CrossRef] [PubMed]
- Reissman, M.E.; Gordon, K.E.; Dhaher, Y.Y. Manipulating Post-Stroke Gait: Exploiting Aberrant Kinematics. J. Biomech. 2018, 67, 129–136. [Google Scholar] [CrossRef] [PubMed]
- Dumont, A.J.L.; Cimolin, V.; Parreira, R.B.; Armbrust, D.; Fonseca, D.R.P.; Fonseca, A.L.; Cordeiro, L.; Franco, R.C.; Duarte, N.A.C.; Galli, M.; et al. Effects of Transcranial Direct Current Stimulation Combined with Treadmill Training on Kinematics and Spatiotemporal Gait Variables in Stroke Survivors: A Randomized, Triple-Blind, Sham-Controlled Study. Brain Sci. 2022, 13, 11. [Google Scholar] [CrossRef] [PubMed]
- Dumont, A.J.L.; Casalechi, H.L.; Tomazoni, S.S.; Grecco, L.C.; Galli, M.; Oliveira, C.S.; Leal-Junior, E.C.P. Photobiomodulation Therapy Combined with Static Magnetic Field (PBMT–SMF) on Spatiotemporal and Kinematics Gait Parameters in Post-Stroke: A Pilot Study. Life 2022, 12, 186. [Google Scholar] [CrossRef] [PubMed]
- Kerrigan, D.C.; Frates, E.P.; Rogan, S.; Riley, P.O. Hip Hiking and Circumduction: Quantitative Definitions. Am. J. Phys. Med. Rehabil. 2000, 79, 247–252. [Google Scholar] [CrossRef] [PubMed]
- Chen, G.; Patten, C.; Kothari, D.H.; Zajac, F.E. Gait Differences between Individuals with Post-Stroke Hemiparesis and Non-Disabled Controls at Matched Speeds. Gait Posture 2005, 22, 51–56. [Google Scholar] [CrossRef] [PubMed]
- Kinsella, S.; Moran, K. Gait Pattern Categorization of Stroke Participants with Equinus Deformity of the Foot. Gait Posture 2008, 27, 144–151. [Google Scholar] [CrossRef] [PubMed]
- Nolan, K.J.; Savalia, K.K.; Yarossi, M.; Elovic, E.P. Evaluation of a Dynamic Ankle Foot Orthosis in Hemiplegic Gait: A Case Report. NeuroRehabilitation 2010, 27, 343–350. [Google Scholar] [CrossRef] [PubMed]
- Tyrell, C.M.; Roos, M.A.; Rudolph, K.S.; Reisman, D.S. Influence of Systematic Increases in Treadmill Walking Speed on Gait Kinematics after Stroke. Phys. Ther. 2011, 91, 392–403. [Google Scholar] [CrossRef] [PubMed]
- Carmo, A.A.; Kleiner, A.F.R.; da Costa, P.H.L.; Barros, R.M.L. Three-Dimensional Kinematic Analysis of Upper and Lower Limb Motion during Gait of Post-Stroke Patients. Braz. J. Med. Biol. Res. 2012, 45, 537–545. [Google Scholar] [CrossRef] [PubMed]
- Stanhope, V.A.; Knarr, B.A.; Reisman, D.S.; Higginson, J.S. Frontal Plane Compensatory Strategies Associated with Self-Selected Walking Speed in Individuals Post-Stroke. Clin. Biomech. (Bristol, Avon) 2014, 29, 518–522. [Google Scholar] [CrossRef] [PubMed]
- Manca, M.; Ferraresi, G.; Cosma, M.; Cavazzuti, L.; Morelli, M.; Benedetti, M.G. Gait Patterns in Hemiplegic Patients with Equinus Foot Deformity. BioMed Res. Int. 2014, 2014, 939316. [Google Scholar] [CrossRef] [PubMed]
- Burpee, J.L.; Lewek, M.D. Biomechanical Gait Characteristics of Naturally Occurring Unsuccessful Foot Clearance during Swing in Individuals with Chronic Stroke. Clin. Biomech. (Bristol, Avon) 2015, 30, 1102–1107. [Google Scholar] [CrossRef] [PubMed]
- Roche, N.; Bonnyaud, C.; Geiger, M.; Bussel, B.; Bensmail, D. Relationship between Hip Flexion and Ankle Dorsiflexion during Swing Phase in Chronic Stroke Patients. Clin. Biomech. (Bristol, Avon) 2015, 30, 219–225. [Google Scholar] [CrossRef] [PubMed]
- Yao, D.; Jakubowitz, E.; Tecante, K.; Lahner, M.; Ettinger, S.; Claassen, L.; Plaass, C.; Stukenborg-Colsman, C.; Daniilidis, K. Restoring Mobility after Stroke: First Kinematic Results from a Pilot Study with a Hybrid Drop Foot Stimulator. Musculoskelet. Surg. 2016, 100, 223–229. [Google Scholar] [CrossRef] [PubMed]
- Chantraine, F.; Filipetti, P.; Schreiber, C.; Remacle, A.; Kolanowski, E.; Moissenet, F. Proposition of a Classification of Adult Patients with Hemiparesis in Chronic Phase. PLoS ONE 2016, 11, e0156726. [Google Scholar] [CrossRef] [PubMed]
- Mahtani, G.B.; Kinnaird, C.R.; Connolly, M.; Holleran, C.L.; Hennessy, P.W.; Woodward, J.; Brazg, G.; Roth, E.J.; Hornby, T.G. Altered Sagittal- and Frontal-Plane Kinematics Following High-Intensity Stepping Training Versus Conventional Interventions in Subacute Stroke. Phys. Ther. 2017, 97, 320–329. [Google Scholar] [CrossRef] [PubMed]
- Barroso, F.O.; Torricelli, D.; Molina-Rueda, F.; Alguacil-Diego, I.M.; Cano-de-la-Cuerda, R.; Santos, C.; Moreno, J.C.; Miangolarra-Page, J.C.; Pons, J.L. Combining Muscle Synergies and Biomechanical Analysis to Assess Gait in Stroke Patients. J. Biomech. 2017, 63, 98–103. [Google Scholar] [CrossRef] [PubMed]
- Wang, H.-Q.; Dong, G.-R.; Bao, C.-L.; Jiao, Z.-H. Immediate Effect of Scalp Acupuncture on the Gait of Patients with Subacute Intracerebral Haemorrhage Analysed by Three-Dimensional Motion: Secondary Analysis of a Randomised Controlled Trial. Acupunct. Med. 2018, 36, 71–79. [Google Scholar] [CrossRef] [PubMed]
- Akbas, T.; Prajapati, S.; Ziemnicki, D.; Tamma, P.; Gross, S.; Sulzer, J. Hip Circumduction Is Not a Compensation for Reduced Knee Flexion Angle during Gait. J. Biomech. 2019, 87, 150–156. [Google Scholar] [CrossRef] [PubMed]
- Dean, J.C.; Bowden, M.G.; Kelly, A.L.; Kautz, S.A. Altered Post-Stroke Propulsion is Related to Paretic Swing Phase Kinematics. Clin. Biomech. (Bristol, Avon) 2020, 72, 24–30. [Google Scholar] [CrossRef] [PubMed]
- Van Criekinge, T.; Wim, S.; Nolan, H.; Patricia, V.D.W.; Willem, D.H.; Steven, T.; Ann, H. Trunk Biomechanics during Walking after Sub-Acute Stroke and Its Relation to Lower Limb Impairments. Clin. Biomech. (Bristol, Avon) 2020, 75, 105013. [Google Scholar] [CrossRef]
- Haruyama, K.; Kawakami, M.; Okada, K.; Okuyama, K.; Tsuzuki, K.; Liu, M. Pelvis-Toe Distance: 3-Dimensional Gait Characteristics of Functional Limb Shortening in Hemiparetic Stroke. Sensors 2021, 21, 5417. [Google Scholar] [CrossRef] [PubMed]
- Sekiguchi, Y.; Honda, K.; Izumi, S.-I. Effect of Walking Adaptability on an Uneven Surface by a Stepping Pattern on Walking Activity After Stroke. Front. Hum. Neurosci. 2022, 15, 762223. [Google Scholar] [CrossRef] [PubMed]
- Steffensen, E.A.; Magalhães, F.; Knarr, B.A.; Kingston, D.C. Comparison of Markerless and Marker-Based Motion Capture of Gait Kinematics in Individuals with Cerebral Palsy and Chronic Stroke: A Case Study Series. Res. Sq. 2023. [Google Scholar] [CrossRef]
- Kettlety, S.A.; Finley, J.M.; Reisman, D.S.; Schweighofer, N.; Leech, K.A. Speed-Dependent Biomechanical Changes Vary across Individual Gait Metrics Post-Stroke Relative to Neurotypical Adults. J. Neuroeng. Rehabil. 2023, 20, 14. [Google Scholar] [CrossRef] [PubMed]
- Pongpipatpaiboon, K.; Mukaino, M.; Matsuda, F.; Ohtsuka, K.; Tanikawa, H.; Yamada, J.; Tsuchiyama, K.; Saitoh, E. The Impact of Ankle–Foot Orthoses on Toe Clearance Strategy in Hemiparetic Gait: A Cross-Sectional Study. J. Neuroeng. Rehabil. 2018, 15, 41. [Google Scholar] [CrossRef] [PubMed]
- Begg, R.; Best, R.; Dell’Oro, L.; Taylor, S. Minimum Foot Clearance during Walking: Strategies for the Minimisation of Trip-Related Falls. Gait Posture 2007, 25, 191–198. [Google Scholar] [CrossRef] [PubMed]
- Goldberg, S.R.; Ounpuu, S.; Delp, S.L. The Importance of Swing-Phase Initial Conditions in Stiff-Knee Gait. J. Biomech. 2003, 36, 1111–1116. [Google Scholar] [CrossRef] [PubMed]
- Prado-Medeiros, C.L.; Sousa, C.O.; Souza, A.S.; Soares, M.R.; Barela, A.M.F.; Salvini, T.F. Effects of the Addition of Functional Electrical Stimulation to Ground Level Gait Training with Body Weight Support after Chronic Stroke. Rev. Bras. Fisioter. 2011, 15, 436–444. [Google Scholar] [CrossRef] [PubMed]
- Daryabor, A.; Arazpour, M.; Aminian, G. Effect of Different Designs of Ankle-Foot Orthoses on Gait in Patients with Stroke: A Systematic Review. Gait Posture 2018, 62, 268–279. [Google Scholar] [CrossRef] [PubMed]
- Fox, M.D.; Delp, S.L. Contributions of Muscles and Passive Dynamics to Swing Initiation over a Range of Walking Speeds. J. Biomech. 2010, 43, 1450–1455. [Google Scholar] [CrossRef] [PubMed]
- McGinley, J.L.; Baker, R.; Wolfe, R.; Morris, M.E. The Reliability of Three-Dimensional Kinematic Gait Measurements: A Systematic Review. Gait Posture 2009, 29, 360–369. [Google Scholar] [CrossRef] [PubMed]

| Author | Design | Intervention | Population | Number of Patients | MOCAP | Main Objective |
|---|---|---|---|---|---|---|
| Kerrigan, 2000 [46] | Observational study | / | Chronic stroke | 23 | Laboratory. Optoelectronic. Vicon. SAFLo model | To define and propose clinically useful quantitative measurements of hip hiking and circumduction using a standard three-dimensional motion analysis technique. |
| Chen, 2005 [47] | Observational study | / | Chronic stroke | 6 | Laboratory. Optoelectronic. Vicon. Custom model including trunk. | To compare the gait of individuals with post-stroke hemiparesis and non-disabled controls while walking on a treadmill at matched speeds. |
| Kinsella, 2008 [48] | Observational study | / | Chronic stroke | 23 | Laboratory. Optoelectronic. Vicon. Plug In Gait model | To determine if the gait patterns of stroke participants with equinus deformity of the foot could be categorised into homogeneous subgroups using temporal distance and joint kinematic and kinetic measures. If this is the case, detail the differences in temporal distance and joint kinematics and kinetic measures between these groups. |
| Cruz, 2009 [34] * | Interventional study: pilot | With/without AFO | Chronic stroke | 9 | Laboratory. Optoelectronic. Motion analysis. Custom model (pelvis and lower limbs) | To quantify adaptive changes in the three-dimensional kinematics of the paretic lower limb and pelvis. |
| Nolan, 2010 [49] | Observational study: case report | / | Chronic stroke | 1 | Laboratory. Optoelectronic. Vicon. Plug In Gait model | To evaluate the effect of a dynamic AFO on ambulatory function during walking in one individual with post-stroke hemiplegia. |
| Sulzer, 2010 [40] ** | Interventional study | Walk with/without the assistance of a powered knee orthosis | Chronic stroke | 9 | Treadmill. Optoelectronic. Vicon. Custom model (pelvis and lower limbs) | To identify whether abnormal frontal plane behaviours are in response to local knee impairment or a manifestation of an abnormal multisegmental motor programme. |
| Cretual, 2010 [31] | Observational study | / | Hemiplegic (unspecified) | 13 | Laboratory. Optoelectronic. Vicon. Custom model (pelvis and lower limbs) | This article describes a new multivariate measure of overall gait pathology called the Gait Deviation Index (GDI). |
| Tyrell, 2011 [50] | Observational study | / | Chronic stroke | 20 | Treadmill. Optoelectronic. Vicon. Modified Cleveland Clinic model | To investigate how speed affects not only spatiotemporal gait deficits but also sagittal- and frontal-plane gait kinematics. |
| Carmo, 2012 [51] | Observational study | / | Stroke | 14 | Laboratory. Optoelectronic. Dvideo. Custom full-body model | To analyse the kinematics of arm and leg movements during the stroke gait. |
| Stanhope, 2014 [52] | Observational study | / | Chronic stroke | 21 | Treadmill. Infrared. Motion Analysis. Custom model including trunk. | To investigate the relationship between self-selected walking speed and the kinematic patterns related to paretic foot clearance during post-stroke walking. |
| Sheffler, 2014 [10] ** | Interventional study: secondary analysis of RCT | / | Chronic stroke | 108 | Laboratory. Optoelectronic. Vicon. Plug In Gait model | To evaluate, using quantitative gait analysis, the relationship between BMI and spatiotemporal, kinematic, and kinetic gait parameters in individuals with chronic hemiparesis. |
| Boudarham, 2014 [35] * | Interventional study | With/without DAFO | Chronic stroke | 12 | Laboratory. Optoelectronic. Motion Analysis. Helen Hayes model | To evaluate the effectiveness of an elastic DAFO on gait in hemiplegic patients with foot equinus due to spasticity of the triceps surae and to quantify the biomechanical adaptations induced by the DAFO on the paretic lower limb. |
| Manca, 2014 [53] | Observational study | / | Chronic stroke | 49 | Laboratory. Optoelectronic. Vicon. Total3Dgait model | To focus on the role of foot–ankle complex dysfunction in gait patterns in hemiplegic patients using a gait analysis protocol that allows full assessment of ankle–foot complex kinematics in the three planes of space. |
| Zissimopoulos, 2015 [36] ** | Interventional study | With/without AFO | Chronic stroke | 13 | Laboratory. Optoelectronic. Helen Hayes model | To investigate whether an AFO improves ML foot-placement ability during ambulation in individuals with post-stroke hemiplegia. |
| Qian, 2015 [33] * | Interventional study | Before/after training with FES on tibialis anterior and rectus femoris | 7 strokes, 1 TBI | 8 | Laboratory. Optoelectronic. Motion Analysis. Custom model including trunk. | To design and implement a multichannel dynamic functional electrical stimulation system and investigate acute effects of functional electrical stimulation of the tibialis anterior and rectus femoris on ankle and knee sagittal-plane kinematics and related muscle forces of hemiplegic gait. |
| Shin, 2015 [42] * | Interventional study | Before/after gait training with rhythmic auditory system | 11 strokes, 7 cerebral palsy | 18 | Laboratory. Optoelectronic. Vicon. Plug In Gait model | To refine the effects of gait training with RAS in order to confirm the changes in both kinematic and temporospatial characteristics in patients with hemiplegia. |
| Burpee, 2015 [54] | Observational study | / | Chronic stroke | 26 | Laboratory. Optoelectronic. Vicon. Custom model (pelvis and lower limbs) | To determine the spatiotemporal, kinematic, and kinetic characteristics of the paretic lower extremity associated with naturally occurring unsuccessful foot clearance in participants with chronic hemiparesis secondary to stroke. |
| Roche, 2015 [55] | Observational study | / | Chronic stroke | 60 | Laboratory. Optoelectronic. Motion analysis. Helen Hayes model | To evaluate the relationship between: (i) peak ankle dorsiflexion and peak hip flexion during the swing phase of the gait cycle in stroke patients using a biomechanical approach (3D-IGA); (ii) the maximal voluntary strength of the hip and ankle dorsiflexor muscles evaluated clinically and the respective peak hip flexion and peak ankle dorsiflexion in swing; (iii) the spasticity of ankle plantar flexor muscles and ankle kinematics in the sagittal plane during swing. |
| Zollo, 2015 [37] * | Interventional study: crossover | 3 walk conditions: without AFO/with dynamic AFO/with solid AFO | Chronic stroke | 10 | Laboratory. Infrared. BTS Smart System. Plug In Gait model | Comparative evaluation of two commercial AFOs with different mechanical properties (solid vs. dynamic AFO) by means of quantitative indicators of subject gait capabilities |
| Yao, 2016 [56] ** | Interventional study: pilot | / | Chronic stroke | 4 | Laboratory. Optoelectronic. Vicon. Plug In Gait model | To obtain an initial insight into kinematic and kinetic walking patterns resulting from an implanted FES system in patients with drop foot due to stroke. |
| Chantraine, 2016 [57] | Observational study | / | Chronic stroke | 26 | Laboratory. Optoelectronic. Qualisys System. Leardini model | To propose a gait classification system for adult patients with hemiparesis. |
| Awad, 2017 [41] * | Interventional study | With/without soft wearable robot | Chronic stroke | 8 | Treadmill. Infrared. Vicon. Custom model (pelvis and lower limbs) | To investigate the effects of exosuit assistance on common post-stroke gait impairments and compensations. |
| Mahtani, 2017 [58] * | Interventional study: secondary analysis of RCT | Conventional versus high-intensity stepping training | Stroke < 6 months | 36 | Treadmill. Infrared. Motion Analysis. Modified Cleveland Clinic model | To evaluate the effects of up to 10 weeks of either high-intensity stepping training or conventional interventions on gait kinematics in individuals with subacute stroke. |
| Barroso, 2017 [59] | Observational study | / | Chronic stroke | 9 | Laboratory. Optoelectronic. Vicon. Plug In Gait model | To test the hypothesis that the combination of muscle synergies and biomechanical analysis will improve the functional assessment of walking performance post-stroke when compared to current clinical scales. The achievement of this goal could represent a key step towards a better quantitative assessment of walking post-stroke, and a deeper understanding of the cause-and-effect relationships between internal mechanisms and resulting functional performance. |
| Nikamp, 2017 [38] * | Interventional study: RCT | With/without AFO | Stroke < 6 weeks | 33 | Laboratory. Optoelectronic. Vicon. Modified Helen Hayes model | To study the effects of providing AFOs on two different moments in rehabilitation, early post-stroke. |
| Nikamp, 2018 [39] * | Interventional study: RCT | With/without AFO | Stroke < 6 weeks | 26 | Laboratory. Optoelectronic. Vicon. Modified Helen Hayes model | To study whether the patterns of recovery over time in terms of kinematics differed between early and delayed provision, and to study whether possible changes in kinematics or walking speed during the 26-week follow-up period differed between the groups. |
| Wang, 2018 [60] * | Interventional study: secondary analysis of RCT | Acupuncture | Stroke > 1–3 months | 30 | Laboratory. Infrared. Eagle 4, Motion Analysis. Custom model (pelvis and lower limbs) | To investigate the effect of acupuncture on changes in gait pattern associated with motor recovery in intracerebral haemorrhage patients. |
| Reissman, 2018 [43] * | Interventional study | Before/after treadmill rehabilitation with cross-tilt | Chronic stroke | 12 | Treadmill. Infrared. Motion Analysis. Custom model including trunk and head. | To explore whether a training paradigm that increases the demand for toe clearance during swing would enhance the ability to perform selective control between frontal and sagittal plane degrees-of-freedom, expressed as kinematic changes post-exposure. |
| Akbas, 2019 [61] ** | Interventional study | Constrained stiff–knee gait in healthy subjects versus post-stroke subject gait analysis | Chronic stroke | 9 from a previous study (Sulzer, 2010 [40]) | Treadmill. Optical motion capture system (PhaseSpace Motion Capture, San Leandro, CA). Custom model (pelvis and lower limbs) | To simulate the kinematic constraints of those with SKG in unimpaired individuals and then compare against recorded data collected from participants with post-stroke SKG in a previous study. |
| Dean, 2020 [62] | Observational study | / | Chronic stroke | 29 | Dual-belt instrumented treadmill. 12-camera. Vicon. Custom full-body model | To investigate whether post-stroke changes in paretic propulsion magnitude or timing influence the swing phase kinematics of the paretic leg. |
| Silva, 2020 [32] | Observational study: retrospective | / | Unspecified | 34 | Laboratory. Optoelectronic. Vicon. Model not specified | To determine which gait parameters are associated with higher velocity in stroke patients with spastic paresis. |
| Van Criekinge, 2020 [63] | Observational study | / | Stroke < 6 months | 57 | Laboratory. Optoelectronic. Vicon. Plug In Gait model | To identify trunk abnormalities and differentiate between primary deviations and secondary compensations as far as possible, given that such differentiation is difficult to establish. |
| Daryabor, 2020 [19] | Observational study: case series | Walking with/without AFO | Chronic stroke | 2 | Laboratory. Optoelectronic. Vicon. Plug In Gait model | To design and evaluate a new articulated AFO incorporating a spring to determine its efficacy on spatiotemporal parameters, kinematics, and kinetics of lower-limb joints in two stroke patients. |
| Haruyama, 2021 [64] | Observational study | / | Chronic stroke | 42 | Laboratory. Optoelectronic. Vicon. Plug In Gait model | To provide a kinematic representative value by quantifying PTD and to clarify the PTD characteristics of hemiplegic gait compared to those of healthy subjects. |
| Sekiguchi, 2022 [65] | Observational study | On an even surface/on artificial grass | Post stroke | 14 | Laboratory, Optoelectronic, Mac 3D. Custom full-body model | To examine stepping patterns during gait on uneven surfaces in post-stroke patients and their relationship with real-world walking activity. |
| Nedergard, 2022 [30] | Observational study | / | Stroke > 3 months | 31 | Laboratory, Optoelectronic, Oqus. Custom full-body model | To contribute towards such a consensus by identifying a core set of a few kinematic variables to discriminate post-stroke gait from the gait of non-disabled controls. |
| Dumont-Casalechi, 2022 [45] * | Interventional study: RCT | Before/after PBMT–SMF | Chronic stroke > 6 months | 10 | Laboratory, Optoelectronic, SMART-D140. Plug In Gait model | To test different doses of PBMT–SMF, to identify the ideal dose to trigger immediate effects on the spatiotemporal and kinematic variables of gait in post-stroke individuals. |
| Dumont-Cimolin, 2022 [44] * | Interventional study: RCT | Before/after TDCs with treadmill training | Chronic stroke | 14 | Laboratory, Optoelectronic, SMART-D 140. Plug In Gait model | To investigate the effects of a single session and 10 sessions of anodal tDCS combined with treadmill training on spatiotemporal and kinematic gait variables in stroke survivors and determine whether these effects are maintained one month after the 10-session intervention has been completed. |
| Steffensen, 2023 [66] | Observational study: case series | / | Chronic stroke | 3 | Laboratory, Optoelectronic, Oqus. Custom model including trunk. | To quantify kinematic differences between marker-based and marker-less motion capture systems in individuals with impaired gait. |
| Kettlety, 2023 [67] | Observational study: secondary analysis of previous cross-sectional studies | / | Chronic post-stroke > 6 months | 28 | Treadmill. Optoelectronic. Vicon. Modified Cleveland Clinic model | To demonstrate the effect of fast walking on gait kinematics post-stroke relative to neurotypical adults, and to further define the advantages and limitations of this intervention in addressing gait biomechanics post-stroke. |
| Name of Biomarker | Definition of Biomarker |
|---|---|
| Hip_ROM_Sw | Hip ROM during swing |
| Hip_Max_Sw | Max hip flexion during swing phase |
| Hip_Toe-off | Hip flexion at toe-off |
| Hip_Max_TermSw | Max flexion at terminal swing |
| Hip_Max_Cycle | Max hip flexion during cycle |
| Knee_ROM_Sw | Knee flexion ROM during swing |
| Knee_Max_Sw | Max knee flexion during swing phase |
| Knee_Toe-off | Knee flexion at toe-off |
| Knee_Max_MidSw | Knee flexion at mid-swing |
| Knee_Max_Cycle | Max knee flexion during cycle |
| Ankle_ROM_Sw | Max ankle DF during swing |
| Ankle_Max_Sw | Ankle ROM during swing |
| Ankle_MidSw | Ankle angle at mid-swing |
| Min_PTD_Sw | Minimal pelvic–toe distance |
| Sag_Clear_Angle | Sagittal clearance angle |
| ToeClear_M5_MidSw | Vertical height of the marker placed on M5 relative to the foot flat on the ground at mid-swing |
| ToeClear_Max_Sw | Maximal toe clearance during swing (vertical displacement of the M2 toe marker) |
| ToeClear_Min_Sw | Minimal toe clearance during swing (vertical displacement of the M2 toe marker) |
| Front_Clear_Angle | Frontal clearance angle |
| HipAbd_ROM_Sw | Hip abduction ROM during swing |
| HipAbd_Max_Sw | Max hip abduction during swing |
| HipAbd_Max_Cycle | Max hip abduction during cycle |
| HipAbd_MidSw | Hip abduction at mid-swing |
| ThighAbd_Max_Sw | Max thigh abduction during swing |
| ThighAbd_Max_Cycle | Max thigh abduction during cycle |
| ThighAbd_MidSw | Thigh abduction at mid-swing |
| AnkleLateralDisp_Max_Sw | Max ankle lateral displacement during swing |
| AnkleLateralDisp_Max_Cycle | Max ankle lateral displacement during cycle |
| FootLateralDisp_Max_Sw | Max foot lateral displacement during swing |
| FootLateralDisp_Max_Cycle | Max foot lateral displacement during cycle |
| FootLateralDisp_MinToeClear | Foot lateral displacement at minimal toe clearance |
| PelvObl_ROM_Sw | Pelvic obliquity ROM during swing |
| PelvObl_Max_Sw | Max pelvic obliquity during swing |
| PelvObl_MidSw | Pelvic obliquity at mid-swing |
| HipHiking_Max_Sw | Hip hiking, defined as the vertical position of the ASIS marker calculated during quiet standing, was compared with the maximal vertical position during the swing phase |
| HipRot_ROM_Sw | Hip rotation ROM during swing |
| HipER_Max_Sw | Max hip external rotation during swing |
| PelvPostRot_Max_Sw | Maximal pelvic rotation during swing |
| PelvRot_MidSw | Pelvic backward rotation at mid-swing |
| Vault | Non-paretic max ankle plantar flexion during stance |
| Pre- and Post-Intervention Analyses | With and Without Orthosis Analysis | |||||||||||||
|---|---|---|---|---|---|---|---|---|---|---|---|---|---|---|
| Classes of size effects | n | <−0.8 | −0.8 to –0.2 | −0.2 to 0 | 0 to 0.2 | 0.2 to 0.8 | >0.8 | n | <−0.8 | −0.8 to –0.2 | −0.2 to 0 | 0 to 0.2 | 0.2 to 0.8 | >0.8 |
| Biomarkers of Limb Shortening | ||||||||||||||
| Hip ToeOff | 5 | 1 (20%) [1] | 3 (60%) [1] | 1 (20%) | 6 | 1 (17%) [1] | 3 (50%) | 2 (33%) | ||||||
| Hip Max Sw | 8 | 3 (38%) | 2 (25%) | 1 (13%) | 2 (25%) | 8 | 1 (13%) | 7 (88%) | ||||||
| Hip Max Cycle | 2 | 2 (100%) | 0 | |||||||||||
| Hip ROM Sw | 0 | 2 | 1 (50%) | 1 (50%) | ||||||||||
| Knee ToeOff | 4 | 1 (25%) | 2 (50%) | 1 (25%) | 6 | 1 (17%) | 3 (50%) | 2 (33%) | ||||||
| Knee Max Sw | 18 | 3 (17%) | 8 (44%) | 4 (22%) | 3 (17%) [3] | 9 | 1 (11%) [1] | 2 (22%) | 2 (22%) | 4 (44%) | ||||
| Knee Max Cycle | 3 | 1 (33%) | 2 (67%) | 0 | ||||||||||
| Ankle Max Sw | 17 | 1 (6%) | 2 (12%) | 3 (18%) | 9 (53%) [1] | 2 (12%) [2] | 10 | 1 (10%) | 7 (70%) [4] | 2 (20%) [2] | ||||
| Ankle ROM Sw | 0 | 2 | 2 (100%) | |||||||||||
| ToeClear Min Sw | 0 | 1 | 1 (100%) | |||||||||||
| Biomarkers of Compensatory Movement | ||||||||||||||
| PelvObl Max Sw | 4 | 1 (25%) | 3 (75%) | 7 | 2 (29%) | 5 (71%) | ||||||||
| PelvObl ROM Sw | 0 | 2 | 2 (100%) | |||||||||||
| HipHiking Max Sw | 0 | 1 | 1 (100%) | |||||||||||
| HipAbd Max Sw | 4 | 1 (25%) [1] | 3 (75%) | 5 | 2 (40%) | 2 (40%) | 1 (20%) | |||||||
| HipAbd Mid Sw | 1 | 1 (100%) | 0 | |||||||||||
| HipAbd ROM Sw | 0 | 2 | 2 (100%) | |||||||||||
| HipAbd Max Cycle | 15 | 1 (7%) [1] | 2 (13%) | 4 (27%) | 6 (40%) | 2 (13%) [2] | 0 | |||||||
| FootLateralDisp Max Sw | 0 | 1 | 1 (100%) | |||||||||||
| FootLateralDisp Max Cycle | 1 | 1 (100%) [1] | 0 | |||||||||||
| AnkleLateralDisp Max Cycle | 3 | 2 (67%) | 1 (33%) [1] | 0 | ||||||||||
| HipER Max Sw | 1 | 1 (100%) | 0 | |||||||||||
| Joints and Segments | Shortening Biomarkers | Compensatory Biomarkers | Standard Name of Compensation | |
|---|---|---|---|---|
| Sagittal plane | Hip | Maximal flexion during swing | Maximal flexion during swing | Stepping |
| Thigh | Maximal elevation angle during swing | Maximal elevation angle during swing | ||
| Knee | Maximal flexion during swing | Maximal flexion during swing | ||
| Ankle | Maximal dorsiflexion during swing | Contralateral angle at mid-stance | Vaulting | |
| Limb length | Minimal hip–toe distance during swing normalised by bilateral stance (%) | |||
| Frontal plane | Pelvis | Maximal pelvic upward obliquity during swing | Hip hiking | |
| Maximal elevation of the hip during swing compared to its position during the previous stance (cm) | Hip hiking + vaulting | |||
| Hip | Maximal hip abduction during swing | Circumduction | ||
| Thigh | Maximal thigh abduction during swing | |||
| Ankle | Maximal ankle lateral displacement during swing (cm) | |||
| Transversal plane | Hip | Maximal lateral rotation during swing | ||
| Pelvis | Maximal posterior rotation during swing | Pelvic posterior rotation |
Disclaimer/Publisher’s Note: The statements, opinions and data contained in all publications are solely those of the individual author(s) and contributor(s) and not of MDPI and/or the editor(s). MDPI and/or the editor(s) disclaim responsibility for any injury to people or property resulting from any ideas, methods, instructions or products referred to in the content. |
© 2025 by the authors. Licensee MDPI, Basel, Switzerland. This article is an open access article distributed under the terms and conditions of the Creative Commons Attribution (CC BY) license (https://creativecommons.org/licenses/by/4.0/).
Share and Cite
Montané, E.; Lopez, L.; Scandella, M.; Gasq, D.; Cormier, C. Kinematic Biomarkers of Limb Shortening and Compensations in Hemiparetic Gait: A Systematic Review. Sensors 2025, 25, 4598. https://doi.org/10.3390/s25154598
Montané E, Lopez L, Scandella M, Gasq D, Cormier C. Kinematic Biomarkers of Limb Shortening and Compensations in Hemiparetic Gait: A Systematic Review. Sensors. 2025; 25(15):4598. https://doi.org/10.3390/s25154598
Chicago/Turabian StyleMontané, Emmeline, Lucille Lopez, Marino Scandella, David Gasq, and Camille Cormier. 2025. "Kinematic Biomarkers of Limb Shortening and Compensations in Hemiparetic Gait: A Systematic Review" Sensors 25, no. 15: 4598. https://doi.org/10.3390/s25154598
APA StyleMontané, E., Lopez, L., Scandella, M., Gasq, D., & Cormier, C. (2025). Kinematic Biomarkers of Limb Shortening and Compensations in Hemiparetic Gait: A Systematic Review. Sensors, 25(15), 4598. https://doi.org/10.3390/s25154598