


Low-Cost Strain-Gauge Force-Sensing Sidestick for 6-DoF Flight Simulation: Design and Human-in-the-Loop Evaluation

Abstract
1. Introduction
2. Materials and Methods
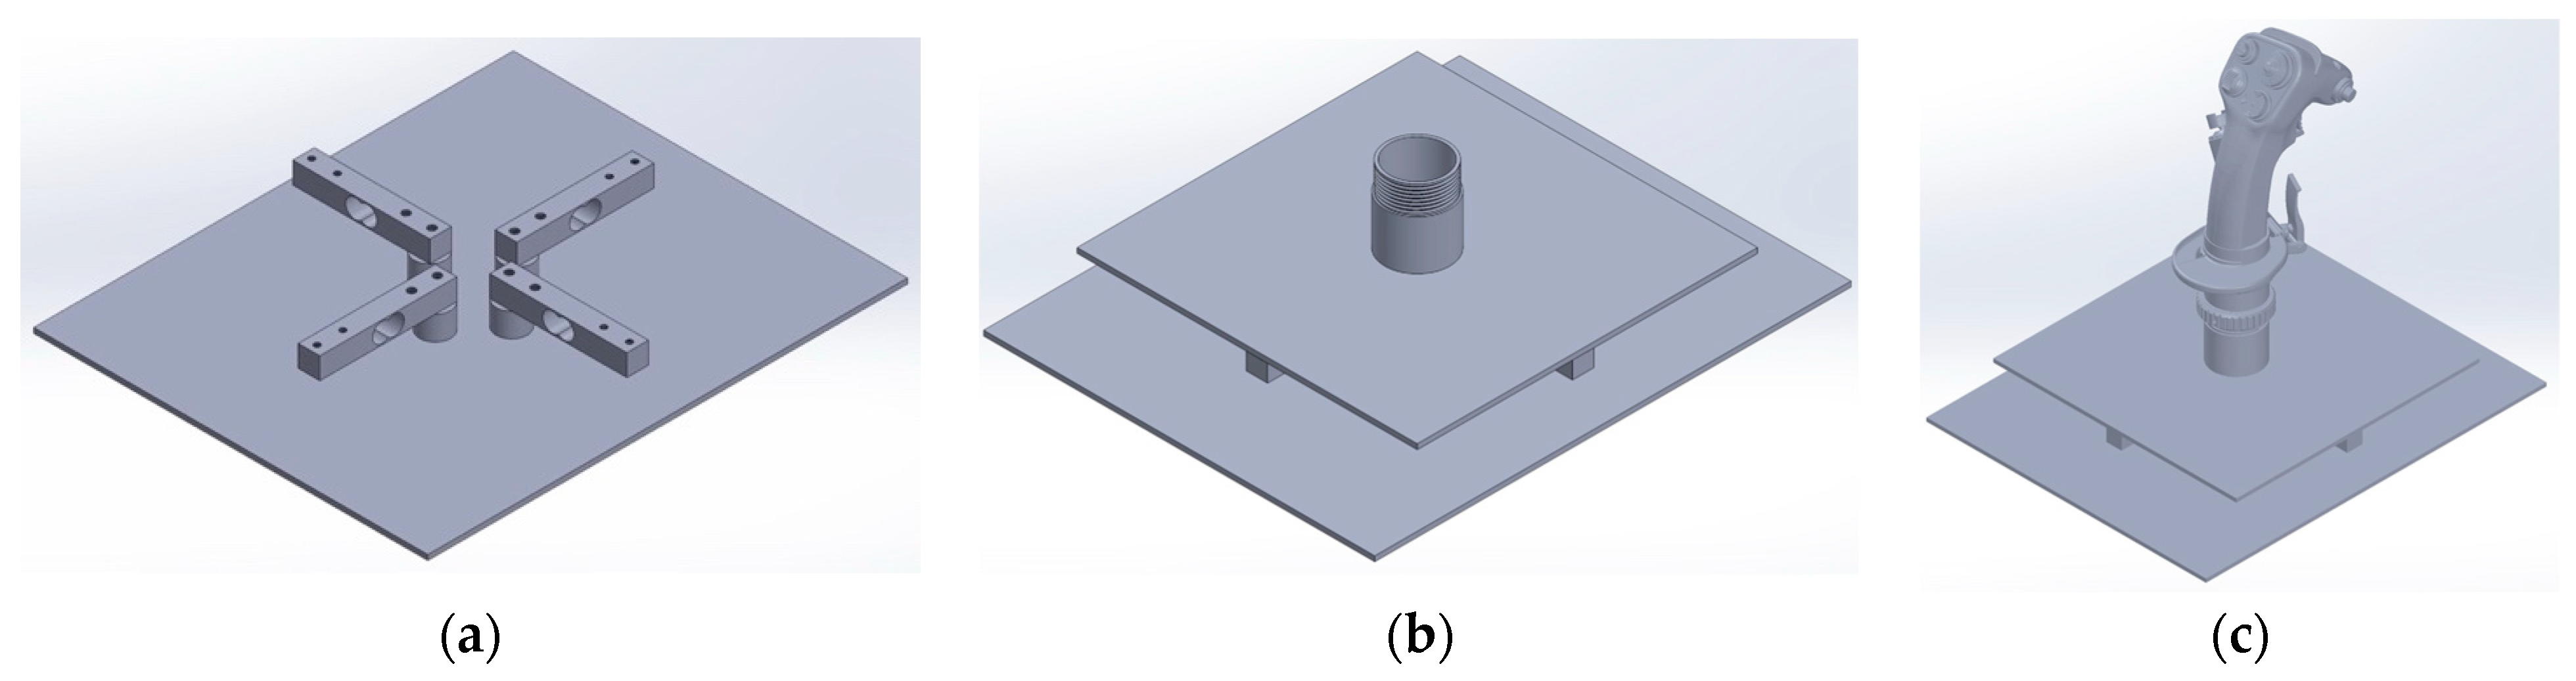
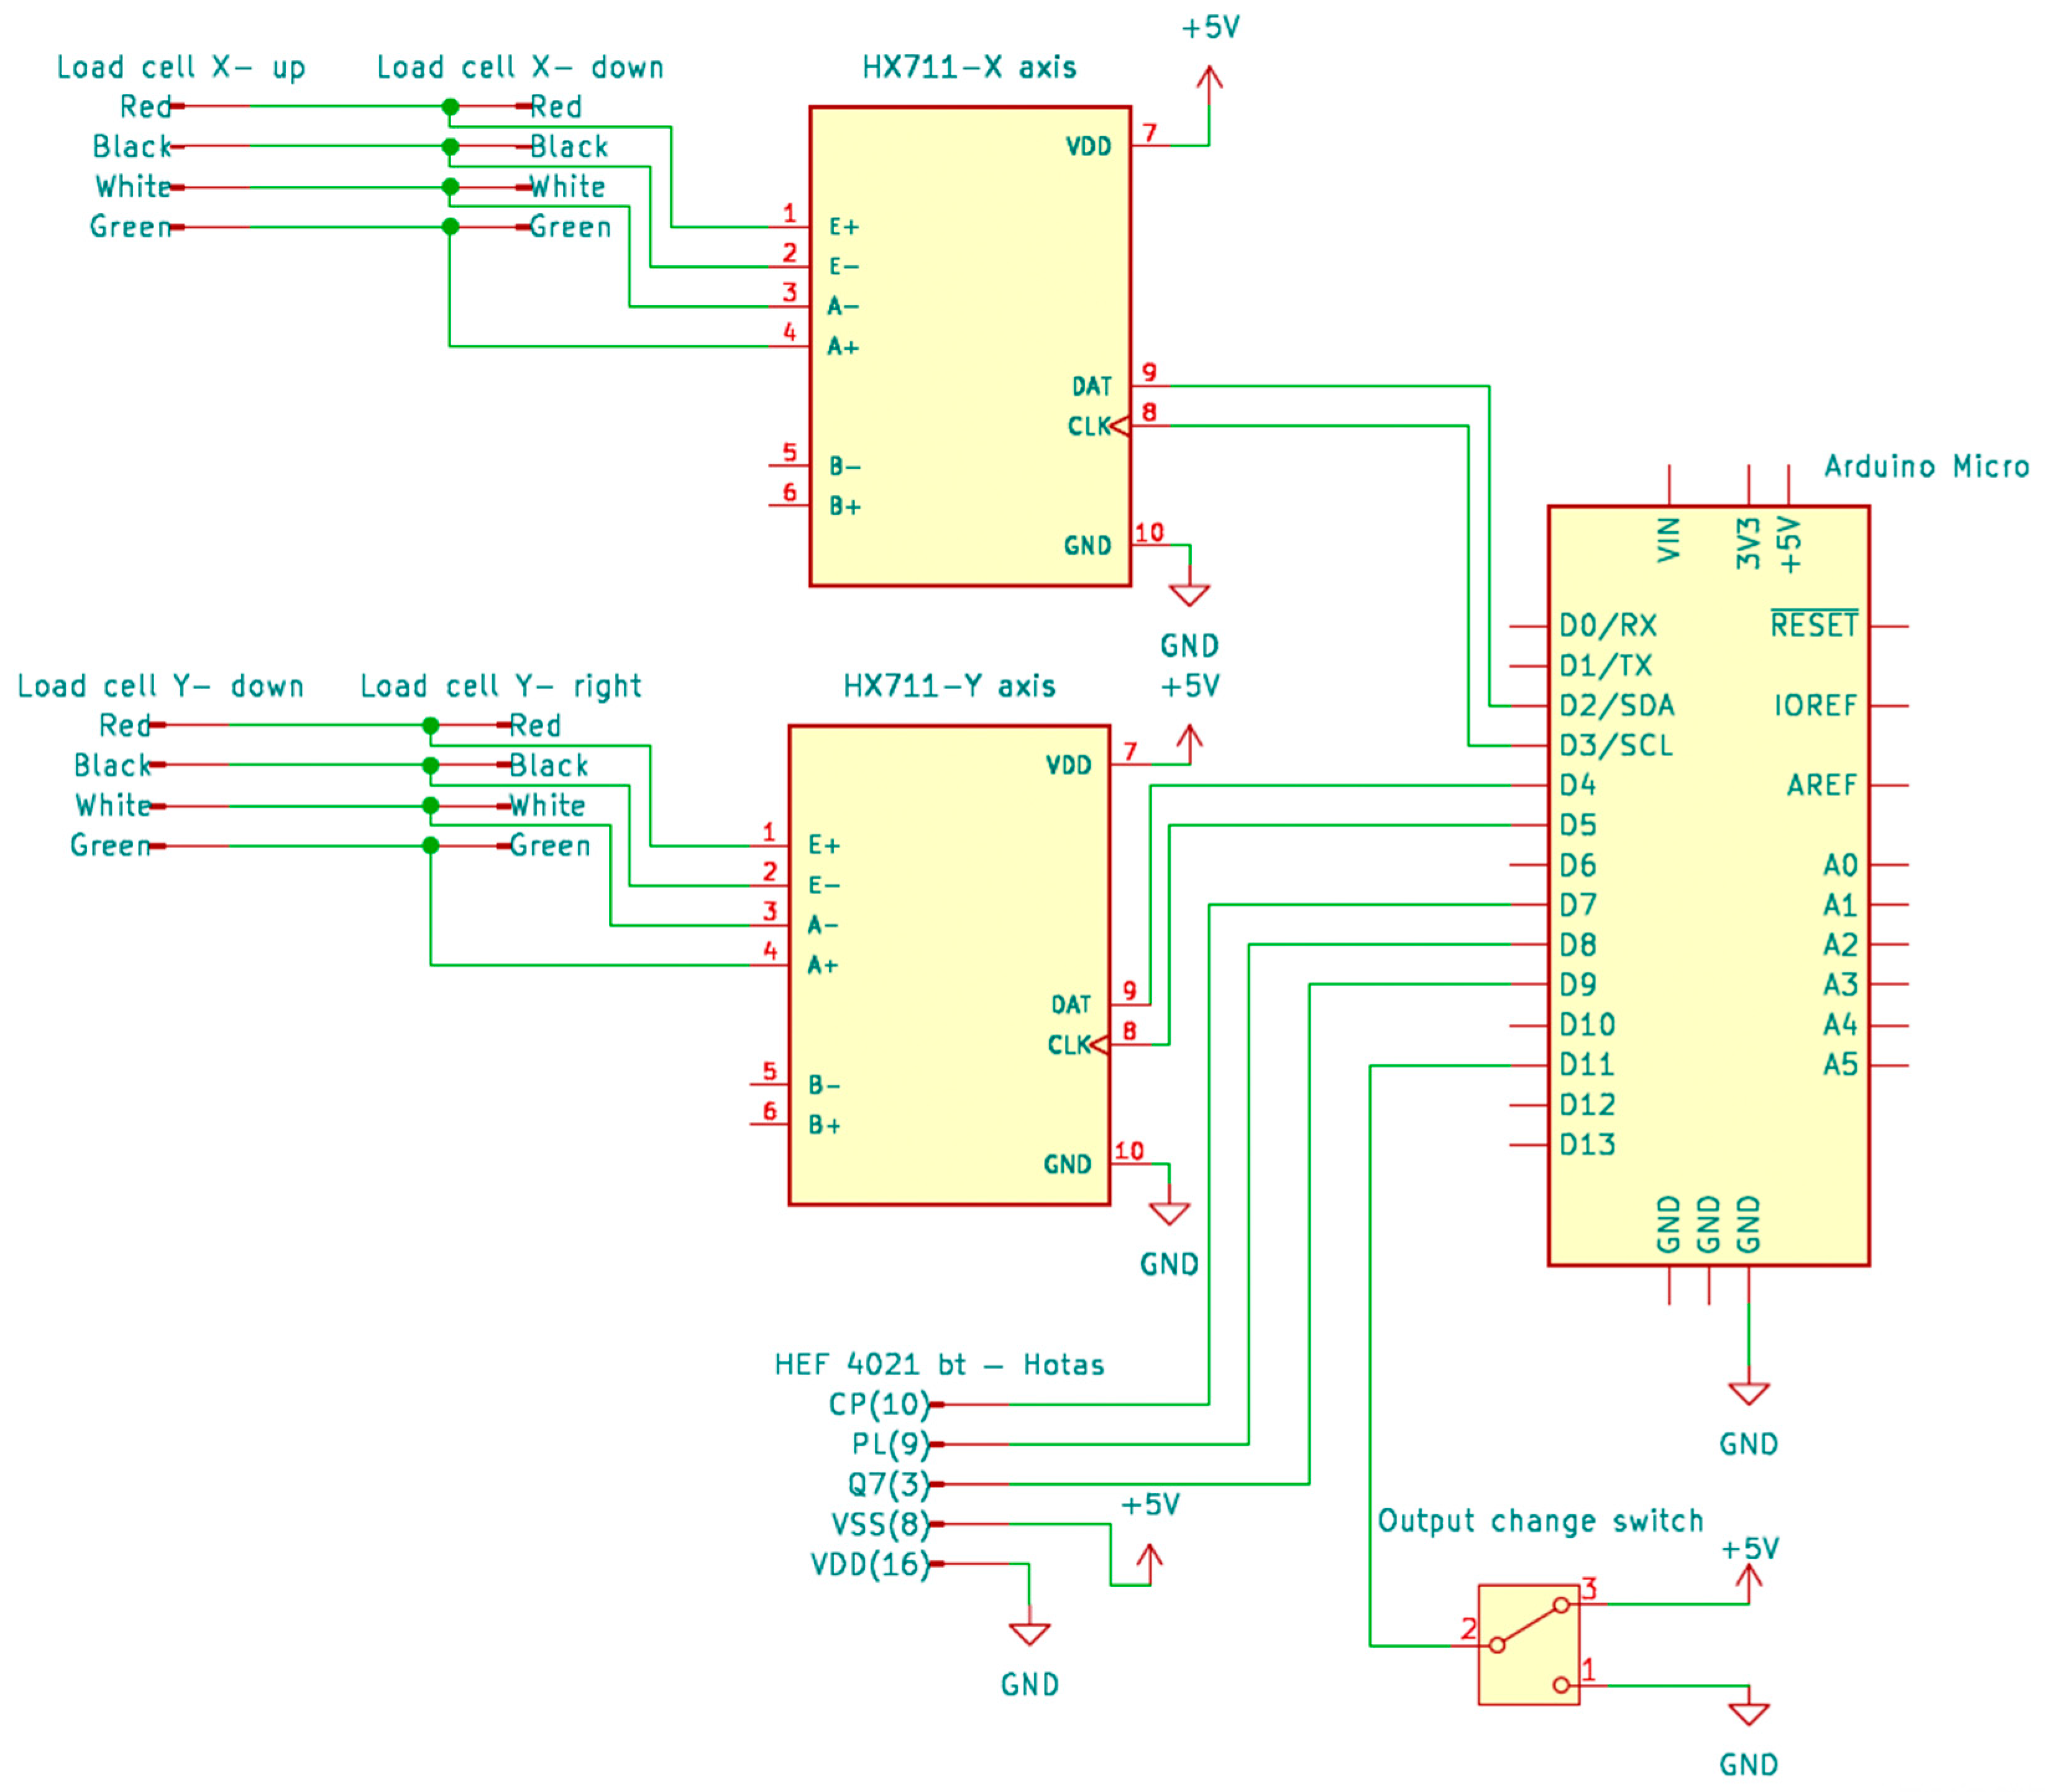
2.1. Sidestick Design and Hardware Implementation
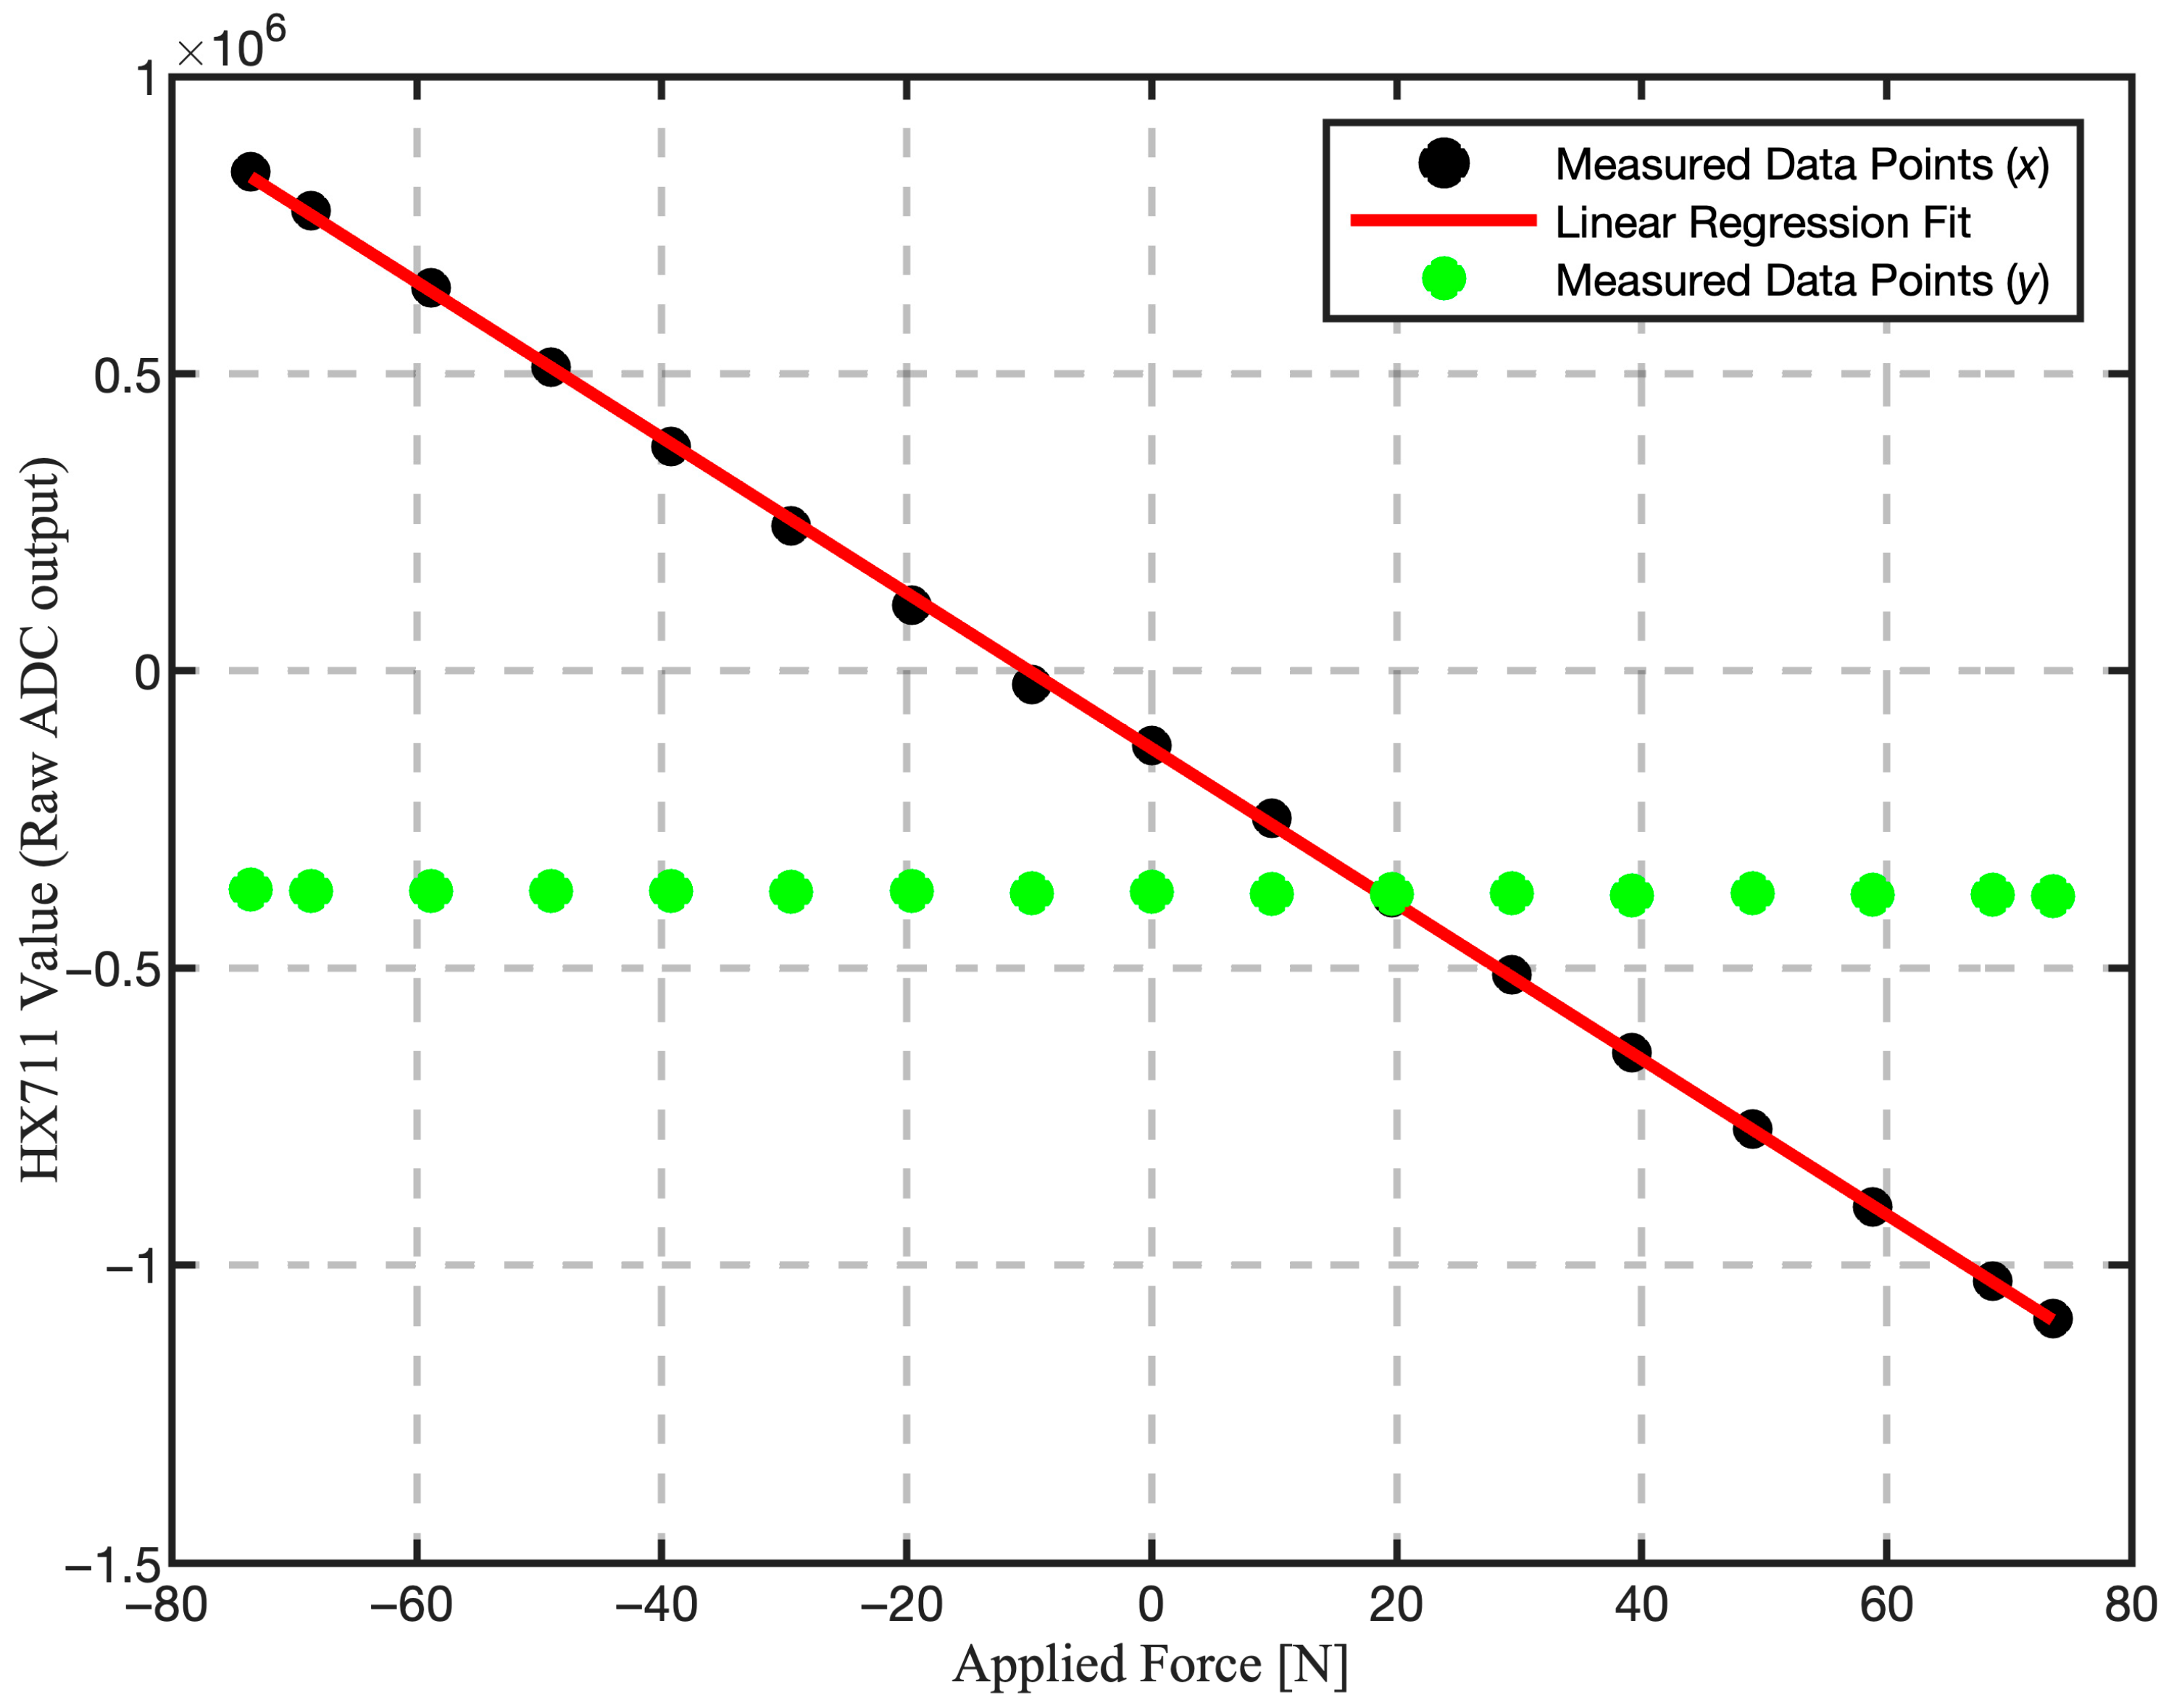
2.2. Calibration Process
2.3. Experimental Protocol
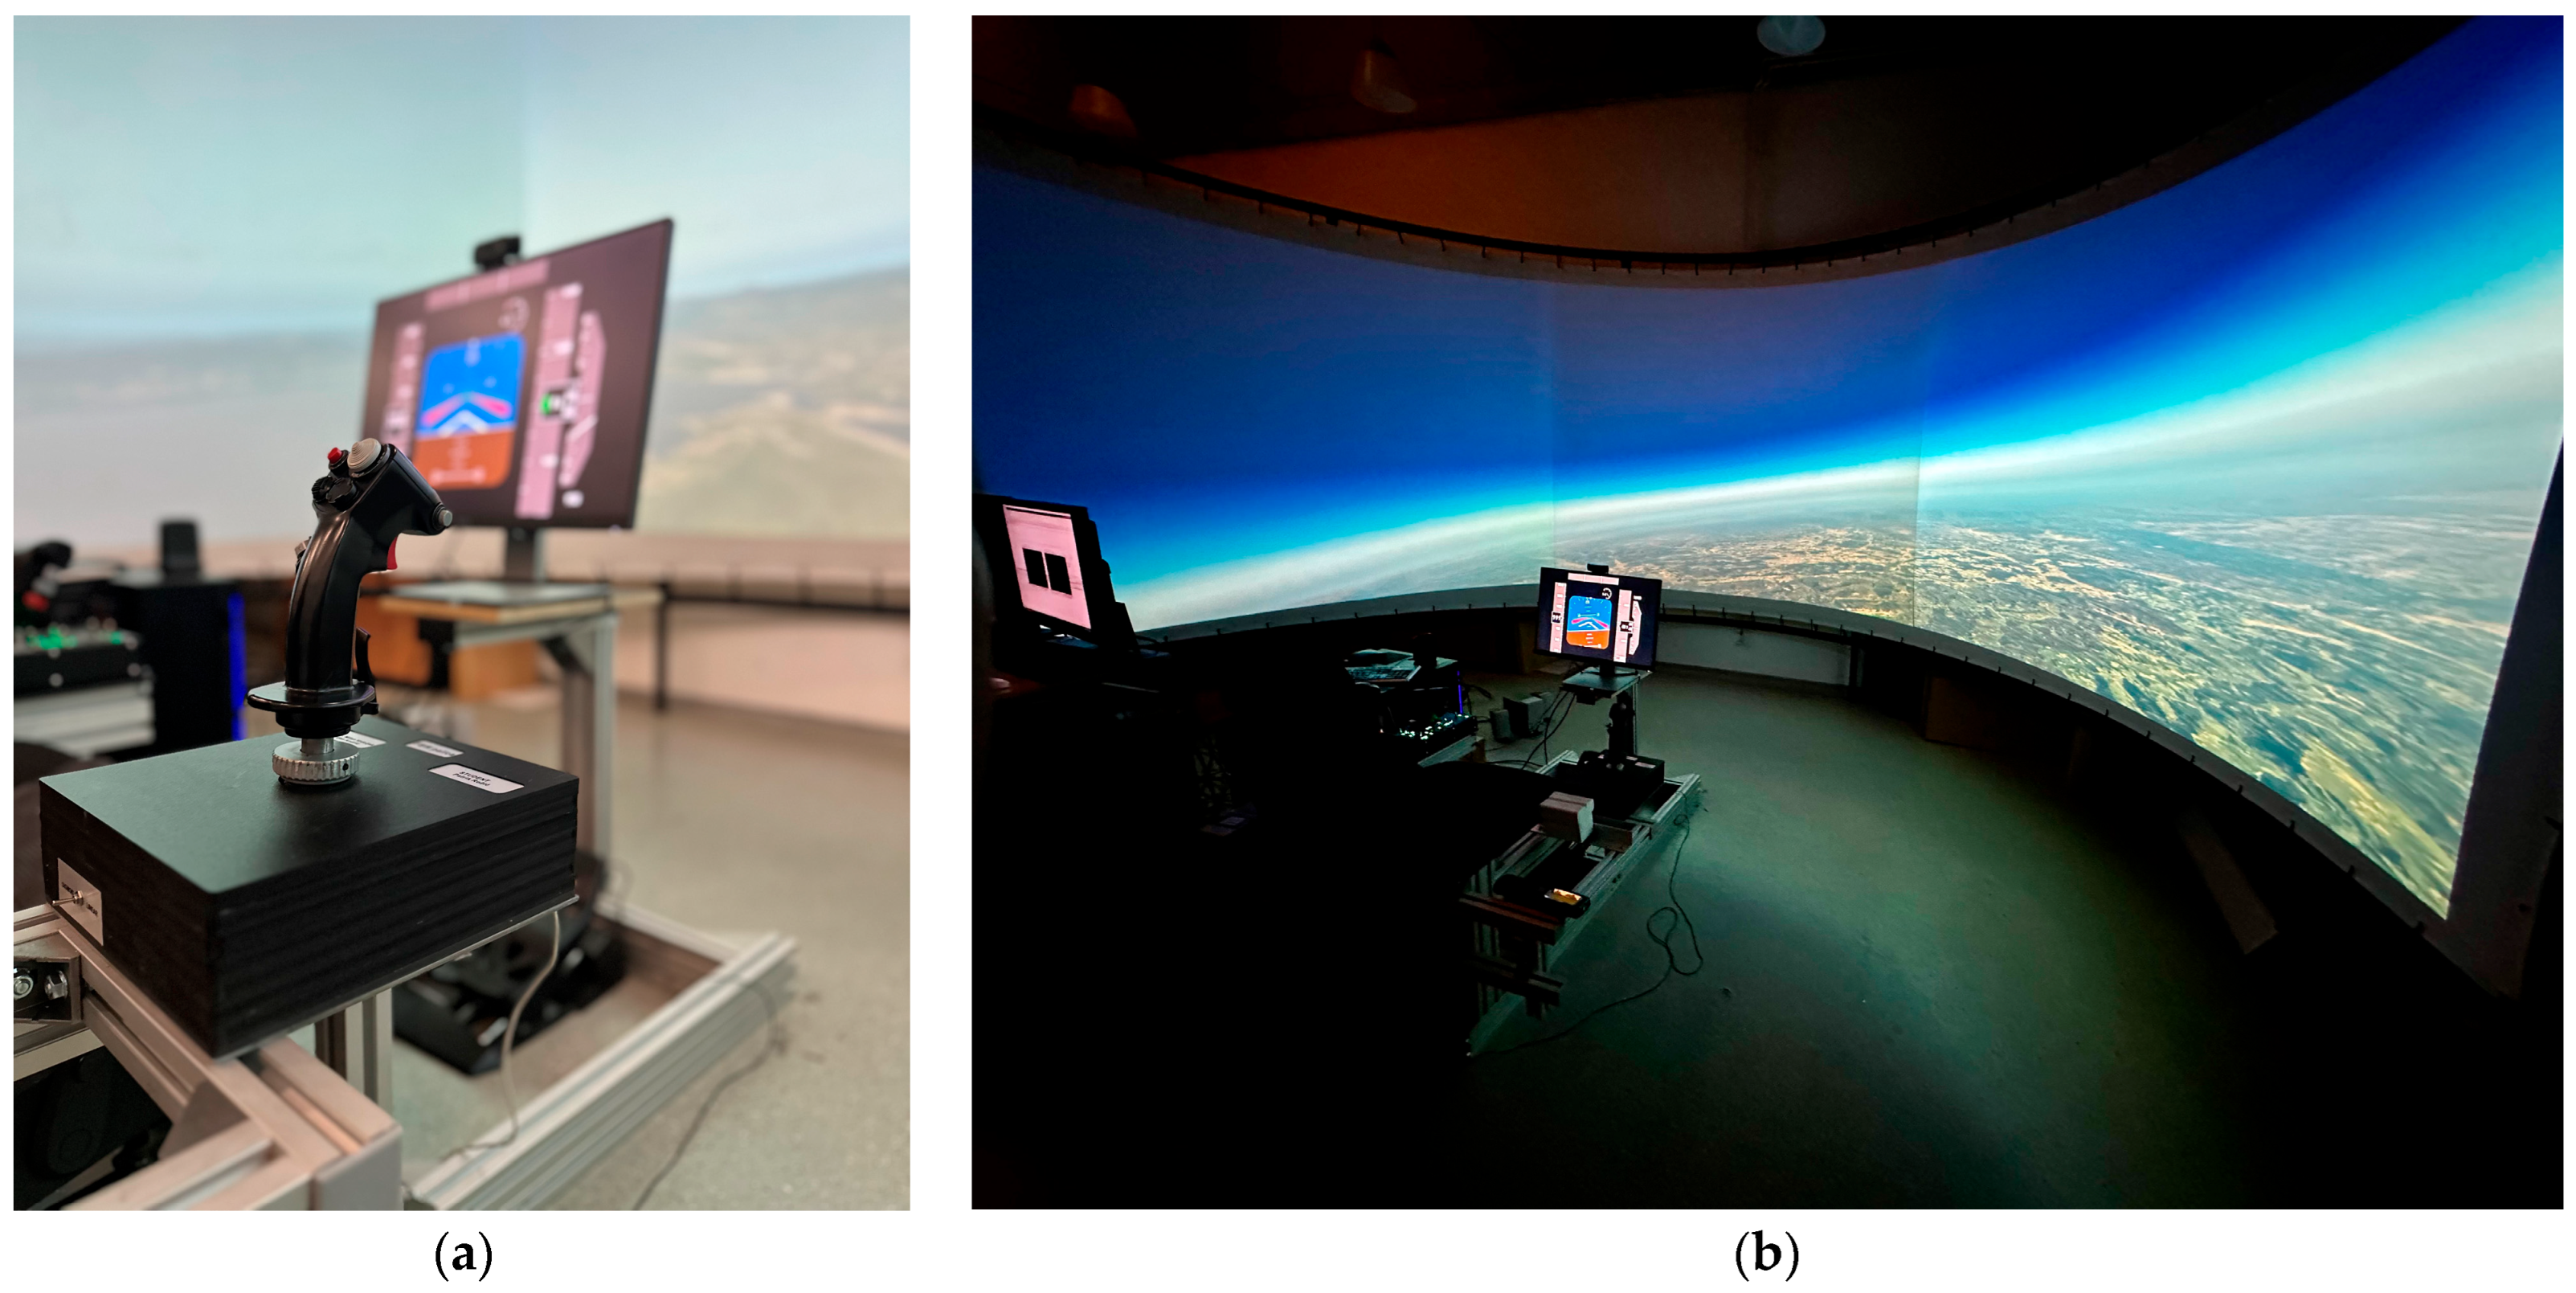
2.3.1. Research Flight-Simulator Facility
2.3.2. Participants
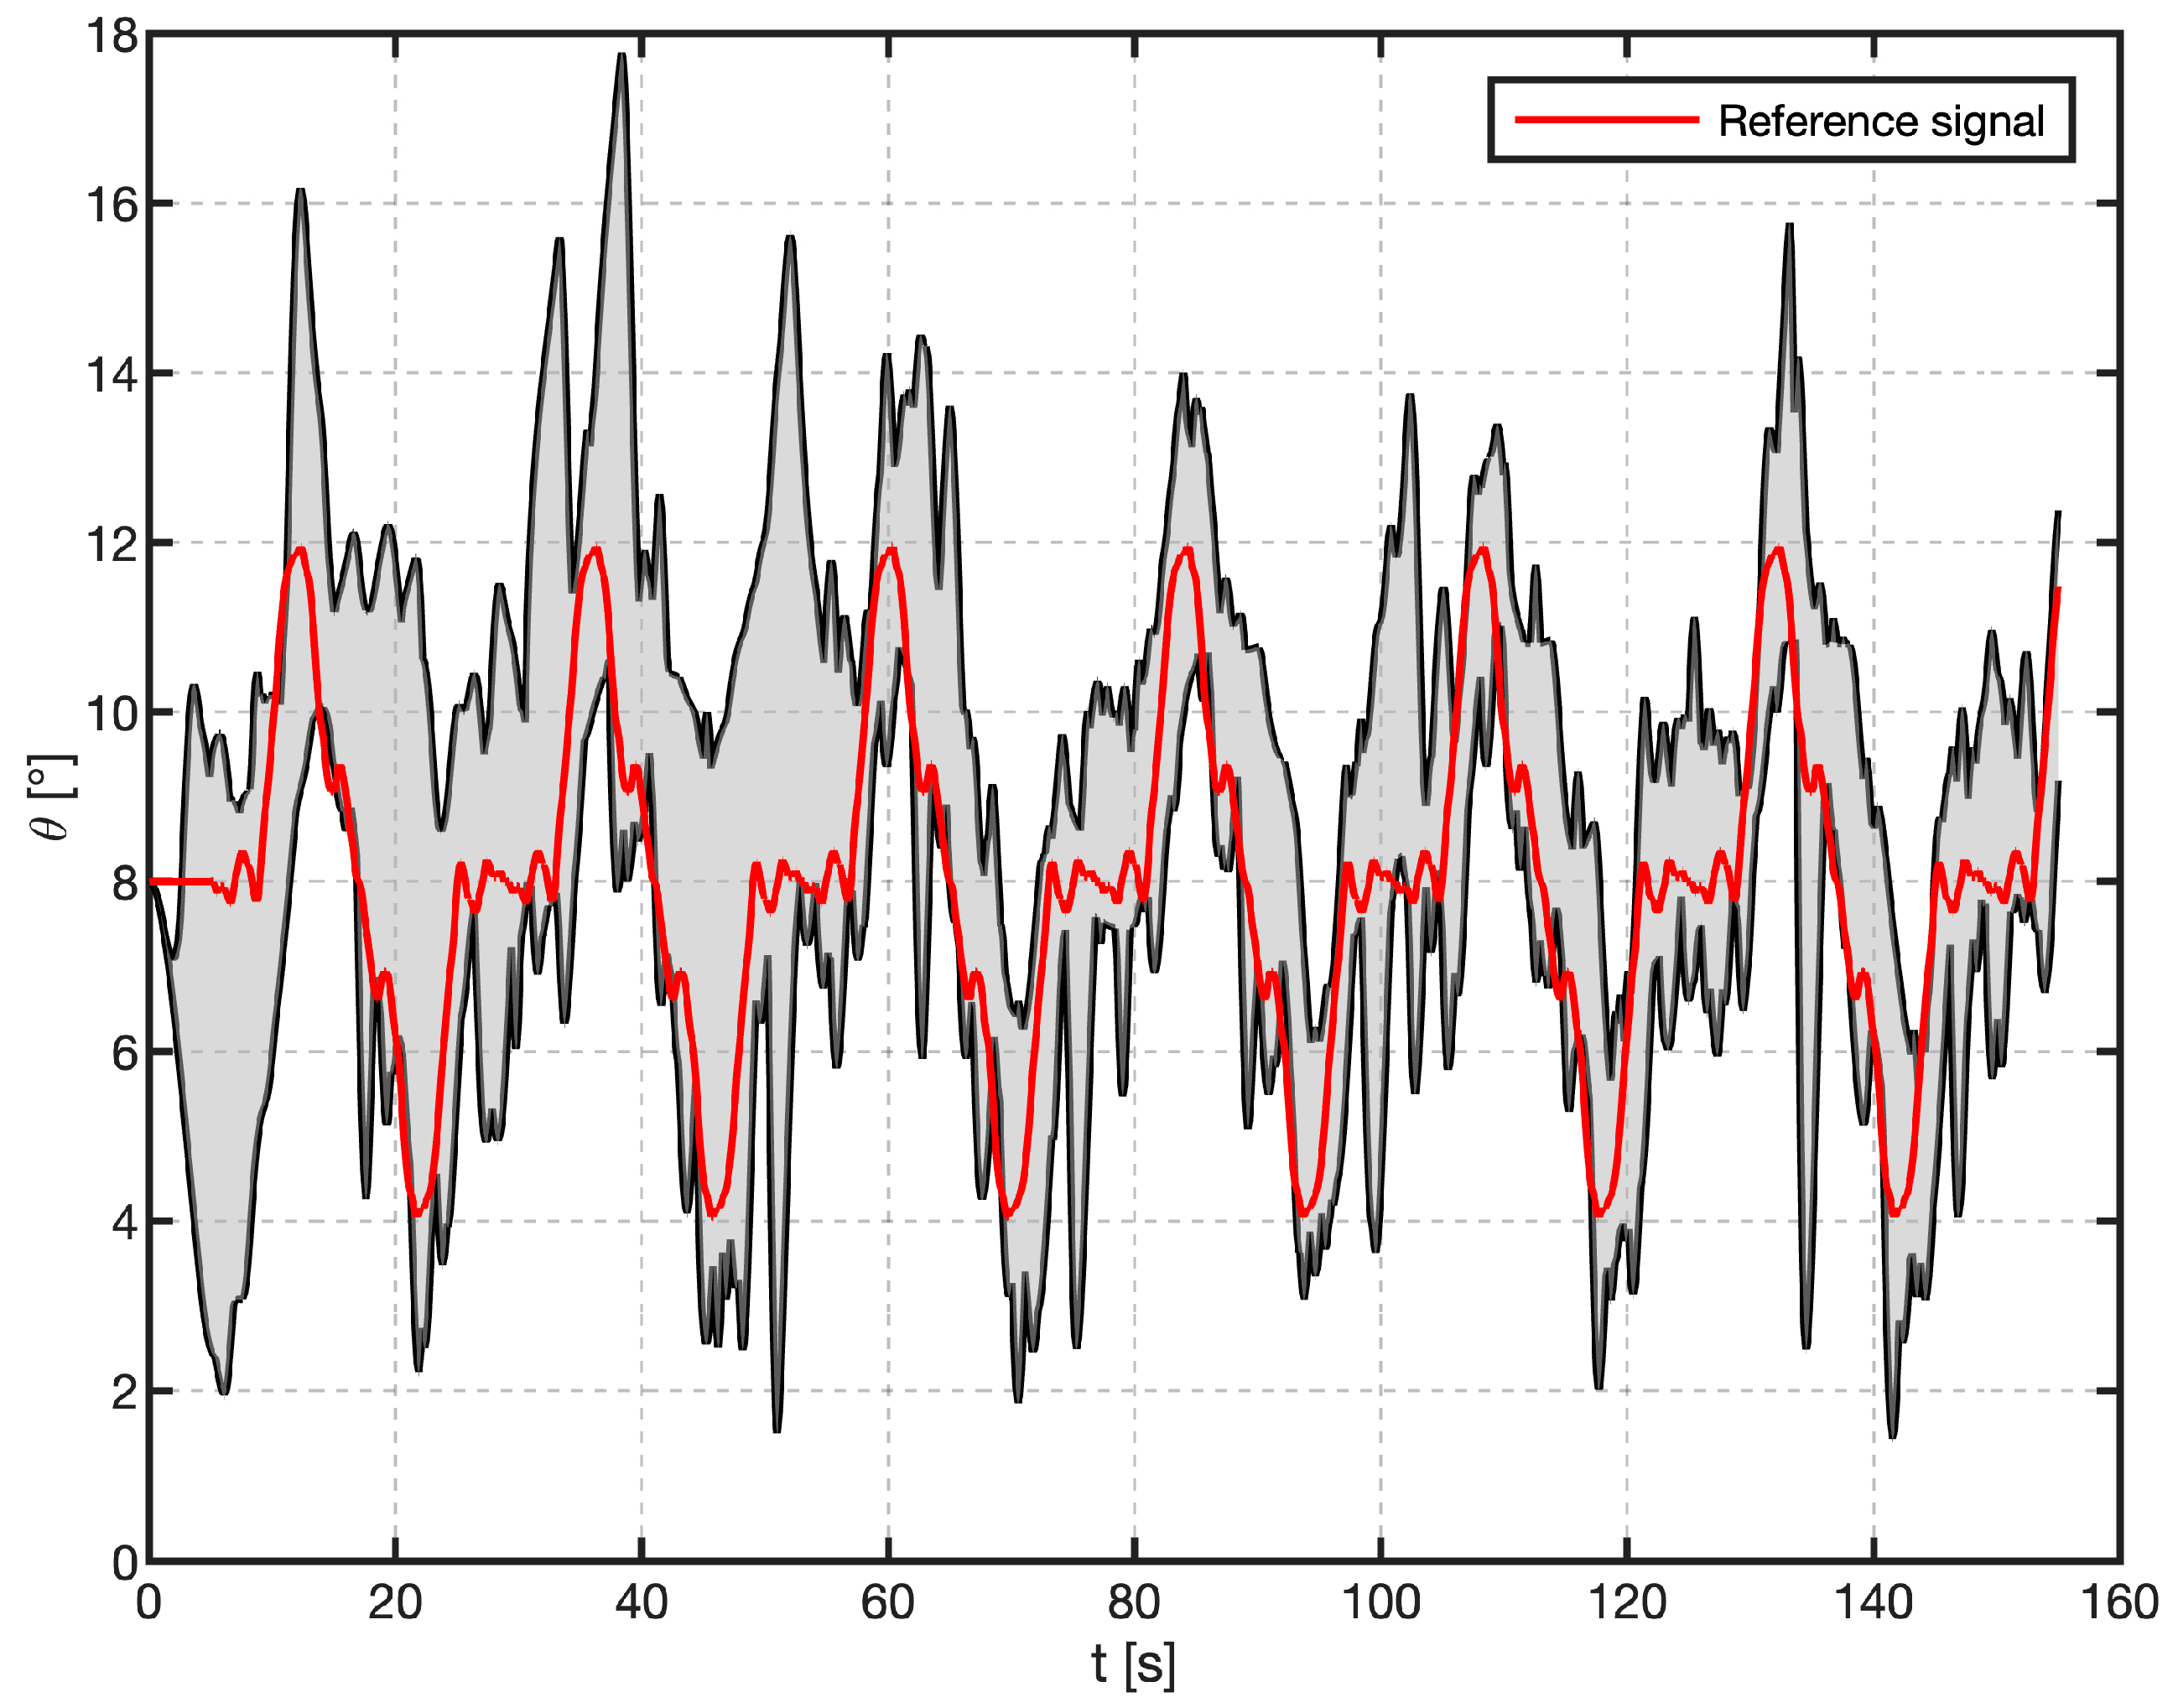
2.3.3. Task and Procedure
- is the time-varying reference pitch angle (in degrees);
- , and represent the amplitude, frequency, and phase shift in each component;
- is an offset added to emulate the nominal trimmed pitch attitude of the simulated aircraft.
- N is the total number of samples,
- μ is the mean value of the difference.
3. Results
3.1. Objective Analysis
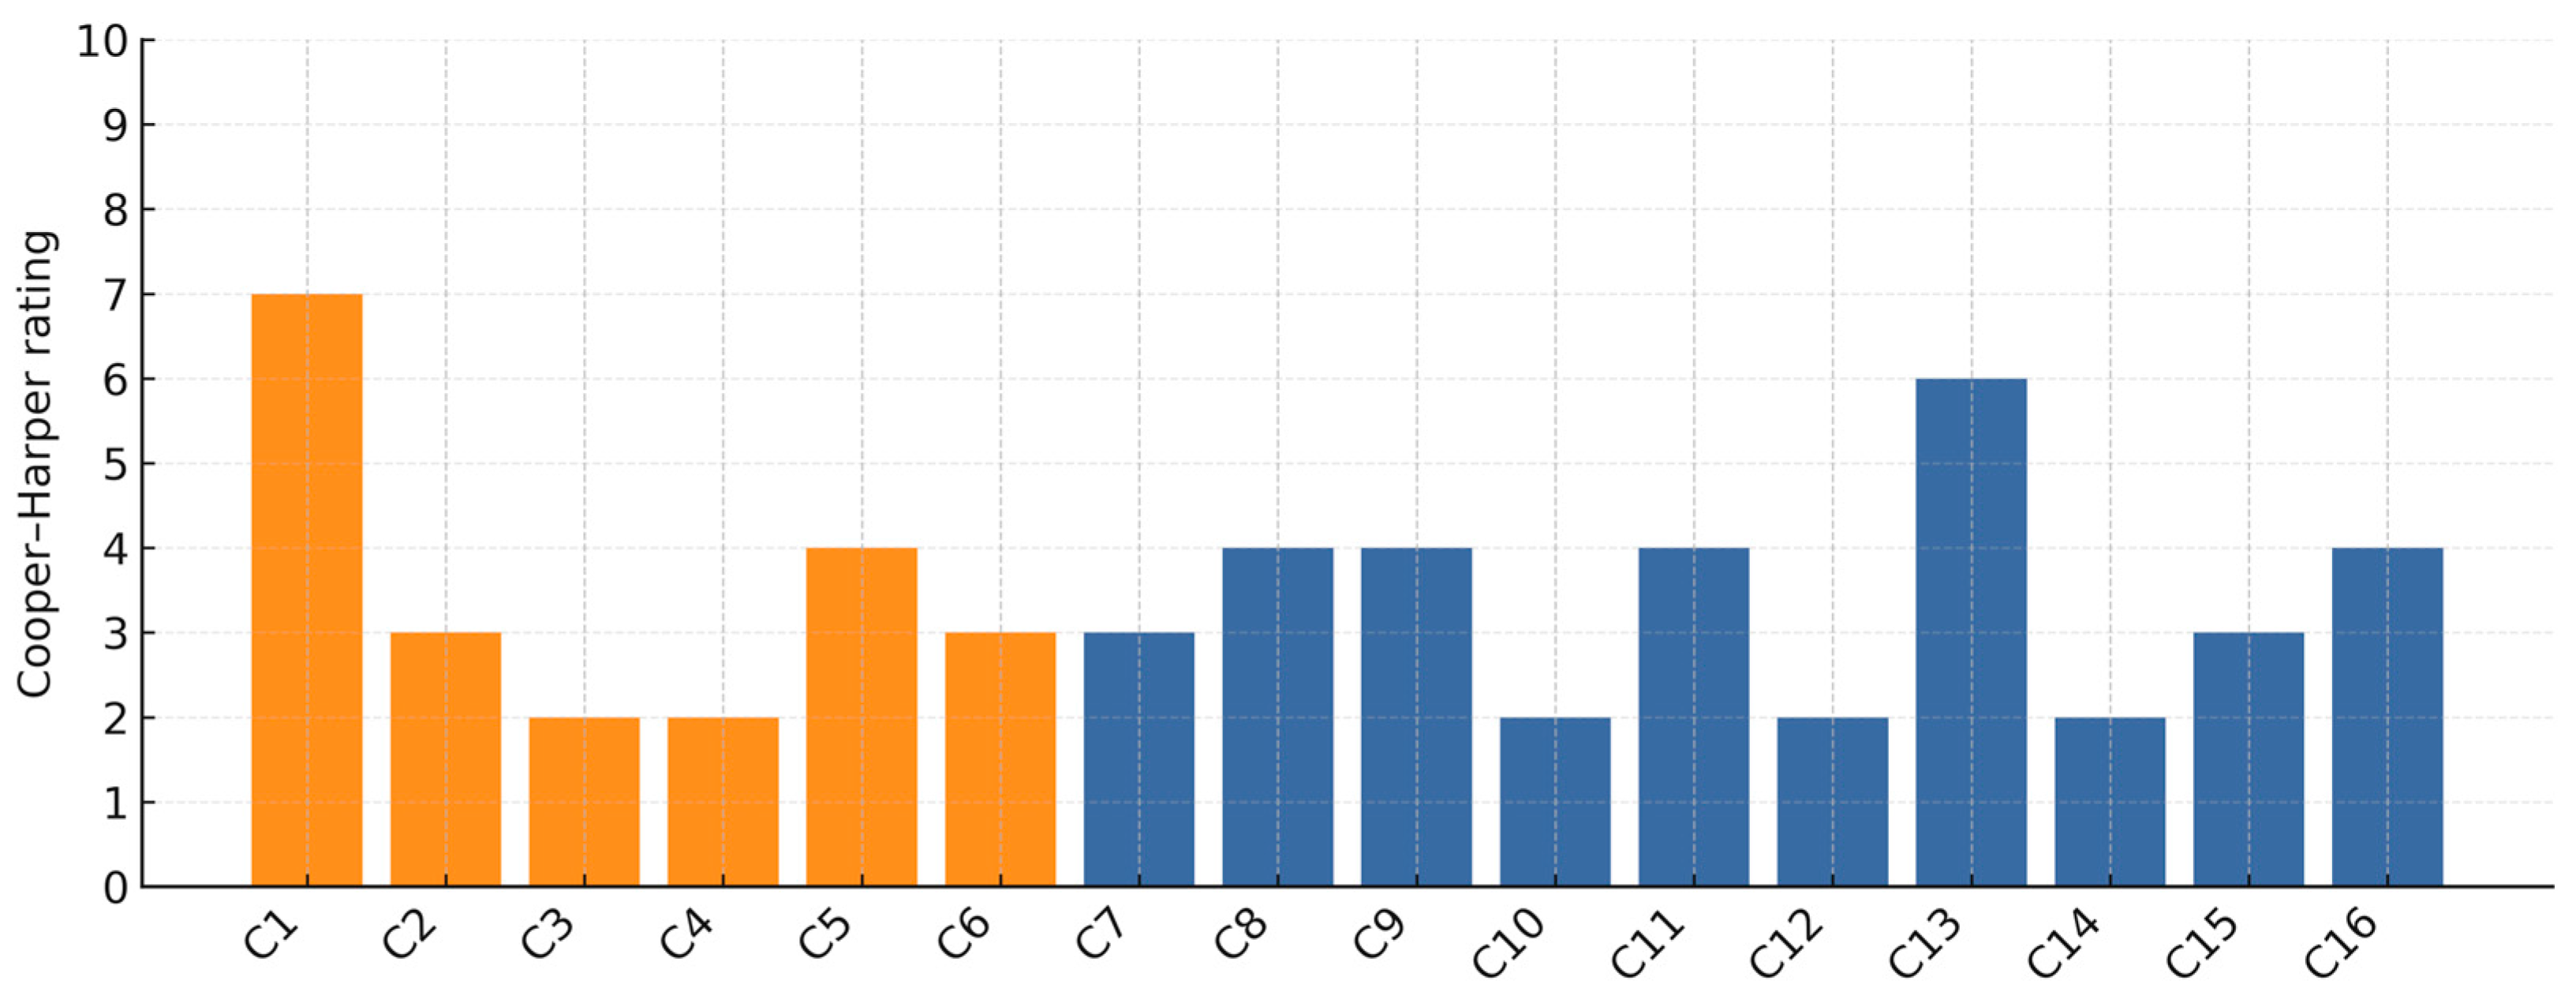
3.2. Subjective Analysis
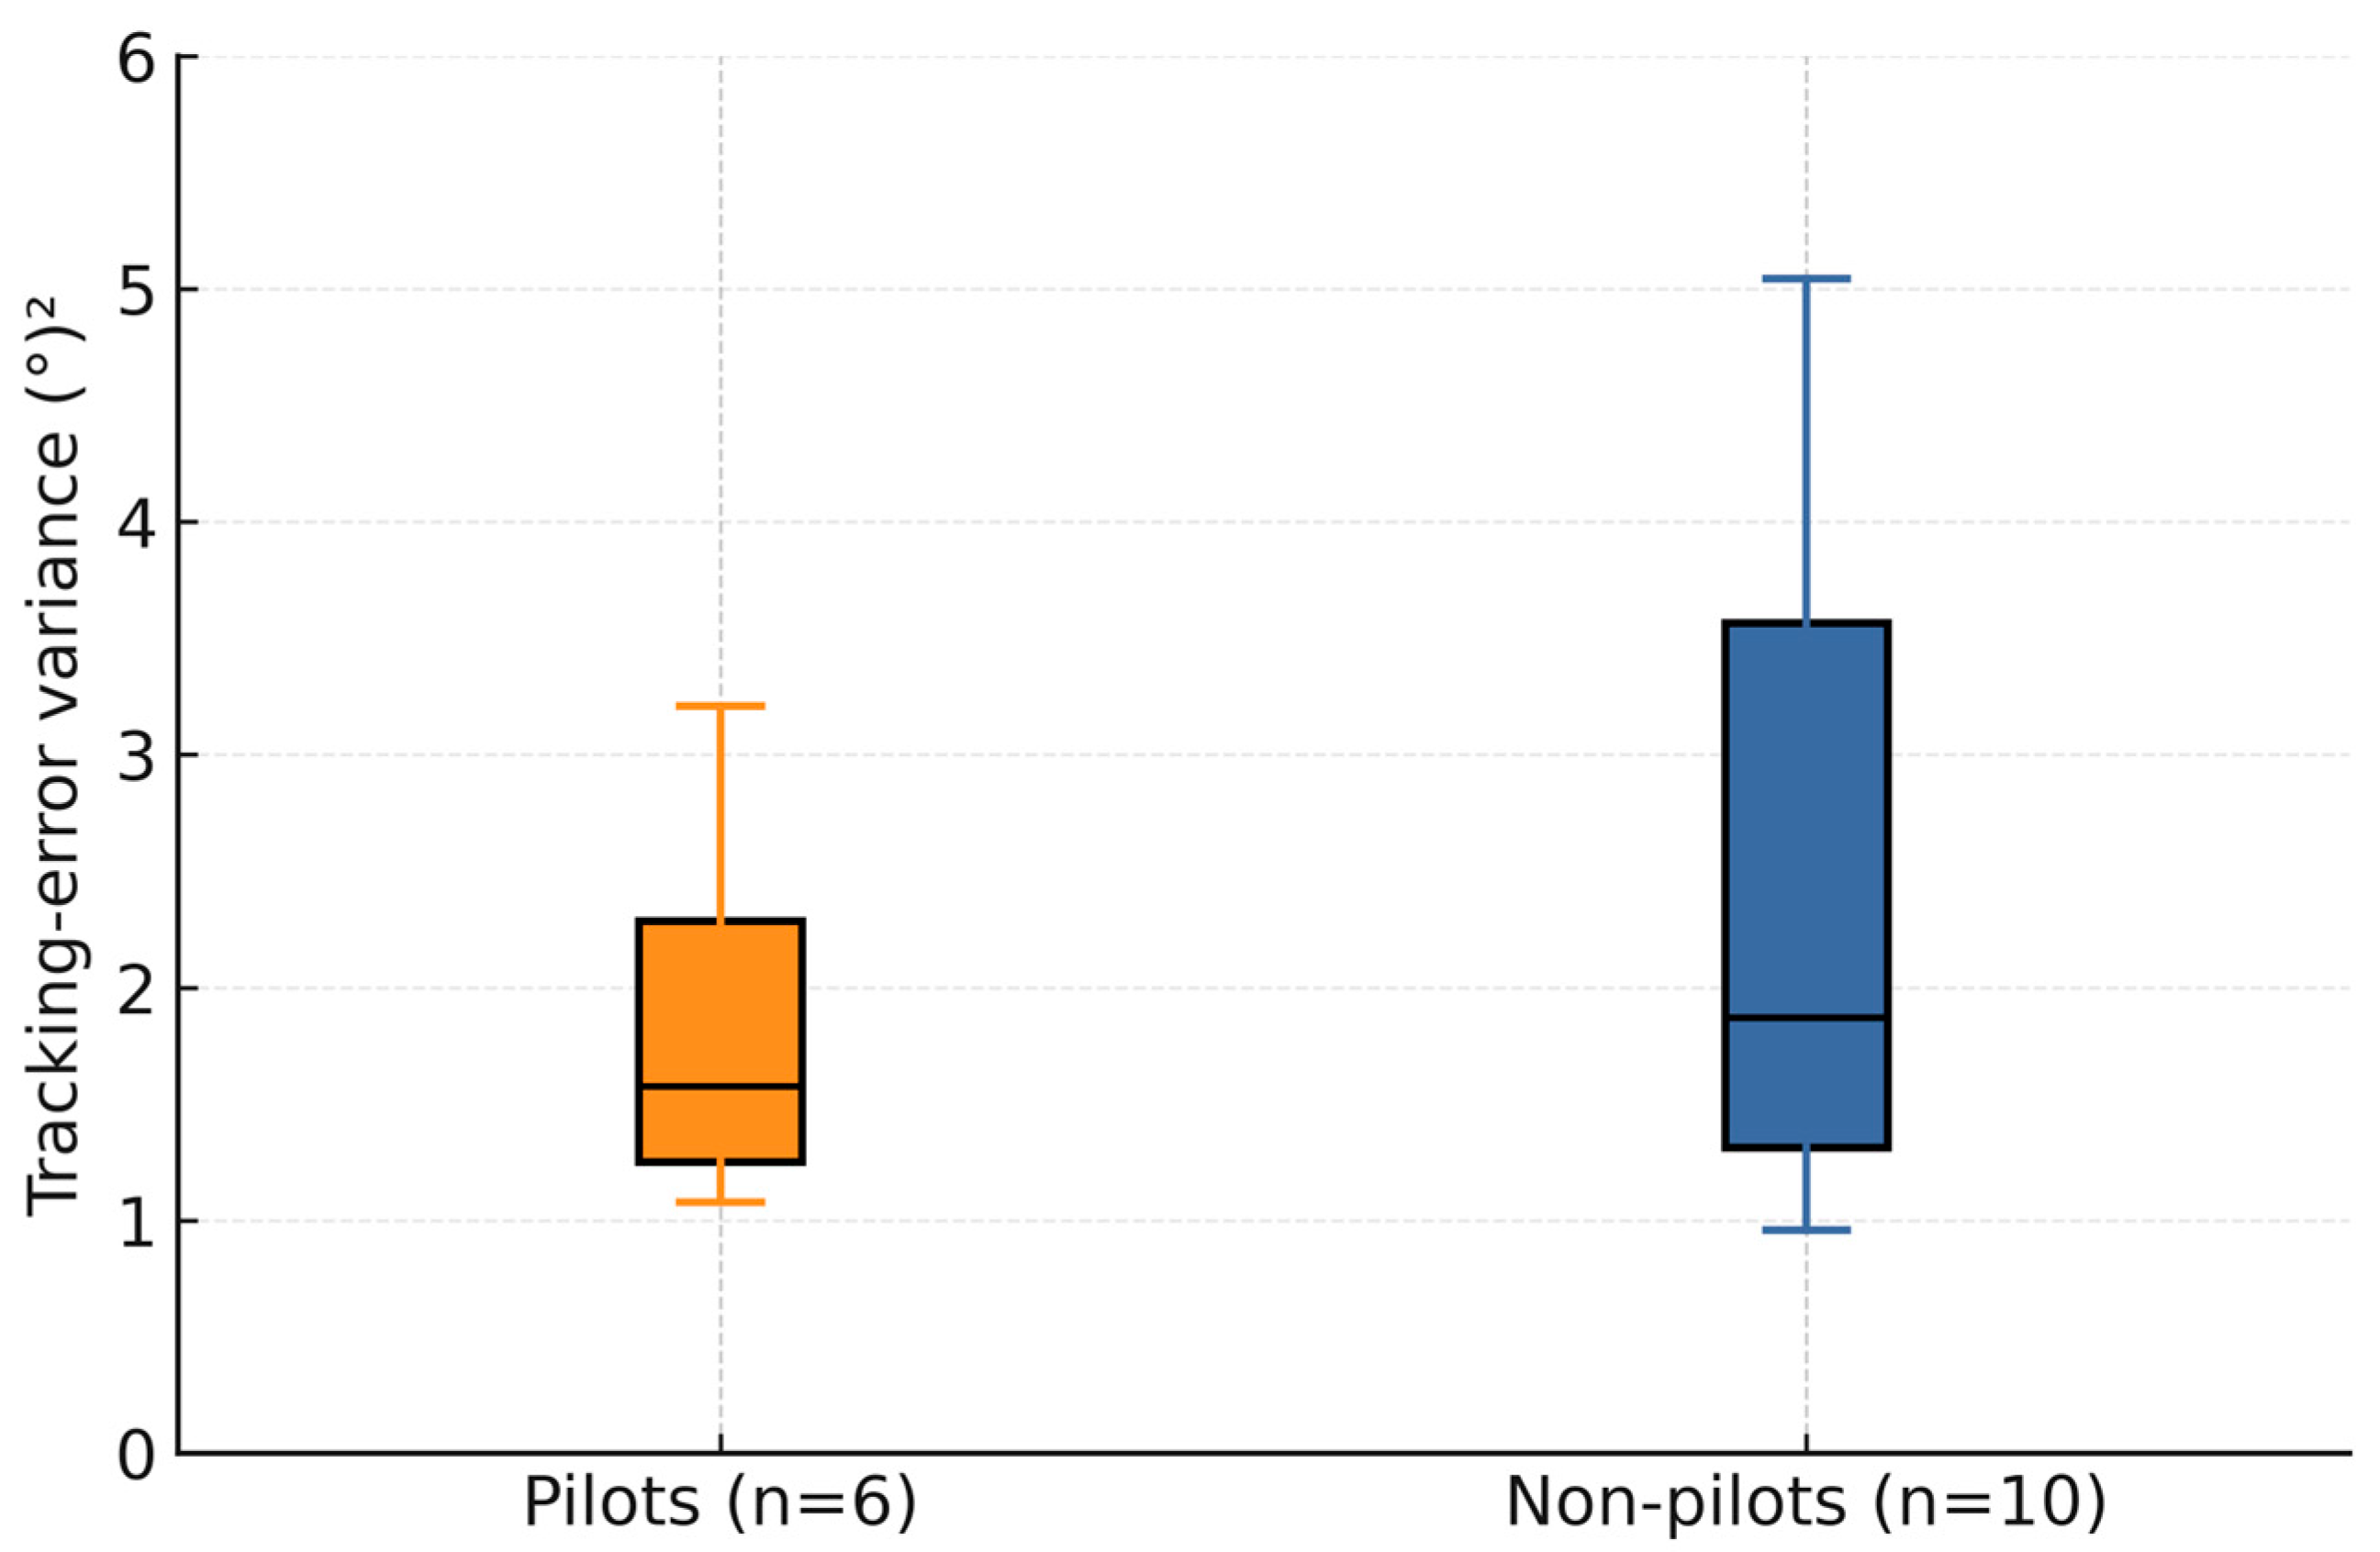
3.3. Group Statistics
4. Discussion
4.1. Control Strategies
4.2. Correlation Subjective/Objective
4.3. Group Comparison
4.4. Design Implications and Next Steps
4.5. Benchmark Comparison
4.6. Limitations
5. Conclusions
Supplementary Materials
Author Contributions
Funding
Institutional Review Board Statement
Informed Consent Statement
Data Availability Statement
Acknowledgments
Conflicts of Interest
Abbreviations
| ADC | Analog-to-Digital Converter |
| CAD | Computer-Aided Design |
| CHR | Cooper–Harper Rating |
| DoF | Degree of Freedom |
| EADI | Electronic Attitude Director Indicator |
| FBW | Fly-By-Wire |
| FS | Full Scale |
| GPIO | General Purpose Input/Output |
| HID | Human Interface Device |
| HITL | Human-in-the-Loop |
| IQR | Interquartile Range |
| LSB | Least Significant Bit |
| NASA-TLX | NASA Task Load Index |
| PCB | Printed Circuit Board |
| PGA | Programmable Gain Amplifier |
| RCAH | Rate-Command/Attitude-Hold |
| RMS | Root Mean Square |
References
- Deets, D.A. Design and Development Experience with a Digital Fly-by-Wire Control System in an F-8C Airplane; Description and Flight Test Results of the NASA F-8 Digital Fly-by-Wire Control System: Edwards, CA, USA, 1975. [Google Scholar]
- Anderson, C.A. Development of an Active Fly-by-Wire Flight Control System. NASA Dryden Flight Research Center; Advanced Control Technology and Its Potential for Future Transport Aircraft: Hampton, VA, USA, 1976. [Google Scholar]
- Efremov, A.V.; Aleksandrov, V.V.; Efremov, E.V.; Vukolov, M.V. The Influence of Different Types of Inceptors and Their Characteristics on the Pilot-Aircraft System. IFAC-PapersOnLine 2019, 51, 372–377. [Google Scholar] [CrossRef]
- Bjorkman, E. The Outrageous Adolescence of the F-16. Smithsonian Magazine. March 2014. Available online: https://www.smithsonianmag.com/air-space-magazine/outrageous-adolescence-f-16-180949491/ (accessed on 13 June 2025).
- Rummel, A. Equivalency Analysis of Sidestick Controller Modes during Manual Flight. Ph.D. Thesis, University of Central Florida, Orlando, FL, USA, 2018. Available online: http://library.ucf.edu (accessed on 23 April 2025).
- McRuer, D.T.; Krendel, E.S. Mathematical Models of Human Pilot Behavior; No.AGARDAG-188; North Atlantic Treaty Organization, Advisory Group for Aerospace Research and Development: Paris, France, 1974. [Google Scholar]
- Jalovecký, R. Testing of Pilots’ Abilities on Flight Simulators. Voj. Rozhl. 2024, 33, 127–144. [Google Scholar] [CrossRef]
- Zhang, C. Active Inceptors Operation Principles and Key Technologies. In Lecture Notes in Electrical Engineering; Springer: Singapore, 2025; pp. 43–53. [Google Scholar] [CrossRef]
- Ma, J.; Li, R. A Review of Force Sensing Control and Key Technologies for Electrically Manipulated Load Systems. In Proceedings of the 2024 IEEE 5th International Conference on Advanced Electrical and Energy Systems (AEES), Beijing, China, 16–18 August 2024; pp. 478–483. [Google Scholar] [CrossRef]
- Lee, W.; Joo, H.; Kang, Y.K.; Seo, T.W. A Review on the Force Sensing and Force Feedback-Based Navigation of Mobile Robots. Int. J. Precis. Eng. Manuf. 2025, in press. [CrossRef] [PubMed]
- Guiatni, M.; Ournid, A.; Boulahlib, M.A.; Abane, A. Programmable Force-Feedback Side-Stick for Flight Simulation. In Proceedings of the IEEE I2MTC 2012-International Instrumentation and Measurement Technology Conference, Graz, Austria, 13–16 May 2012; pp. 2526–2530. [Google Scholar] [CrossRef]
- Farwick, K. ActivSense Sidestick: A Force Sensing and Force Feedback Joystick. Bachelor’s Thesis, California Polytechnic State University, San Luis Obispo, CA, USA, 2017. Available online: https://digitalcommons.calpoly.edu/eesp/369 (accessed on 13 June 2025).
- Zilinu, H.; Zhengren, L. On Active Sidestick Force Control Strategy Technology. In Proceedings of the 2018 IEEE CSAA Guidance, Navigation and Control Conference (CGNCC), Xiamen, China, 10–12 August 2018. [Google Scholar] [CrossRef]
- Horri, N.; Pietraszko, M. A Tutorial and Review on Flight Control Co-Simulation Using MATLAB/Simulink and Flight Simulators. Automation 2022, 3, 486–510. [Google Scholar] [CrossRef]
- Meneses, H.; Zuniga, B.; Camacho, E.; Ruíz, F. Load Cell System Designed to Estimate Interaction Forces in Robotic Applications. In Proceedings of the IEEE Central America and Panama Convention (CONCAPAN), Panama, Panama, 22–24 November 2024. [Google Scholar] [CrossRef]
- Petković, M.; Đorđević, G.S. Design of Low-Cost Force Sensor System for Human-Machine Interaction—Force-Feedback Joystick. Electronics 2011, 15, 79–84. [Google Scholar]
- Nam, Y.; Hong, S.K. Active Stick Control Using Frictional Torque Compensation. Sens. Actuators A Phys. 2005, 117, 194–202. [Google Scholar] [CrossRef]
- Ying, J.; Luc, H.; Dai, J.; Pan, H. Visual Flight Simulation System Based on MATLAB/FlightGear. In Proceedings of the 2017 IEEE 2nd Advanced Information Technology, Electronic and Automation Control Conference (IAEAC), Chongqing, China, 25–27 March 2017; pp. 2360–2363. [Google Scholar] [CrossRef]
- Vrdoljak, M.; Halbe, O.; Mehling, T.; Hajek, M. Flight Guidance Concepts to Mitigate Flight Control System Degradation in Urban Air Mobility Scenarios. IEEE Aerosp. Electron. Syst. Mag. 2023, 38, 18–33. [Google Scholar] [CrossRef]
- Ulbrich, N.; Volden, T. Features for a Modern Strain-Gage Balance Data Analysis Software Tool. In Proceedings of the AIAA SciTech Forum, 6–10 January 2025; American Institute of Aeronautics and Astronautics: Orlando, FL, USA, 2025; p. 0938. [Google Scholar] [CrossRef]
- RealSimulator. FSSB-R3 PRO. Available online: https://realsimulator.com/fssb-r3-pro/ (accessed on 13 June 2025).
- Efremov, A.V.; Mbikayi, Z.; Efremov, E.V. Comparative Study of Different Algorithms for a Flight Control System Design and the Potentiality of Their Integration with a Sidestick. Aerospace 2021, 8, 290. [Google Scholar] [CrossRef]
- Fellah, K.; Guiatni, M.; Ournid, A.K.; Boulahlib, M.A. Fuzzy-PID Side-Stick Force Control for Flight Simulation. Aeronaut. J. 2016, 120, 845–872. [Google Scholar] [CrossRef]
- Efremov, A.V.; Rodchenko, V.V.; Ogloblin, A.V.; Predtechensky, A.N. Pilot as a Dynamic System; Mashinostroenie: Moscow, Russia, 1992. [Google Scholar]
- Simm, R. IB 111-2012-58: Experimental Simulator Study on Pilot-in-the-Loop Control Using Force-Sensing Sidesticks; German Aerospace Center (DLR), Institute of Flight Systems: Braunschweig, Germany, 2012; p. 50. Available online: https://elib.dlr.de/88215/ (accessed on 20 June 2025).
- Cooper, G.; Harper, R. The Use of Pilot Rating in the Evaluation of Aircraft Handling Qualities; AGARD-NATO Report 567; National Aeronautics and Space Administration: Paris, France, 1969.
- Hart, S.G.; Staveland, L.E. Development of NASA-TLX (Task Load Index): Results of Empirical and Theoretical Research. Adv. Psychol. 1988, 52, 139–183. [Google Scholar] [CrossRef]
- Garbo, P.; Quaranta, G.; Capone, P. Non-Invasive Optical Sensors to Measure Pilots’ Forces on Aircraft Control Inceptors. In Proceedings of the AIAA Aviation and Aeronautics Forum and Exposition (AIAA AVIATION Forum 2023), San Diego, CA, USA, 12–16 June 2023. [Google Scholar] [CrossRef]
- Kurtak, M. Pilot Workload Analysis for Modern Fighter Aircraft from the Flight Simulator Experiment. Master’s Thesis, University of Zagreb, Faculty of Mechanical Engineering and Naval Architecture, Zagreb, Croatia, 2023. Available online: https://zir.nsk.hr/islandora/object/fsb:9483/datastream/PDF/view (accessed on 11 July 2025).


| Parameter | Value | Basis/Source |
|---|---|---|
| Rated force range (per axis) | ±98.1 N (10 kgf) | Load-cell datasheet (TAL220-10 kg) |
| Quantisation step (1 LSB) | 0.024 N | HX711 gain 128, 24-bit converter |
| Sampling/reporting rate | 80 Hz | HX711 fast mode |
| Linearity (R2) | >0.999 | System-level test |
| Asymmetry Error (max) | <0.1% FS | System-level test |
| Precision (Worst-case Stability) | <0.05 N (~0.03% FS) | System-level test |
| Crosstalk (Correlation Coeff.) | r < 0.1 | System-level test |
| Component | Quantity | Unit Cost (EUR) |
|---|---|---|
| Base materials and manufacturing | 1 | 50 |
| Strain gauge load cells | 4 | 5 |
| HX711 ADC | 2 | 4 |
| Arduino Micro | 1 | 30 |
| Total cost | 108 |
| Participant | Age (years) | Flight Hours (h) | Simulator Hours (h) |
|---|---|---|---|
| C1 | 28 | 78 | 500 |
| C2 | 28 | 15 | 100 |
| C3 | 22 | 143 | 40 |
| C4 | 26 | 150 | 40 |
| C5 | 22 | 141 | 40 |
| C6 | 34 | 800 | 57 |
| C7 | 25 | 0 | 30 |
| C8 | 54 | 0 | 26 |
| C9 | 24 | 0 | 1 |
| C10 | 39 | 0 | 6 |
| C11 | 41 | 0 | 10 |
| C12 | 25 | 0 | 1 |
| C13 | 25 | 0 | 1 |
| C14 | 25 | 0 | 1 |
| C15 | 25 | 0 | 2 |
| C16 | 40 | 0 | 20 |
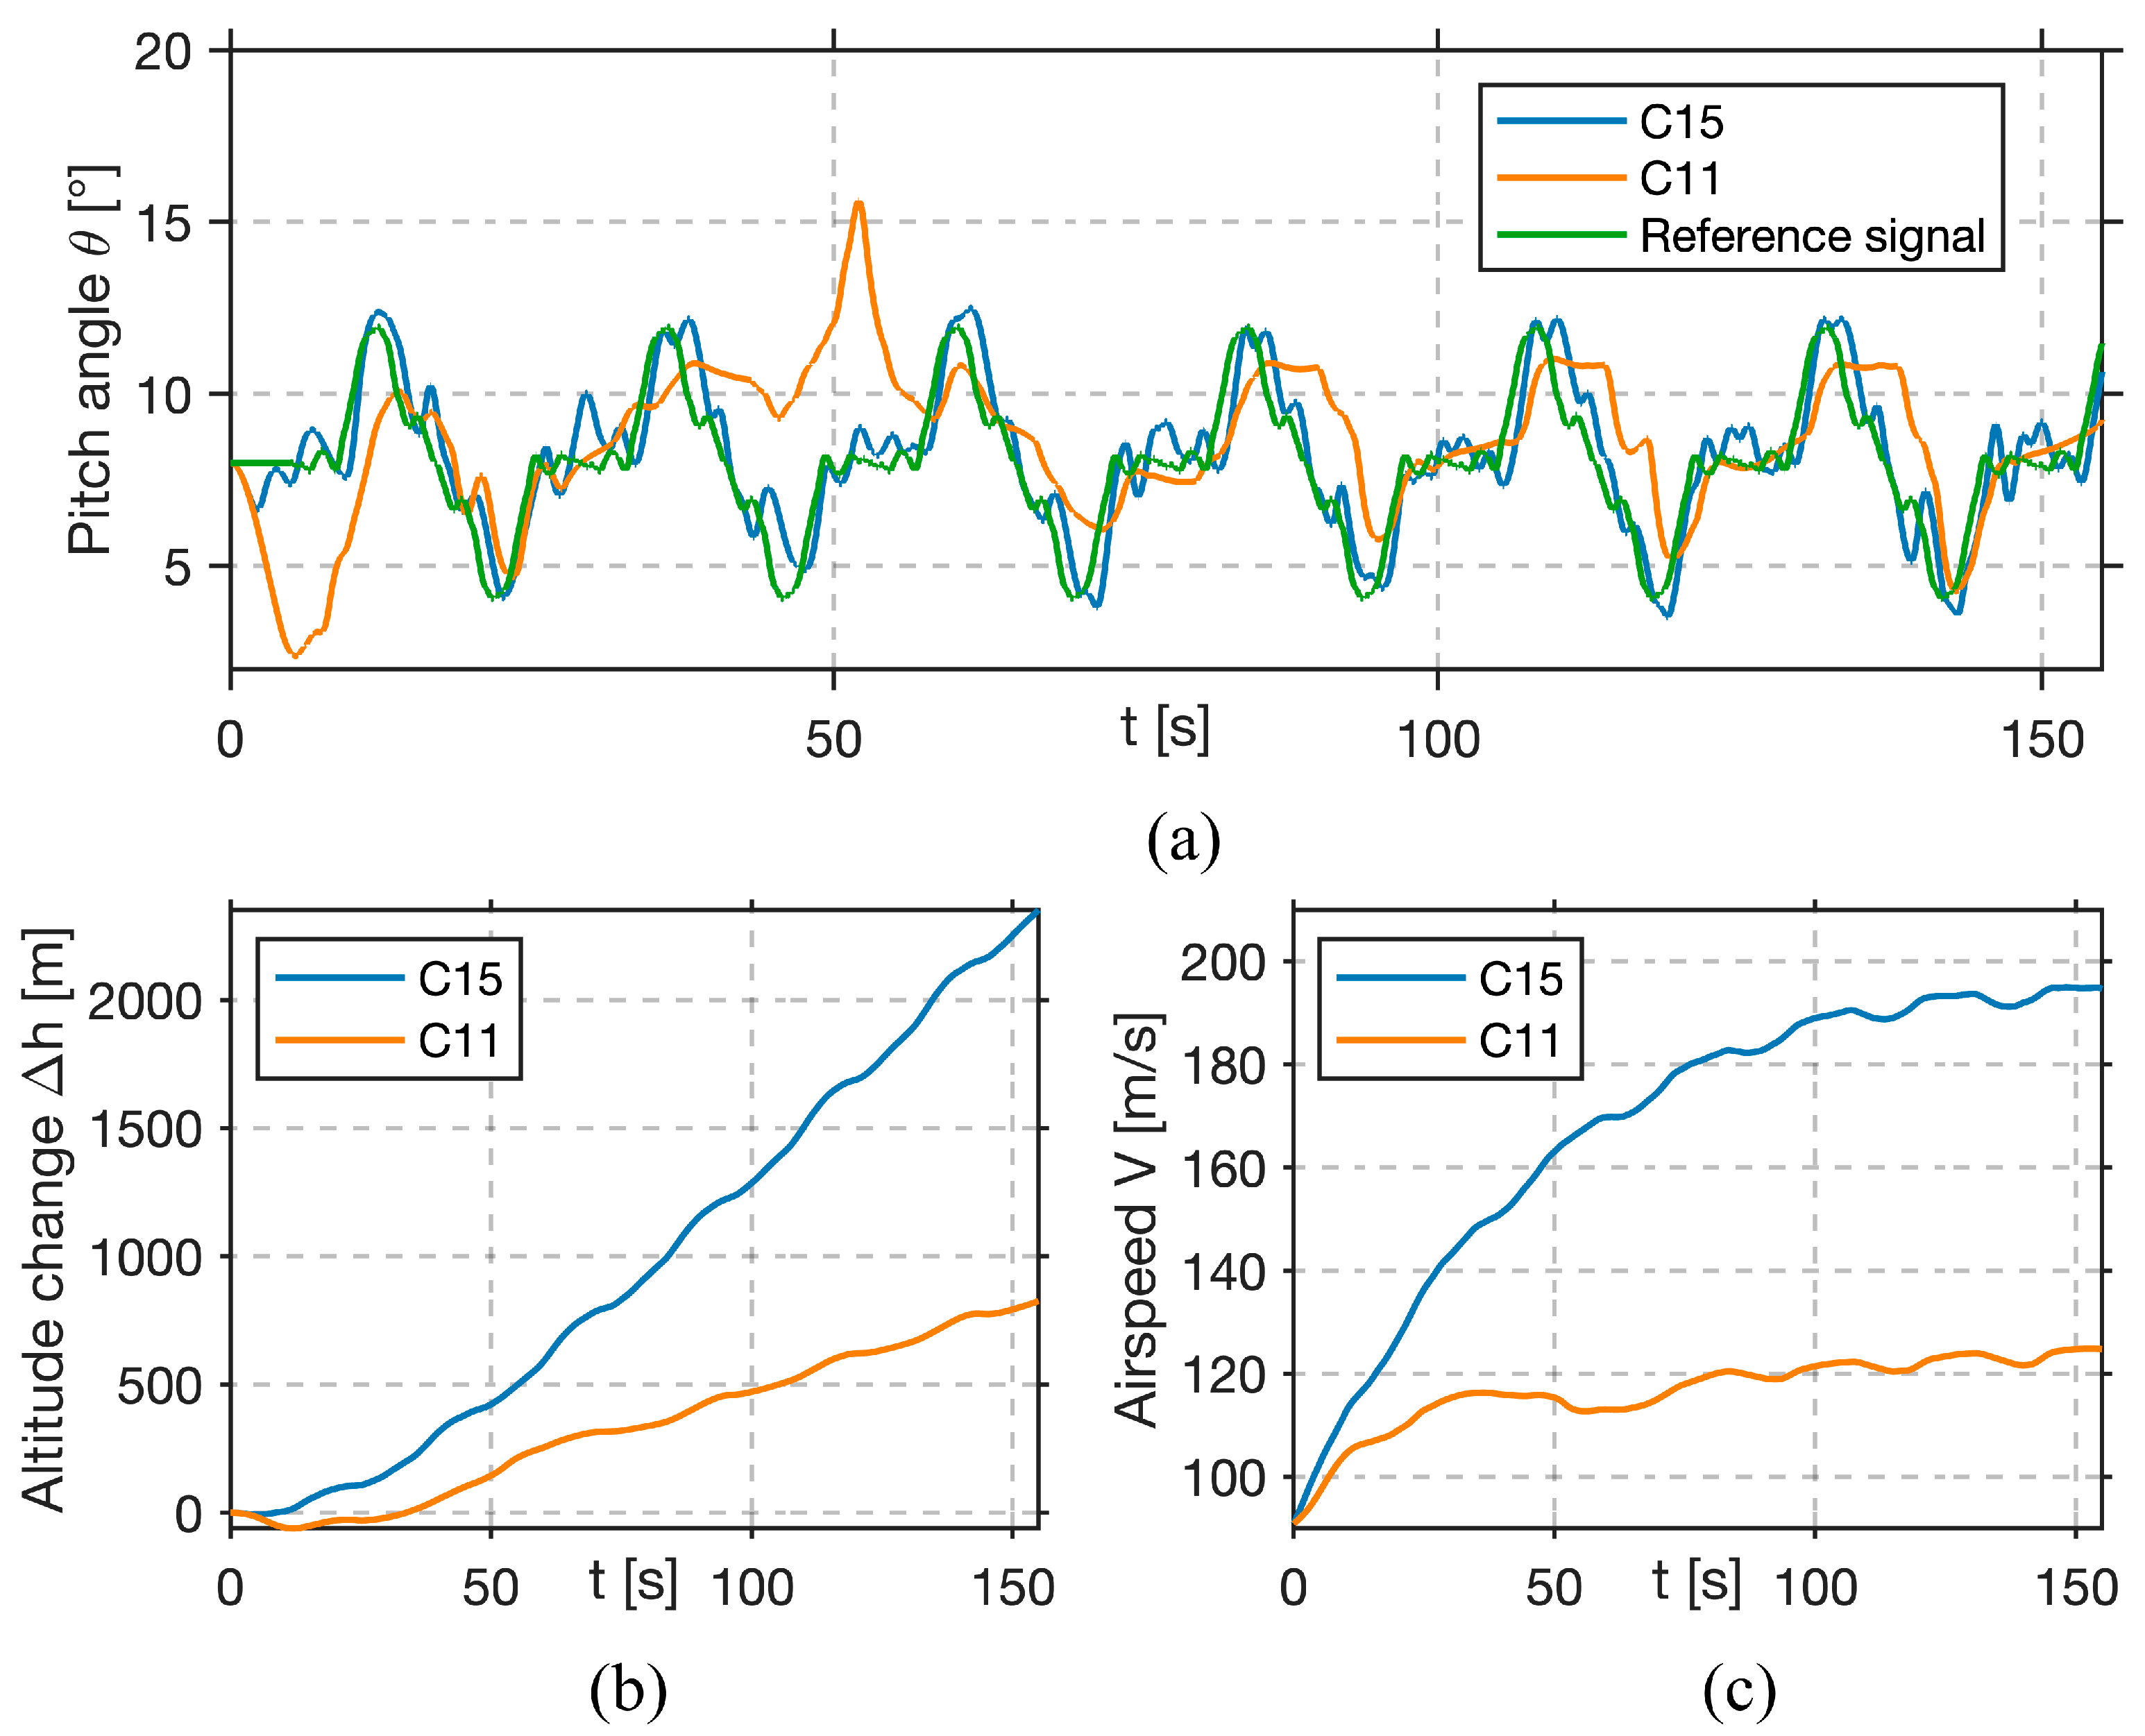
| Metric | Best Performer (C15) | Worst Performer (C11) | Interpretation |
|---|---|---|---|
| Tracking Error Variance (°)2 | 0.96 | 5.04 | Higher precision |
| Stick Force Extrema Count | 295 | 185 | More frequent, fine adjustments |
| Primary Control Strategy | Feedforward (proactive) | Reactive (error-correction) | Different control paradigms |
| Total Altitude Gain (m) | ~2200 | ~800 | Better energy management |
| Cooper–Harper Rating | 3 (Good) | 4 (Fair) | Lower perceived workload |
| NASA-TLX Effort (%) | 50% | 95% | Lower perceived effort |
Disclaimer/Publisher’s Note: The statements, opinions and data contained in all publications are solely those of the individual author(s) and contributor(s) and not of MDPI and/or the editor(s). MDPI and/or the editor(s) disclaim responsibility for any injury to people or property resulting from any ideas, methods, instructions or products referred to in the content. |
© 2025 by the authors. Licensee MDPI, Basel, Switzerland. This article is an open access article distributed under the terms and conditions of the Creative Commons Attribution (CC BY) license (https://creativecommons.org/licenses/by/4.0/).
Share and Cite
Rožić, P.; Vrdoljak, M.; Krajček Nikolić, K.; Ivošević, J. Low-Cost Strain-Gauge Force-Sensing Sidestick for 6-DoF Flight Simulation: Design and Human-in-the-Loop Evaluation. Sensors 2025, 25, 4476. https://doi.org/10.3390/s25144476
Rožić P, Vrdoljak M, Krajček Nikolić K, Ivošević J. Low-Cost Strain-Gauge Force-Sensing Sidestick for 6-DoF Flight Simulation: Design and Human-in-the-Loop Evaluation. Sensors. 2025; 25(14):4476. https://doi.org/10.3390/s25144476
Chicago/Turabian StyleRožić, Patrik, Milan Vrdoljak, Karolina Krajček Nikolić, and Jurica Ivošević. 2025. "Low-Cost Strain-Gauge Force-Sensing Sidestick for 6-DoF Flight Simulation: Design and Human-in-the-Loop Evaluation" Sensors 25, no. 14: 4476. https://doi.org/10.3390/s25144476
APA StyleRožić, P., Vrdoljak, M., Krajček Nikolić, K., & Ivošević, J. (2025). Low-Cost Strain-Gauge Force-Sensing Sidestick for 6-DoF Flight Simulation: Design and Human-in-the-Loop Evaluation. Sensors, 25(14), 4476. https://doi.org/10.3390/s25144476