
Using Wearable MEG to Study the Neural Control of Human Stepping

 , , , , ,
Abstract
1. Introduction
2. Materials and Methods
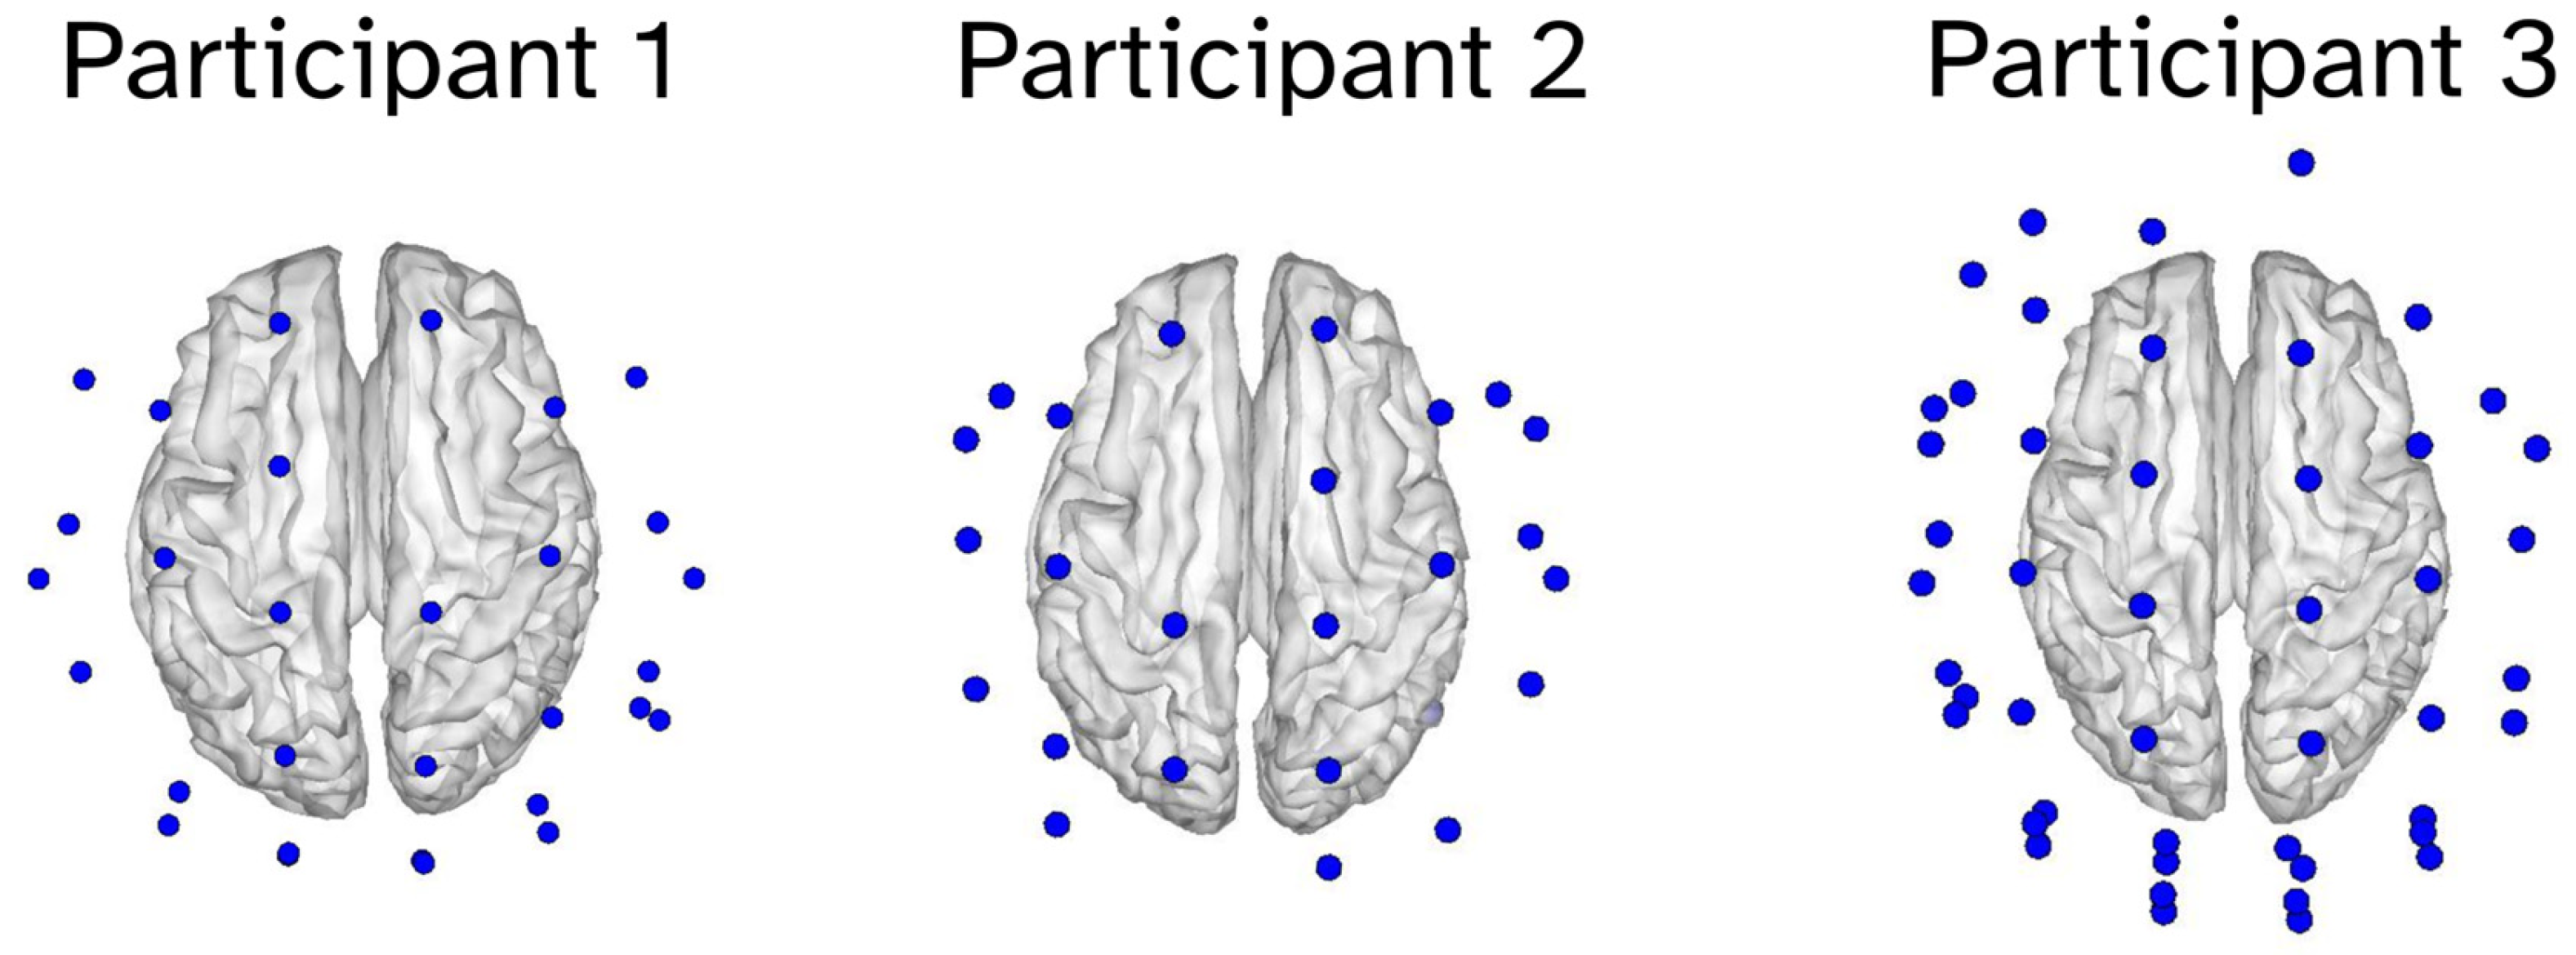
2.1. Participants
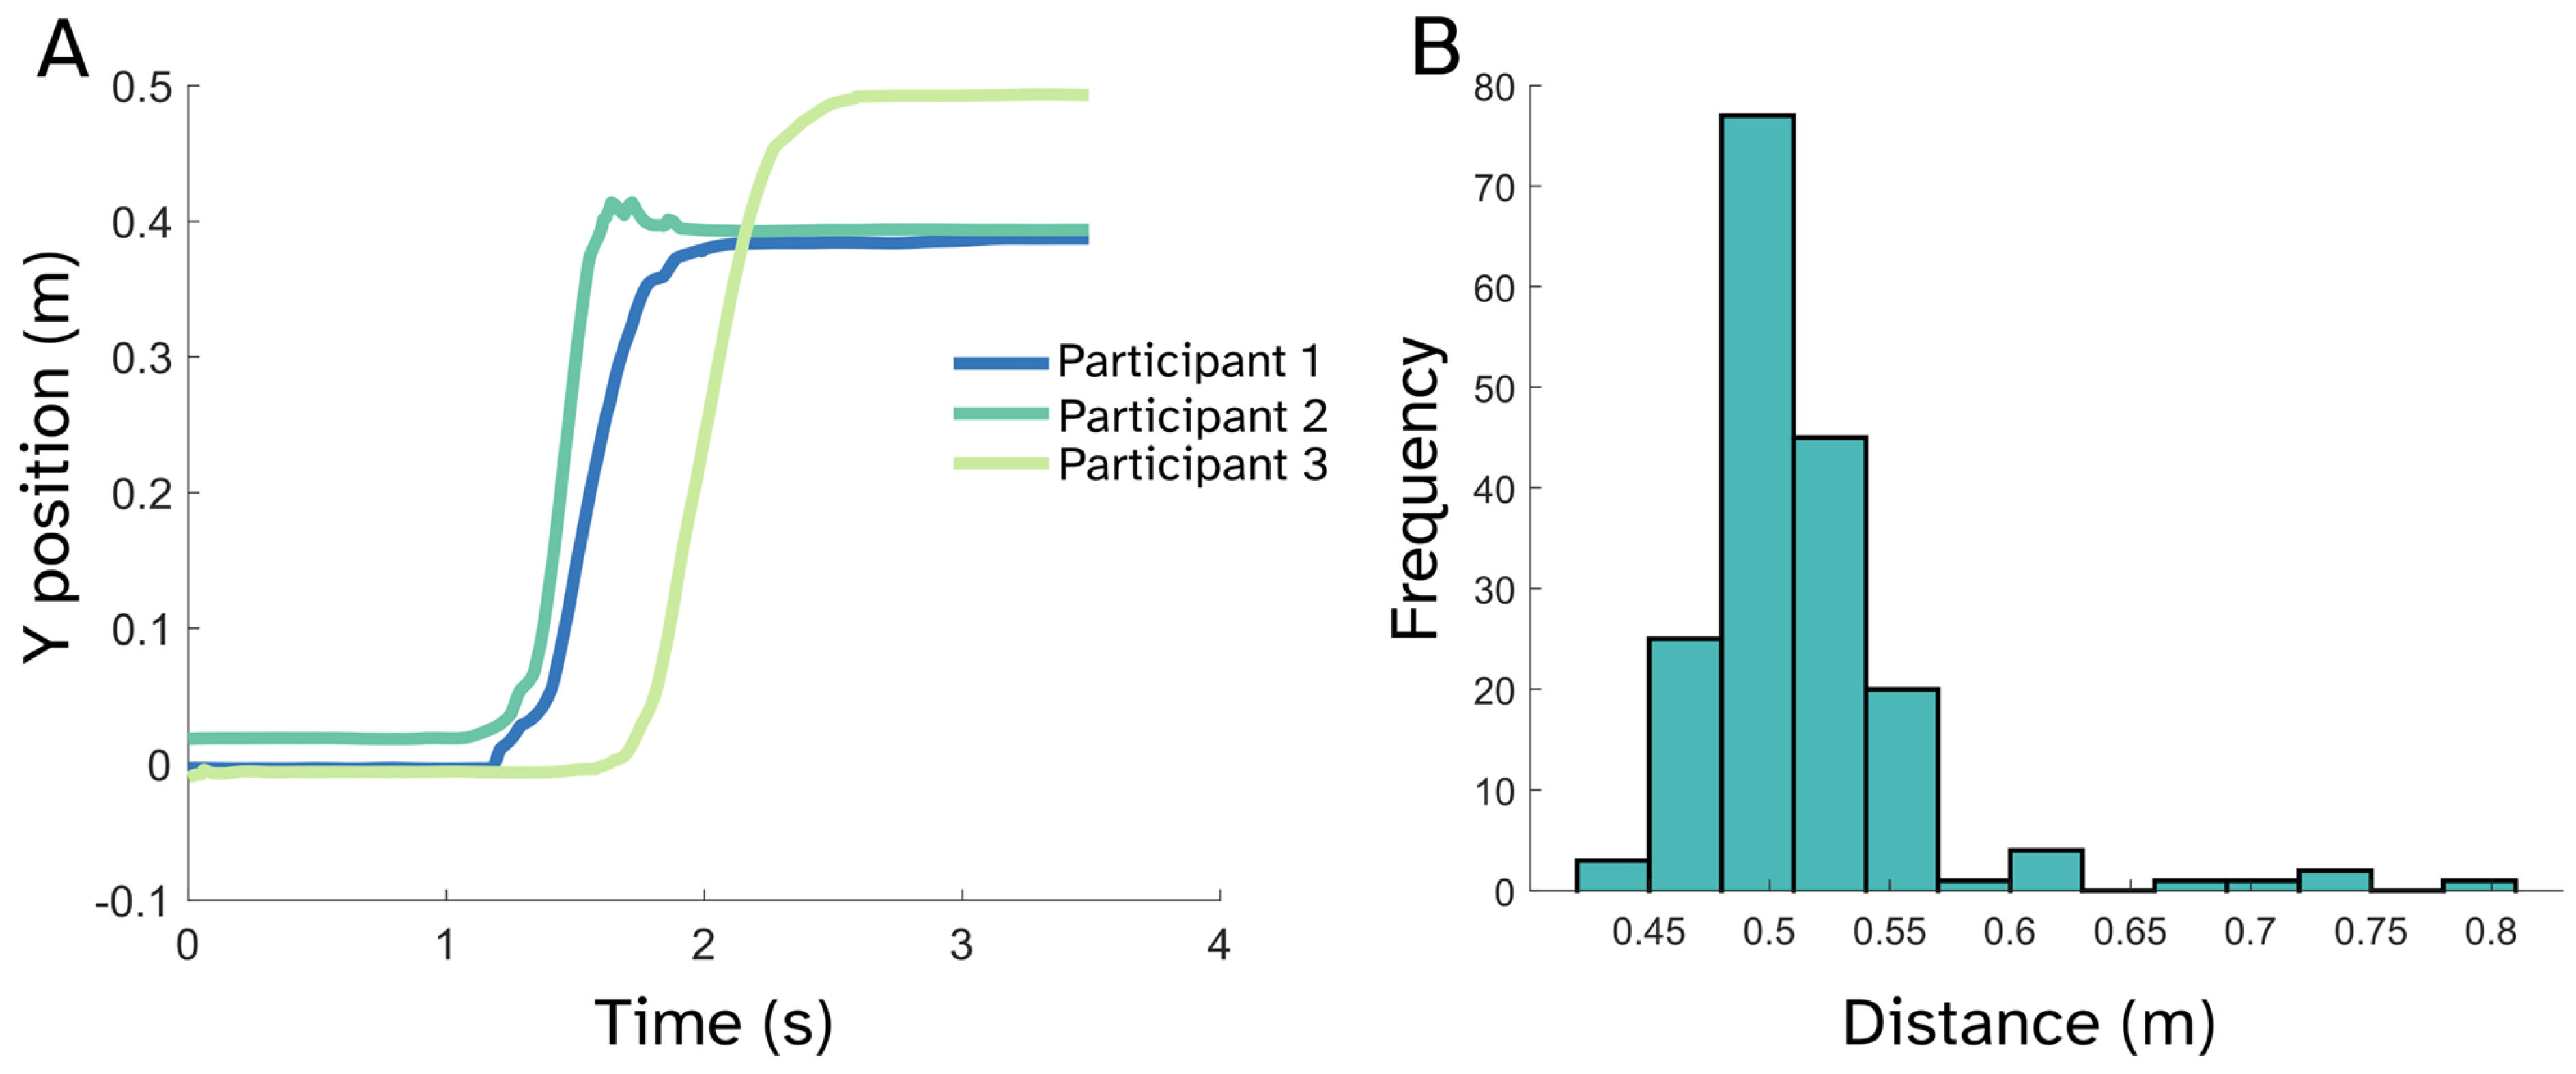
2.2. Stepping Task
2.3. Optically Pumped Magnetoencephalography (OP-MEG)
2.4. Electromyography
2.5. Analysis
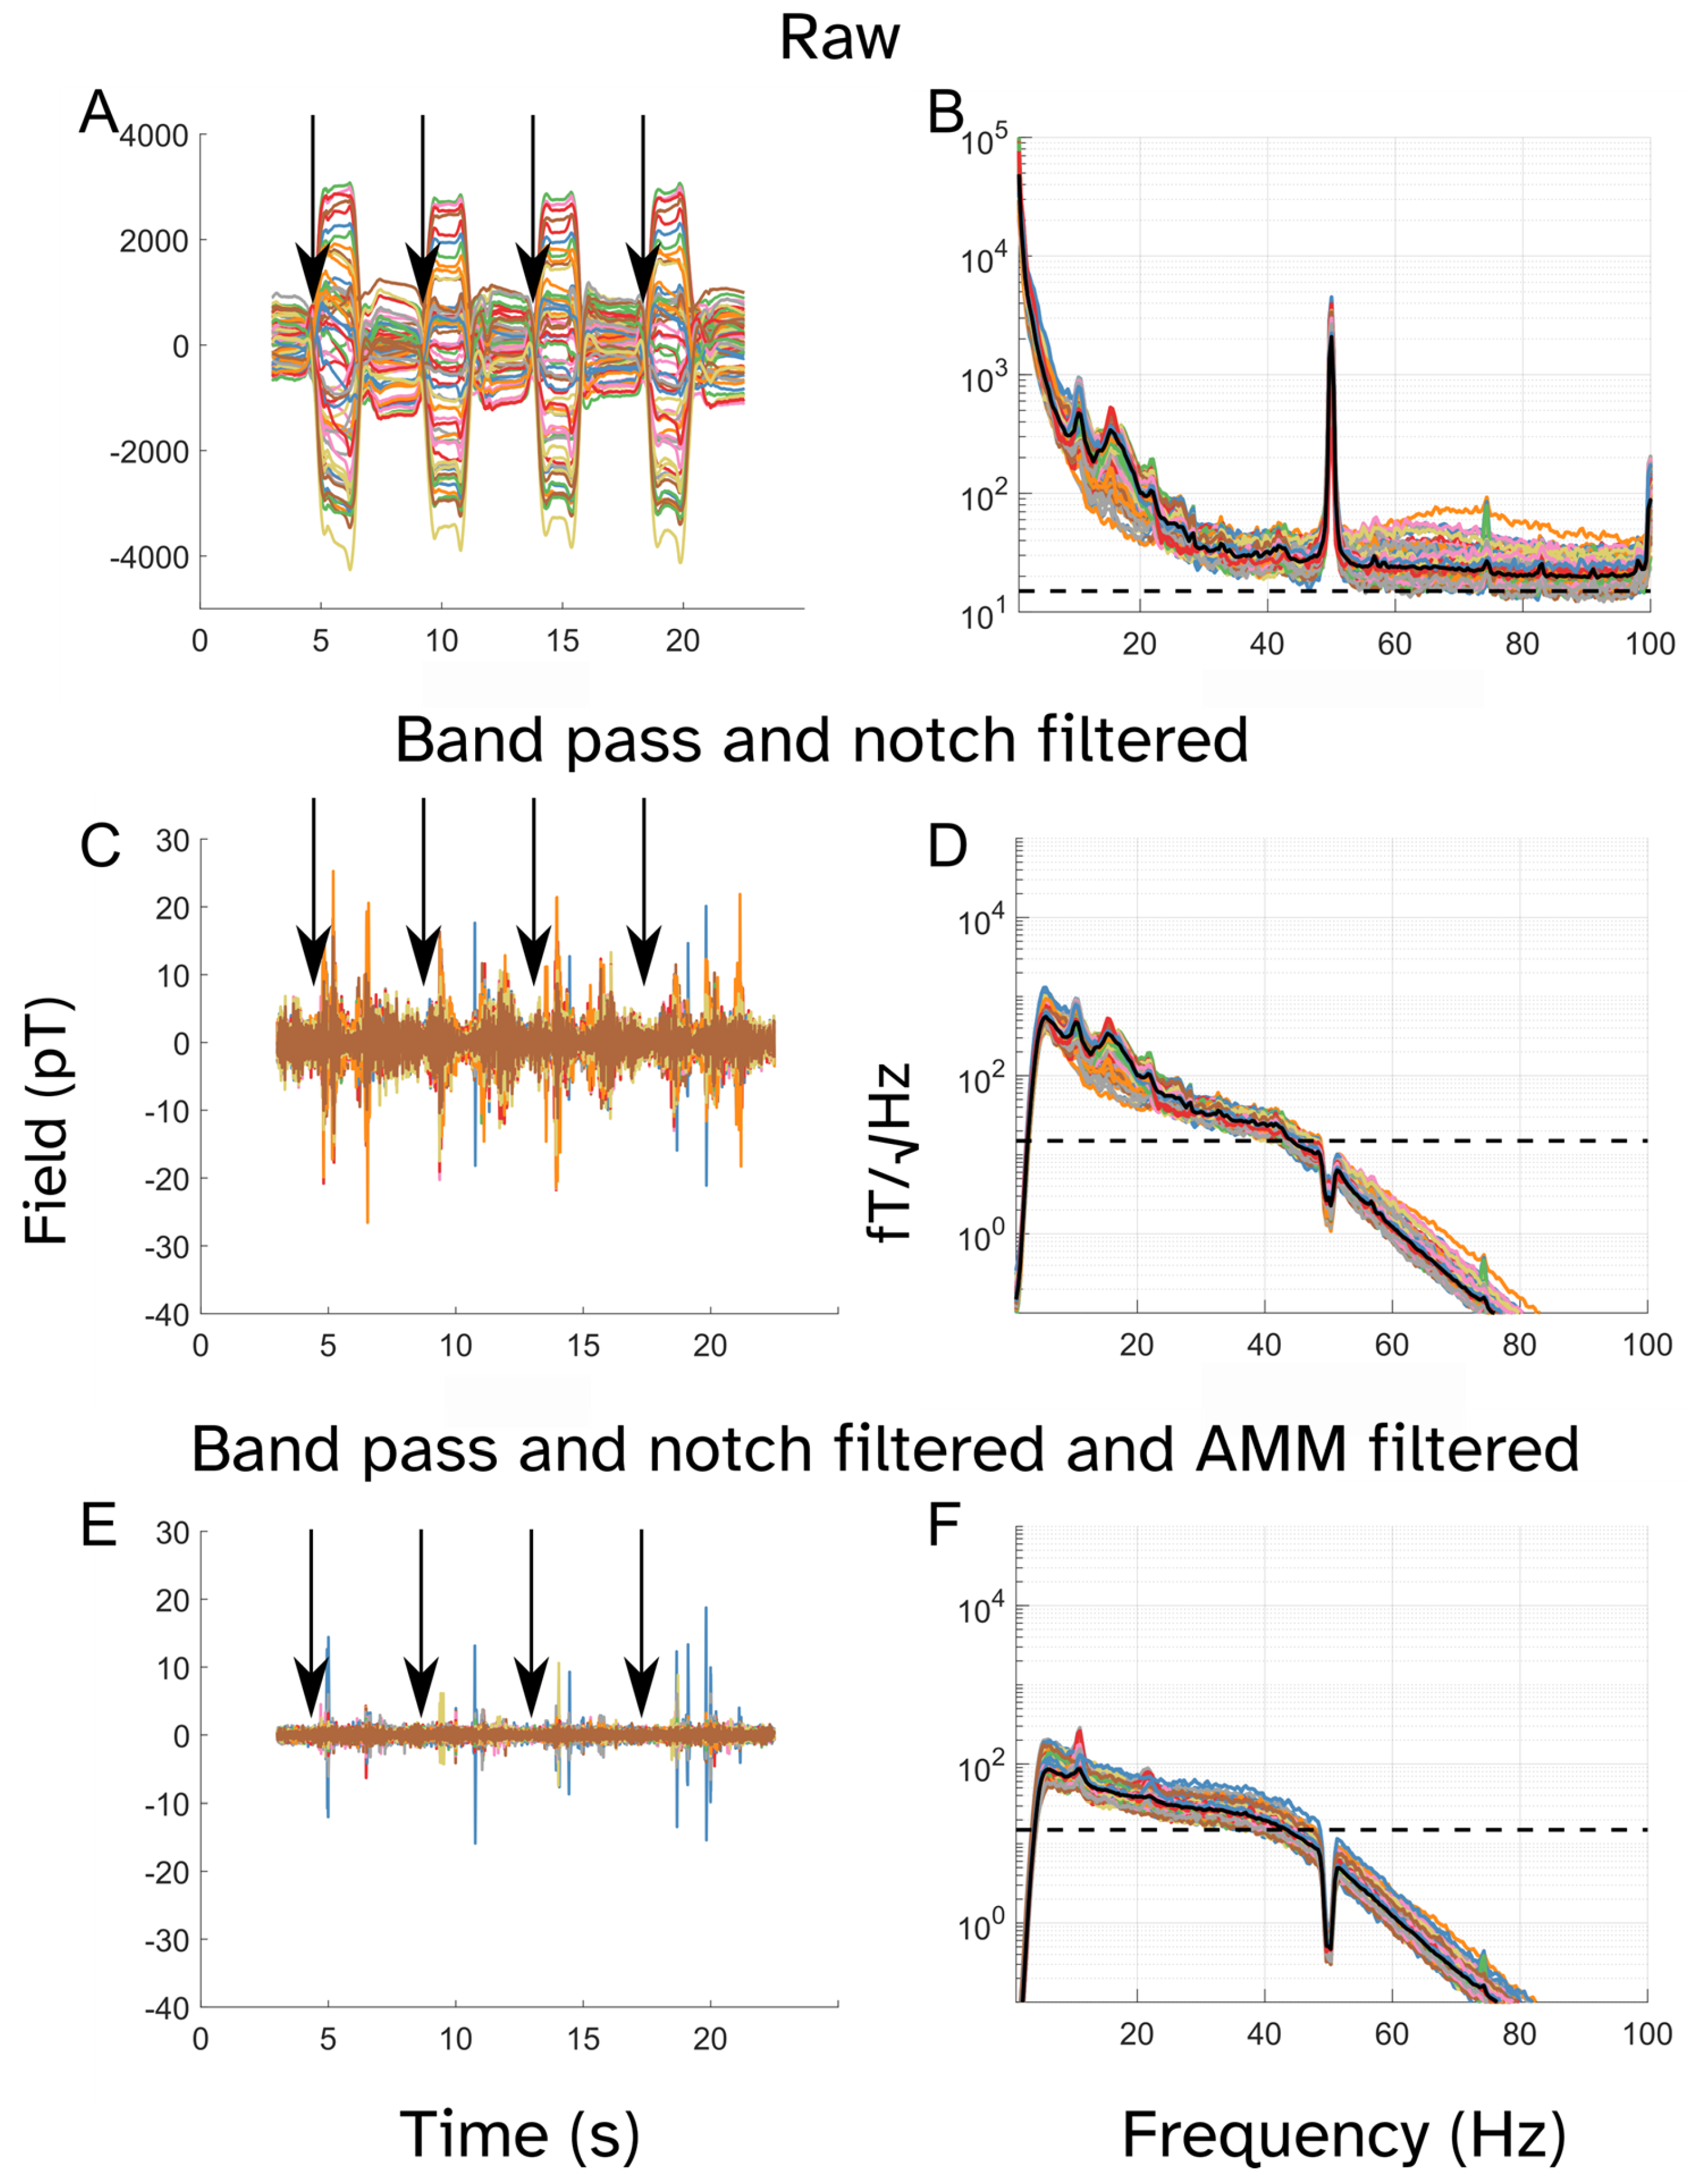
2.5.1. Preprocessing
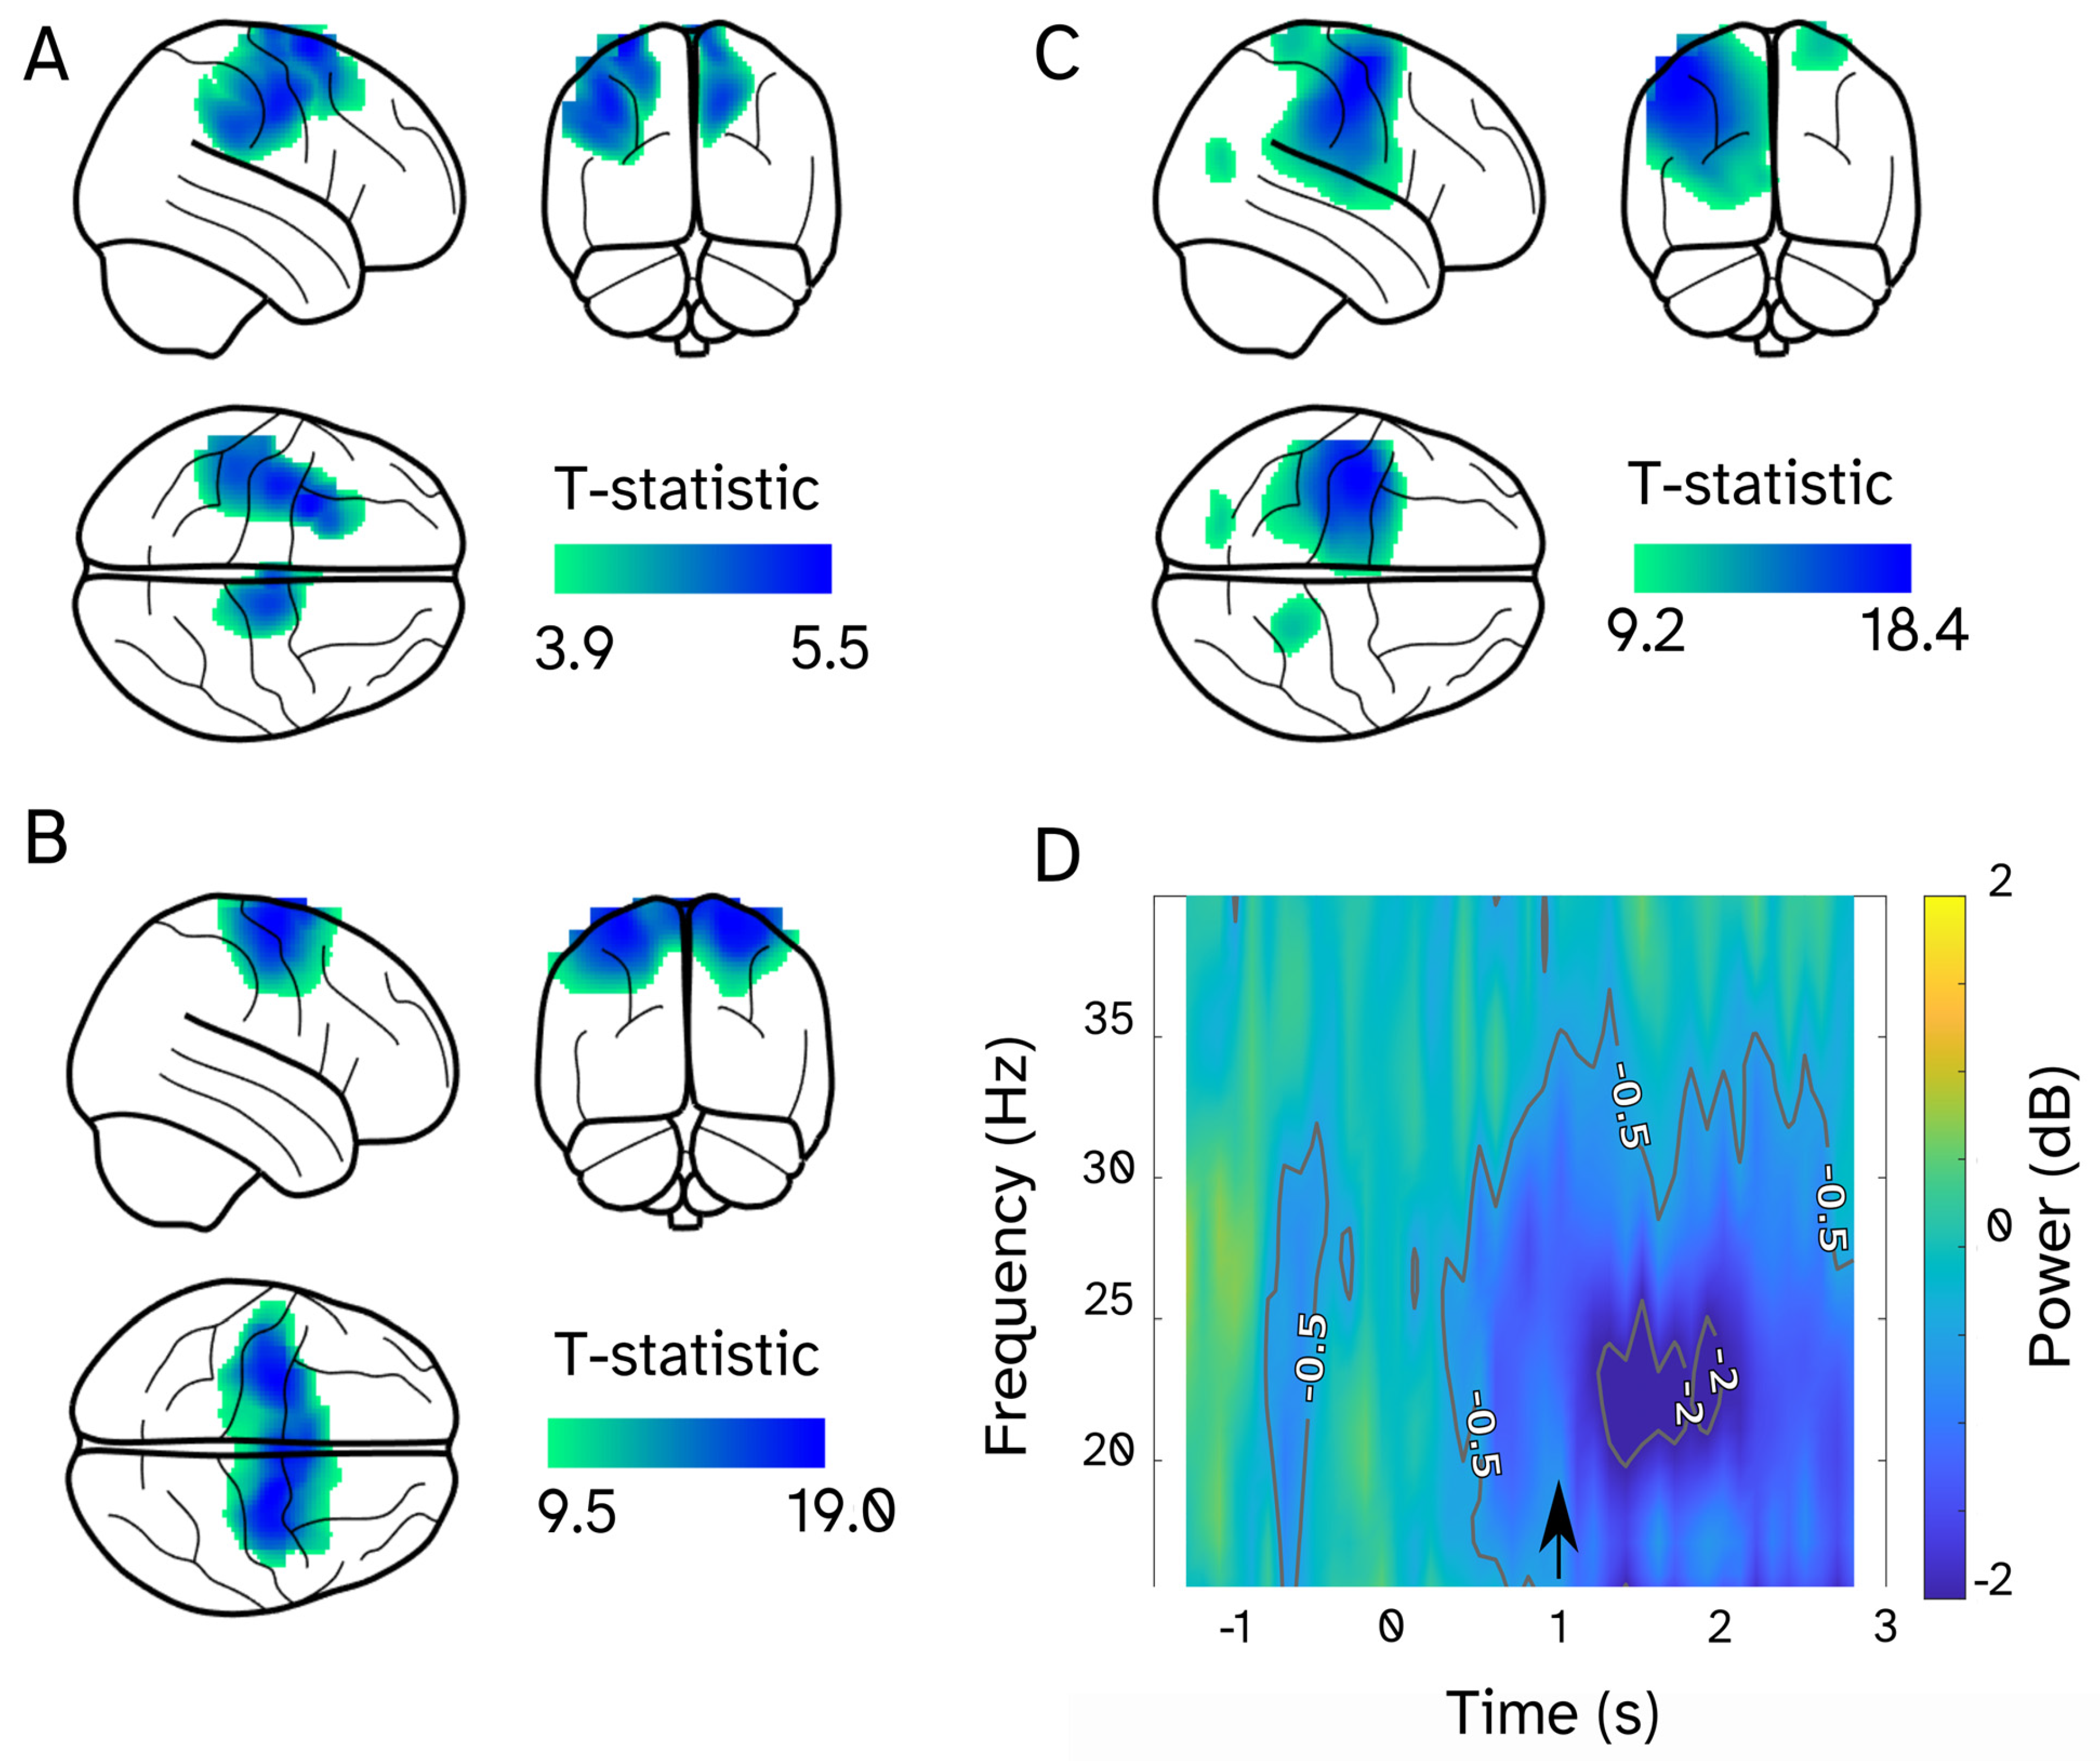
2.5.2. Source Imaging
2.5.3. Relationships Between Brain Activity and Behavior
3. Results
4. Discussion
Supplementary Materials
Author Contributions
Funding
Institutional Review Board Statement
Informed Consent Statement
Data Availability Statement
Conflicts of Interest
Abbreviations
| OPM | Optically pumped magnetometer |
| MEG | Magnetoencephalography |
| MSR | Magnetically shielded room |
References
- Gwin, J.T.; Gramann, K.; Makeig, S.; Ferris, D.P. Electrocortical Activity Is Coupled to Gait Cycle Phase during Treadmill Walking. NeuroImage 2011, 54, 1289–1296. [Google Scholar] [CrossRef] [PubMed]
- Seeber, M.; Scherer, R.; Wagner, J.; Solis-Escalante, T.; Muller-Putz, G.R. EEG Beta Suppression and Low Gamma Modulation Are Different Elements of Human Upright Walking. Front. Hum. Neurosci. 2014, 8, 485. [Google Scholar] [CrossRef] [PubMed]
- Castermans, T.; Duvinage, M.; Cheron, G.; Dutoit, T. About the Cortical Origin of the Low-Delta and High-Gamma Rhythms Observed in EEG Signals during Treadmill Walking. Neurosci. Lett. 2014, 561, 166–170. [Google Scholar] [CrossRef]
- Spedden, M.E.; Beck, M.M.; West, T.O.; Farmer, S.F.; Nielsen, J.B.; Lundbye-Jensen, J. Dynamics of Cortical and Corticomuscular Connectivity during Planning and Execution of Visually Guided Steps in Humans. Cereb. Cortex 2022, 33, 258–277. [Google Scholar] [CrossRef]
- Bulea, T.C.; Kim, J.; Damiano, D.L.; Stanley, C.J.; Park, H. Prefrontal, Posterior Parietal and Sensorimotor Network Activity Underlying Speed Control during Walking. Front. Hum. Neurosci. 2015, 9, 247. [Google Scholar] [CrossRef]
- Seeber, M.; Scherer, R.; Wagner, J.; Solis-escalante, T.; Müller-putz, G.R. High and Low Gamma EEG Oscillations in Central Sensorimotor Areas Are Conversely Modulated during the Human Gait Cycle. NeuroImage 2015, 112, 318–326. [Google Scholar] [CrossRef]
- Muthukumaraswamy, S.D. High-Frequency Brain Activity and Muscle Artifacts in MEG/EEG: A Review and Recommendations. Front. Hum. Neurosci. 2013, 7, 138. [Google Scholar] [CrossRef]
- Brookes, M.J.; Leggett, J.; Rea, M.; Hill, R.M.; Holmes, N.; Boto, E.; Bowtell, R. Magnetoencephalography with Optically Pumped Magnetometers (OPM-MEG): The next Generation of Functional Neuroimaging. Trends Neurosci. 2022, 45, 621–634. [Google Scholar] [CrossRef]
- Holmes, N.; Rea, M.; Hill, R.M.; Boto, E.; Leggett, J.; Edwards, L.J.; Rhodes, N.; Shah, V.; Osborne, J.; Fromhold, T.M.; et al. Naturalistic Hyperscanning with Wearable Magnetoencephalography. Sensors 2023, 23, 5454. [Google Scholar] [CrossRef]
- Brickwedde, M.; Anders, P.; Kühn, A.A.; Lofredi, R.; Holtkamp, M.; Kaindl, A.M.; Grent-‘t-Jong, T.; Krüger, P.; Sander, T.; Uhlhaas, P.J. Applications of OPM-MEG for Translational Neuroscience: A Perspective. Transl. Psychiatry 2024, 14, 1–12. [Google Scholar] [CrossRef]
- Roth, B.J. Biomagnetism: The First Sixty Years. Sensors 2023, 23, 4218. [Google Scholar] [CrossRef] [PubMed]
- Roberts, T.P.L.; Birnbaum, C.; Bloy, L.; Gaetz, W. Beyond Sensitivity: What Are the Enabling Opportunities of OPM-MEG? Front. Med. Technol. 2025, 7, 1515548. [Google Scholar] [CrossRef] [PubMed]
- Iivanainen, J.; Stenroos, M.; Parkkonen, L. Measuring MEG Closer to the Brain: Performance of on-Scalp Sensor Arrays. NeuroImage 2017, 147, 542–553. [Google Scholar] [CrossRef] [PubMed]
- Hill, R.M.; Boto, E.; Rea, M.; Holmes, N.; Leggett, J.; Coles, L.A.; Papastavrou, M.; Everton, S.K.; Hunt, B.A.E.; Sims, D.; et al. Multi-Channel Whole-Head OPM-MEG: Helmet Design and a Comparison with a Conventional System. NeuroImage 2020, 219, 116995. [Google Scholar] [CrossRef]
- Seymour, R.A.; Alexander, N.; Mellor, S.; O’Neill, G.C.; Tierney, T.M.; Barnes, G.R.; Maguire, E.A. Using OPMs to Measure Neural Activity in Standing, Mobile Participants. NeuroImage 2021, 244, 118604. [Google Scholar] [CrossRef]
- Seymour, R.A.; Alexander, N.; Mellor, S.; O’Neill, G.C.; Tierney, T.M.; Barnes, G.R.; Maguire, E.A. Interference Suppression Techniques for OPM-Based MEG: Opportunities and Challenges. NeuroImage 2022, 247, 118834. [Google Scholar] [CrossRef]
- Tierney, T.M.; Seedat, Z.; St Pier, K.; Mellor, S.; Barnes, G.R. Adaptive Multipole Models of Optically Pumped Magnetometer Data. Hum. Brain Mapp. 2024, 45, e26596. [Google Scholar] [CrossRef]
- Schofield, H.; Hill, R.M.; Feys, O.; Holmes, N.; Osborne, J.; Doyle, C.; Bobela, D.; Corvilain, P.; Wens, V.; Rier, L.; et al. A Novel, Robust, and Portable Platform for Magnetoencephalography Using Optically-Pumped Magnetometers. Imaging Neurosci. 2024, 2, 1–22. [Google Scholar] [CrossRef]
- Holmes, N.; Leggett, J.; Hill, R.M.; Rier, L.; Boto, E.; Schofield, H.; Hayward, T.; Dawson, E.; Woolger, D.; Shah, V.; et al. Wearable Magnetoencephalography in a Lightly Shielded Environment. IEEE Trans. Biomed. Eng. 2025, 72, 609–618. [Google Scholar] [CrossRef]
- Hill, R.M.; Devasagayam, J.; Holmes, N.; Boto, E.; Shah, V.; Osborne, J.; Safar, K.; Worcester, F.; Mariani, C.; Dawson, E.; et al. Using OPM-MEG in Contrasting Magnetic Environments. NeuroImage 2022, 253, 119084. [Google Scholar] [CrossRef]
- Iivanainen, J.; Zetter, R.; Grön, M.; Hakkarainen, K.; Parkkonen, L. On-Scalp MEG System Utilizing an Actively Shielded Array of Optically-Pumped Magnetometers. NeuroImage 2019, 194, 244–258. [Google Scholar] [CrossRef] [PubMed]
- Xiang, J.; Tong, H.; Jiang, Y.; Barnes-Davis, M.E. Spatial and Frequency Specific Artifact Reduction in Optically Pumped Magnetometer Recordings. J. Integr. Neurosci. 2022, 21, 145. [Google Scholar] [CrossRef] [PubMed]
- O’Neill, G.C.; Seymour, R.A.; Mellor, S.; Alexander, N.A.; Tierney, T.M.; Bernachot, L.; Fahimi Hnazaee, M.; Spedden, M.E.; Timms, R.C.; Bush, D.; et al. Combining Video Telemetry and Wearable MEG for Naturalistic Imaging. Imaging Neurosci. 2025, 3, 1–16. [Google Scholar] [CrossRef]
- Calancie, B.; Needham-Shropshire, B.; Jacobs, P.; Willer, K.; Zych, G.; Green, B.A. Involuntary Stepping after Chronic Spinal Cord Injury. Brain 1994, 117, 1143–1159. [Google Scholar] [CrossRef]
- Dimitrijevic, M.R.; Gerasimenko, Y.; Pinter, M.M. Evidence for a Spinal Central Pattern Generator in Humans. Ann. N. Y. Acad. Sci. 1998, 860, 360–376. [Google Scholar] [CrossRef]
- Hamacher, D.; Herold, F.; Wiegel, P.; Hamacher, D.; Schega, L. Brain Activity during Walking: A Systematic Review. Neurosci. Biobehav. Rev. 2015, 57, 310–327. [Google Scholar] [CrossRef]
- Pirker, W.; Katzenschlager, R. Gait Disorders in Adults and the Elderly: A Clinical Guide. Cent. Eur. J. Med. 2017, 129, 81–95. [Google Scholar] [CrossRef]
- Illman, M.; Laaksonen, K.; Jousmäki, V.; Forss, N.; Piitulainen, H. Reproducibility of Rolandic Beta Rhythm Modulation in MEG and EEG. J. Neurophysiol. 2022, 127, 559–570. [Google Scholar] [CrossRef]
- Pfurtscheller, G.; Lopes da Silva, F.H. Event-Related EEG/MEG Synchronization and Desynchronization: Basic Principles. Clin. Neurophysiol. 1999, 110, 1842–1857. [Google Scholar] [CrossRef]
- van Wijk, B.C.M.; Beek, P.J.; Daffertshofer, A. Neural Synchrony within the Motor System: What Have We Learned so Far? Front. Hum. Neurosci. 2012, 6, 252. [Google Scholar] [CrossRef]
- Spedden, M.E.; O’Neill, G.C.; West, T.O.; Tierney, T.M.; Mellor, S.; Alexander, N.A.; Seymour, R.; Lundbye-Jensen, J.; Nielsen, J.B.; Farmer, S.F.; et al. Wearable MEG Recorded during Human Stepping. Data Brief 2025, 60, 11574. [Google Scholar] [CrossRef] [PubMed]
- Mellor, S.; Tierney, T.M.; O’Neill, G.C.; Alexander, N.; Seymour, R.A.; Holmes, N.; Lopez, J.D.; Hill, R.M.; Boto, E.; Rea, M.; et al. Magnetic Field Mapping and Correction for Moving OP-MEG. IEEE Trans. Biomed. Eng. 2022, 69, 528–536. [Google Scholar] [CrossRef] [PubMed]
- Tierney, T.M.; Alexander, N.A.; Avila, N.L.; Balbastre, Y.; Barnes, G.; Bezsudnova, Y.; Brudfors, M.; Eckstein, K.; Flandin, G.; Friston, K.; et al. SPM 25: Open Source Neuroimaging Analysis Software. arXiv 2025, arXiv:2501.12081. [Google Scholar] [CrossRef]
- Tierney, T.M.; Alexander, N.; Mellor, S.; Holmes, N.; Seymour, R.; O’Neill, G.C.; Maguire, E.A.; Barnes, G.R. Modelling Optically Pumped Magnetometer Interference in MEG as a Spatially Homogeneous Magnetic Field. NeuroImage 2021, 244, 118484. [Google Scholar] [CrossRef]
- Van Veen, B.D.; Van Drongelen, W.; Yuchtman, M.; Suzuki, A. Localization of Brain Electrical Activity via Linearly Constrained Minimum Variance Spatial Filtering. IEEE Trans. Biomed. Eng. 1997, 44, 867–880. [Google Scholar] [CrossRef]
- Nolte, G. The Magnetic Lead Field Theorem in the Quasi-Static Approximation and Its Use for Magnetoencephalography Forward Calculation in Realistic Volume Conductors. Phys. Med. Biol. 2003, 48, 3637–3652. [Google Scholar] [CrossRef]
- Schoffelen, J.M.; Gross, J. Source Connectivity Analysis with MEG and EEG. Hum. Brain Mapp. 2009, 30, 1857–1865. [Google Scholar] [CrossRef]
- Kilner, J.M.; Friston, K.J. Topological Inference for EEG and MEG. Ann. Appl. Stat. 2010, 4, 1272–1290. [Google Scholar] [CrossRef]
- Barone, J.; Rossiter, H.E. Understanding the Role of Sensorimotor Beta Oscillations. Front. Syst. Neurosci. 2021, 15, 655886. [Google Scholar] [CrossRef]
- Pfurtscheller, G. Spatiotemporal ERD/ERS Patterns during Voluntary Movement and Motor Imagery. Suppl. Clin. Neurophysiol. 2000, 53, 196–198. [Google Scholar] [CrossRef]
- Korivand, S.; Jalili, N.; Gong, J. Experiment Protocols for Brain-Body Imaging of Locomotion: A Systematic Review. Front. Neurosci. 2023, 17, 1051500. [Google Scholar] [CrossRef] [PubMed]
- Baillet, S. Magnetoencephalography for Brain Electrophysiology and Imaging. Nat. Neurosci. 2017, 20, 327–339. [Google Scholar] [CrossRef] [PubMed]
- Boto, E.; Seedat, Z.A.; Holmes, N.; Leggett, J.; Hill, R.M.; Roberts, G.; Shah, V.; Fromhold, T.M.; Mullinger, K.J.; Tierney, T.M.; et al. Wearable Neuroimaging: Combining and Contrasting Magnetoencephalography and Electroencephalography. NeuroImage 2019, 201, 116099. [Google Scholar] [CrossRef] [PubMed]
- Mellor, S.; Tierney, T.M.; Seymour, R.A.; Timms, R.C.; O’Neill, G.C.; Alexander, N.; Spedden, M.E.; Payne, H.; Barnes, G.R. Real-Time, Model-Based Magnetic Field Correction for Moving, Wearable MEG. NeuroImage 2023, 278, 120252. [Google Scholar] [CrossRef]
- Litvak, V.; Eusebio, A.; Jha, A.; Oostenveld, R.; Barnes, G.R.; Penny, W.D.; Zrinzo, L.; Hariz, M.I.; Limousin, P.; Friston, K.J.; et al. Optimized Beamforming for Simultaneous MEG and Intracranial Local Field Potential Recordings in Deep Brain Stimulation Patients. NeuroImage 2010, 50, 1578–1588. [Google Scholar] [CrossRef]
- Arber, S.; Costa, R.M. Connecting Neuronal Circuits for Movement. Science 2018, 360, 1403–1404. [Google Scholar] [CrossRef]
- Spedden, M.E.; O’Neill, G.C.; Tierney, T.M.; West, T.O.; Schmidt, M.; Mellor, S.; Farmer, S.F.; Bestmann, S.; Barnes, G.R. Towards Non-Invasive Imaging through Spinal-Cord Generated Magnetic Fields. Front. Med. Technol. 2024, 6, 1470970. [Google Scholar] [CrossRef]

Disclaimer/Publisher’s Note: The statements, opinions and data contained in all publications are solely those of the individual author(s) and contributor(s) and not of MDPI and/or the editor(s). MDPI and/or the editor(s) disclaim responsibility for any injury to people or property resulting from any ideas, methods, instructions or products referred to in the content. |
© 2025 by the authors. Licensee MDPI, Basel, Switzerland. This article is an open access article distributed under the terms and conditions of the Creative Commons Attribution (CC BY) license (https://creativecommons.org/licenses/by/4.0/).
Share and Cite
Spedden, M.E.; O’Neill, G.C.; West, T.O.; Tierney, T.M.; Mellor, S.; Alexander, N.A.; Seymour, R.; Lundbye-Jensen, J.; Nielsen, J.B.; Farmer, S.F.; et al. Using Wearable MEG to Study the Neural Control of Human Stepping. Sensors 2025, 25, 4160. https://doi.org/10.3390/s25134160
Spedden ME, O’Neill GC, West TO, Tierney TM, Mellor S, Alexander NA, Seymour R, Lundbye-Jensen J, Nielsen JB, Farmer SF, et al. Using Wearable MEG to Study the Neural Control of Human Stepping. Sensors. 2025; 25(13):4160. https://doi.org/10.3390/s25134160
Chicago/Turabian StyleSpedden, Meaghan E., George C. O’Neill, Timothy O. West, Tim M. Tierney, Stephanie Mellor, Nicholas A. Alexander, Robert Seymour, Jesper Lundbye-Jensen, Jens Bo Nielsen, Simon F. Farmer, and et al. 2025. "Using Wearable MEG to Study the Neural Control of Human Stepping" Sensors 25, no. 13: 4160. https://doi.org/10.3390/s25134160
APA StyleSpedden, M. E., O’Neill, G. C., West, T. O., Tierney, T. M., Mellor, S., Alexander, N. A., Seymour, R., Lundbye-Jensen, J., Nielsen, J. B., Farmer, S. F., Bestmann, S., & Barnes, G. R. (2025). Using Wearable MEG to Study the Neural Control of Human Stepping. Sensors, 25(13), 4160. https://doi.org/10.3390/s25134160