
Towards Explainable Graph Embeddings for Gait Assessment Using Per-Cluster Dimensional Weighting


Abstract

1. Introduction
- (1)
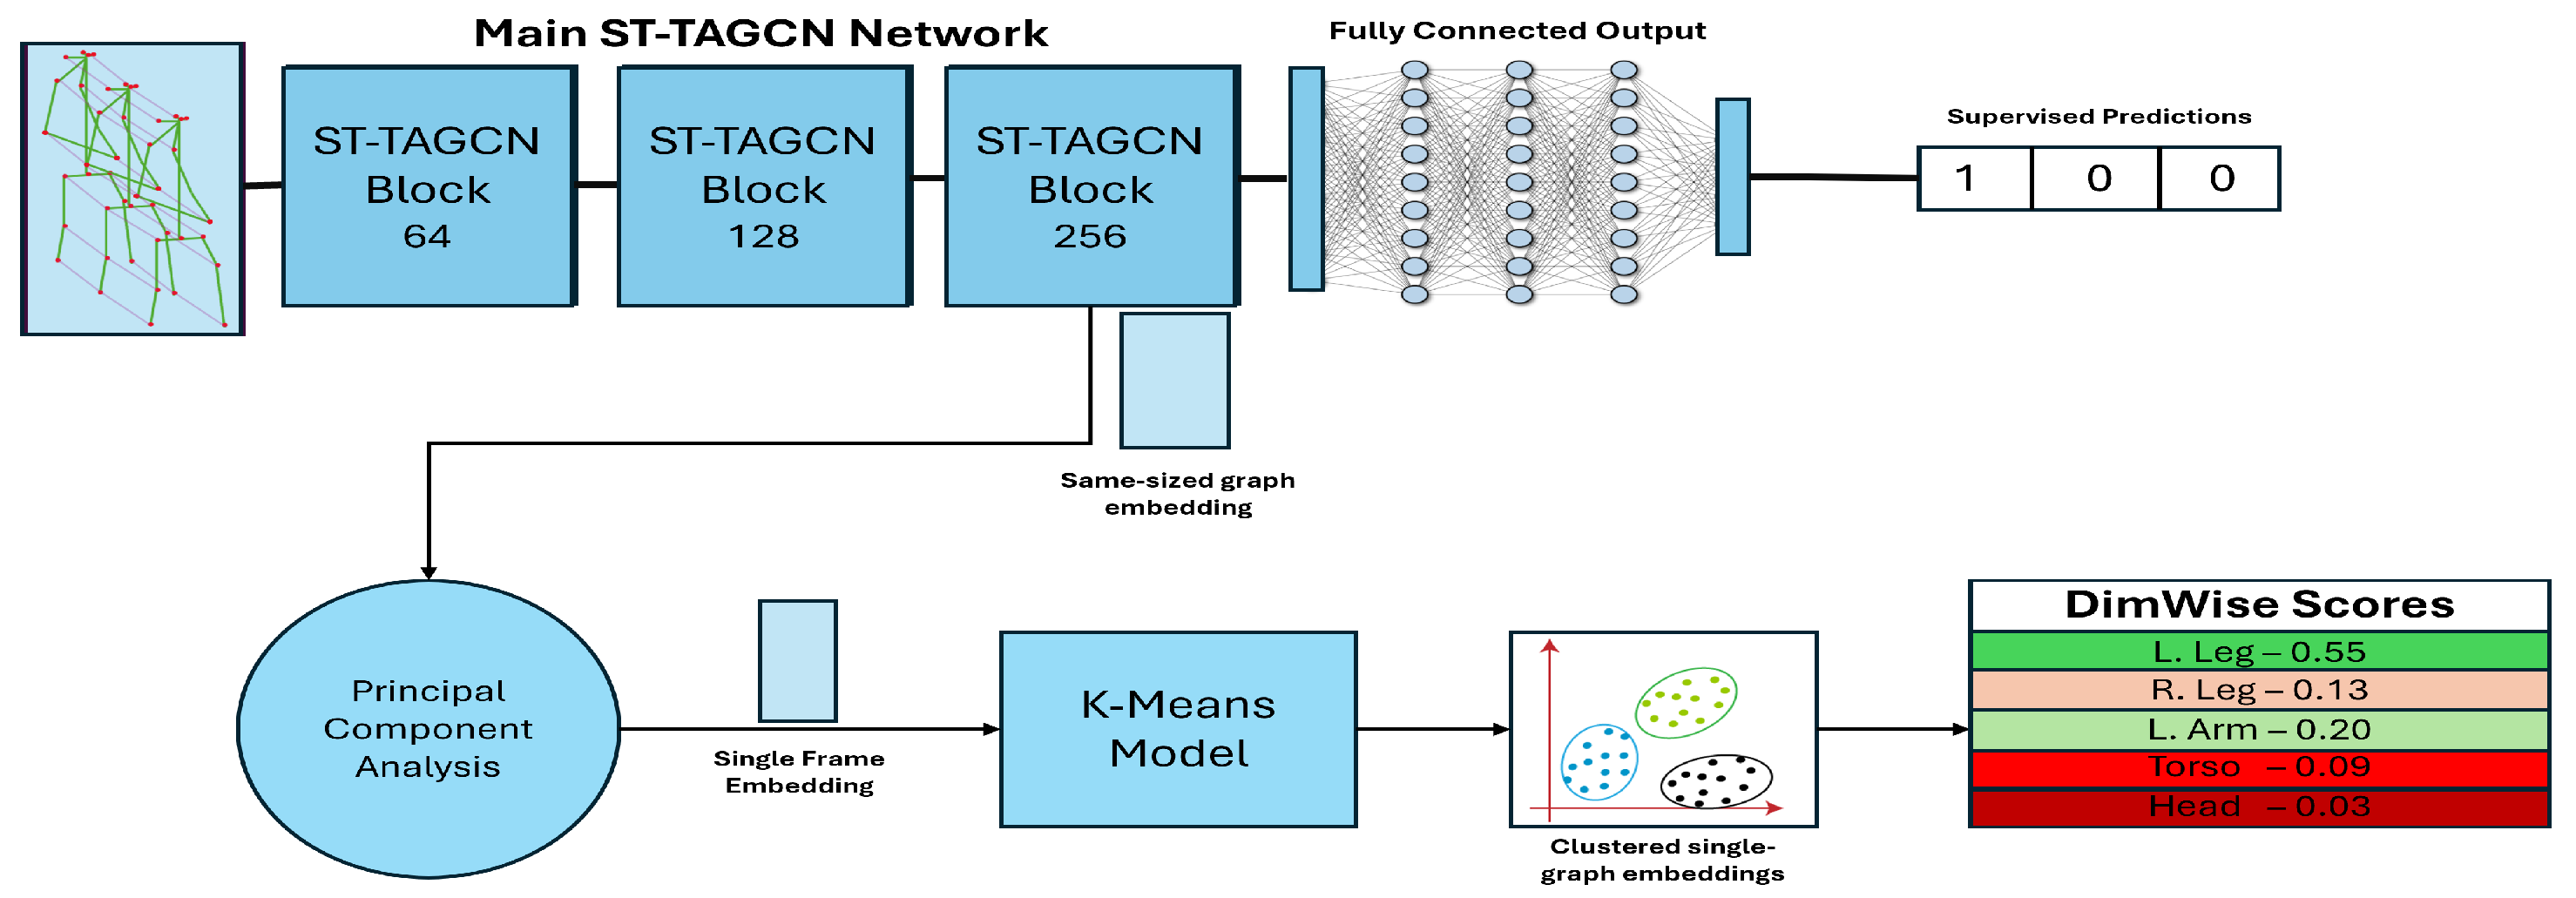
- A novel ST-GCN-based embedding approach, supplemented with context-aware PCA to generate descriptive single-frame gait representations for more accurate clustering. These embeddings achieve state-of-the-art accuracy and f1 scores in a supervised gait abnormality assessment when used with K-means.
- (2)
- A novel feature importance score named DimWise, capable of ranking, per-cluster, the importance of features to provide an explainable description of clusters without requiring prior knowledge of the pathologies in a dataset other than what the “regular” gait class is.
- (3)
- A pair of confidence and severity scores to communicate to a user both the confidence the system has for its prediction and the estimated degree of difference of a pathology from an individual’s regular gait.
2. Related Work
2.1. Machine Learning in Gait Assessment
2.2. Gait Pathology Datasets
2.3. Unsupervised Gait Assessment and Embedding Methods
3. Methodology
3.1. Datasets and Pre-Processing
3.2. Machine Learning Model Embedding
3.3. DimWise, Severity and Confidence Metrics
- (1)
- Confidence: the confidence that the clusters represent statistically distinct gait pathologies.
- (2)
- Severity: the degree of difference of gait pathologies from regular gait patterns.
4. Results
4.1. Performance of the Proposed Model
4.2. Evaluation of the DimWise Metric
4.3. Analysis of the Confidence and Severity Score
5. Conclusions
6. Discussion
Author Contributions
Funding
Institutional Review Board Statement
Informed Consent Statement
Data Availability Statement
Conflicts of Interest
Appendix A

| Body Part | No. Joints | Weight |
|---|---|---|
| Head | 4 | 0.4 |
| Torso | 2 | 0.8 |
| L.Arm | 3 | 0.3 |
| R.arm | 3 | 0.3 |
| L.Leg | 3 | 0.6 |
| R.Leg | 3 | 0.6 |
| Data | Abnormality | Head | Torso | L. Arm | R. Arm | L. Leg | R. Leg |
|---|---|---|---|---|---|---|---|
| [28] | Regular | 12 (4) | 14 (3) | 9 (5) | 4 (6) | 22 (2) | 36 (1) |
| [28] | Limping left leg | 10 (4) | 14 (3) | 6 (6) | 9 (5) | 39 (1) | 19 (2) |
| [28] | Shuffling gait | 22 (2) | 10 (6) | 12 (5) | 14 (4) | 23 (1) | 16 (3) |
| [25] | None | 12 (4) | 15 (3) | 8 (5) | 6 (6) | 27 (2) | 30 (1) |
| [25] | Antalgic | 17 (4) | 20 (3) | 3 (6) | 7 (5) | 30 (1) | 21 (2) |
| [25] | Stiff-legged | 18 (3) | 10 (6) | 12 (4) | 11 (5) | 21 (2) | 25 (1) |
| [25] | Lurching | 14 (4) | 20 (2) | 9 (5) | 9 (6) | 26 (1) | 19 (3) |
| [25] | Steppage | 13 (3) | 11 (4) | 10 (5) | 9 (6) | 31 (1) | 24 (2) |
| [25] | Trendelenburg gait | 13 (4) | 15 (3) | 10 (6) | 11 (5) | 23 (2) | 26 (1) |
| [24] | None | 17 (2) | 16 (3) | 11 (6) | 12 (5) | 13 (4) | 28 (1) |
| [24] | L. foot, small pad | 20 (2) | 19 (3) | 8 (6) | 13 (5) | 17 (4) | 21 (1) |
| [24] | L. foot, med pad | 17 (2) | 16 (5) | 7 (6) | 16 (3) | 25 (1) | 16 (4) |
| [24] | L. foot, large pad | 15 (4) | 19 (2) | 9 (6) | 16 (3) | 25 (1) | 14 (5) |
| [24] | L. foot weight | 18 (3) | 19 (2) | 9 (6) | 14 (4) | 24 (1) | 13 (5) |
| [24] | R. foot, small pad | 13 (4) | 14 (3) | 14 (2) | 12 (5) | 9 (6) | 35 (1) |
| [24] | R. foot, med pad | 11 (4) | 10 (5) | 16 (2) | 9 (6) | 13 (3) | 37 (1) |
| [24] | R. foot, large pad | 9 (5) | 14 (2) | 13 (3) | 8 (6) | 11 (4) | 41 (1) |
| [24] | R. foot weight | 16 (3) | 23 (2) | 12 (4) | 10 (6) | 12 (5) | 24 (1) |
| Dataset | Abnormality | Severity (Mean) | Confidence (Mean) |
|---|---|---|---|
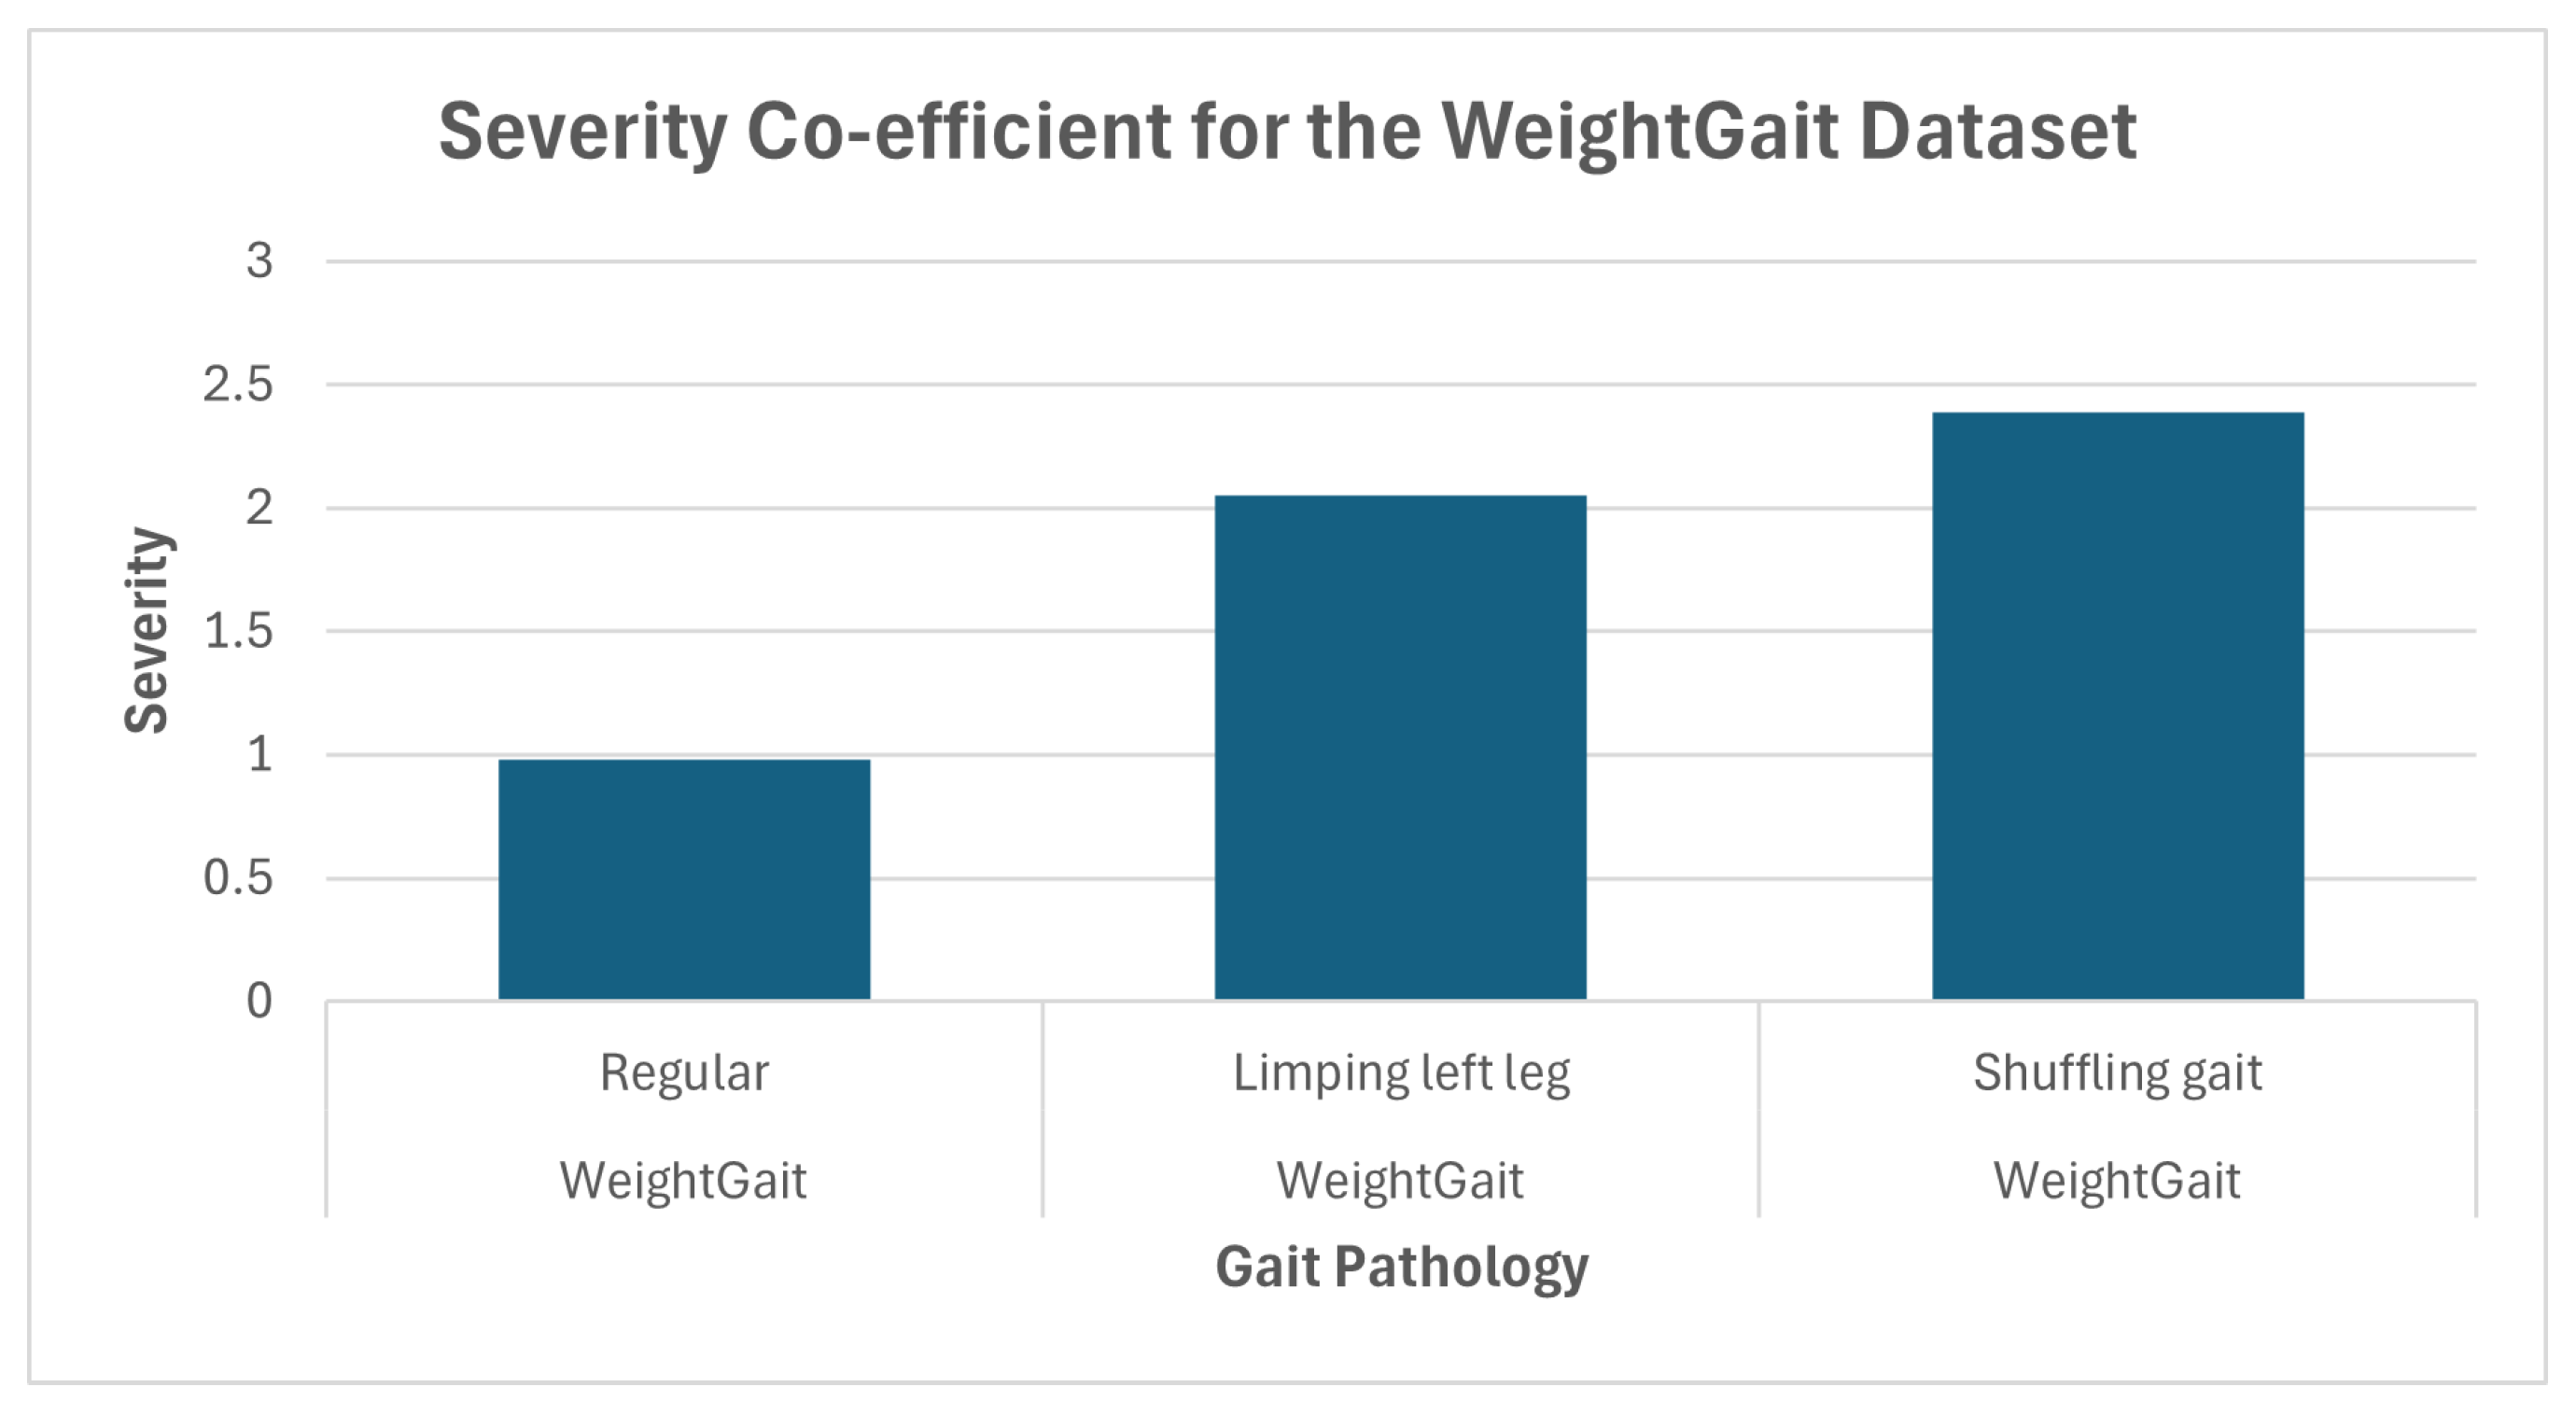
| WeightGait [28] | Regular | 0.98 | N/A |
| Limping left leg | 2.05 | 76.0 | |
| Shuffling gait | 2.39 | 80.21 | |
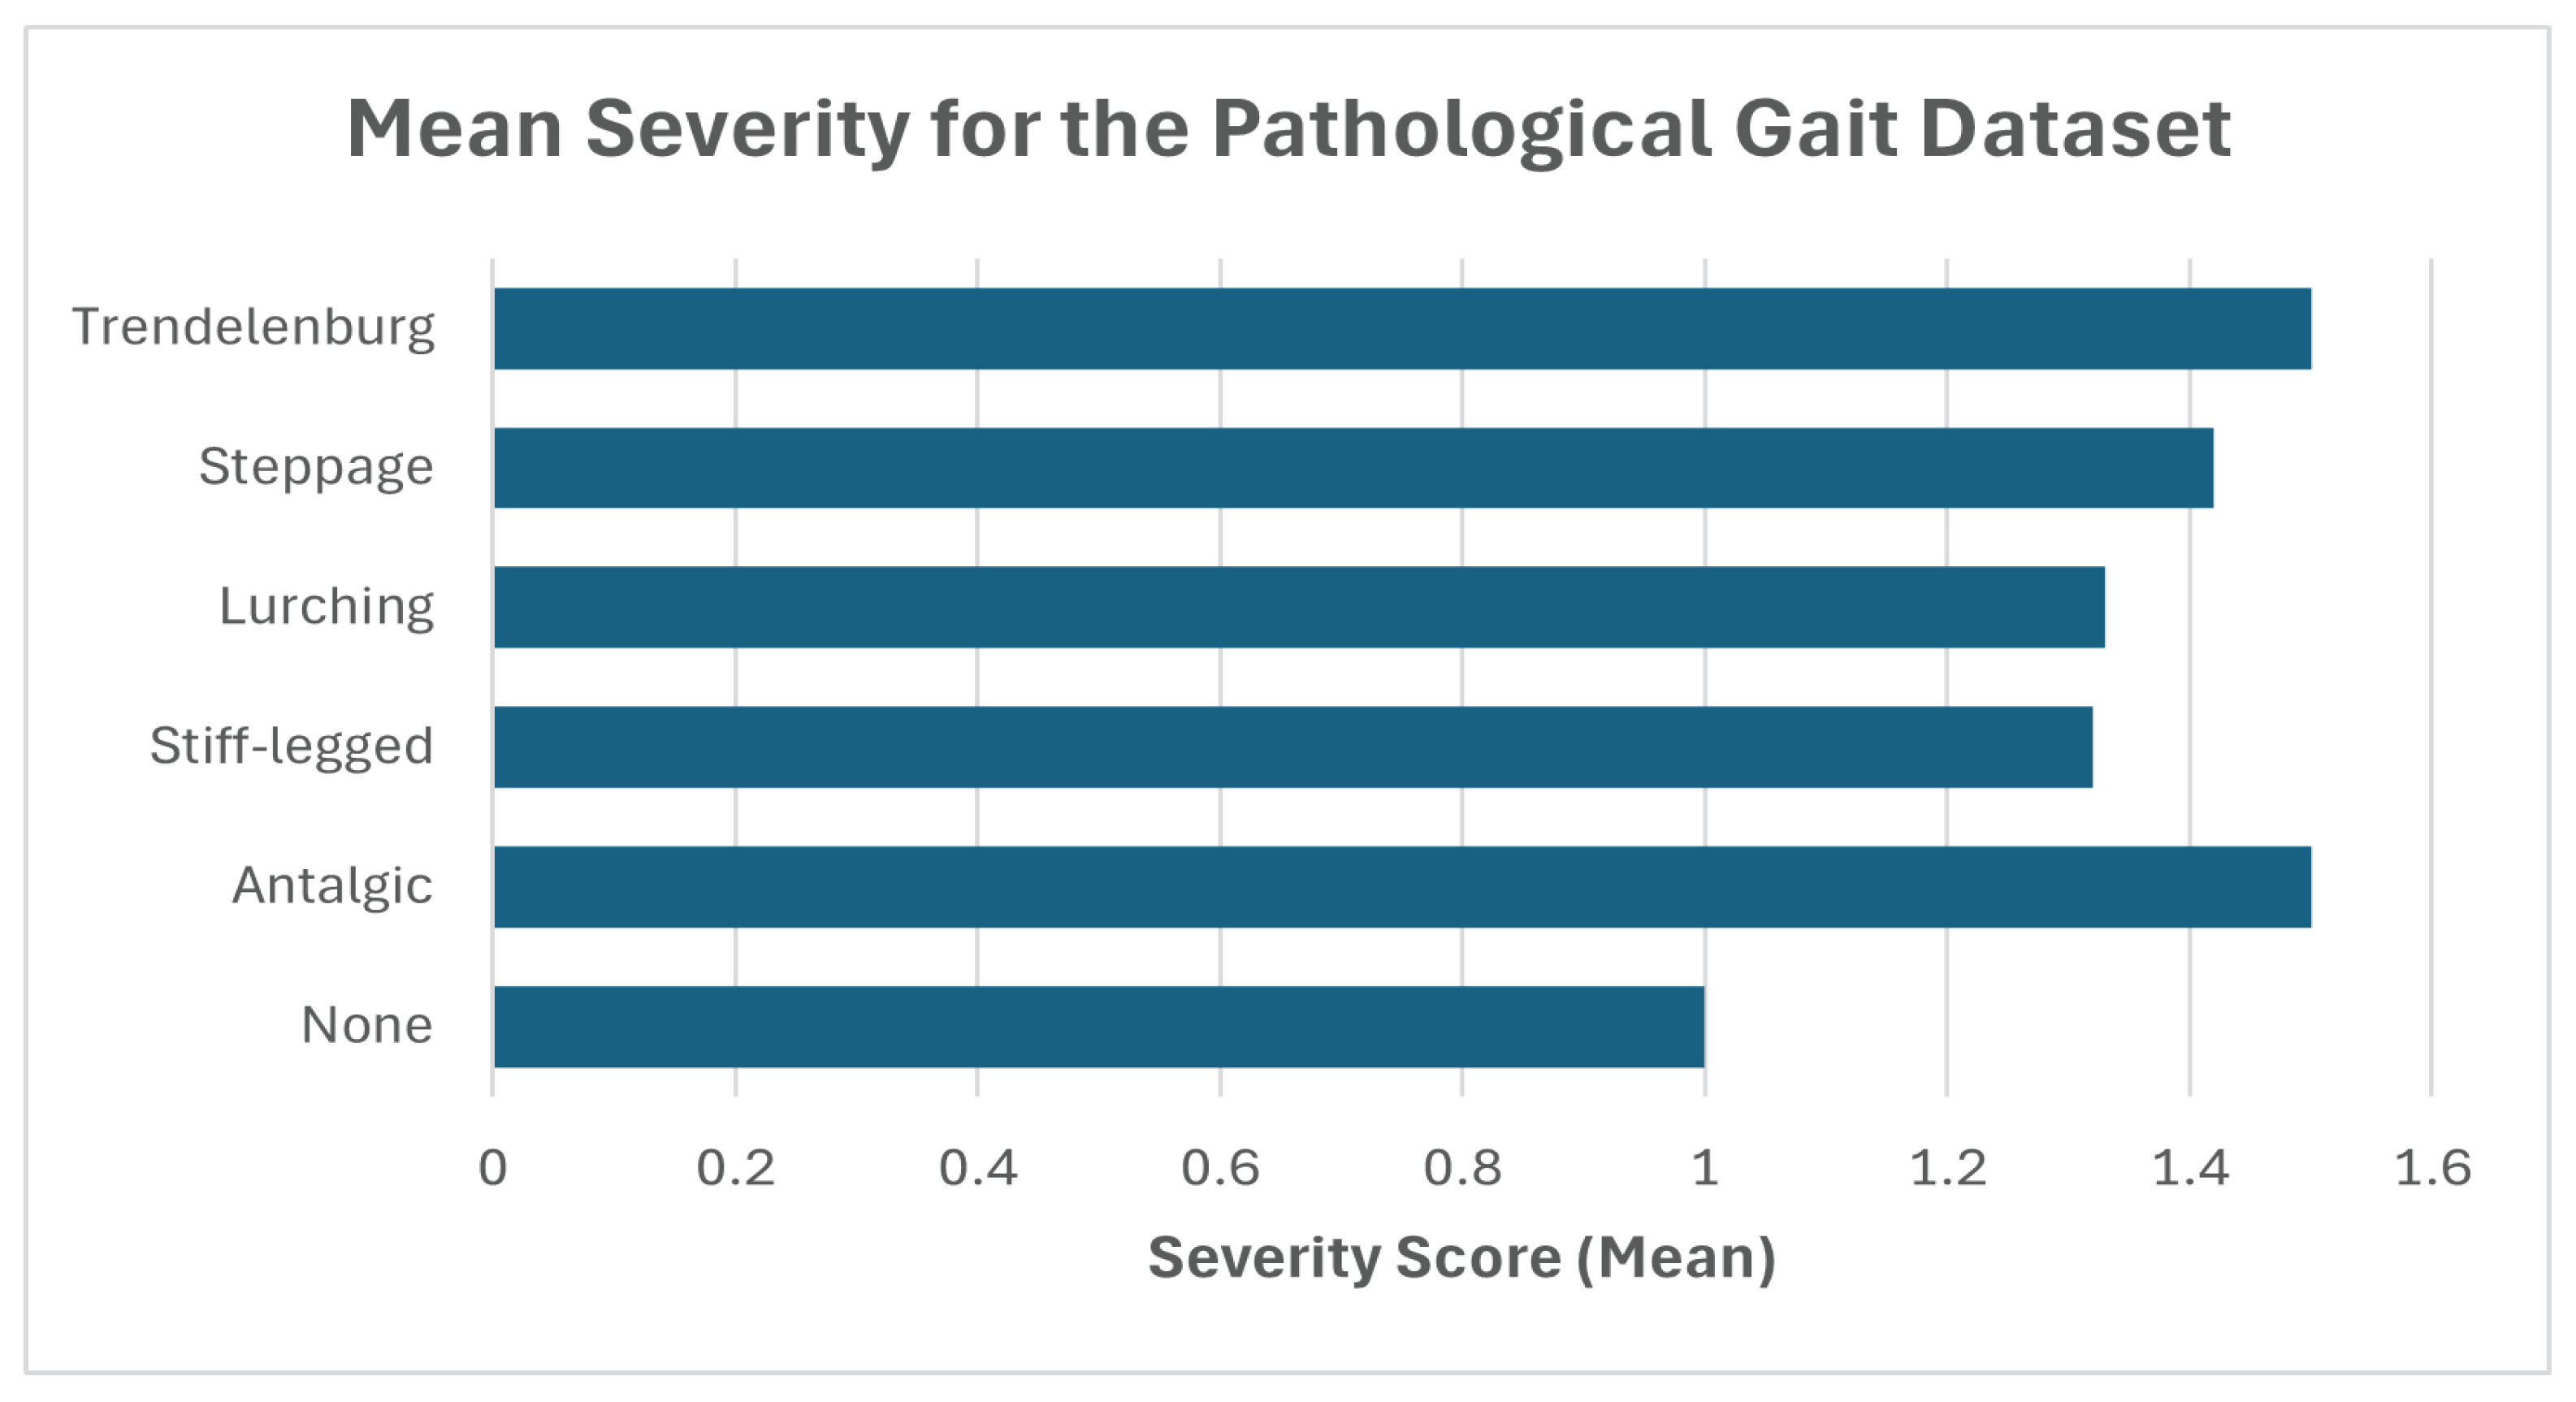
| Pathological Gait [25] | None | 1 | N/A |
| Antalgic | 1.5 | 89.94 | |
| Stiff-legged | 1.32 | 85.86 | |
| Lurching | 1.33 | 75.82 | |
| Steppage | 1.42 | 80.76 | |
| Trendelenburg gait | 1.5 | 80.24 | |
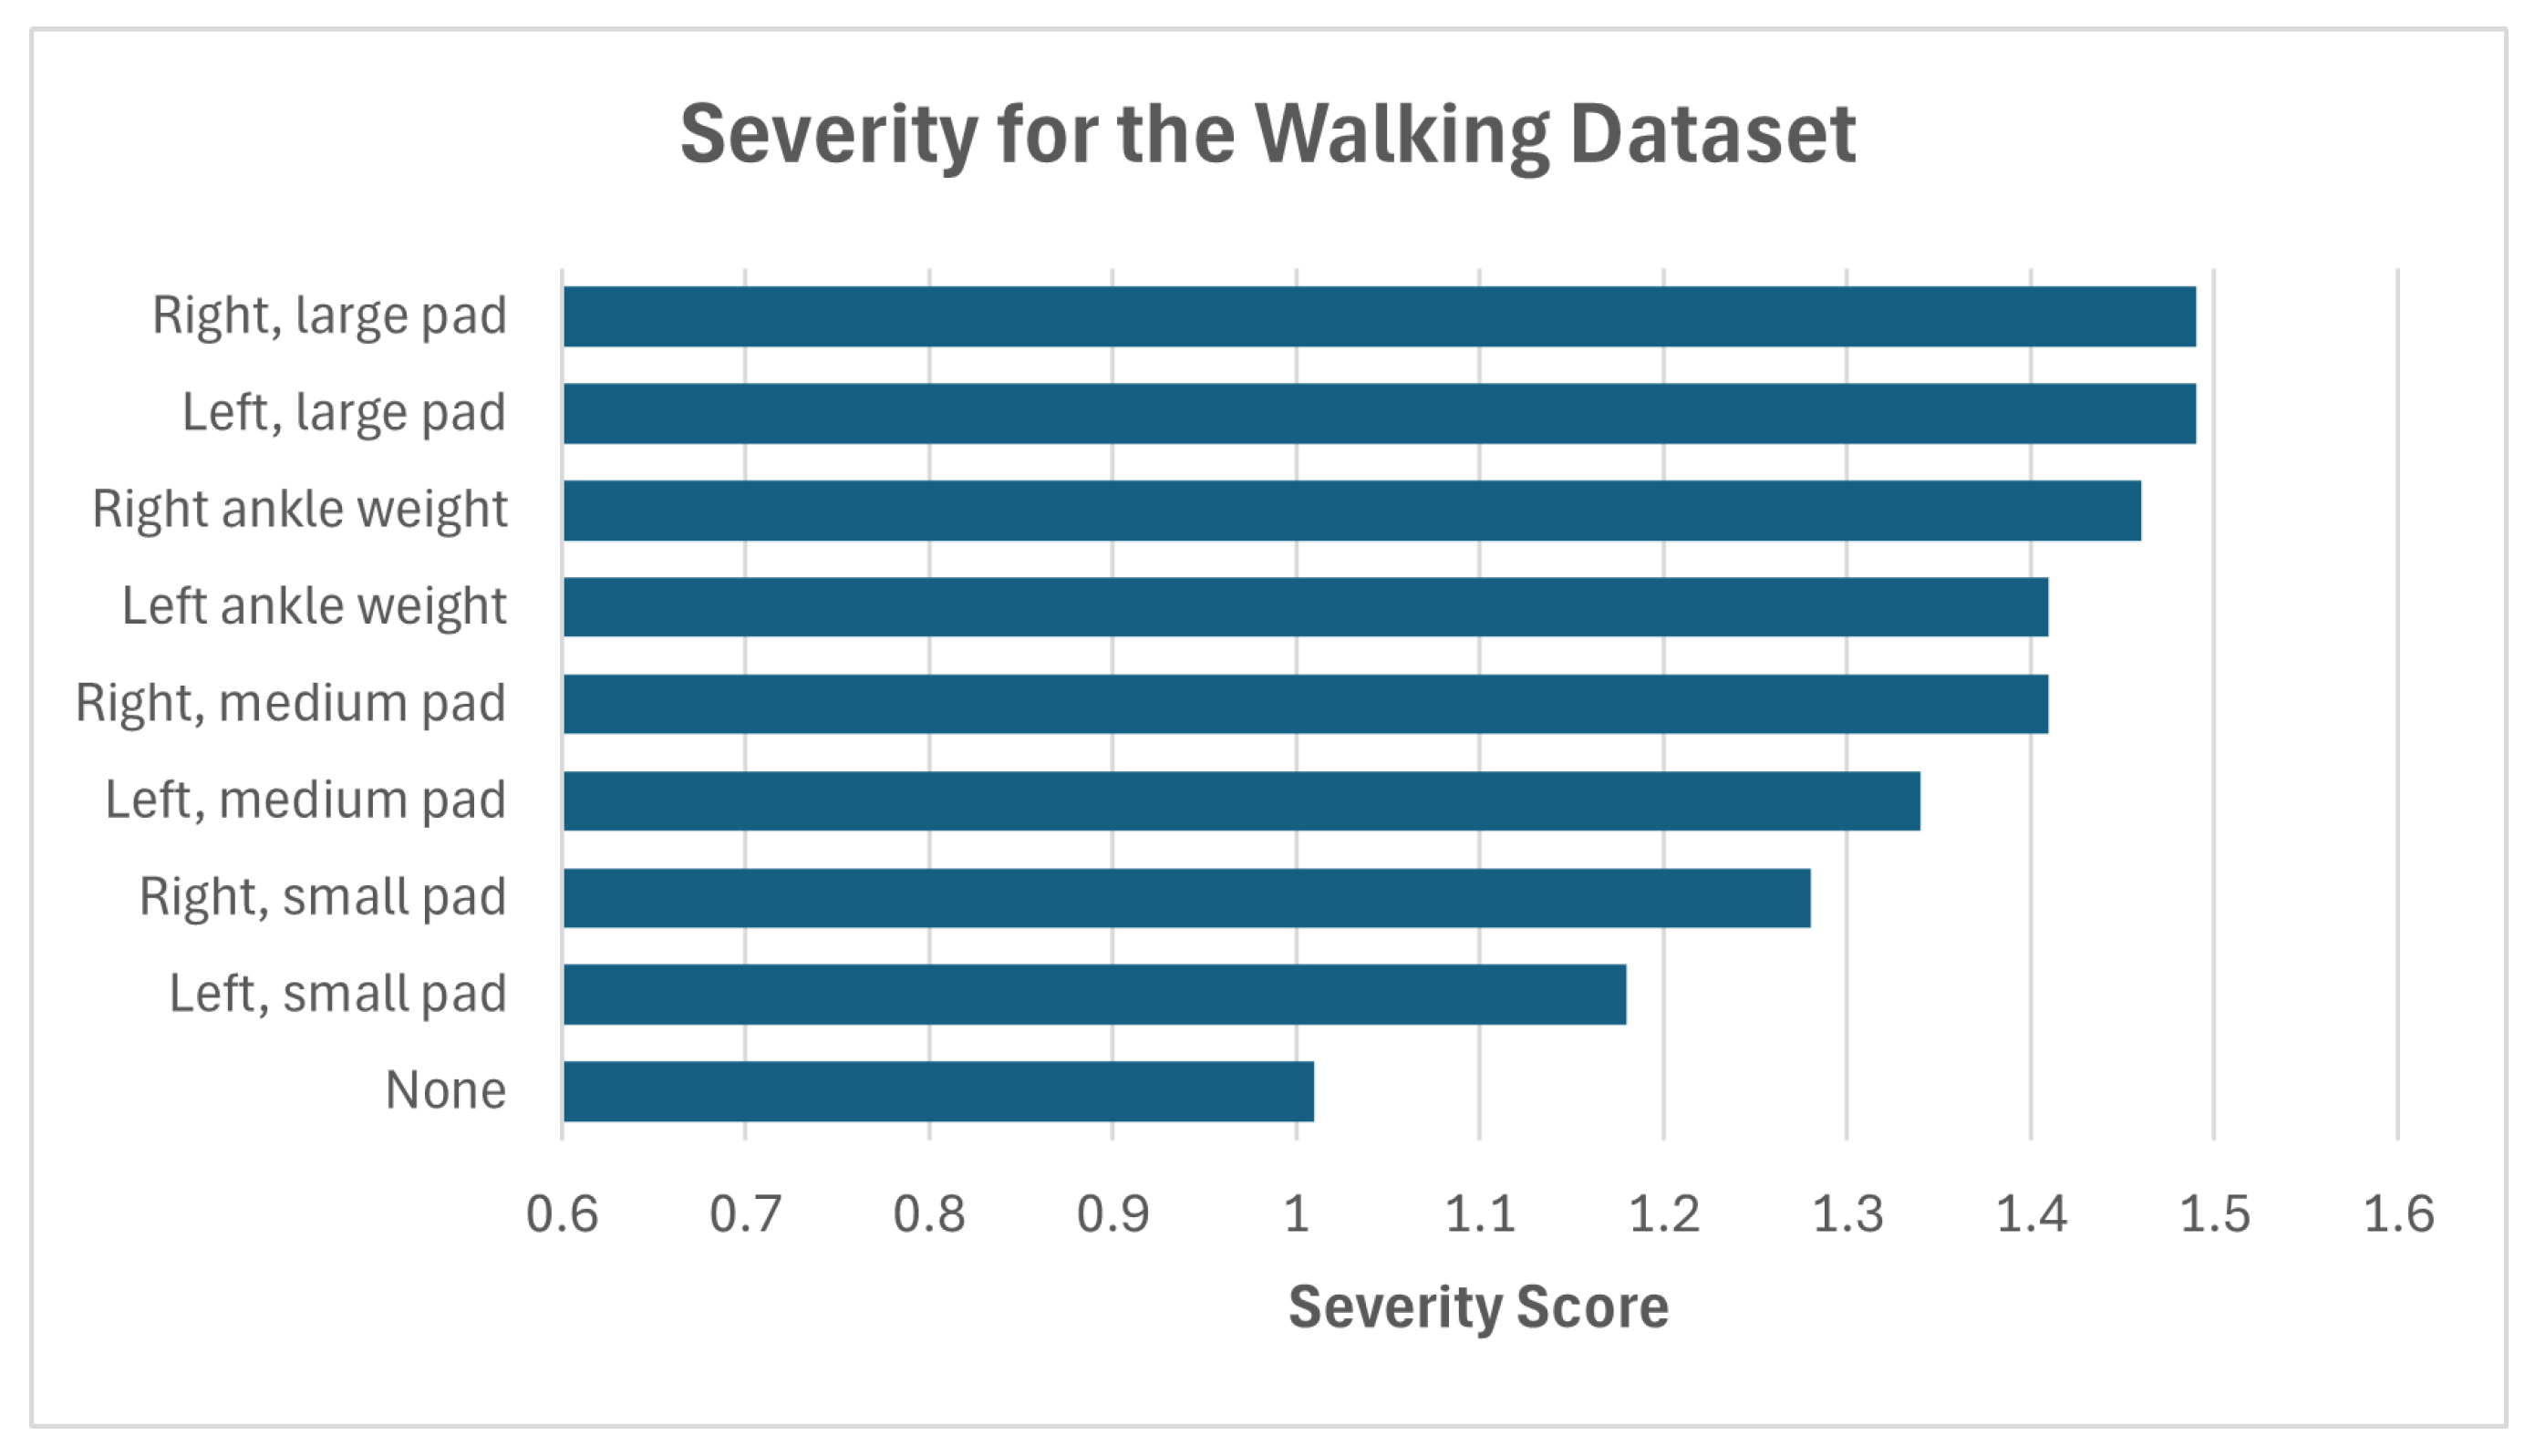
| Walking Gait dataset [24] | None | 1.01 | N/A |
| L. foot, small pad | 1.18 | 81.84 | |
| L. foot, medium pad | 1.34 | 88.08 | |
| L. foot, large pad | 1.49 | 87.58 | |
| L. foot ankle weight | 1.41 | 84.36 | |
| R. foot, small pad | 1.28 | 99.4 | |
| R. foot, medium pad | 1.56 | 80.58 | |
| R. foot, large pad | 1.49 | 90.09 | |
| R. foot ankle weight | 1.46 | 83.47 |
References
- Liu, W.; Lin, X.; Chen, X.; Wang, Q.; Wang, X.; Yang, B.; Cai, N.; Chen, R.; Chen, G.; Lin, Y. Vision-based estimation of mds-updrs scores for quantifying parkinson’s disease tremor severity. Med. Image Anal. 2023, 85, 102754. [Google Scholar] [CrossRef]
- Sepas-Moghaddam, A.; Etemad, A. Deep gait recognition: A survey. IEEE Trans. Pattern Anal. Mach. Intell. 2022, 45, 264–284. [Google Scholar] [CrossRef] [PubMed]
- Tian, H.; Li, H.; Jiang, W.; Ma, X.; Li, X.; Wu, H.; Li, Y. Cross-spatiotemporal graph convolution networks for skeleton-based parkinsonian gait mds-updrs score estimation. IEEE Trans. Neural Syst. Rehabil. Eng. 2024, 32, 412–421. [Google Scholar] [CrossRef]
- Zhang, J.; Lim, J.; Kim, M.; Hur, S.; Chung, T. Wm–stgcn: A novel spatiotemporal modeling method for parkinsonian gait recognition. Sensors 2023, 23, 4980. [Google Scholar] [CrossRef] [PubMed]
- Wang, X.; Ellul, J.; Azzopardi, G. Elderly fall detection systems: A literature survey. Front. Robot. AI 2020, 7, 71. [Google Scholar] [CrossRef]
- Yhdego, H.; Li, J.; Paolini, C.; Audette, M. Wearable sensor gait analysis of fall detection using attention network. In Proceedings of the 2021 IEEE International Conference on Bioinformatics and Biomedicine (BIBM), Houston, TX, USA, 9–12 December 2021; pp. 3137–3141. [Google Scholar]
- Zhao, F.; Cao, Z.; Xiao, Y.; Mao, J.; Yuan, J. Real-time detection of fall from bed using a single depth camera. IEEE Trans. Autom. Sci. Eng. 2018, 16, 1018–1032. [Google Scholar] [CrossRef]
- Fernandes, C.; Fonseca, L.; Ferreira, F.; Gago, M.; Costa, L.; Sousa, N.; Ferreira, C.; Gama, J.; Erlhagen, W.; Bicho, E. Artificial neural networks classification of patients with parkinsonism based on gait. In Proceedings of the 2018 IEEE International Conference on Bioinformatics and Biomedicine (BIBM), Madrid, Spain, 3–6 December 2018; pp. 2024–2030. [Google Scholar]
- Gholami, M.; Ward, R.; Mahal, R.; Mirian, M.; Yen, K.; Park, K.W.; McKeown, M.J.; Wang, Z.J. Automatic labeling of parkinson’s disease gait videos with weak supervision. Med. Image Anal. 2023, 89, 102871. [Google Scholar] [CrossRef]
- Guo, R.; Sun, J.; Zhang, C.; Qian, X. A self-supervised metric learning framework for the arising-from-chair assessment of parkinsonians with graph convolutional networks. IEEE Trans. Circuits Syst. Video Technol. 2022, 32, 6461–6471. [Google Scholar] [CrossRef]
- Pais, B.; Buluschek, P.; DuPasquier, G.; Nef, T.; Schütz, N.; Saner, H.; Gatica-Perez, D.; Santschi, V. Evaluation of 1-year in-home monitoring technology by home-dwelling older adults, family caregivers, and nurses. Front. Public Health 2020, 8, 518957. [Google Scholar] [CrossRef]
- Xue, D.; Sayana, A.; Darke, E.; Shen, K.; Hsieh, J.; Luo, Z.; Li, L.; Downing, N.L.; Milstein, A.; Li, F.F. Vision-based gait analysis for senior care. arXiv 2018, arXiv:1812.00169. [Google Scholar]
- Jeon, S.; Lee, K.M.; Koo, S. Anomalous gait feature classification from 3-d motion capture data. IEEE J. Biomed. Health Inform. 2021, 26, 696–703. [Google Scholar] [CrossRef] [PubMed]
- Tao, X.; Yun, Z. Fall prediction based on biomechanics equilibrium using kinect. Int. J. Distrib. Sens. Netw. 2017, 13, 1550147717703257. [Google Scholar] [CrossRef]
- Nguyen, T.-N.; Huynh, H.H.; Meunier, J. 3D reconstruction with time-of-flight depth camera and multiple mirrors. IEEE Access 2018, 6, 38106–38114. [Google Scholar] [CrossRef]
- Yin, Z.; Jiang, Y.; Zheng, J.; Yu, H. Stja-gcn: A multi-branch spatial–temporal joint attention graph convolutional network for abnormal gait recognition. Appl. Sci. 2023, 13, 4205. [Google Scholar] [CrossRef]
- Braspenning, A.M.; Cranen, K.; Snaphaan, L.J.A.E.; Wouters, E.J.M. A multiple stakeholder perspective on the drivers and barriers for the implementation of lifestyle monitoring using infrared sensors to record movements for vulnerable older adults living alone at home: A qualitative study. Int. J. Environ. Res. Public Health 2022, 19, 570. [Google Scholar] [CrossRef]
- Hunter, I.; Elers, P.; Lockhart, C.; Guesgen, H.; Singh, A.; Whiddett, D. Issues associated with the management and governance of sensor data and information to assist aging in place: Focus group study with health care professionals. JMIR mHealth uHealth 2020, 8, e24157. [Google Scholar] [CrossRef] [PubMed]
- Itoh, S.; Tan, H.; Kudo, K.; Ogata, Y. Comparison of the mental burden on nursing care providers with and without mat-type sleep state sensors at a nursing home in tokyo, japan: Quasi-experimental study. JMIR Aging 2022, 5, e19641. [Google Scholar] [CrossRef]
- Yu, B.; Yin, H.; Zhu, Z. Spatio-temporal graph convolutional networks: A deep learning framework for traffic forecasting. arXiv 2017, arXiv:1709.04875. [Google Scholar]
- Guo, R.; Shao, X.; Zhang, C.; Qian, X. Multi-scale sparse graph convolutional network for the assessment of parkinsonian gait. IEEE Trans. Multimed. 2021, 24, 1583–1594. [Google Scholar] [CrossRef]
- Filtjens, B.; Ginis, P.; Nieuwboer, A.; Slaets, P.; Vanrumste, B. Automated freezing of gait assessment with marker-based motion capture and multi-stage spatial-temporal graph convolutional neural networks. J. Neuroeng. Rehabil. 2022, 19, 48. [Google Scholar] [CrossRef]
- Sabo, A.; Mehdizadeh, S.; Iaboni, A.; Taati, B. Estimating parkinsonism severity in natural gait videos of older adults with dementia. IEEE J. Biomed. Health Inform. 2022, 26, 2288–2298. [Google Scholar] [CrossRef]
- Ortells, J.; Herrero-Ezquerro, M.T.; Mollineda, R.A. Vision-based gait impairment analysis for aided diagnosis. Med. Biol. Eng. Comput. 2018, 56, 1553–1564. [Google Scholar] [CrossRef] [PubMed]
- Jun, K.; Lee, Y.; Lee, S.; Lee, D.; Kim, M.S. Pathological gait classification using kinect v2 and gated recurrent neural networks. IEEE Access 2020, 8, 139881–139891. [Google Scholar] [CrossRef]
- Wang, L.; Chen, J.; Chen, Z.; Liu, Y.; Yang, H. Multi-stream part-fused graph convolutional networks for skeleton-based gait recognition. Connect. Sci. 2022, 34, 652–669. [Google Scholar] [CrossRef]
- Yu, S.; Tan, D.; Tan, T. A framework for evaluating the effect of view angle, clothing and carrying condition on gait recognition. In Proceedings of the 18th International Conference on Pattern Recognition (ICPR’06), Hong Kong, 20–24 August 2006; Volume 4, pp. 441–444. [Google Scholar]
- Lochhead, C.; Fisher, R.B. Lightweight human gait anomaly assessment using single-stream uniform temporal attention. Comput. Biol. Med. 2025, 190, 110076. [Google Scholar] [CrossRef]
- Lundberg, S.M.; Lee, S. A unified approach to interpreting model predictions. Adv. Neural Inf. Process. Syst. 2017, 30. [Google Scholar]
- Ribeiro, M.T.; Singh, S.; Guestrin, C. “why should i trust you?” explaining the predictions of any classifier. In Proceedings of the 22nd ACM SIGKDD International Conference on Knowledge Discovery and Data Mining, San Francisco, CA, USA, 13–17 August 2016; pp. 1135–1144. [Google Scholar]
- Moshkovitz, M.; Dasgupta, S.; Rashtchian, C.; Frost, N. Explainable k-means and k-medians clustering. In Proceedings of the International Conference on Machine Learning, PMLR 2020, Virtual, 12–18 July 2020; pp. 7055–7065. [Google Scholar]
- Laber, E.; Murtinho, L.; Oliveira, F. Shallow decision trees for explainable k-means clustering. Pattern Recognit. 2023, 137, 109239. [Google Scholar] [CrossRef]
- Young-Shand, K.L.; Roy, P.C.; Dunbar, M.J.; Abidi, S.S.R.; Wilson, J.L.A. Gait biomechanics phenotypes among total knee arthroplasty candidates by machine learning cluster analysis. J. Orthop. Res. 2023, 41, 335–344. [Google Scholar] [CrossRef]
- Zhang, Z.; Tran, L.; Yin, X.; Atoum, Y.; Liu, X.; Wan, J.; Wang, N. Gait recognition via disentangled representation learning. In Proceedings of the IEEE/CVF Conference on Computer Vision and Pattern Recognition, Long Beach, CA, USA, 15–20 June 2019; pp. 4710–4719. [Google Scholar]
- Wang, G.; Yuan, Y.; Chen, X.; Li, J.; Zhou, X. Learning discriminative features with multiple granularities for person re-identification. In Proceedings of the 26th ACM international conference on Multimedia, Seoul, Republic of Korea, 22–26 October 2018; pp. 274–282. [Google Scholar]
- Duvenaud, D.K.; Maclaurin, D.; Iparraguirre, J.; Bombarell, R.; Hirzel, T.; Aspuru-Guzik, A.; Adams, R.P. Convolutional networks on graphs for learning molecular fingerprints. Adv. Neural Inf. Process. Syst. 2015, 28. Available online: https://www.cs.princeton.edu/~rpa/pubs/duvenaud2015fingerprints.pdf (accessed on 14 April 2025).
- Lu, Z.; Du, P.; Nie, J. Vgcn-bert: Augmenting bert with graph embedding for text classification. In Proceedings of the Advances in Information Retrieval: 42nd European Conference on IR Research, ECIR 2020, Lisbon, Portugal, 14–17 April 2020; Proceedings, Part I 42. Springer: Berlin/Heidelberg, Germany; pp. 369–382. [Google Scholar]
- Hofmann, M.; Geiger, J.; Bachmann, S.; Schuller, B.; Rigoll, G. The tum gait from audio, image and depth (gaid) database: Multimodal recognition of subjects and traits. J. Vis. Commun. Image Represent. 2014, 25, 195–206. [Google Scholar] [CrossRef]
- Ismaili, O.A.; Lemaire, V.; Cornuéjols, A. A supervised methodology to measure the variables contribution to a clustering. In Proceedings of the Neural Information Processing: 21st International Conference, ICONIP 2014, Kuching, Malaysia, 3–6 November 2014; Proceedings, Part I 21. Springer: Berlin/Heidelberg, Germany; pp. 159–166. [Google Scholar]
- Liu, Y.; Li, Z.; Xiong, H.; Gao, X.; Wu, J. Understanding of internal clustering validation measures. In Proceedings of the 2010 IEEE International Conference on Data Mining, Sydney, NSW, Australia, 13–17 December 2010; pp. 911–916. [Google Scholar]

| Dataset | People | Sequences | Pathology Count | Pathology Types |
|---|---|---|---|---|
| Pathological Gait Dataset [25] | 10 | 7200 | 5 + 1 normal | A variety of acted gait pathologies including ataxic, lurching and stiff-legged gait. |
| Shoe [15] | 10 | 160 | 8 + 1 normal | 8 variations of modified shoe insoles and 4 variations of ankle weights from 1.5 to 3 kg on each leg. |
| WeightGait Dataset [28] | 15 | 5250 | 2 + 1 normal | Overlapping pathologies including gait freezing, limping, shuffling and obstacles. Pathologies achieved through a mix of acting and attachable ankle weights. |
| Dataset | Model | Accuracy (%) | F1 + STD |
|---|---|---|---|
| WeightGait (Ours) 3 classes | Logistic Regression | 52.77 | 0.53 ± 0.13 |
| K-means | 32.03 | 0.34 ± 0.07 | |
| ST-GCN | 78.99 | 0.81 ± 0.32 | |
| ST-JAGCN | 89.45 | 0.83 ± 0.39 | |
| ST-TAGCN | 94.38 | 0.93 ± 0.34 | |
| Embed + K-Means | 92.1 | 0.92 ± 0.6 | |
| Embed + PCA + K-means (Ours) | 98.9 | 0.98 ± 0.51 | |
| Pathological [25] 6 classes | Logistic Regression | 44.7 | 0.44 ± 0.1 |
| K-means | 18.7 | 0.07 ± 0.07 | |
| GRU [25] | 93.67 | N/A ± N/A | |
| ST-GCN | 92.55 | 0.89 ± 0.81 | |
| ST-JAGCN | 92.47 | 0.89 ± 0.52 | |
| ST-TAGCN | 92.31 | 0.91 ± 0.67 | |
| ST-TAGCN embed + K-means | 77.7 | 0.77 ± 0.66 | |
| Embed + PCA + K-means (Ours) | 98.4 | 0.98 ± 0.45 | |
| INIT [15] 9 classes | Logistic Regression | 13.1 | 0.11 ± 0.09 |
| K-means | 10.2 | 0.1 ± 0.11 | |
| ST-GCN | 75.23 | 0.72 ± 1.87 | |
| ST-JAGCN | 77.03 | 0.72 ± 1.34 | |
| ST-TAGCN | 77.8 | 0.74 ± 1.04 | |
| ST-TAGCN embed + PCA | 58.8 | 0.55 ± 0.77 | |
| Embed + PCA + K-means (Ours) | 93.8 | 0.93 ± 0.68 |
| Predictor | Abnormality | Head | Torso | Left Arm | Right Arm | Left Leg | Right Leg |
|---|---|---|---|---|---|---|---|
| ine ML Model | None | 4 | 3 | 5 | 6 | 2 | 1 |
| Health professional | None | 3 | 5 | 6 | 4 | 1 | 2 |
| ine | |||||||
| ine ML Model | Limping left leg | 4 | 3 | 6 | 5 | 1 | 2 |
| Health professional | Limping left leg | 3 | 6 | 5 | 4 | 1 | 2 |
| ine | |||||||
| ine ML Model | Shuffling gait | 1 | 6 | 4 | 5 | 2 | 3 |
| Health professional | Shuffling gait | 1 | 6 | 5 | 4 | 2 | 3 |
Disclaimer/Publisher’s Note: The statements, opinions and data contained in all publications are solely those of the individual author(s) and contributor(s) and not of MDPI and/or the editor(s). MDPI and/or the editor(s) disclaim responsibility for any injury to people or property resulting from any ideas, methods, instructions or products referred to in the content. |
© 2025 by the authors. Licensee MDPI, Basel, Switzerland. This article is an open access article distributed under the terms and conditions of the Creative Commons Attribution (CC BY) license (https://creativecommons.org/licenses/by/4.0/).
Share and Cite
Lochhead, C.; Fisher, R.B. Towards Explainable Graph Embeddings for Gait Assessment Using Per-Cluster Dimensional Weighting. Sensors 2025, 25, 4106. https://doi.org/10.3390/s25134106
Lochhead C, Fisher RB. Towards Explainable Graph Embeddings for Gait Assessment Using Per-Cluster Dimensional Weighting. Sensors. 2025; 25(13):4106. https://doi.org/10.3390/s25134106
Chicago/Turabian StyleLochhead, Chris, and Robert B. Fisher. 2025. "Towards Explainable Graph Embeddings for Gait Assessment Using Per-Cluster Dimensional Weighting" Sensors 25, no. 13: 4106. https://doi.org/10.3390/s25134106
APA StyleLochhead, C., & Fisher, R. B. (2025). Towards Explainable Graph Embeddings for Gait Assessment Using Per-Cluster Dimensional Weighting. Sensors, 25(13), 4106. https://doi.org/10.3390/s25134106