

A System for the Real-Time Detection of the U-Shaped Steel Bar Straightness on a Production Line

Abstract
1. Introduction
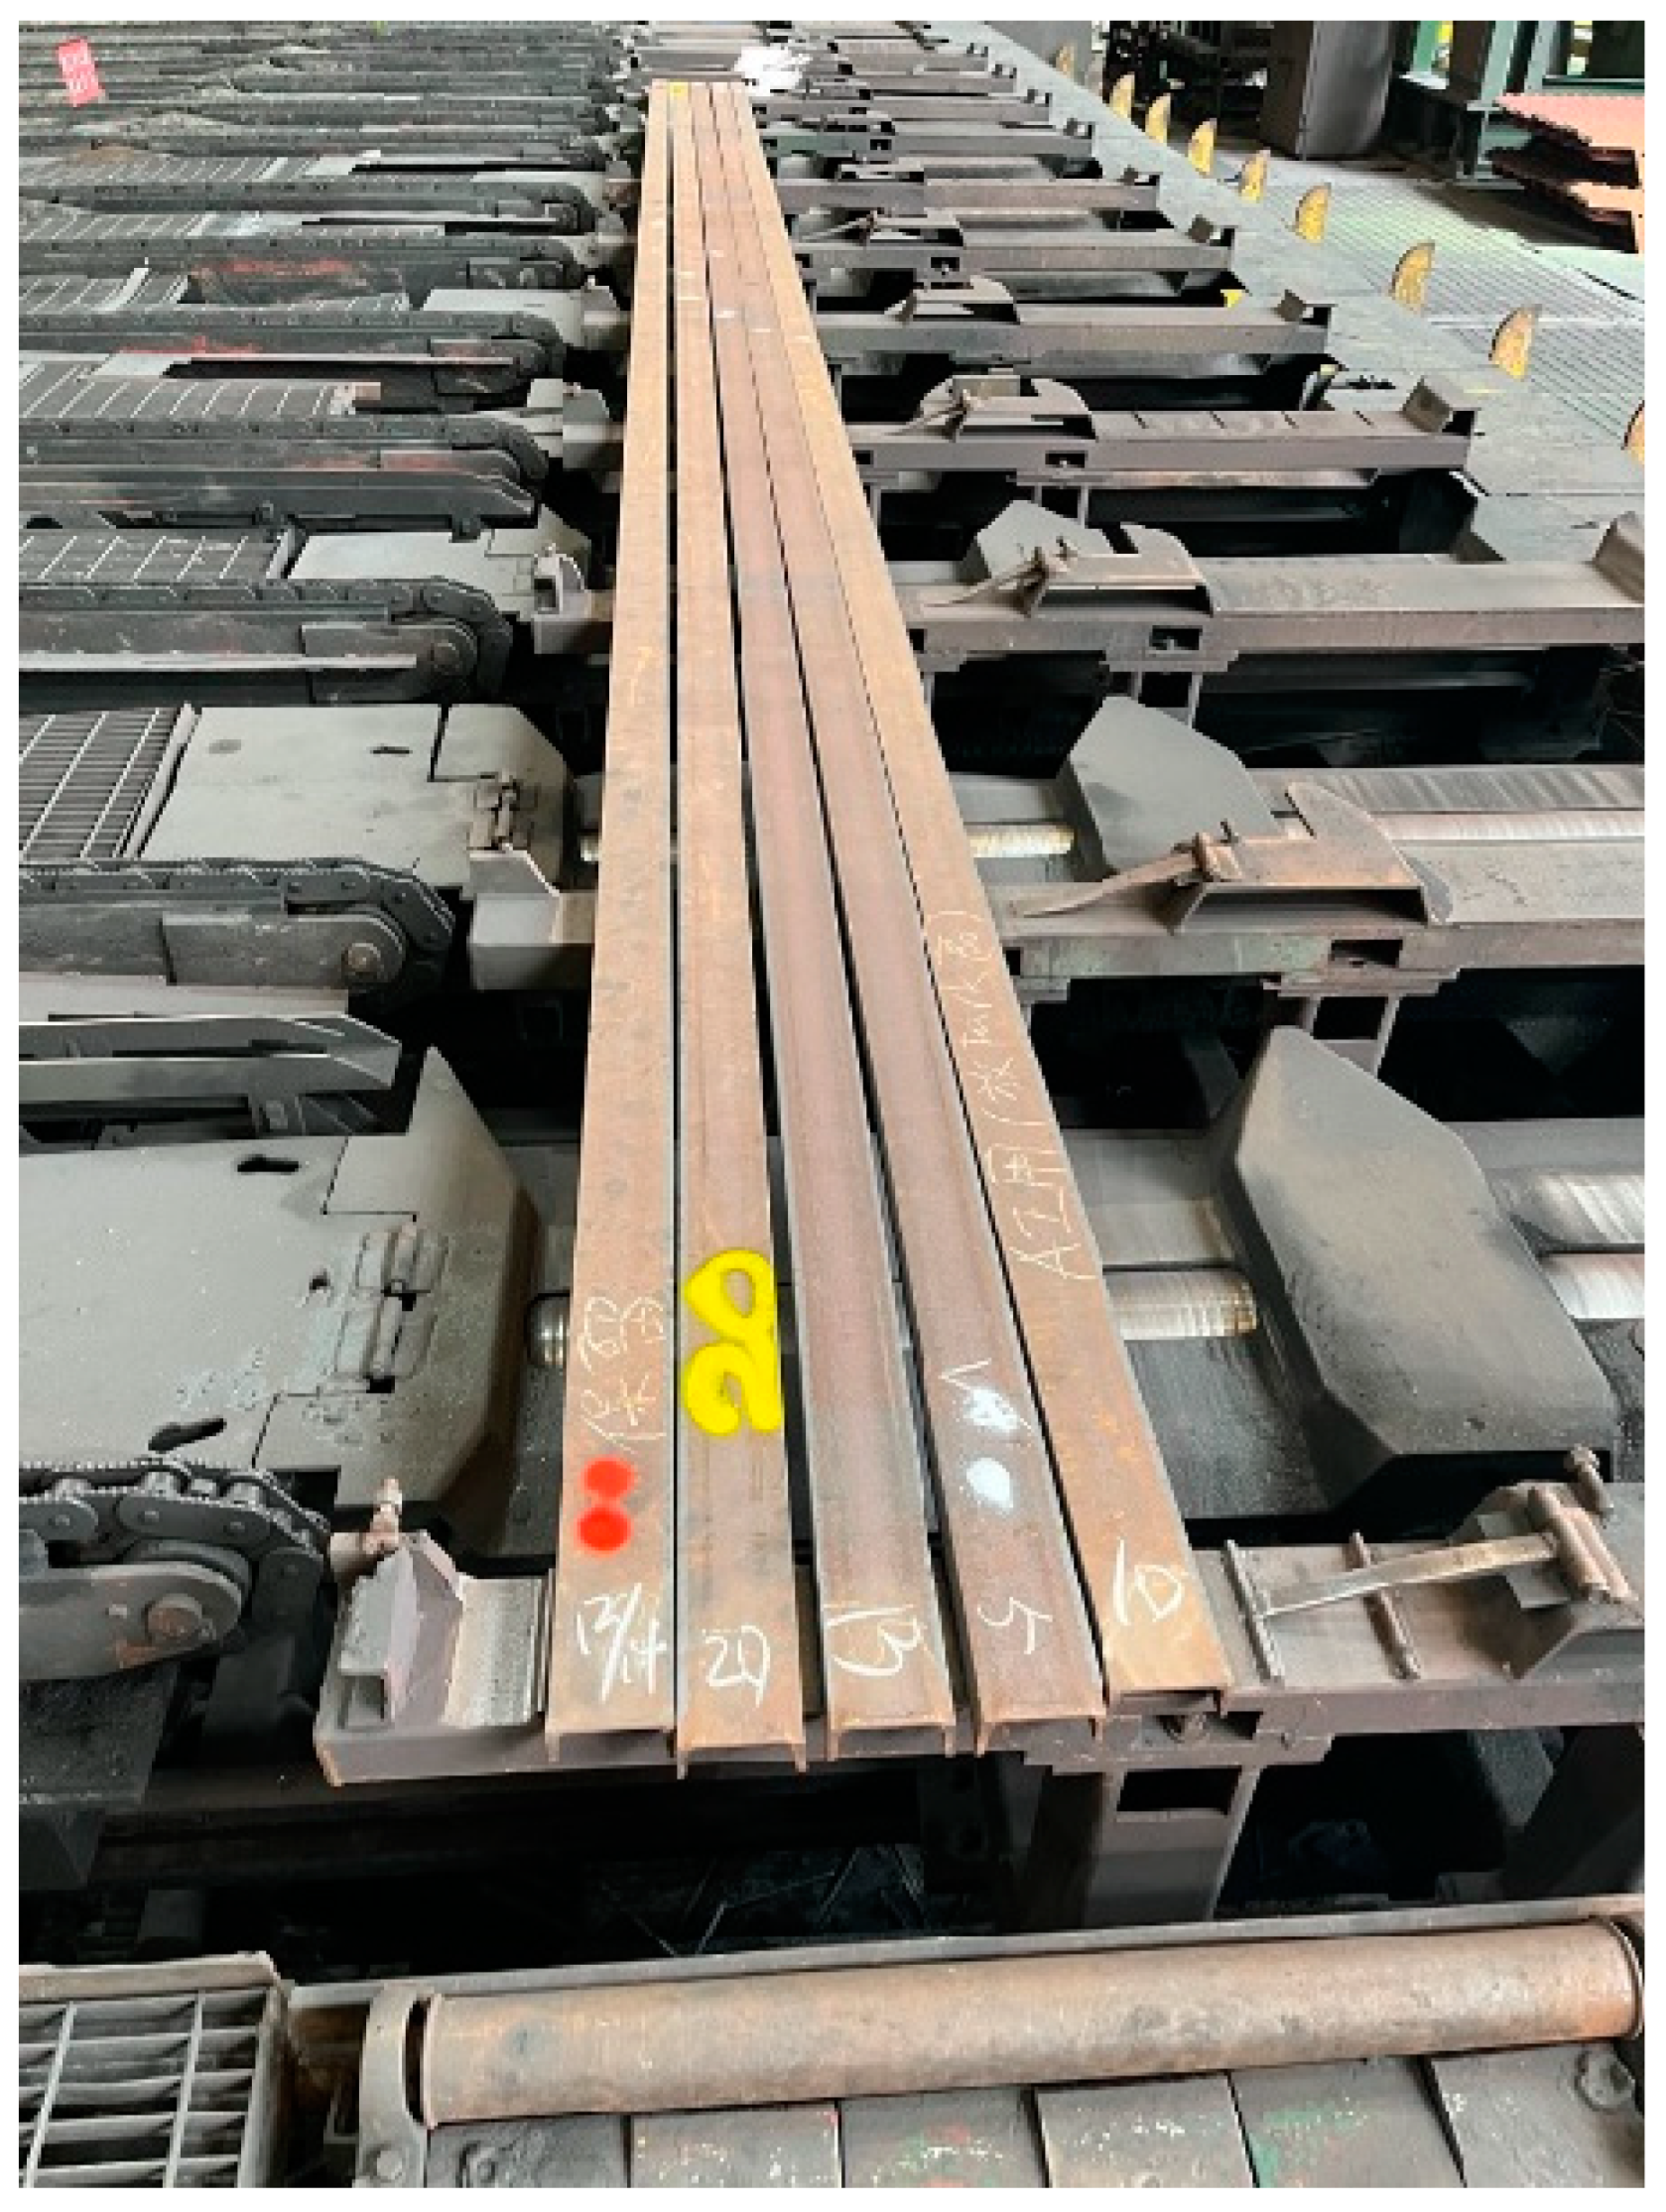
1.1. Research Topic
1.2. Technical Bottlenecks and Limitations
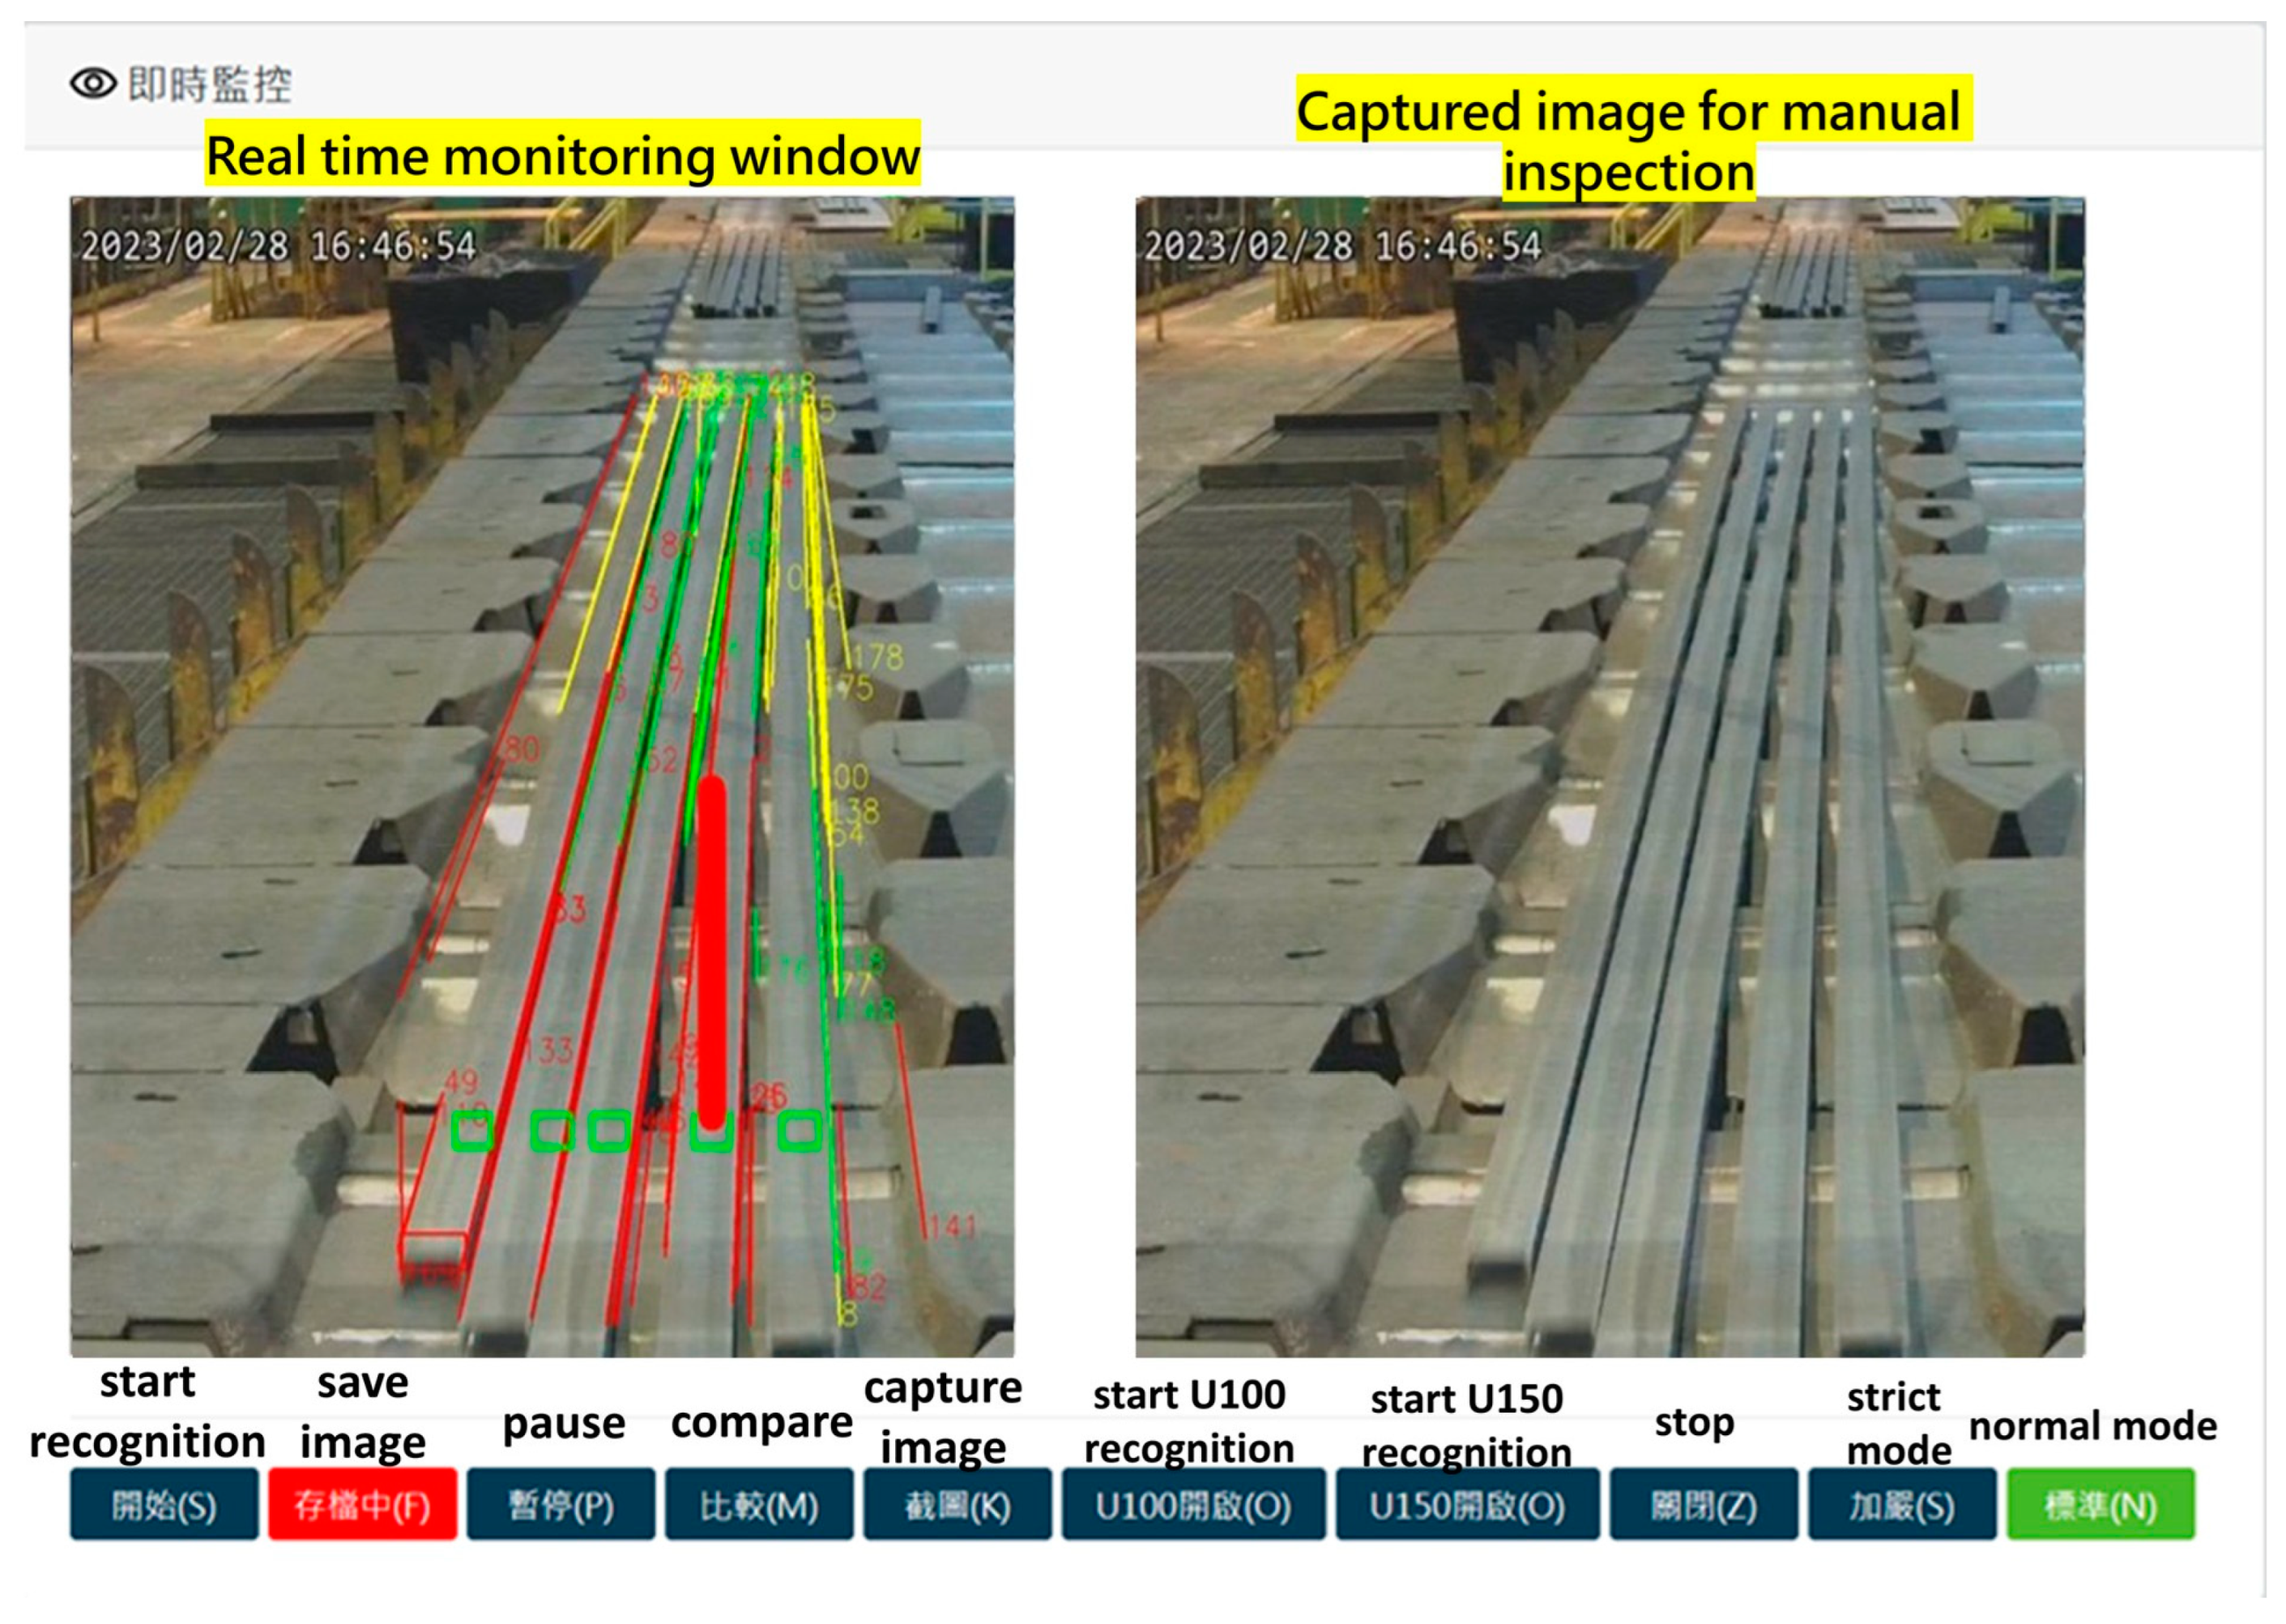
2. System Architecture and Algorithm
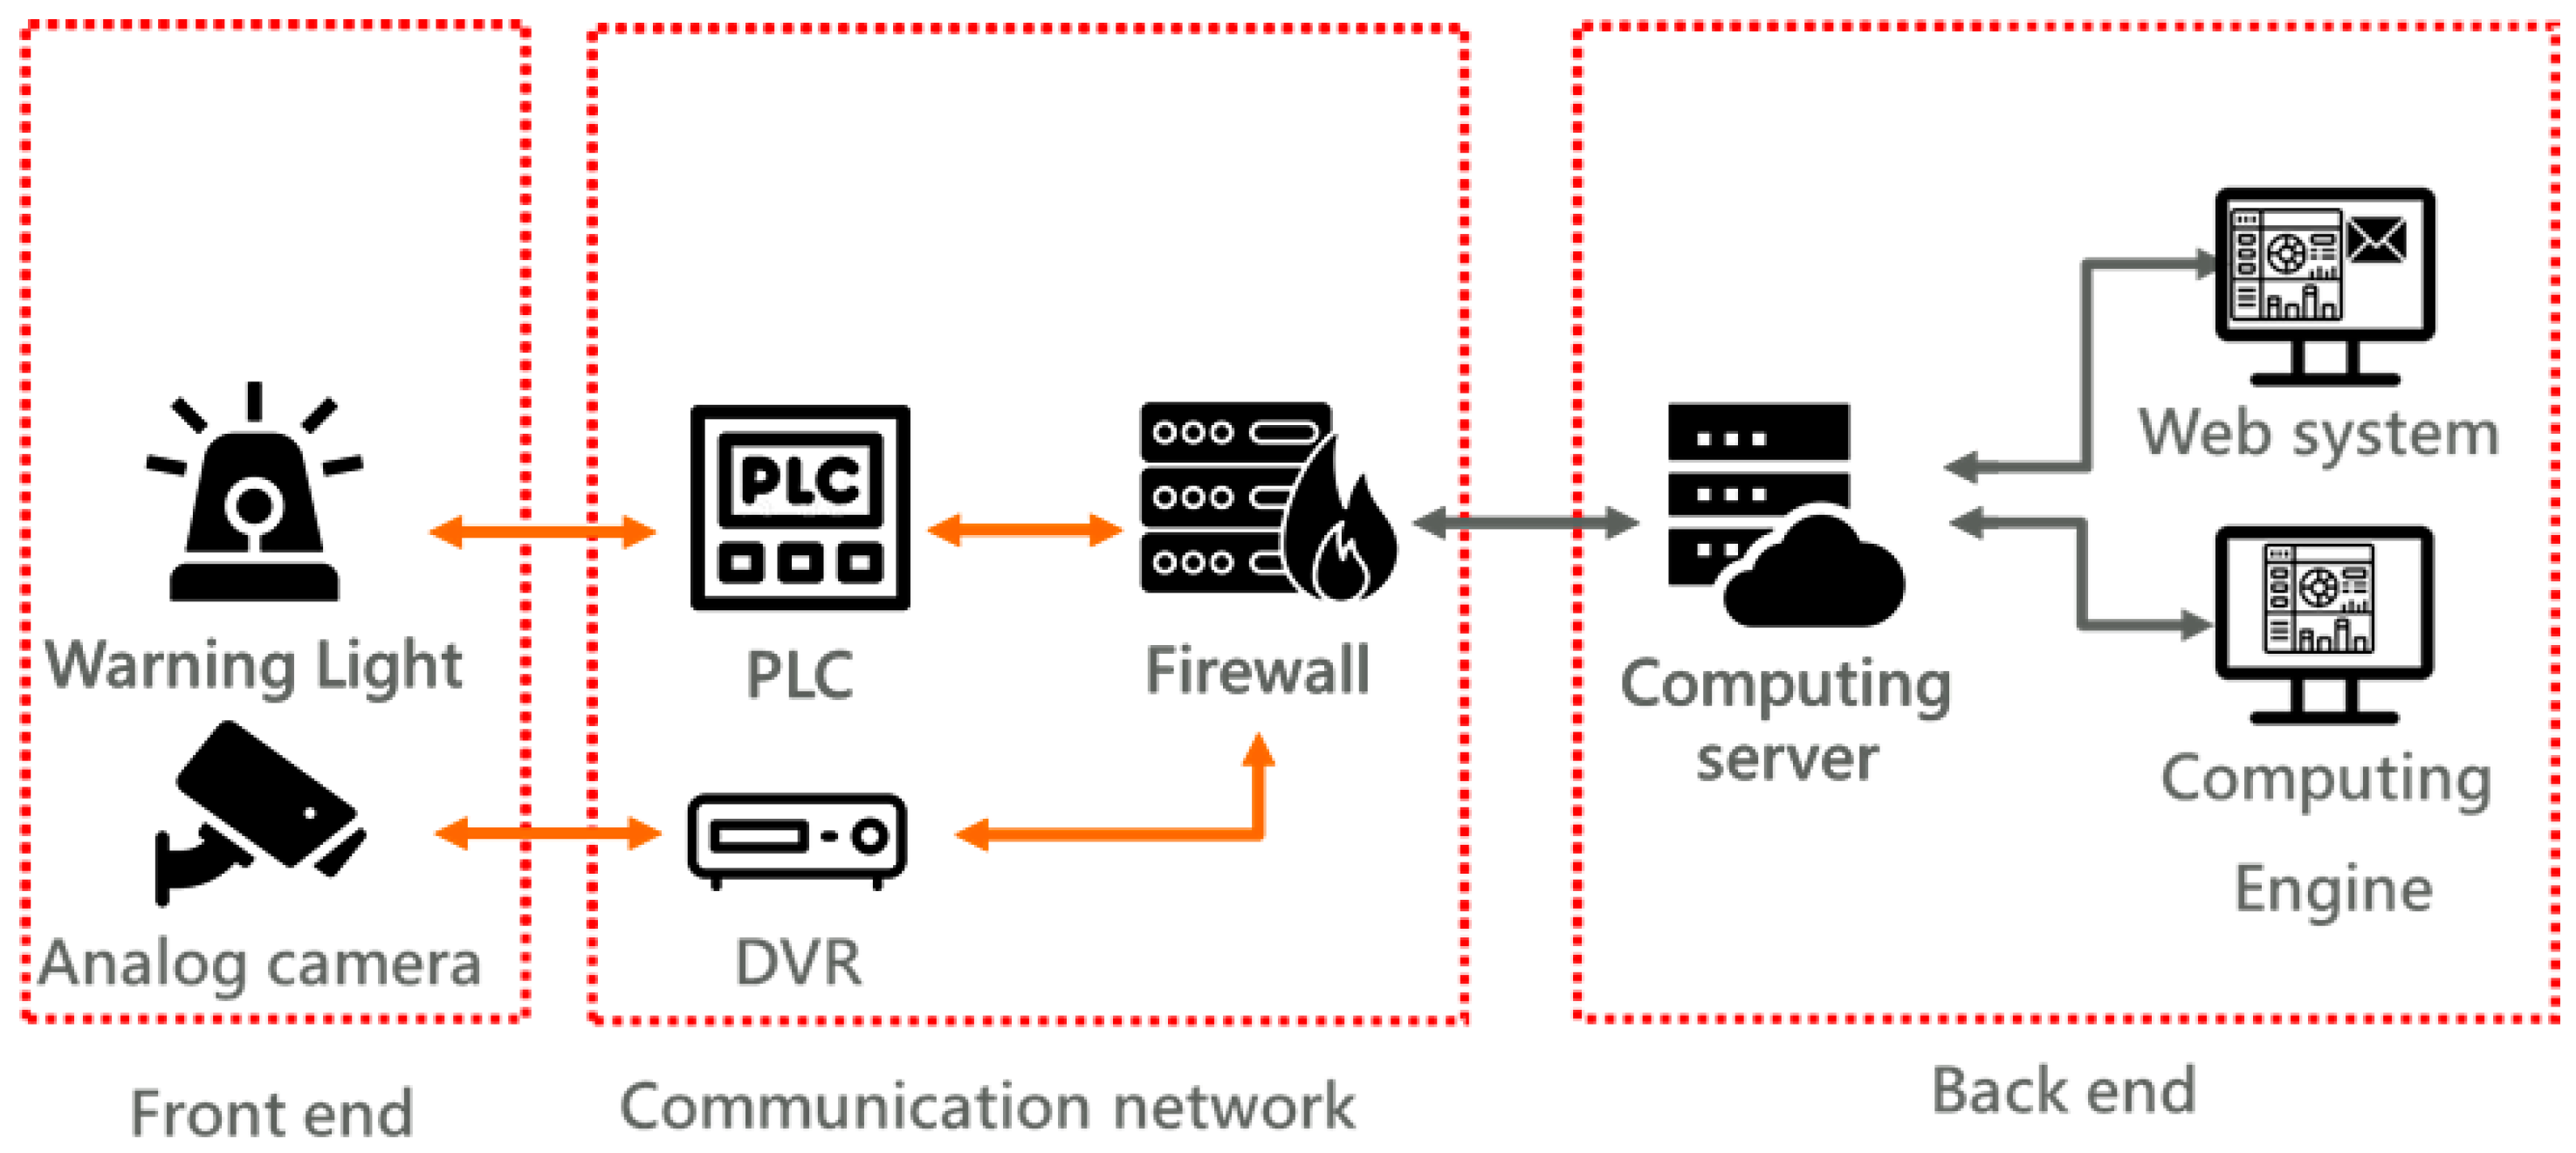
2.1. System Architecture
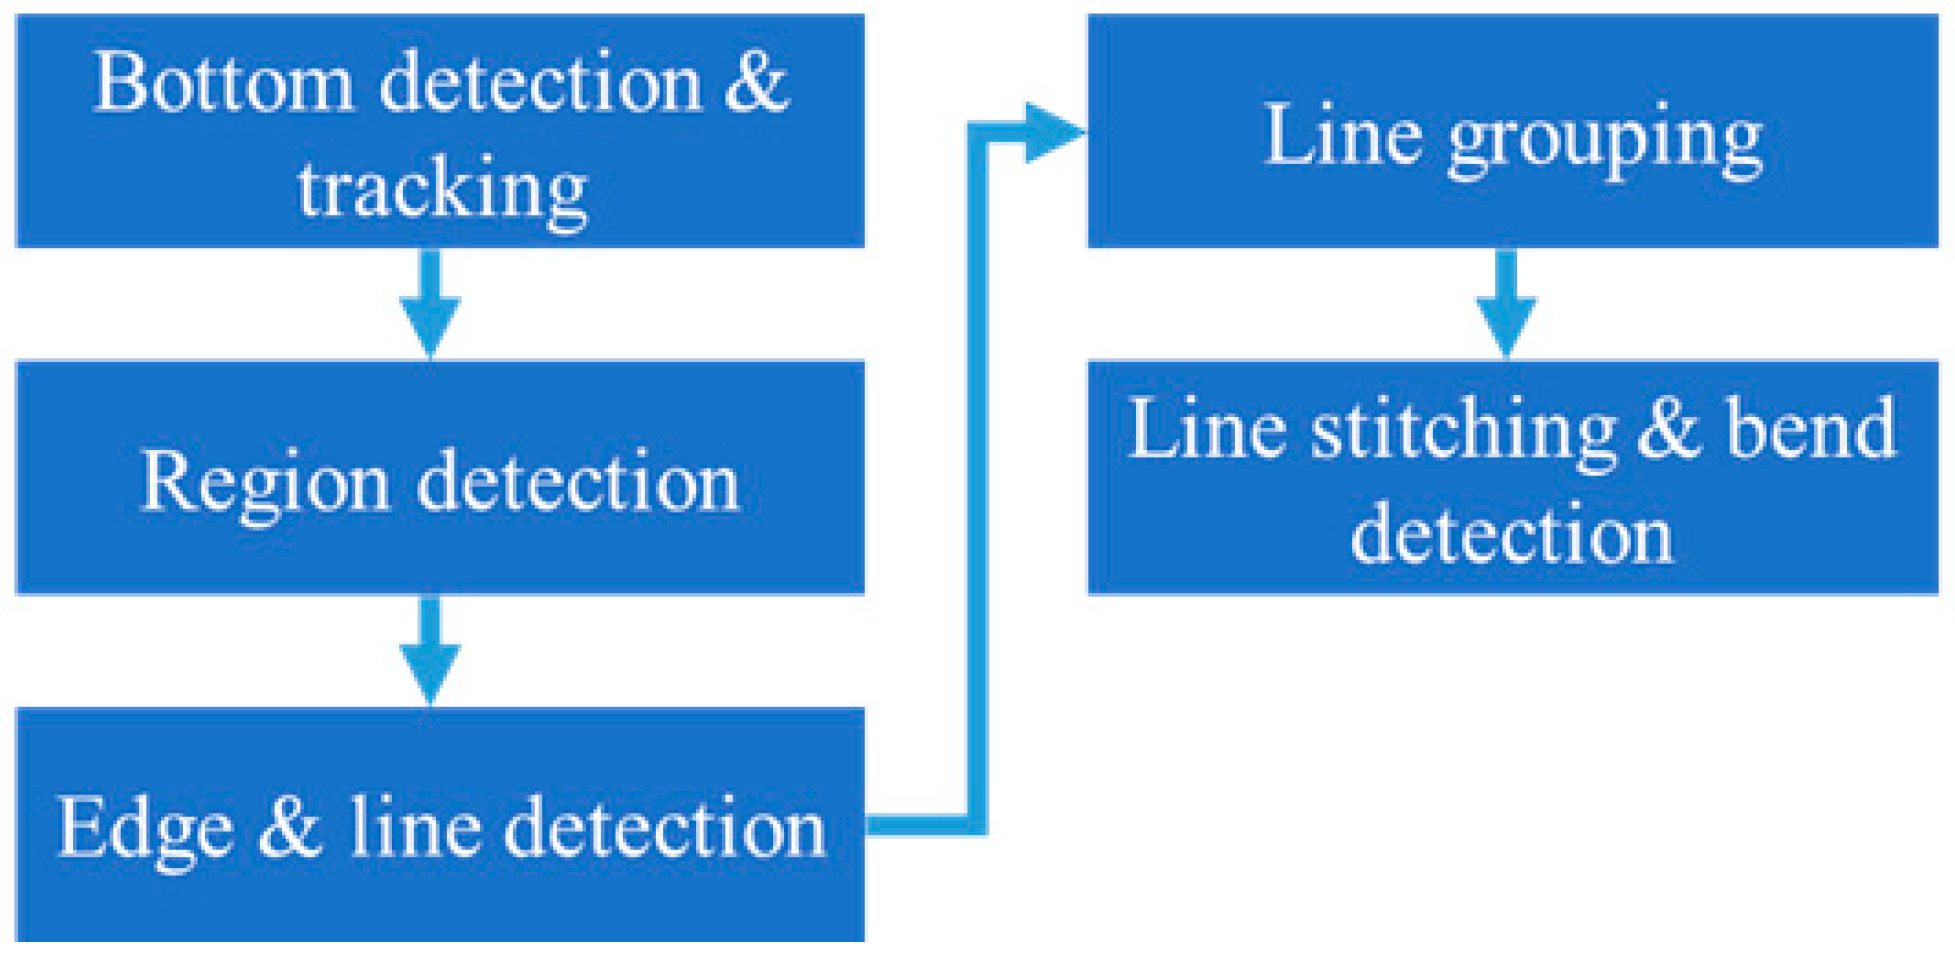
2.2. Algorithm
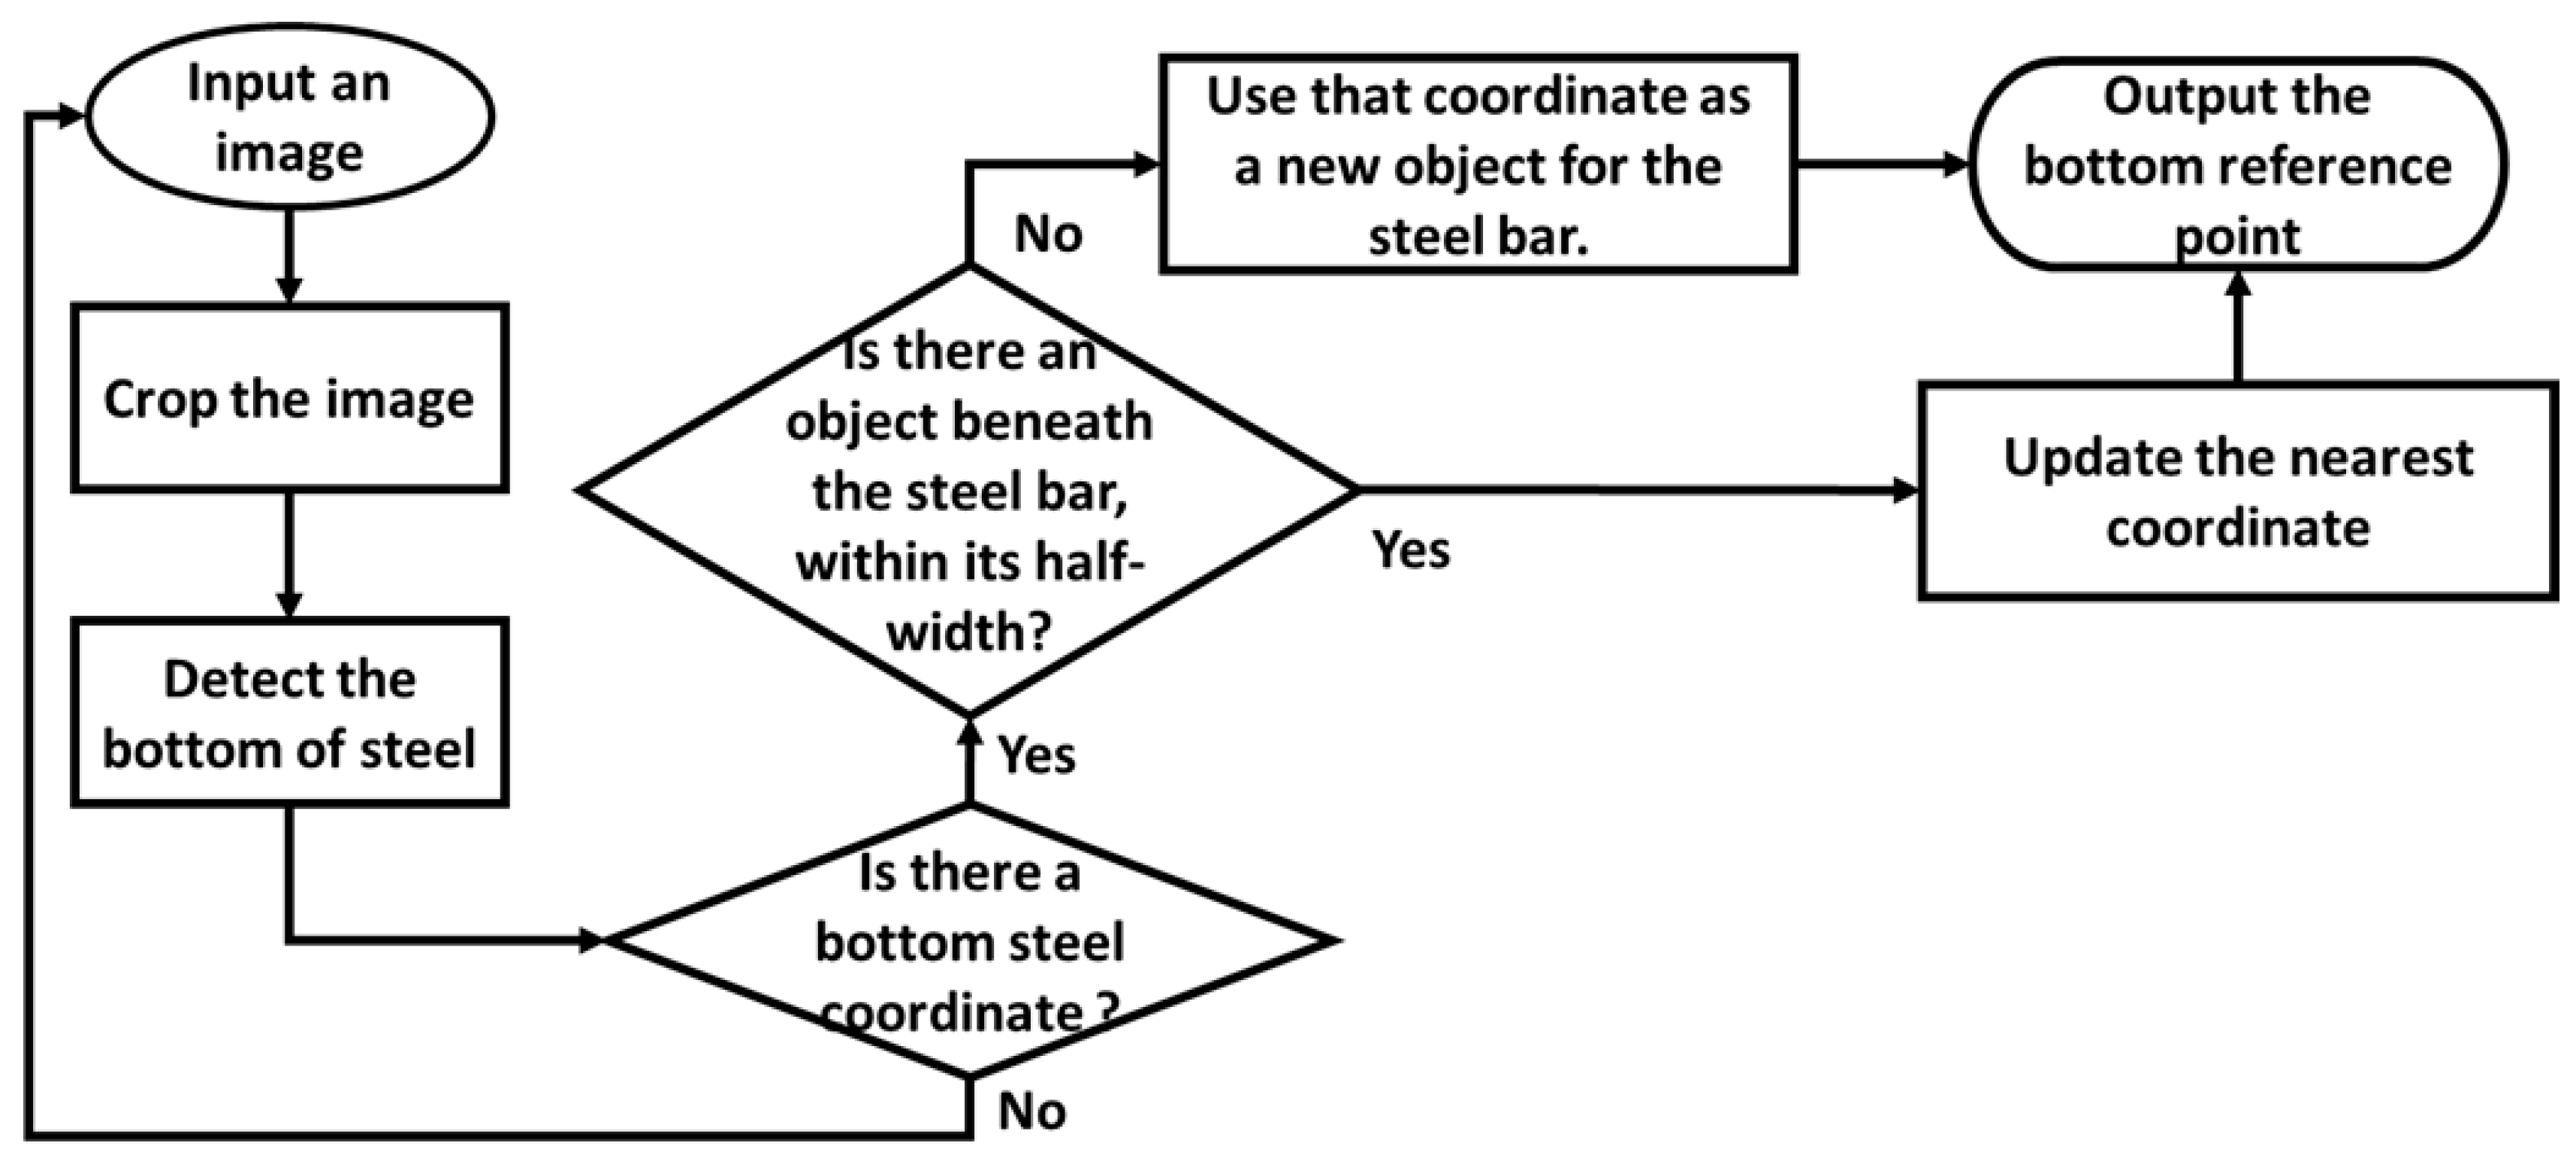
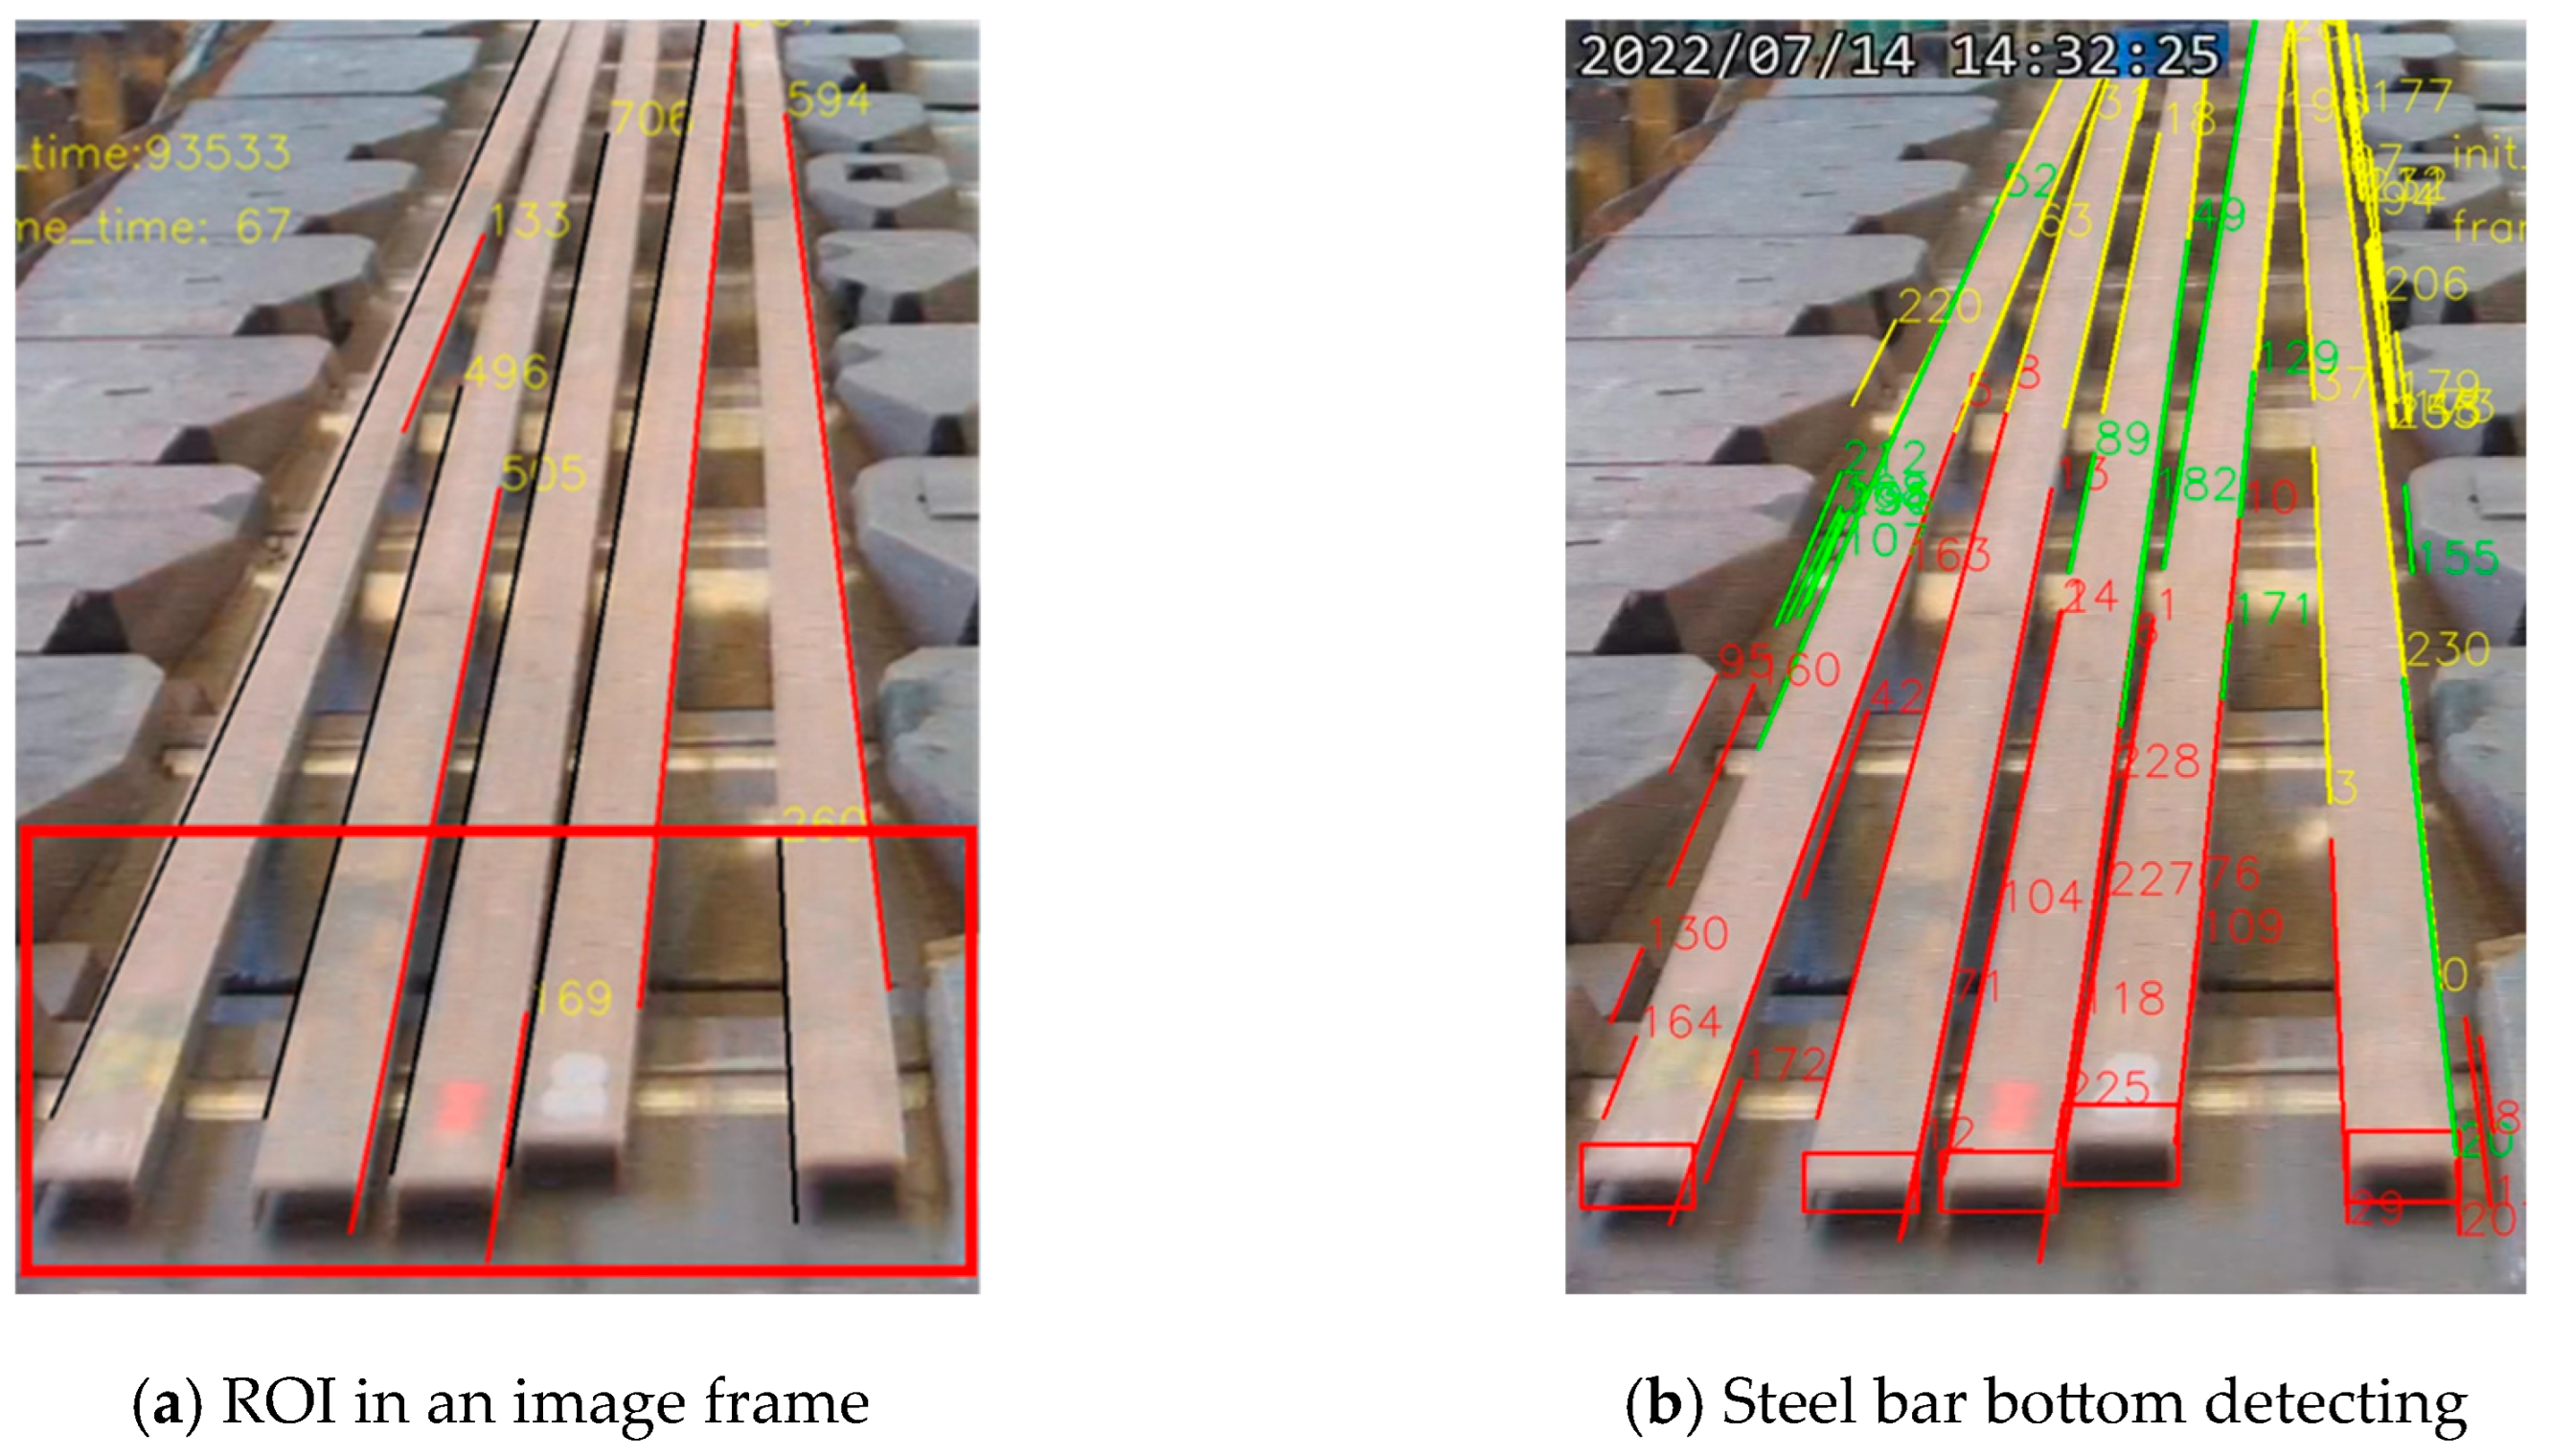
2.2.1. Bottom Detection and Tracking
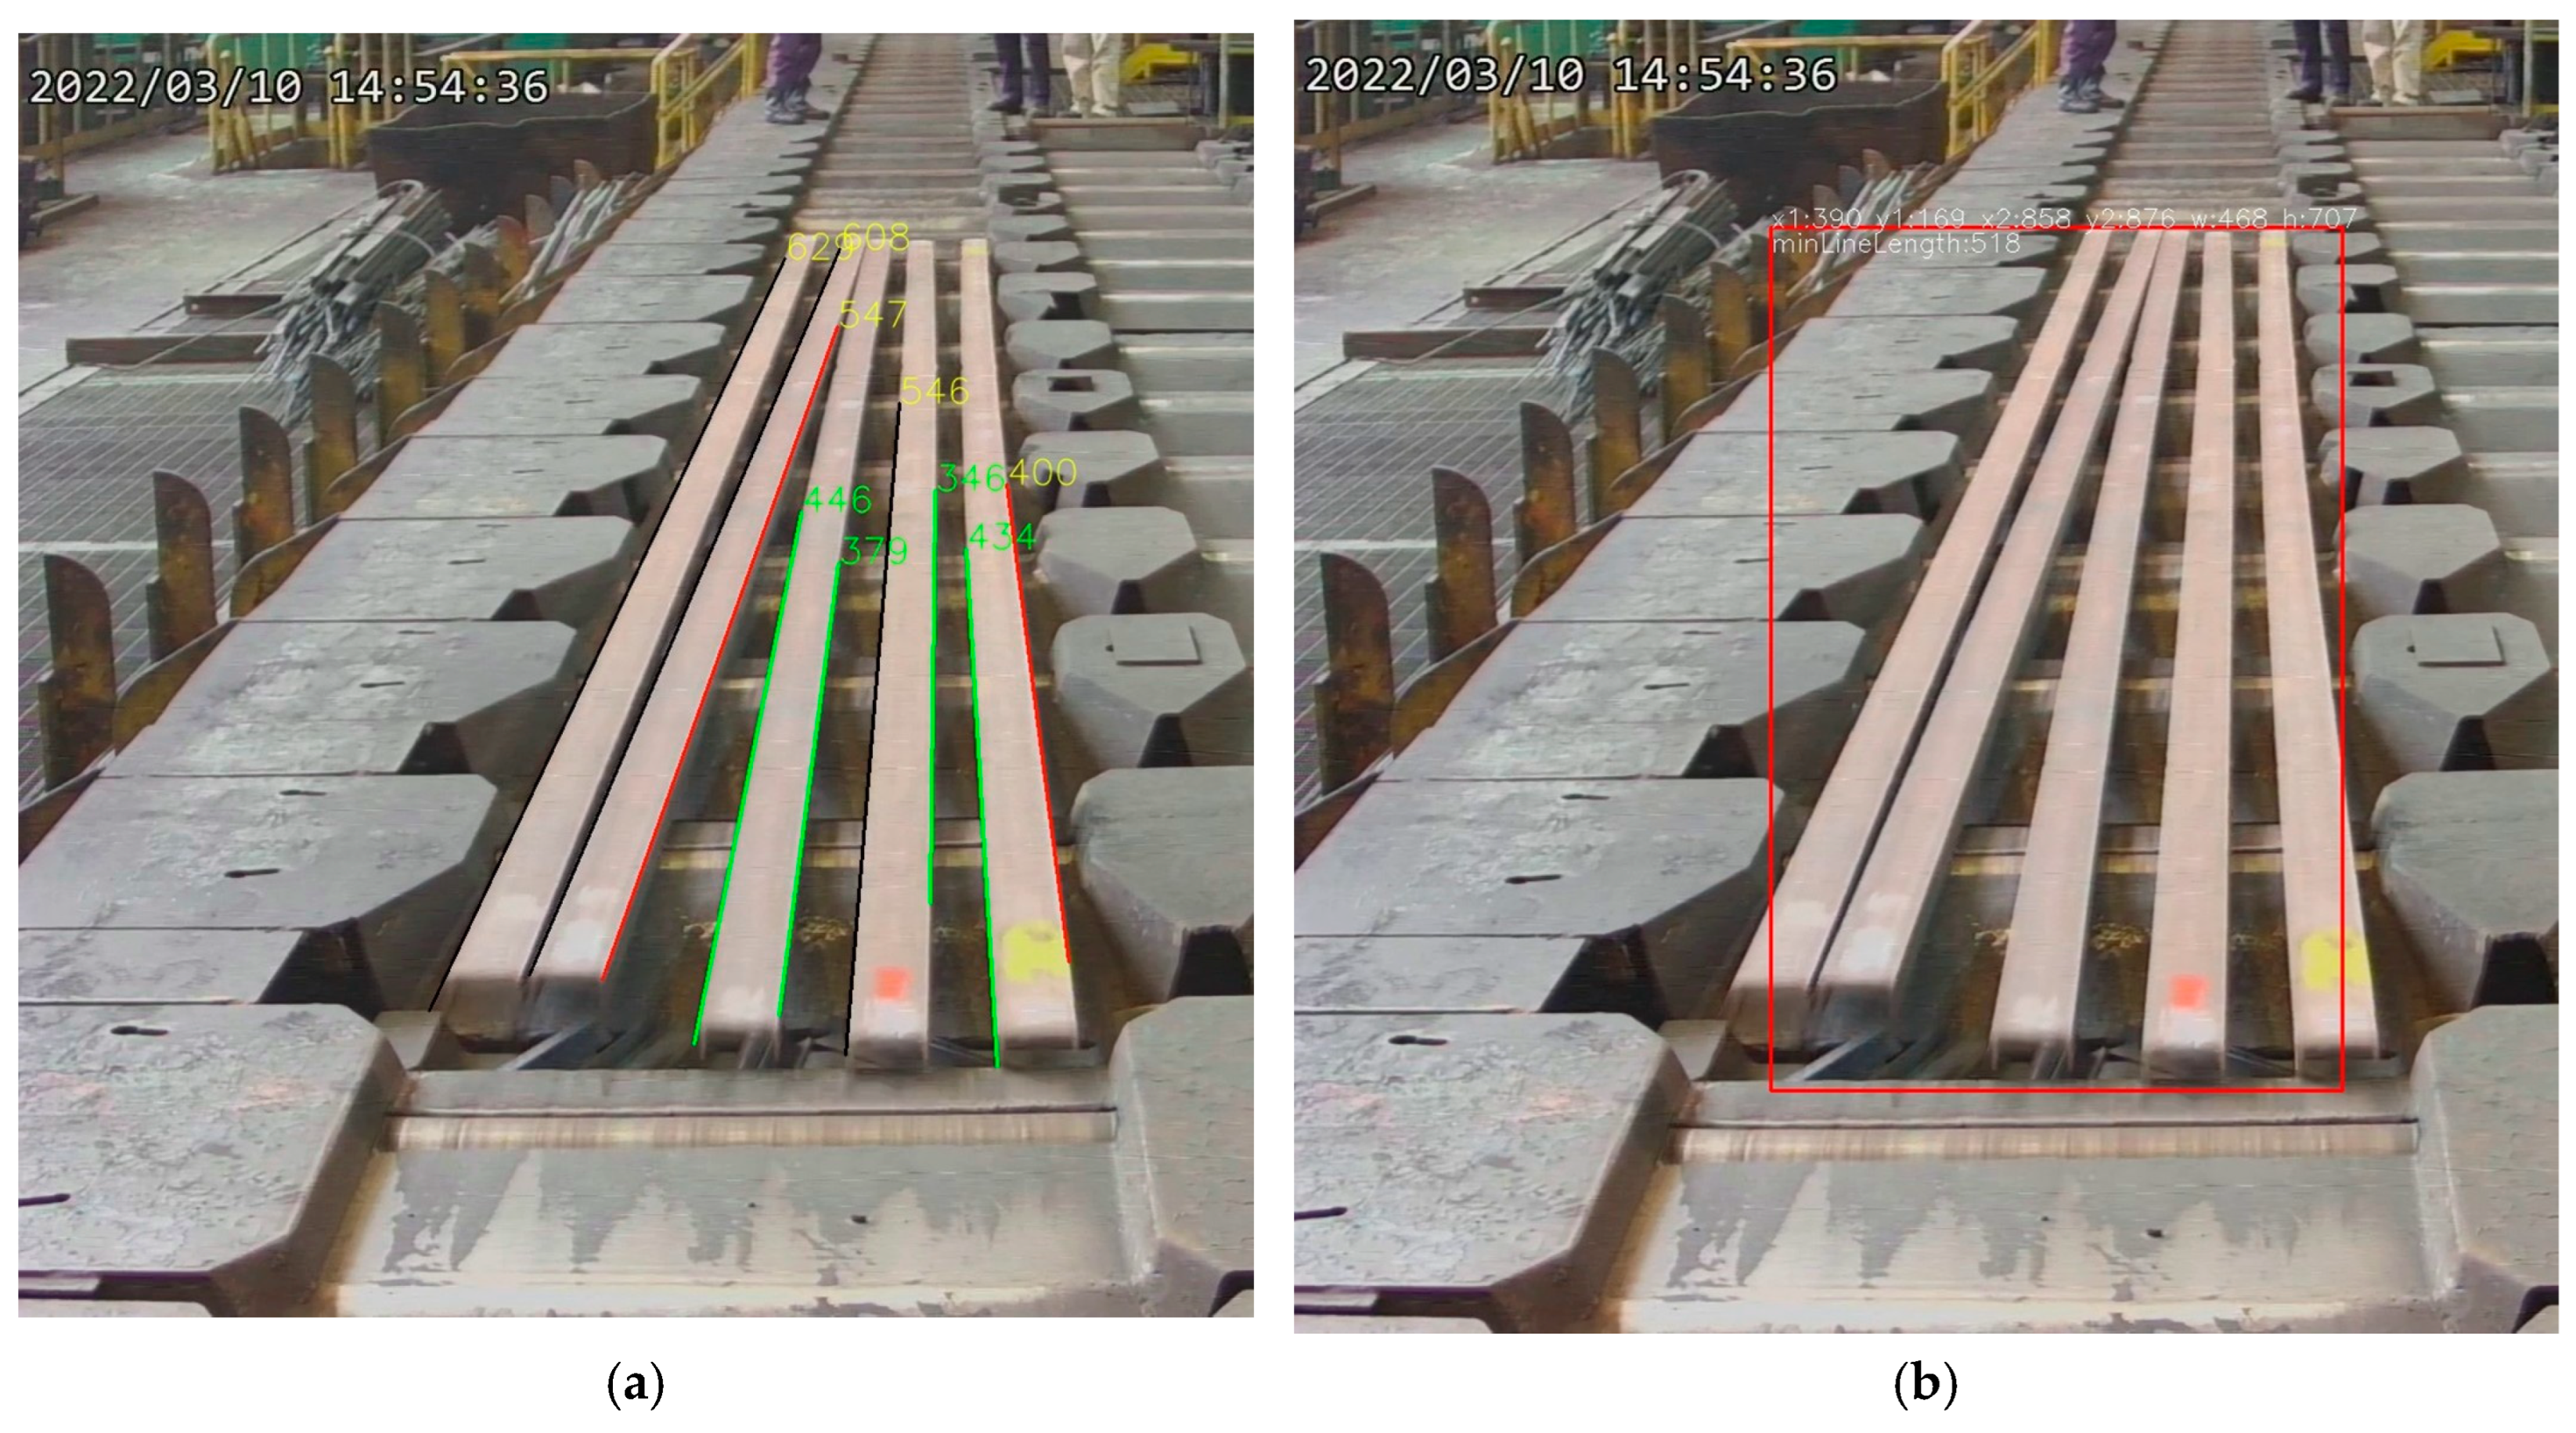
2.2.2. Region Detection
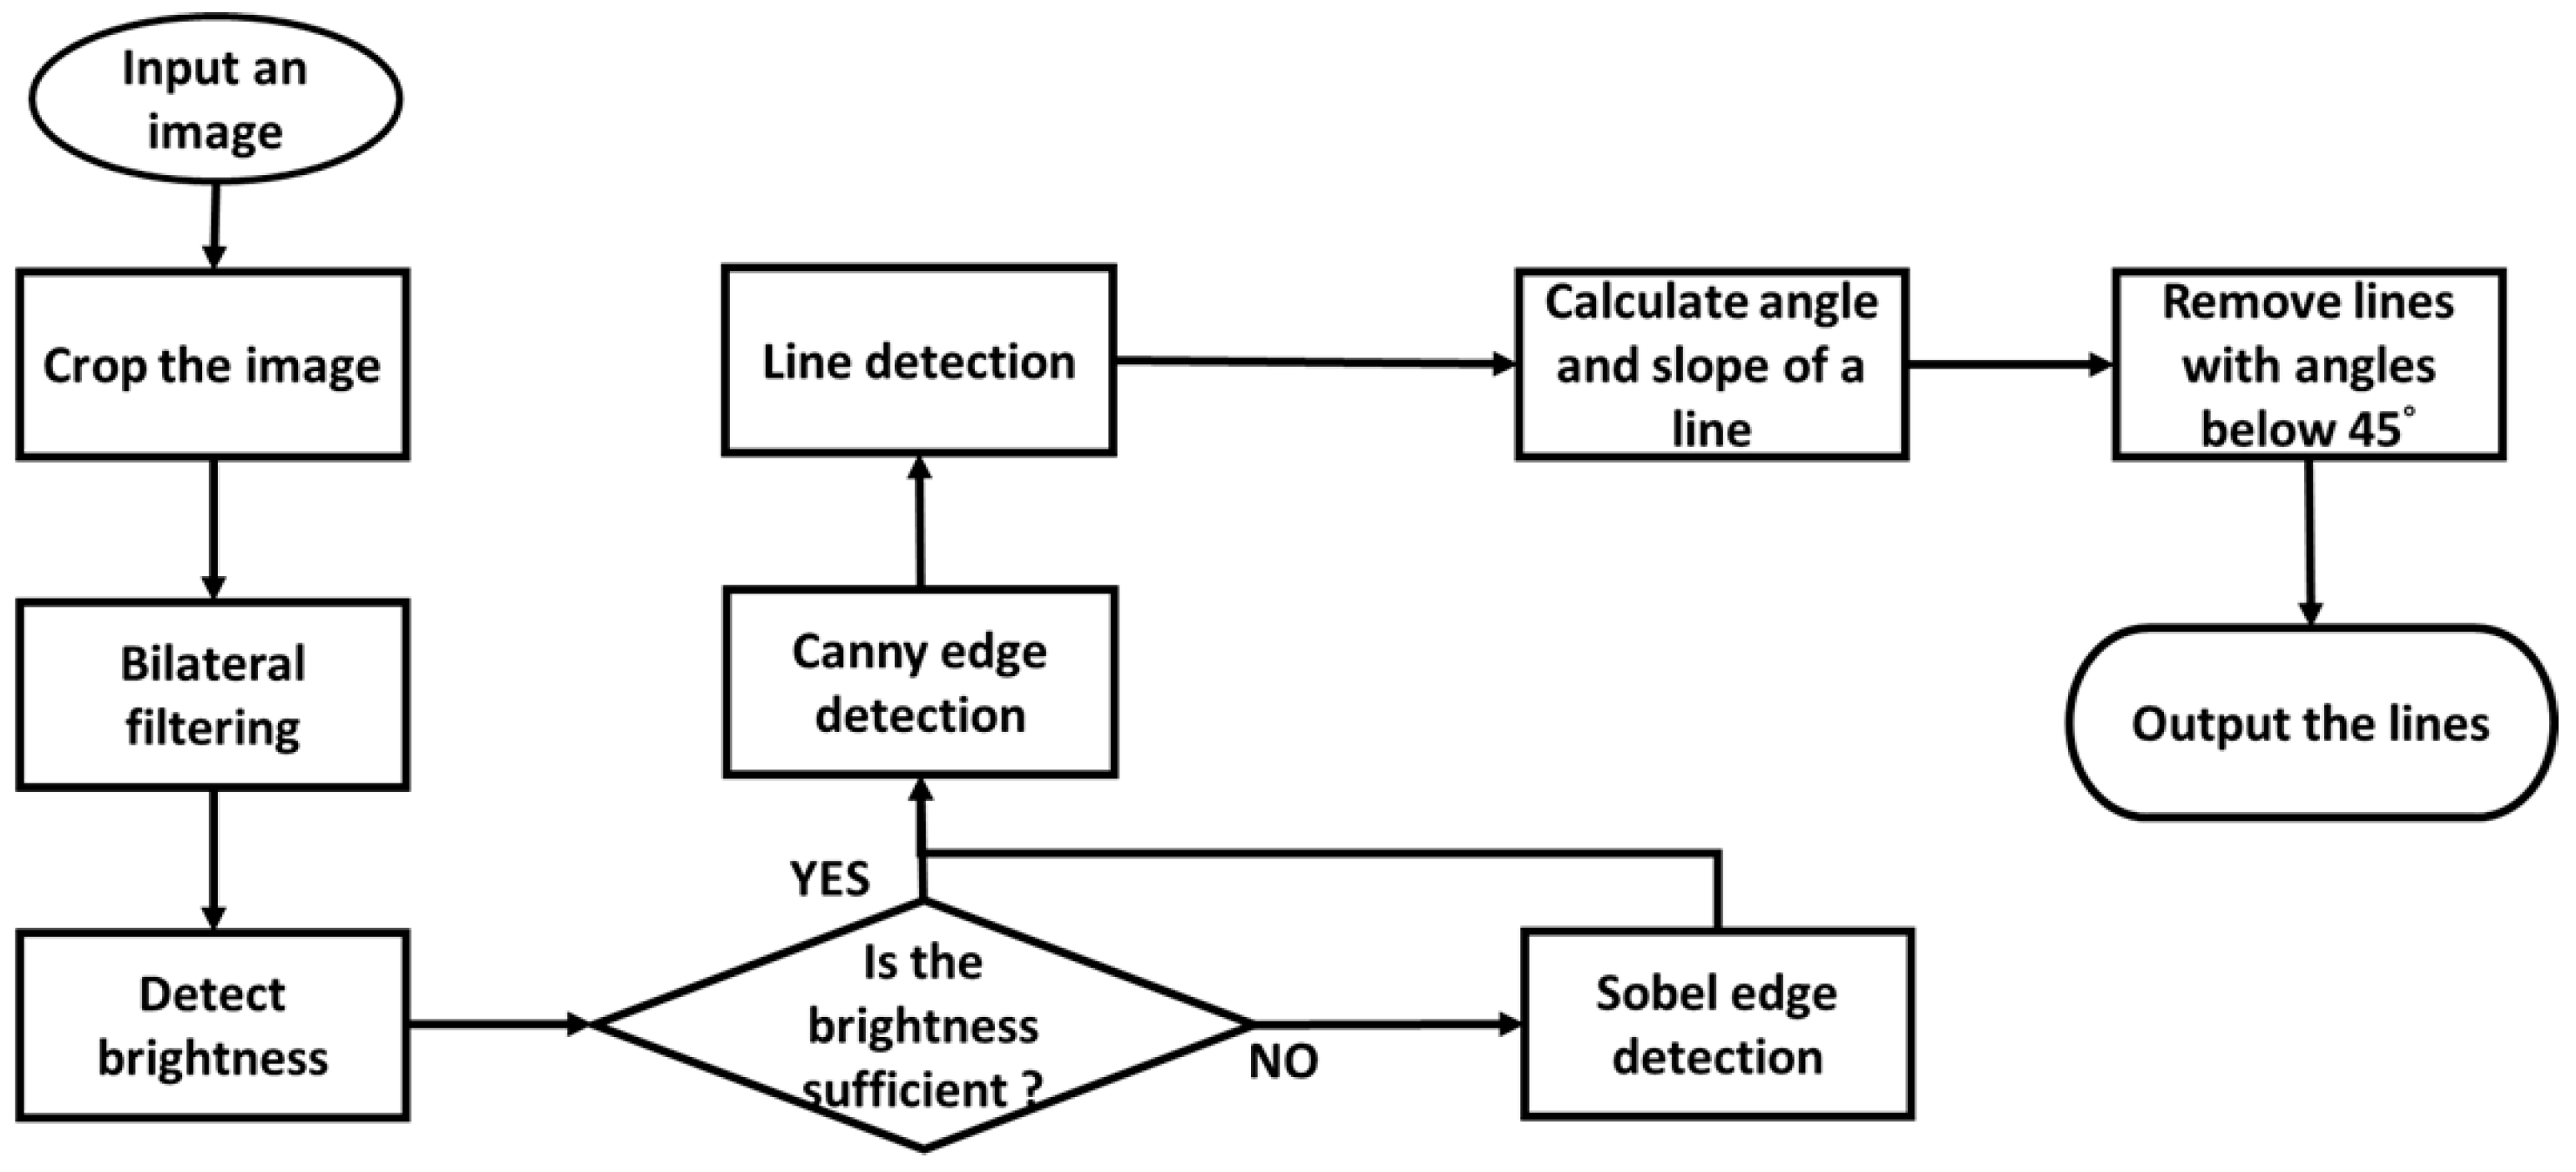
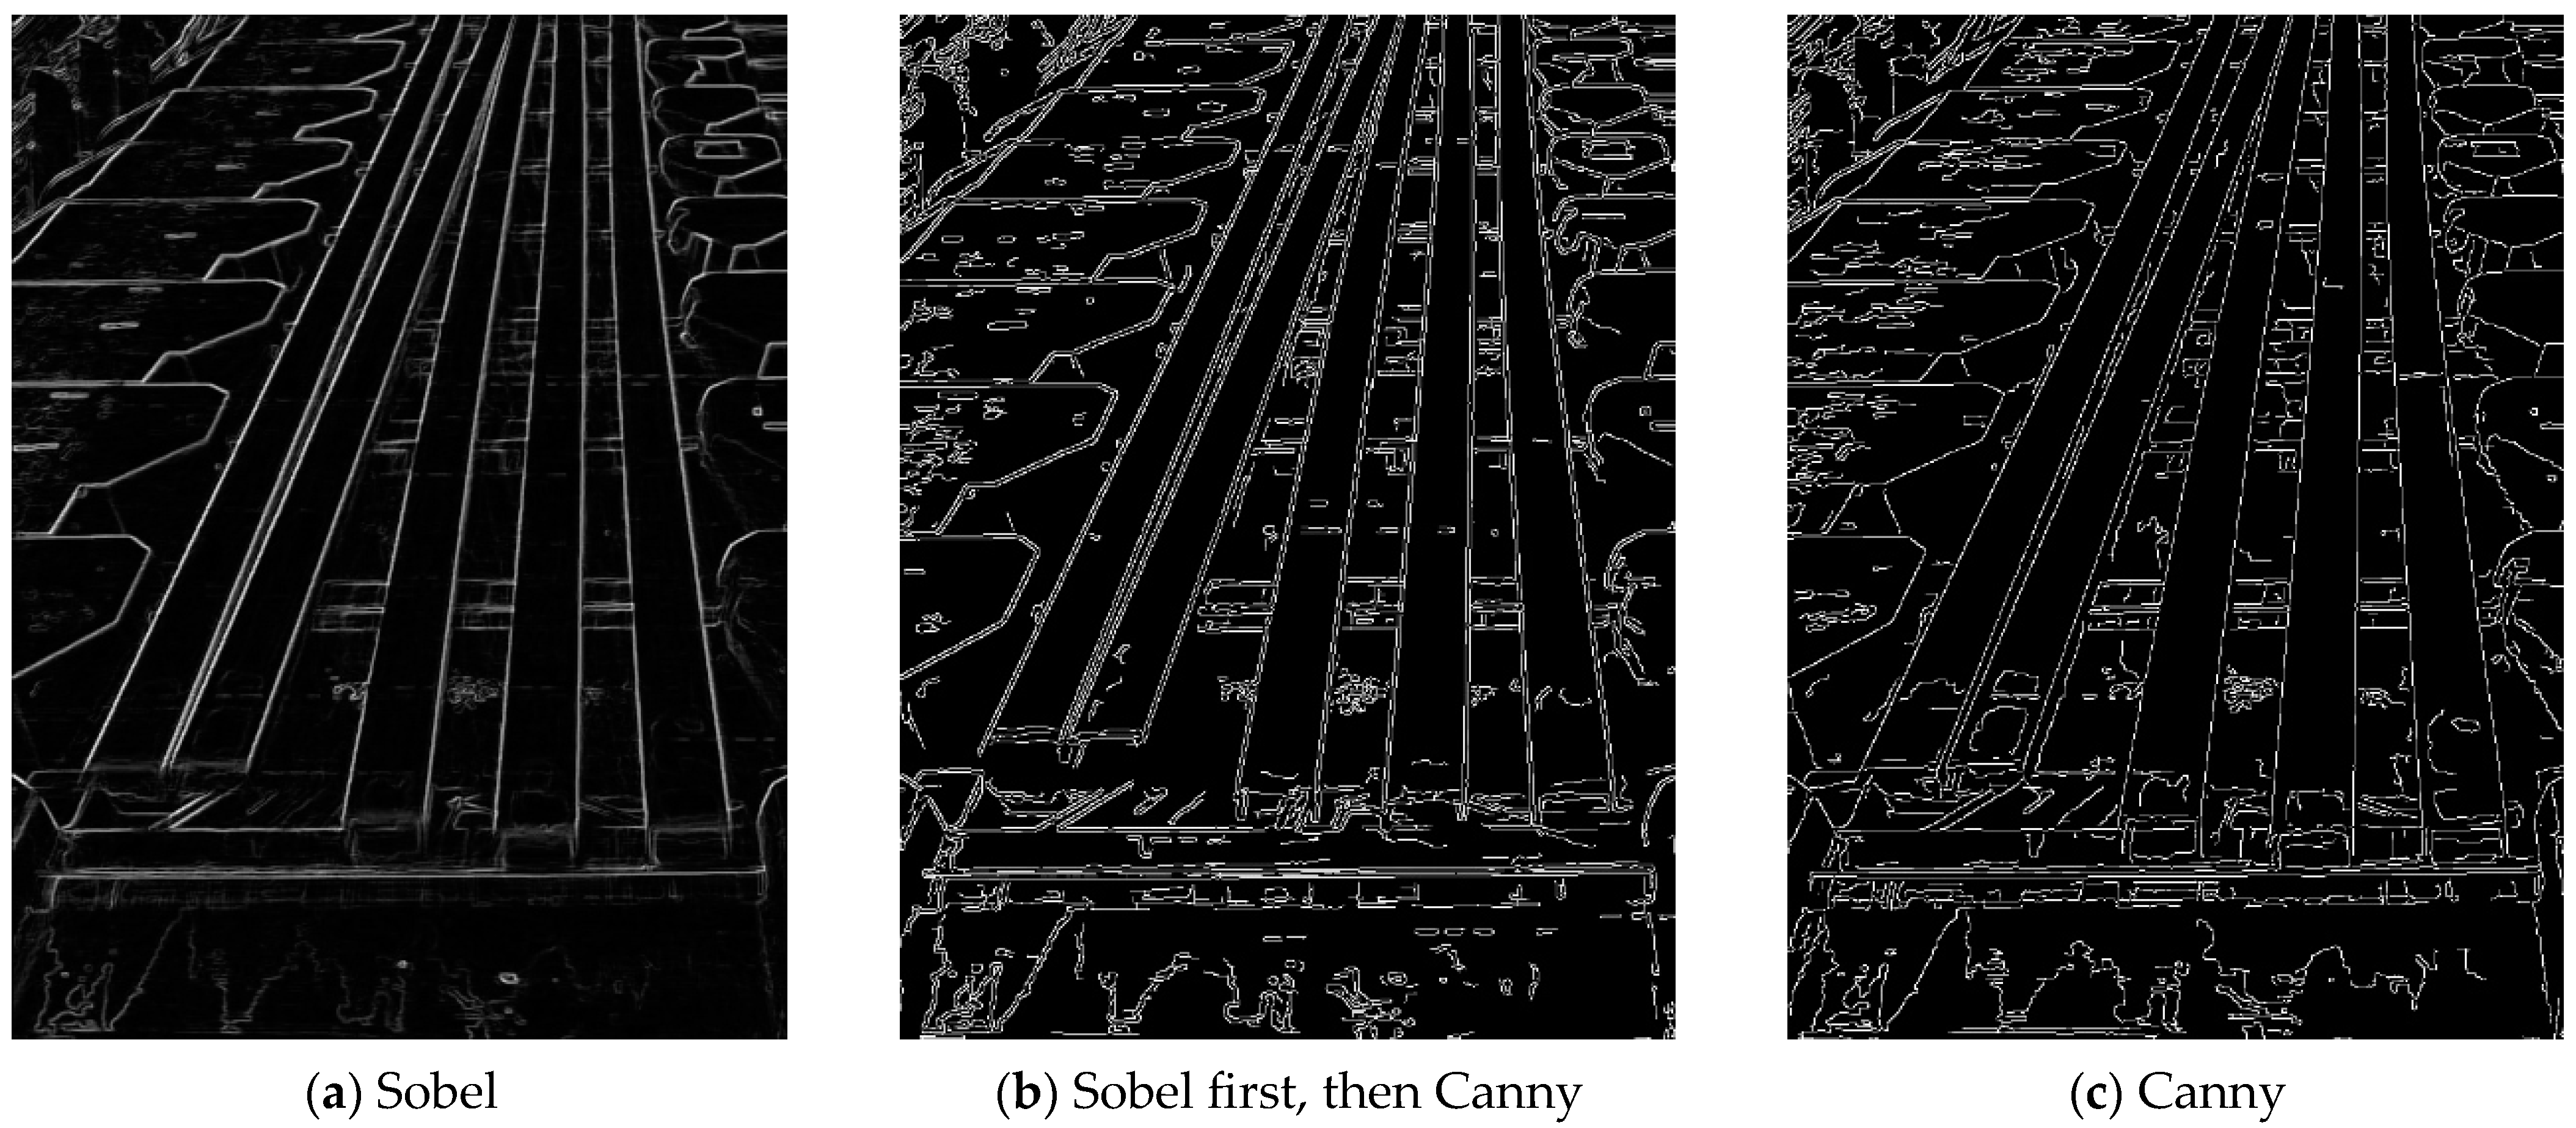
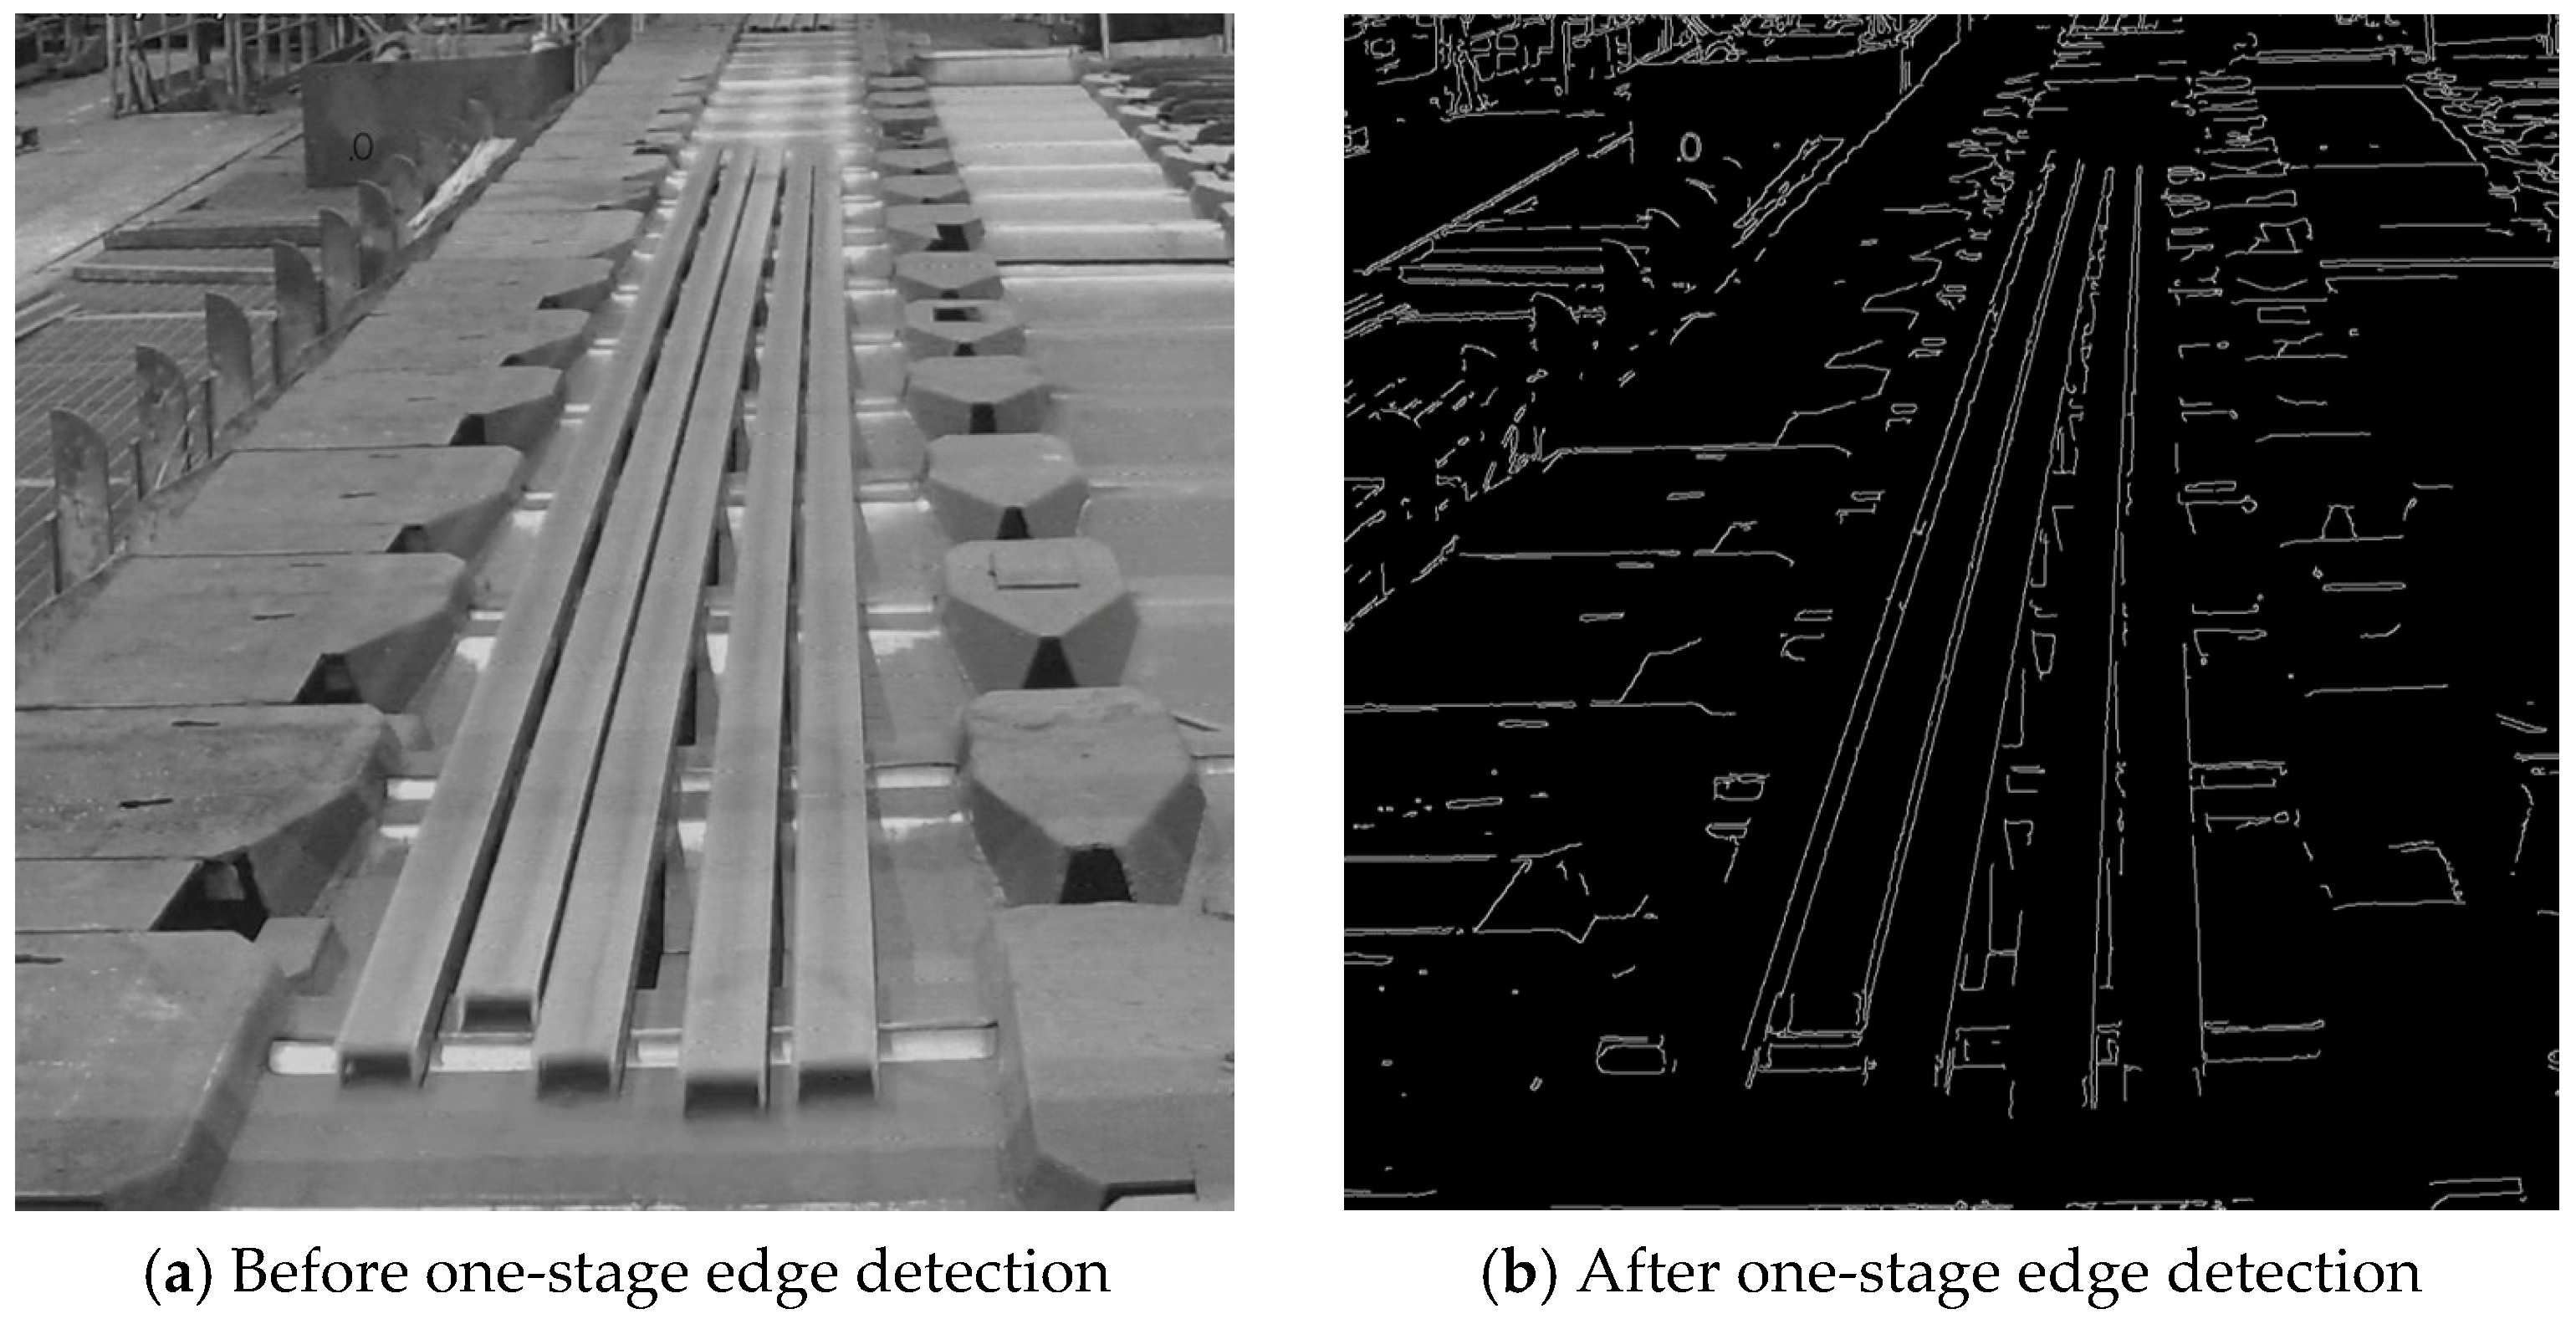
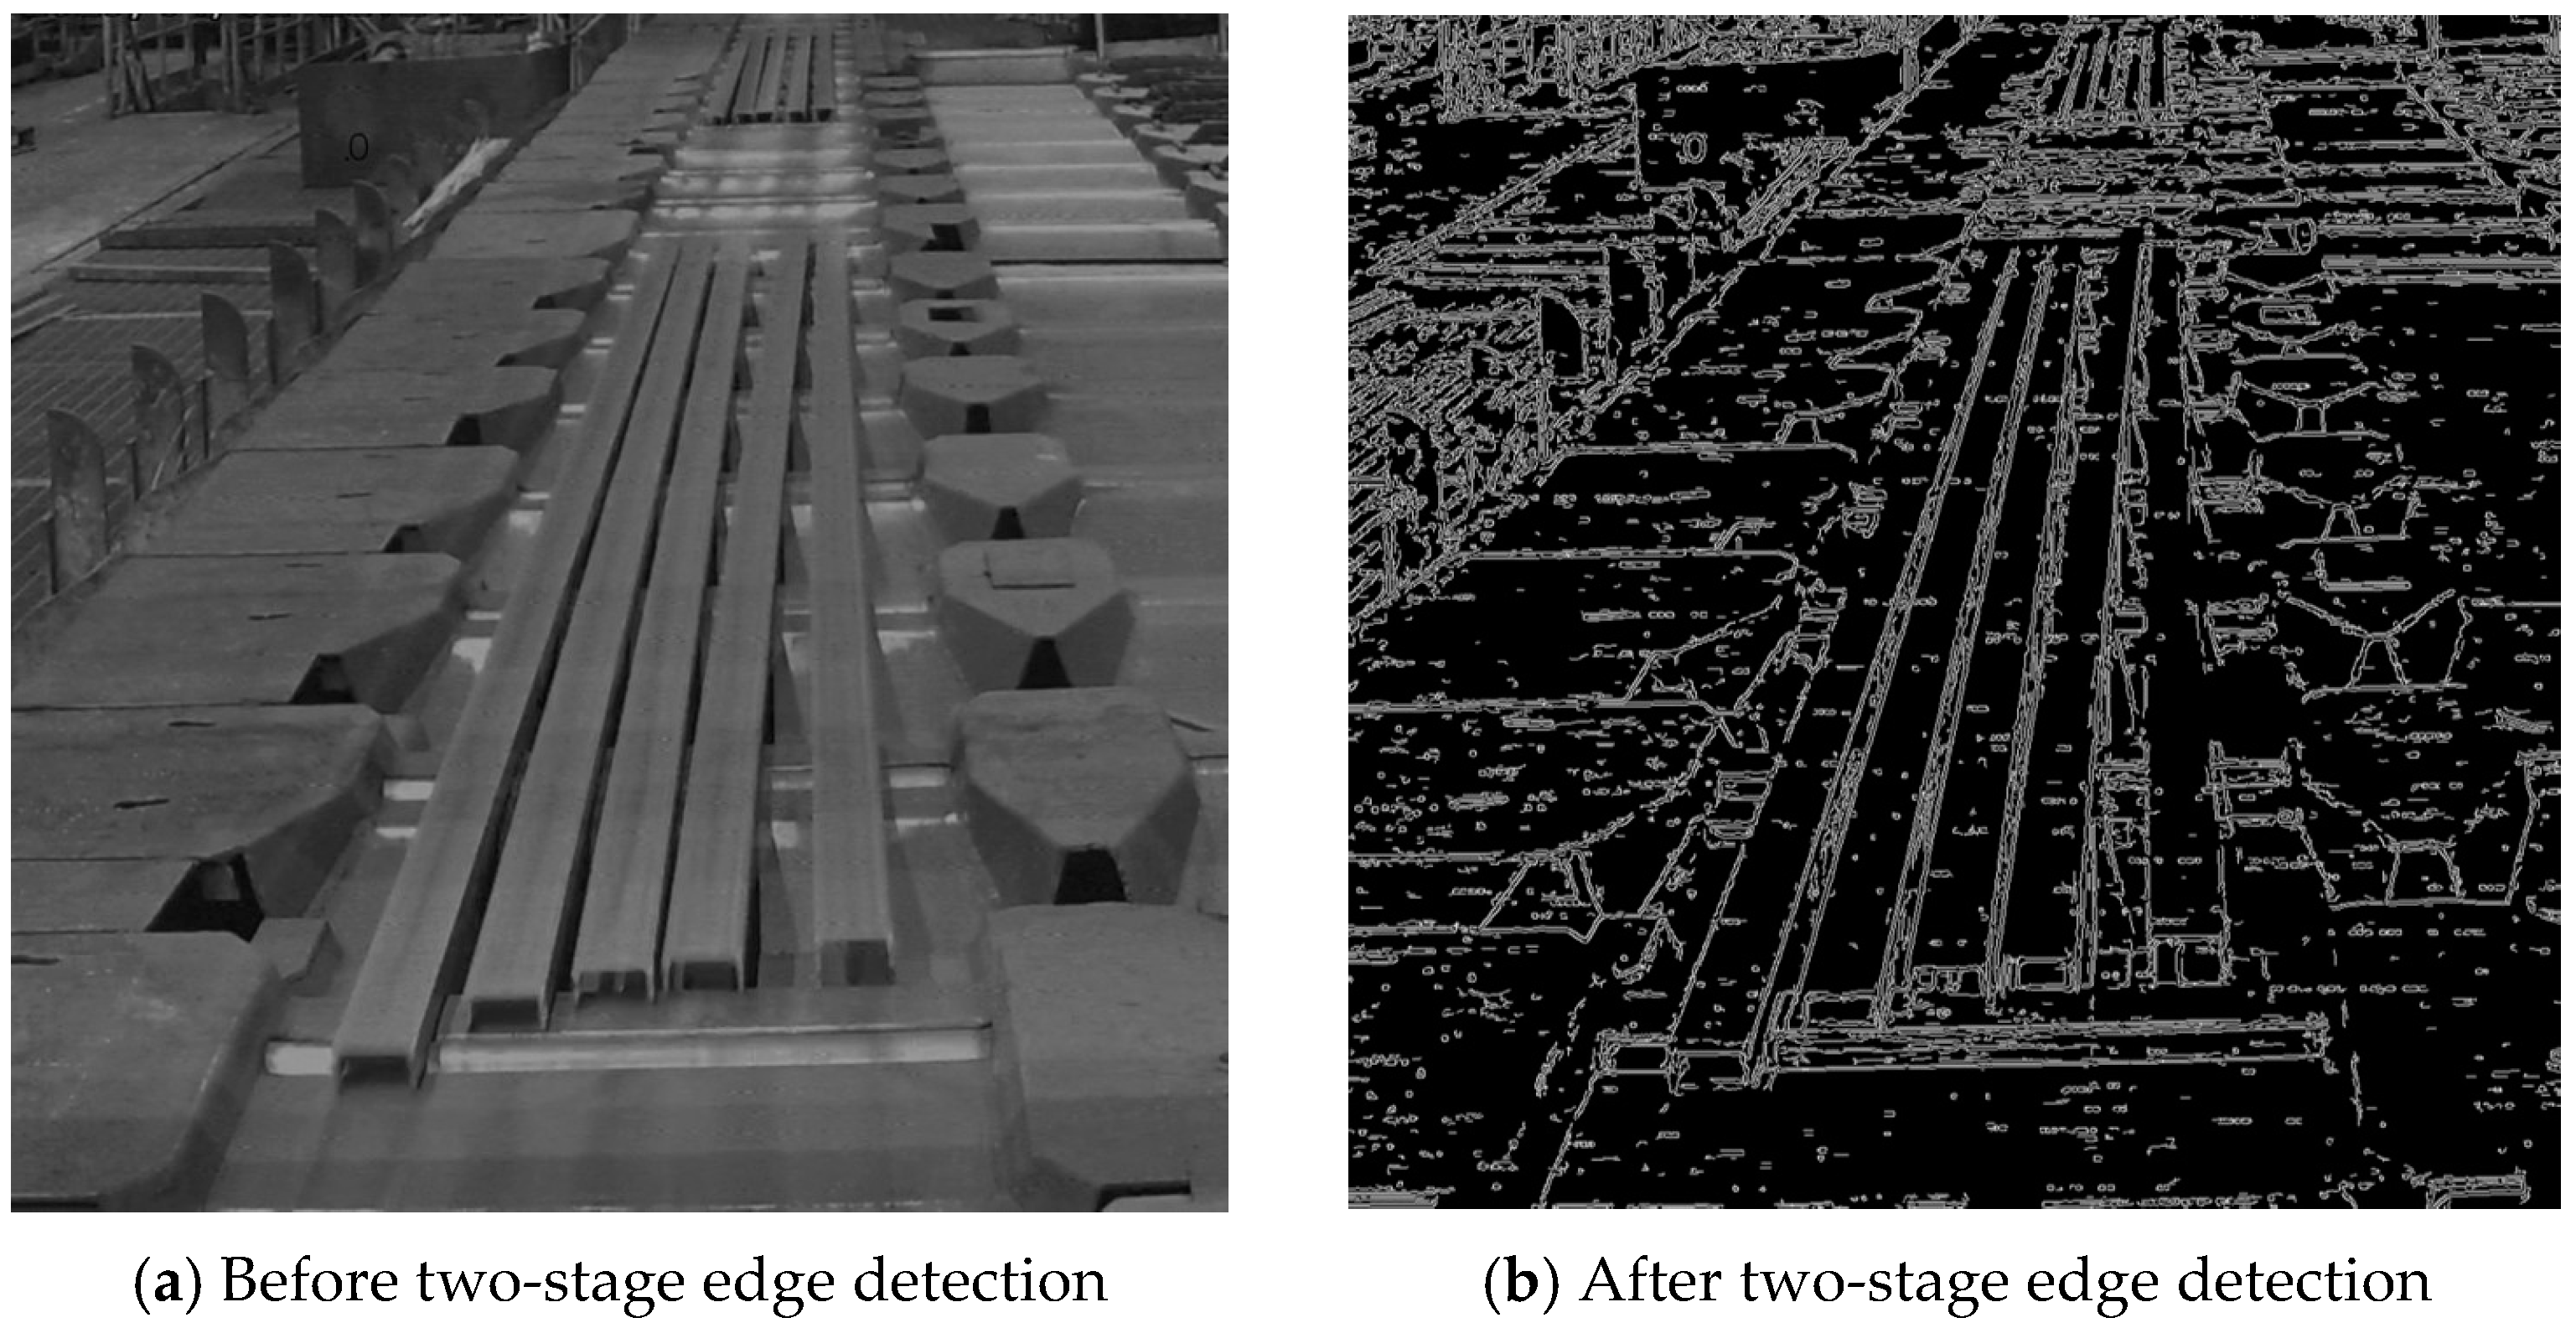
2.2.3. Edge and Line Detection
2.2.4. Line Grouping
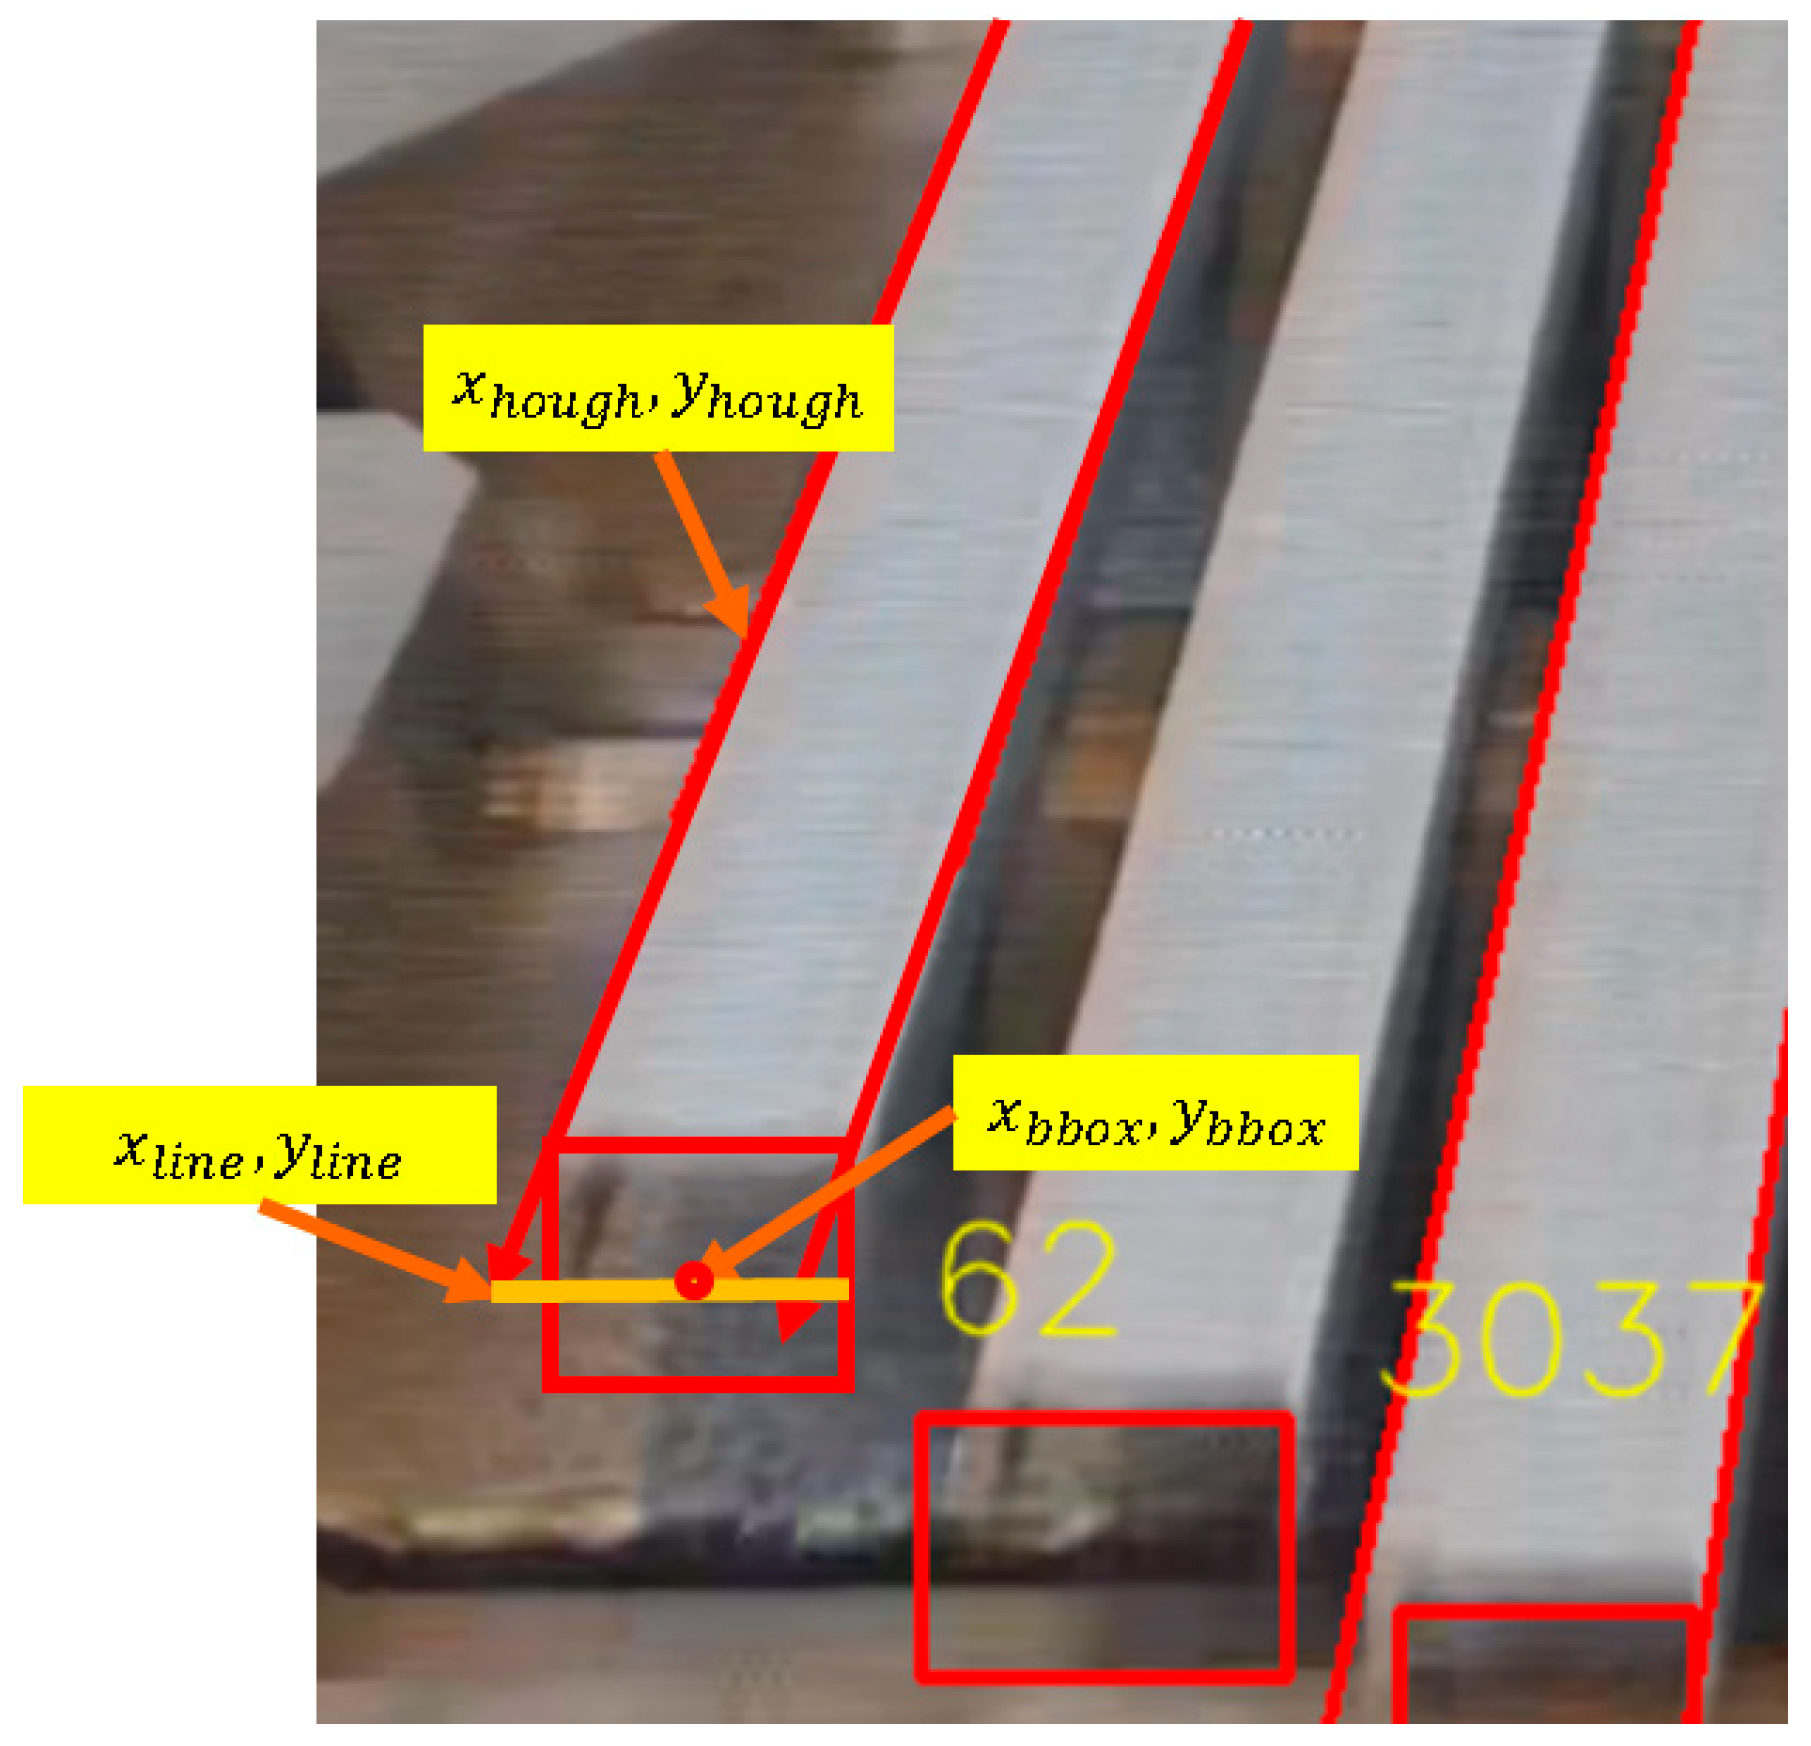
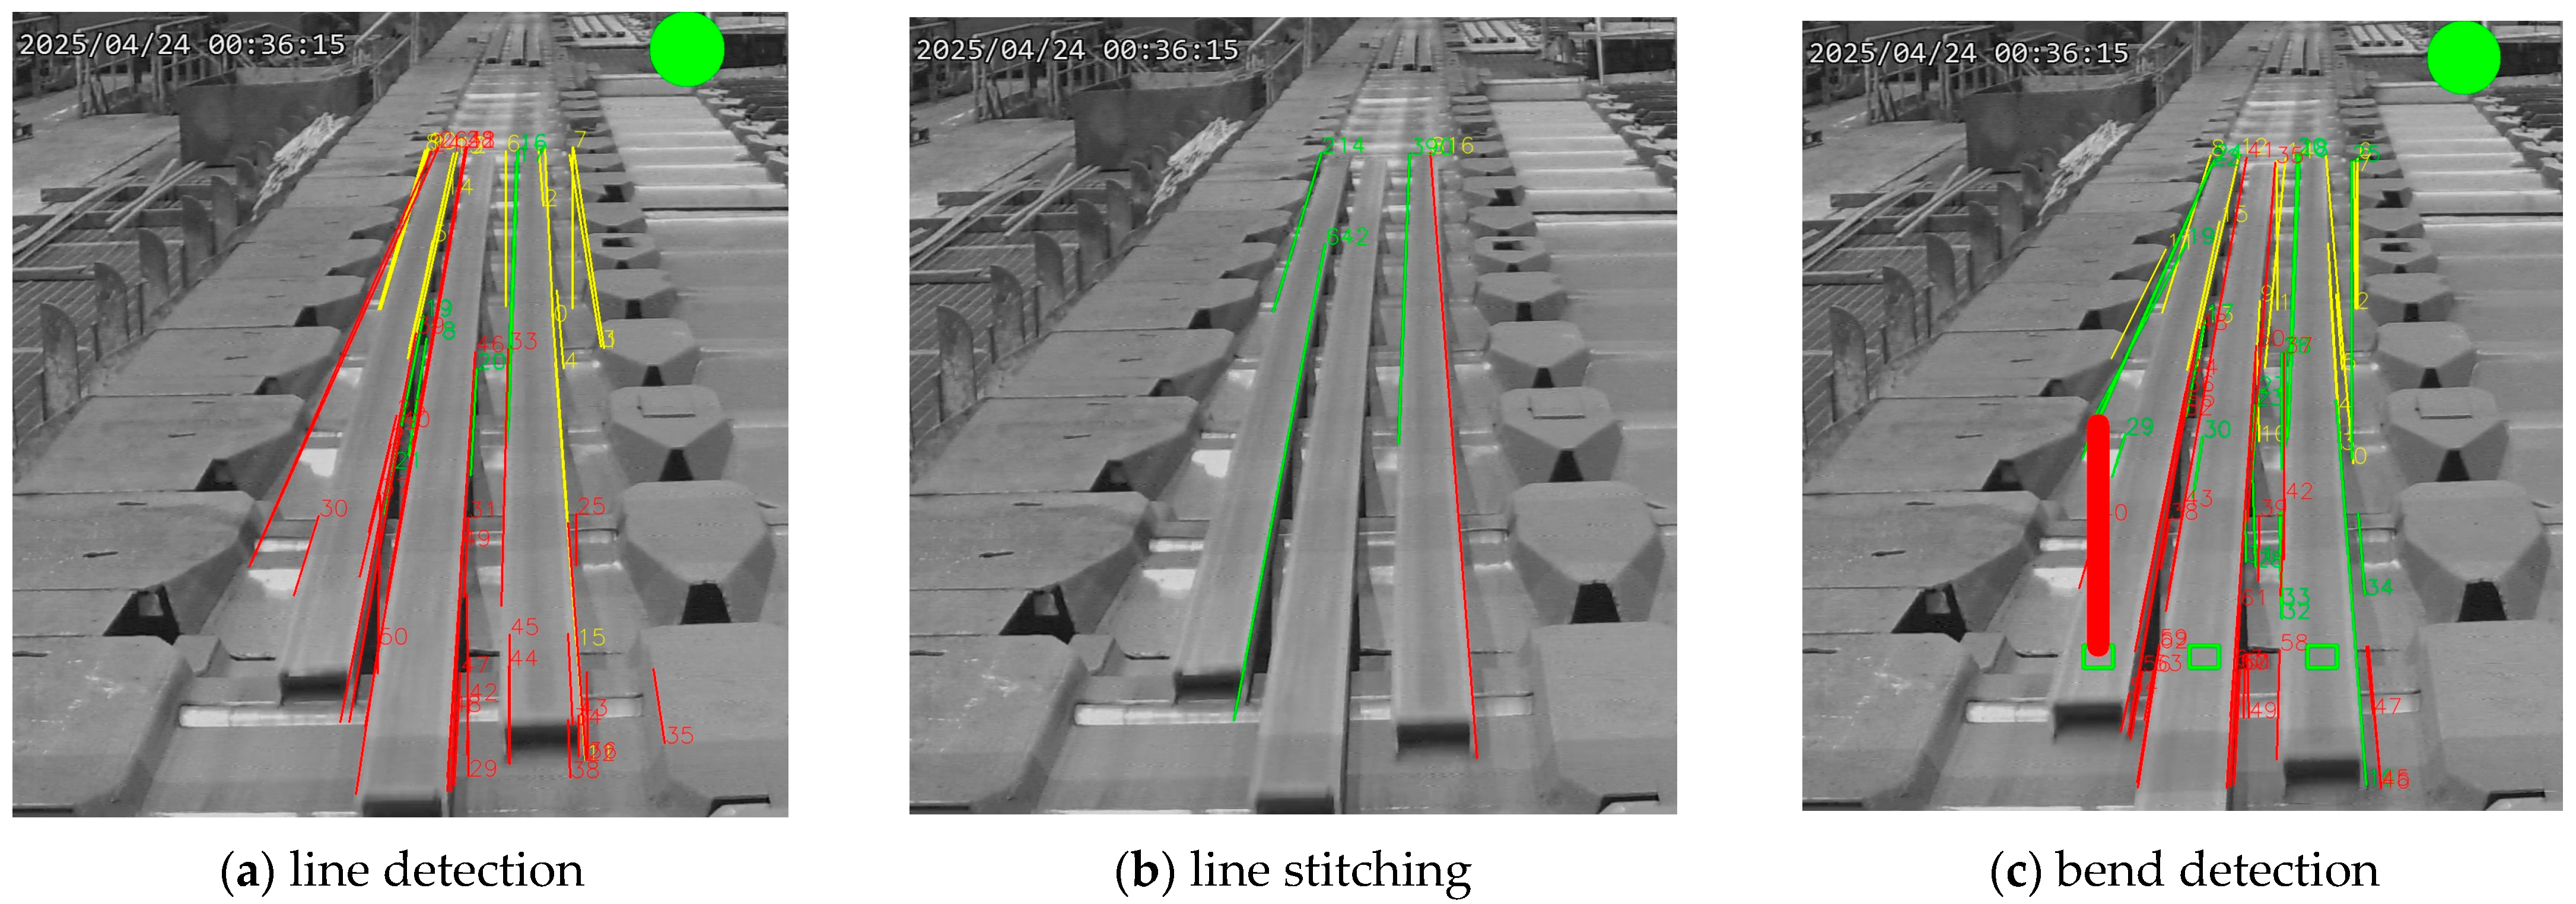
2.2.5. Line Stitching and Bend Detection
3. Implementation and Experimental Results
3.1. Implementation Environment
3.2. Implemented System and Experimental Results
- True positive (TP): A correctly identified bent steel bar. This means that after reconstructing and stitching its contour segments using the angular tolerance , the total length of the resulting straight segments is less than the .
- False positive (FP): A straight steel bar incorrectly classified as bent. In this case, the reconstructed straight segment length using is less than the , even though the bar is actually straight.
- True negative (TN): A correctly identified straight steel bar. Its contour, when reconstructed and stitched using , results in a total straight segment length greater than the .
- False negative (FN): A bent steel bar incorrectly classified as straight. Although the bar is actually bent, the reconstructed straight segment length using exceeds the , leading to a misclassification.
4. Discussion
4.1. Analysis of Experiment Results
4.2. Comparison with Previous Studies
4.3. Time Complexity of the Algorithm
- Line grouping: Using the clustering algorithm described in Section 2.2.4, each line segment is processed once to determine its corresponding group. This procedure is executed n times in total, resulting in a time complexity of O(n).
- Line stitching: After grouping, all line segments within the same group are assumed to belong to the contour of the same steel bar. Therefore, stitching is performed n times to merge line segments whose angular difference from the reference line is less than 0.33 degrees. This step also has a time complexity of O(n).
4.4. Cost-Effective Automated Inspection
5. Conclusions
- Adaptive edge detection: Employing one-stage or two-stage methods based on varying lighting conditions to accurately capture the steel contour.
- Contour reconstruction: Using object detection to extract a reference point at the U-shaped bottom and line detection to reconstruct the contour by stitching segments with angular differences within a threshold ().
- Straightness detection: Classifying steel as straight if the reconstructed contour length (L) exceeds a defined threshold (), with and setting the acceptable bending tolerances.
Author Contributions
Funding
Institutional Review Board Statement
Informed Consent Statement
Data Availability Statement
Acknowledgments
Conflicts of Interest
References
- CNS 2473; Hot-Rolled Steel for General Structure Bureau of Standards. Metrology and Inspection, Ministry of Economic Affairs: Taipei, Taiwan, 2024.
- JIS G3101; Rolled Steels for General Structure, Ministry of Economy, Trade and Industry. Japanese Industrial Standards Committee: Tokyo, Japan, 2024.
- ASTM A36/A36M-21; Standard Specification for Carbon Structural Steel. ASTM International: West Conshohocken, PA, USA, 2021.
- Schmid-Schirling, T.; Kraft, L.; Carl, D. Laser scanning–based straightness measurement of precision bright steel rods at one point. Int. J. Adv. Manuf. Technol. 2021, 116, 2511–2519. [Google Scholar] [CrossRef]
- González, R.C.; Valdés, R.; Cancelas, J.A. Vision Based Measurement System to Quantify Straightness Defect in Steel Sheets. Lect. Notes Comput. Sci. 2001, 2124, 432–439. [Google Scholar] [CrossRef]
- Li, M.; Li, Y.; Li, X.; Li, C. A railway rail straightness detection mechanism and error analysis. In Proceedings of the 2nd International Conference on Electronic Materials and Information Engineering (EMIE 2022), Hangzhou, China, 15–17 April 2022; pp. 1–6. [Google Scholar]
- Fang, S.; Shi, L. Straightness measuring and finite element analysis of the drilling pipe straightening based on the LPD. In Proceedings of the 2006 International Technology and Innovation Conference (ITIC 2006), Hangzhou, China, 6–7 November 2006. [Google Scholar] [CrossRef]
- Yoo, J.; Lee, W.I.; Kong, N.; Choi, Y.-J.; Park, P. An edge detection algorithm for steel bar in hot rolling process. In Proceedings of the 2014 14th International Conference on Control, Automation and Systems (ICCAS 2014), Goyang-si, Republic of Korea, 22–25 October 2014. [Google Scholar] [CrossRef]
- Golkar, E.; Prabuwono, A.S.; Patel, A. Real-Time Curvature Defect Detection on Outer Surfaces Using Best-Fit Polynomial Interpolation. Sensors 2012, 12, 14774–14791. [Google Scholar] [CrossRef] [PubMed]
- Valentina, P.; Milena, M.; Nicola, P.; Paolo, C.; Luigi, M.; Kosmas, A. Beam straightness measurement with laser triangulation system: A steel industry use case. In Proceedings of the 2023 IEEE International Workshop on Metrology for Industry 4.0 & IoT (MetroInd4.0&IoT), Brescia, Italy, 6–8 June 2023; pp. 130–135. [Google Scholar] [CrossRef]
- Chang’an, H.; Song, H.; Fei, L.; Haifeng, S. Study on measuring method of straightness of indoor large length standard device. In Proceedings of the 2022 4th International Conference on Intelligent Control, Measurement and Signal Processing (ICMSP), Hangzhou, China, 8–10 July 2022; pp. 9–13. [Google Scholar] [CrossRef]
- Bai, J.; Zhou, T.; Cai, J.; Gao, S.; Li, J.; Bai, J. Research on edge camber detection method of hot rolled steel based on hough transform. In Proceedings of the 2021 18th International Computer Conference on Wavelet Active Media Technology and Information Processing (ICCWAMTIP), Chengdu, China, 17–19 December 2021; pp. 539–542. [Google Scholar] [CrossRef]


| Component | Specification |
|---|---|
| CPU | Intel I5-10400 |
| Motherboard | Gigabyte B580M |
| Memory | Kingston 8GB DDR4 2666 *2 16G |
| SSD | ADATA SU800 512G |
| HDD | Seagate ST4000 4T |
| GPU | MSI GeForce RTX 2060 VENTUS 6G OC |
| Power Supply | 550 W |
| Test Date and Time | Duration (Hours) | Number of Steel Bars | Types of Steel | TP | FP | TN | FN | Accuracy (%) | Recall (%) |
|---|---|---|---|---|---|---|---|---|---|
| 2022 10/07 14:30 ~ 10/08 10:30 | 20 | 19,053 | U100 | 33 | 53 | 18,965 | 2 | 99.71 | 94.29 |
| 2022 12/07 14:00 ~ 12/07 23:00 | 9 | 3281 | U150 | 7 | 35 | 3239 | 0 | 98.93 | 100 |
| 2023 05/31 14:00 ~ 06/01 10:00 | 20 | 23,522 | U100 | 12 | 90 | 23,418 | 2 | 99.61 | 85.71 |
| 2023 06/14 14:00 ~ 06/16 10:00 | 44 | 11,183 | U150 | 10 | 100 | 11,073 | 0 | 99.11 | 100 |
| 2023 06/21 14:00 ~ 06/22 10:00 | 20 | 23,929 | U100 | 10 | 85 | 23,834 | 0 | 99.65 | 100 |
| 2023 08/23 22:00 ~ 08/24 16:30 | 18.5 | 6409 | U150 | 1 | 3 | 6405 | 0 | 99.95 | 100 |
| 2023 08/24 23:00 ~ 08/25 14:00 | 15 | 6876 | U150 | 2 | 48 | 6826 | 0 | 99.30 | 100 |
| 2023 09/21 22:00 ~ 09/23 11:00 | 37 | 13,435 | U150 | 1 | 6 | 13,428 | 0 | 99.96 | 100 |
| 2023 10/12 08:00 ~ 10/12 17:30 | 9.5 | 15,440 | U100 | 13 | 17 | 15,410 | 0 | 99.89 | 100 |
| Total/Average | 193 | 123,128 | 89 | 437 | 122,598 | 4 | 99.64 | 95.70 |
| Author | System | Precision | Samples | Measurement Times | Application |
|---|---|---|---|---|---|
| González et al. [5] | video processing (Hough line) | 25–150 mm/m | 3 | Not Available | hot-rolled steel sheet manufacturing |
| Fang, S. et al. [7] | laser scanning | 0.02 mm/m | 1 | Not Available | drilling pipe manufacturing |
| Golkar, E. et al. [9] | video processing (curvature) | 3.25 mm/m | 200 | Not Available | ceramic tile mass production |
| Proposed scheme | video processing (Hough line) | 2 mm/m | 123,128 | 0.5 s for 5 steels | mass production of structural steel |
Disclaimer/Publisher’s Note: The statements, opinions and data contained in all publications are solely those of the individual author(s) and contributor(s) and not of MDPI and/or the editor(s). MDPI and/or the editor(s) disclaim responsibility for any injury to people or property resulting from any ideas, methods, instructions or products referred to in the content. |
© 2025 by the authors. Licensee MDPI, Basel, Switzerland. This article is an open access article distributed under the terms and conditions of the Creative Commons Attribution (CC BY) license (https://creativecommons.org/licenses/by/4.0/).
Share and Cite
Chen, Y.-J.; Yeh, Y.-H.; Yang, J.-F. A System for the Real-Time Detection of the U-Shaped Steel Bar Straightness on a Production Line. Sensors 2025, 25, 3972. https://doi.org/10.3390/s25133972
Chen Y-J, Yeh Y-H, Yang J-F. A System for the Real-Time Detection of the U-Shaped Steel Bar Straightness on a Production Line. Sensors. 2025; 25(13):3972. https://doi.org/10.3390/s25133972
Chicago/Turabian StyleChen, Yen-Jen, Yu-Hsiu Yeh, and Jen-Fu Yang. 2025. "A System for the Real-Time Detection of the U-Shaped Steel Bar Straightness on a Production Line" Sensors 25, no. 13: 3972. https://doi.org/10.3390/s25133972
APA StyleChen, Y.-J., Yeh, Y.-H., & Yang, J.-F. (2025). A System for the Real-Time Detection of the U-Shaped Steel Bar Straightness on a Production Line. Sensors, 25(13), 3972. https://doi.org/10.3390/s25133972