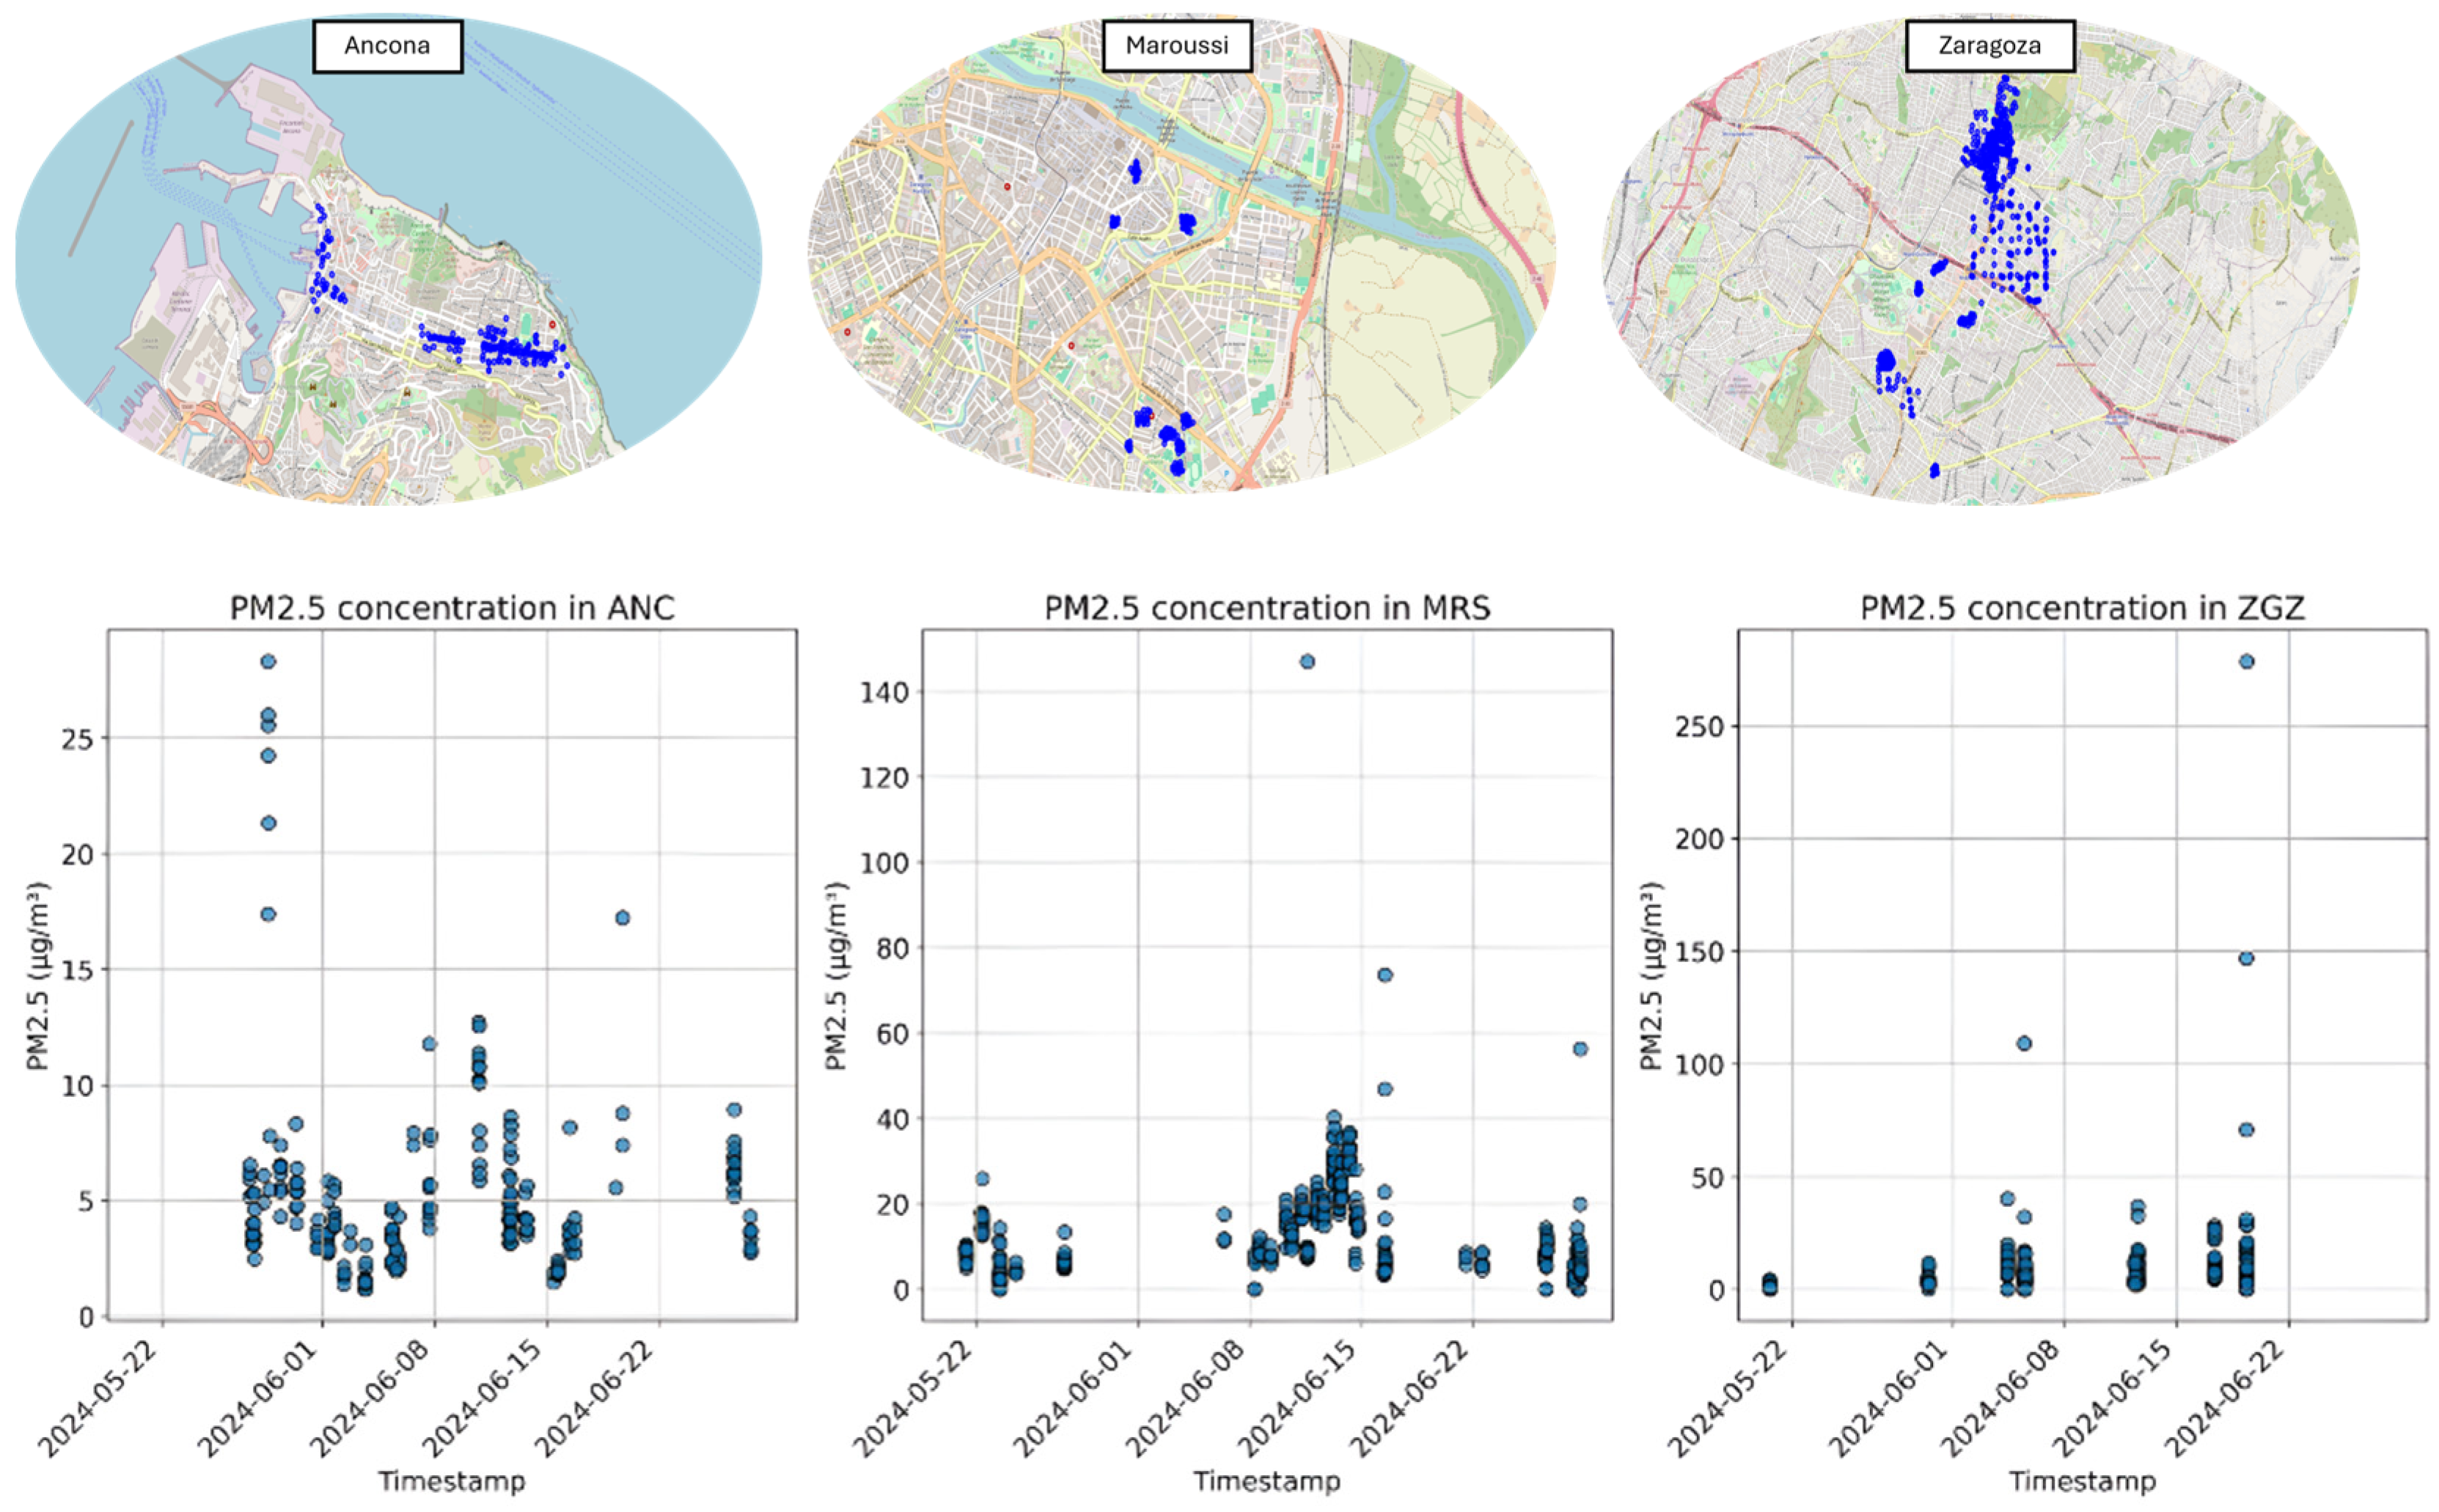
A summary analysis of the main characteristics of the campaigns conducted in the three pilot cities is displayed in
Table 1 together with a visual representation of the positions in the three cities where CS campaigns were conducted (
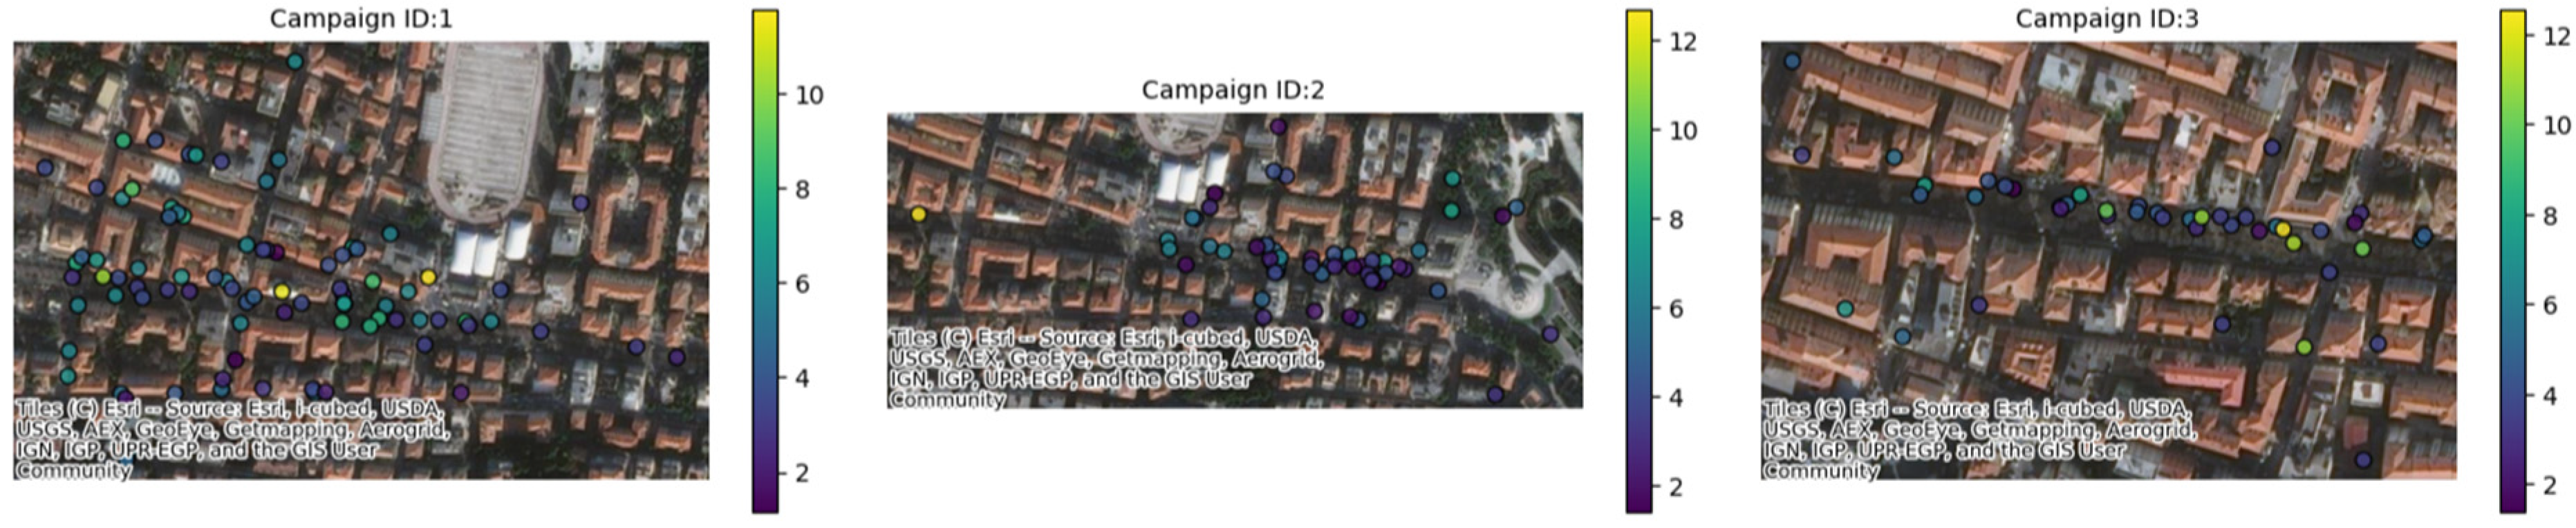
Figure 6). In the city of Ancona (
Table 2), between 27 May and 27 June 2024, one campaign was conducted, with six different sub-campaigns, representing six different areas of the city (
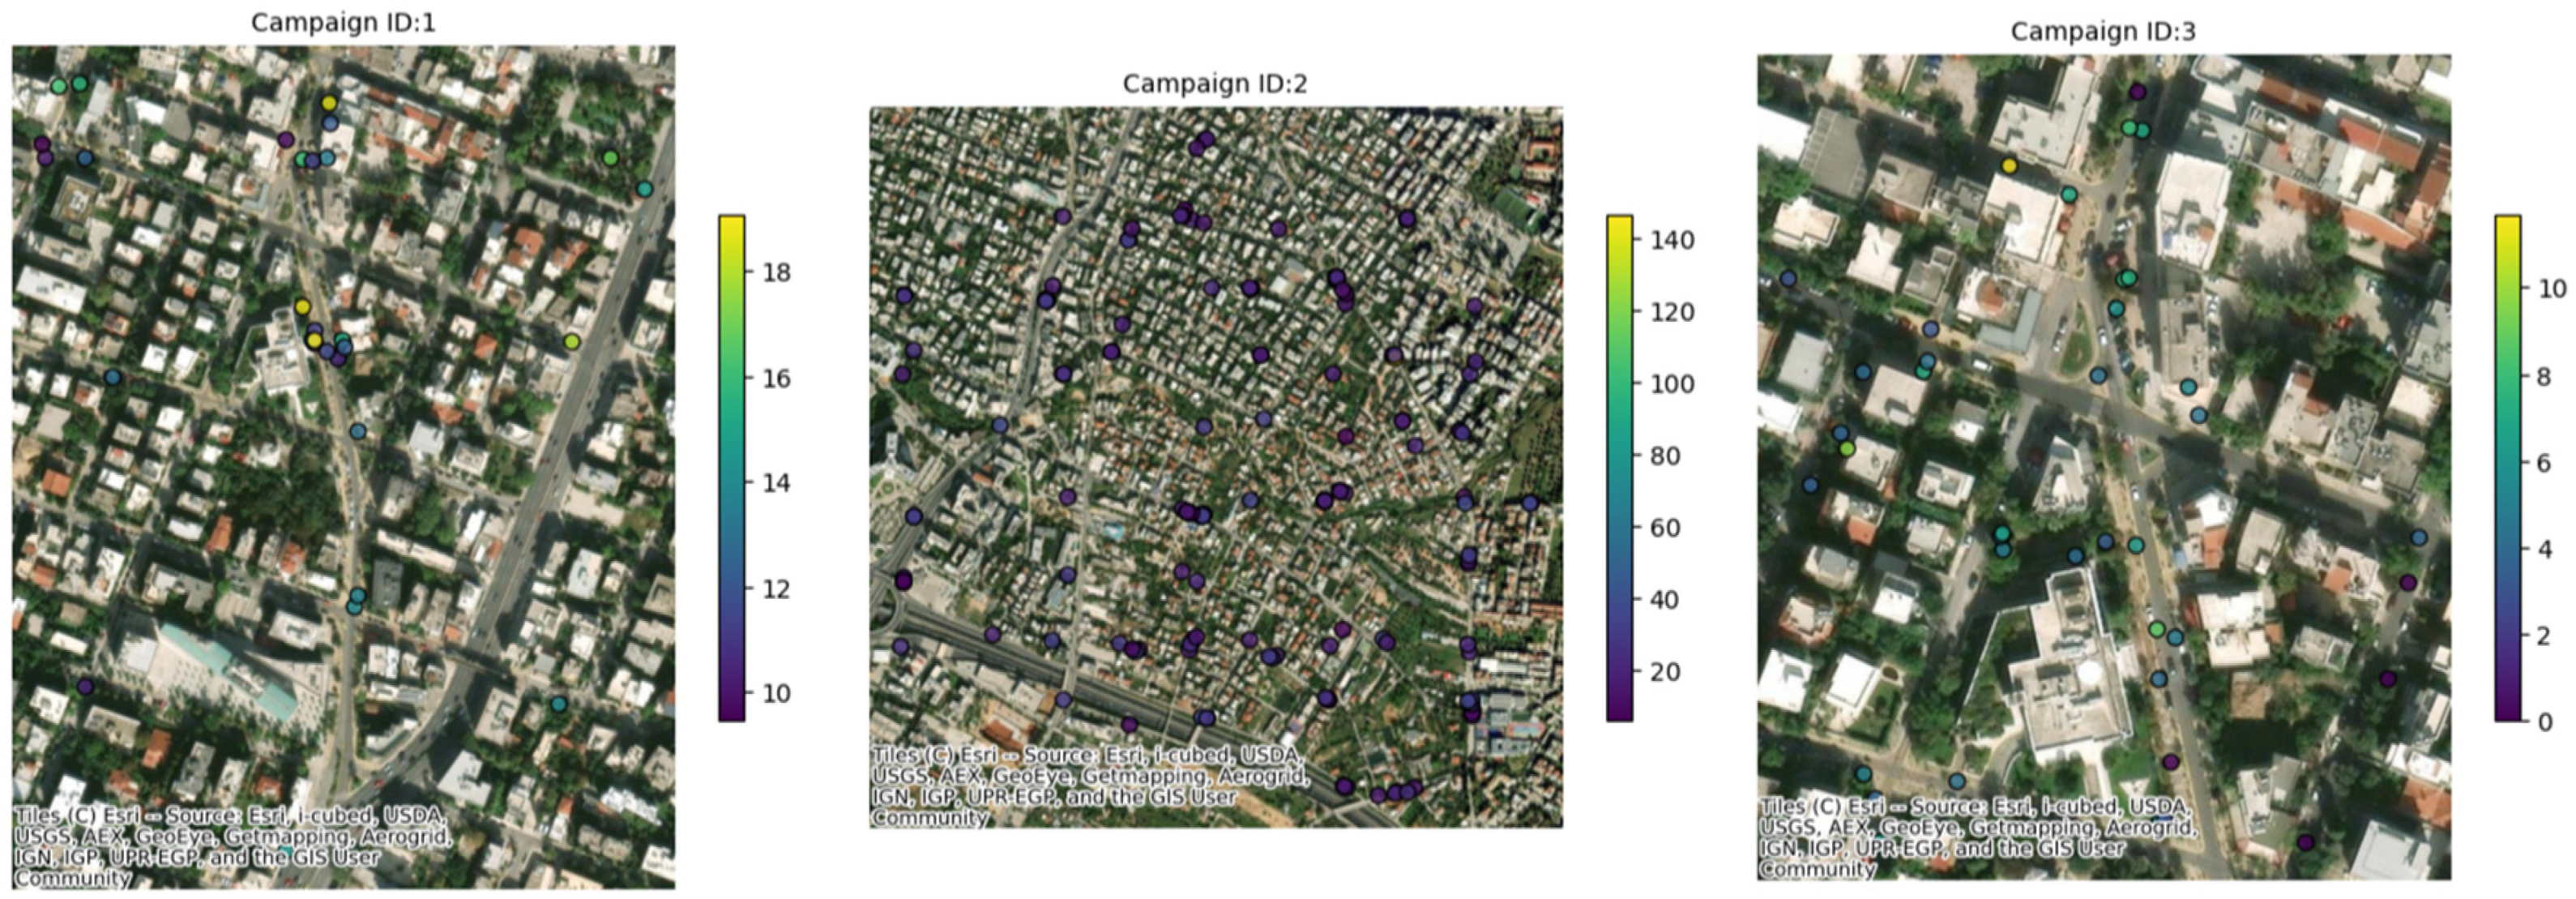
Figure 7); 10 recruited citizens were involved who collectively performed a total of 225 measurements. Over the course of just over a year, from 6 June 2023 to 28 June 2024 (measurements of 30 days in that period were collected), a total of 34 measurement campaigns were conducted in Maroussi (
Table 3), with the active participation of 59 citizens. These campaigns involved 61 participants who collectively performed 1206 measurements, contributing valuable data on the air quality in the city (
Figure 8).
First, a summary analysis of the measurement campaigns that were conducted is presented. This includes relevant summary statistics that describe the overall trend of each campaign, including the number of users taking measurements, number of measurement points, and average PM2.5 concentration over the monitored period.
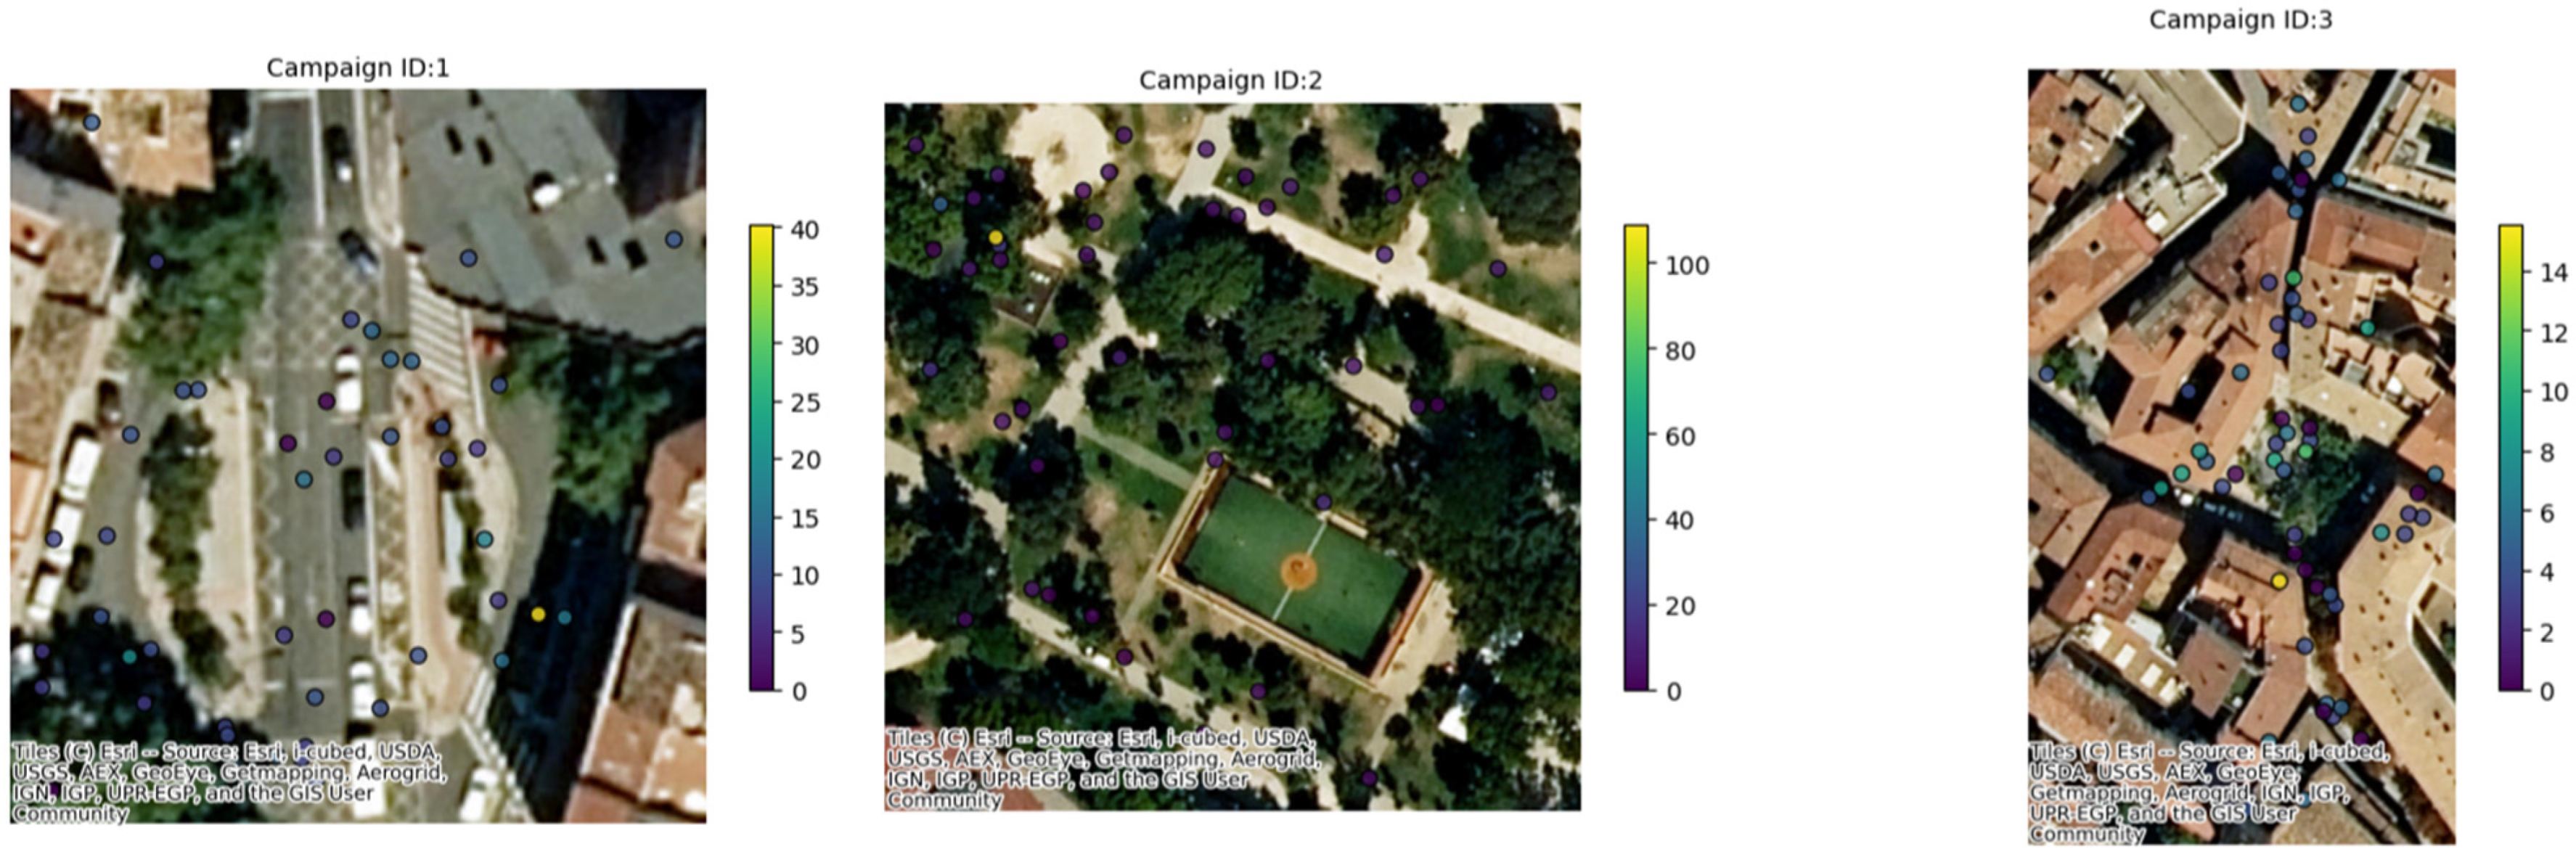
The Ancona seniors recorded lower, stable levels (residential areas), the Maroussi commuters showed traffic-linked peaks, and Zaragoza’s schoolchildren had extreme short-term spikes (e.g., Campaign 13). The differences reflect the measurement duration, localized sources, and participant behavior, underscoring the potential of citizen-collected data and methodological considerations for reliability. The single-day PM2.5 measurements in Zaragoza recorded an extreme outlier, likely due to transient pollution events near schools. The outlier in the data underscores the influence of localized, short-term environmental factors on air quality data. The campaigns highlight traffic-linked variability, with extremes such as Campaign 4 in Maroussi (21.3 ±13.3 µg/m3). The short-term campaigns (1–5 days) and diverse measurement points (10–139) captured transient exposure patterns near transit routes.
4.2. Clustering Data Collected from the WSN
A cluster analysis was designed to identify discrepancies between the reference station and the citizen-collected campaign measurements. This analysis aims to categorize the daily data into distinct clusters using clustering methods. It serves a dual purpose: first, to determine whether each cluster collectively aligns with the trend observed at the reference station; and second, to evaluate the impact of the distances between the cluster centroids and the reference station’s location. Additionally, the variability in the daily collected data within each cluster is examined to further characterize the consistency and distribution of measurements.
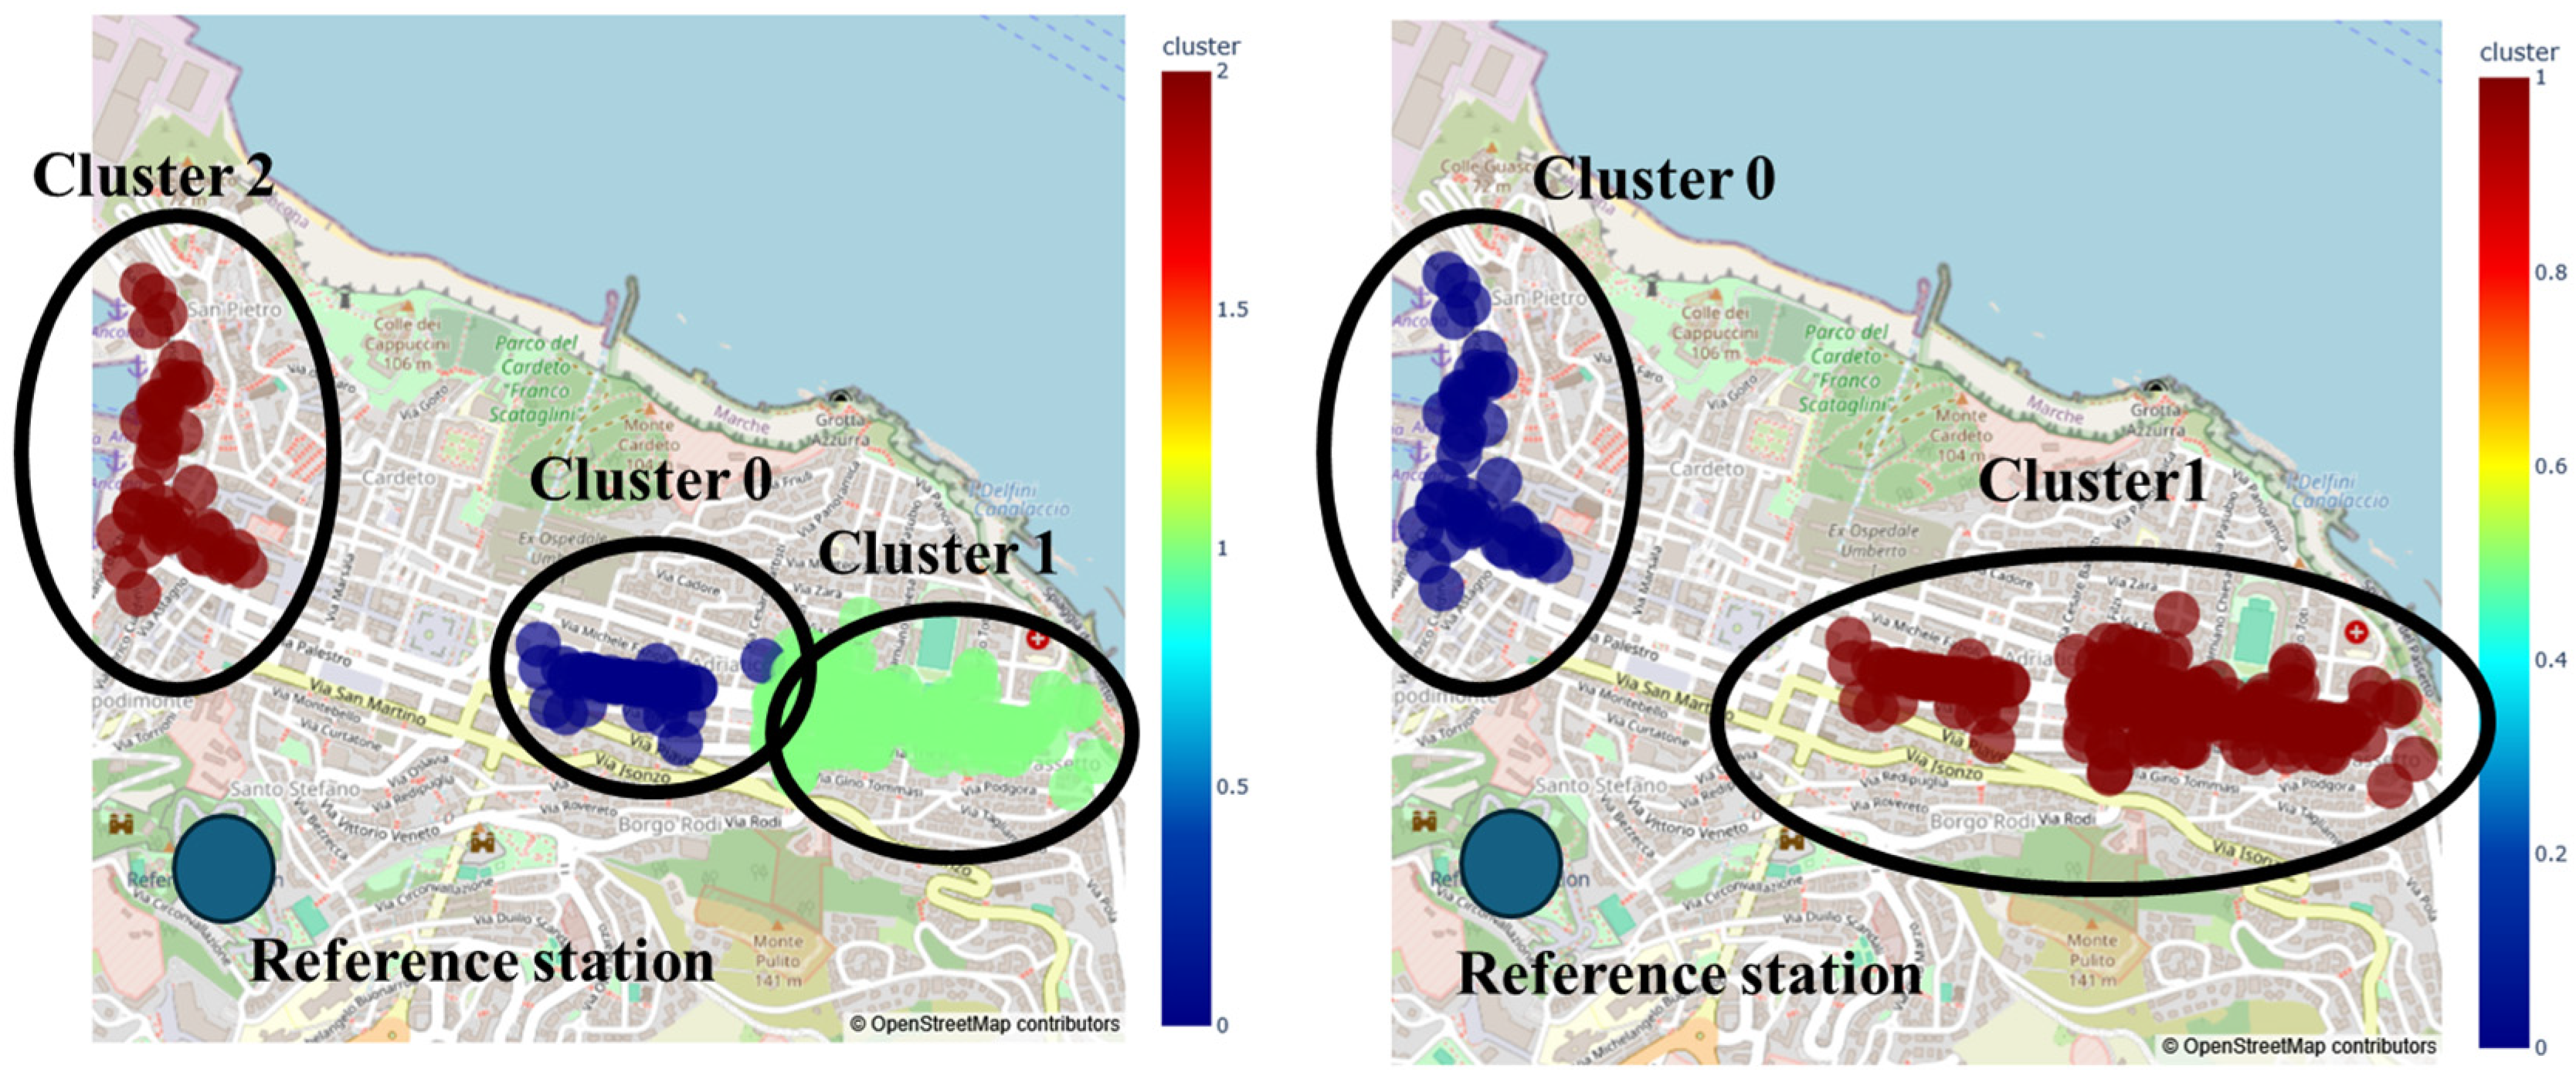
For the city of Ancona, the data were pre-processed and subsequently aggregated into hourly and daily datasets. The daily data were then input into the k-means algorithm, considering two configurations: cluster numbers of K = 2 and K = 3. An example of the clustering results is provided in
Figure 11.
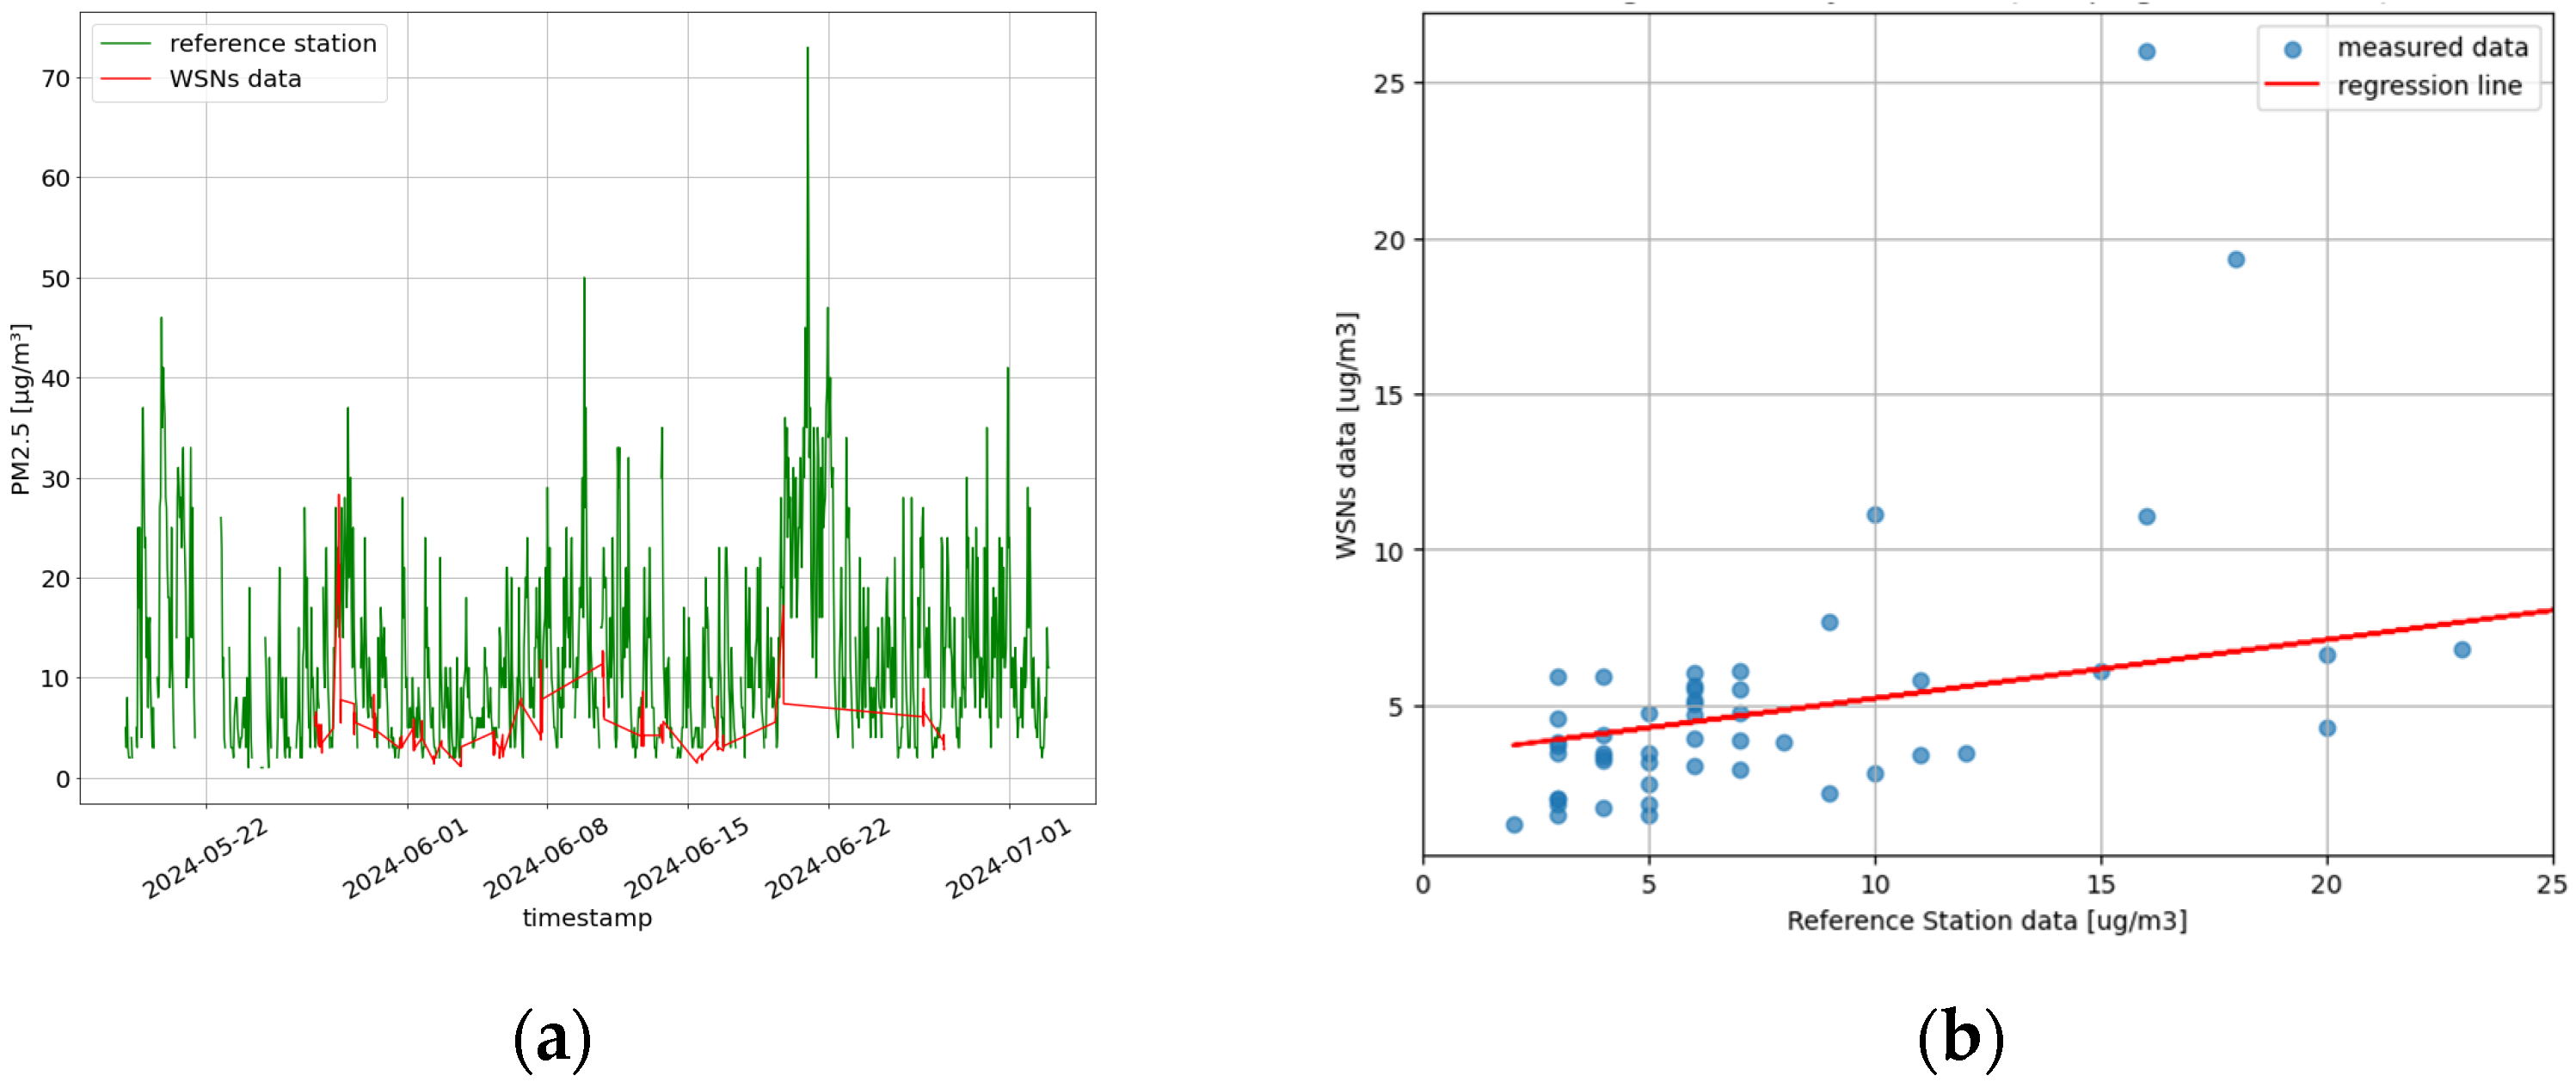
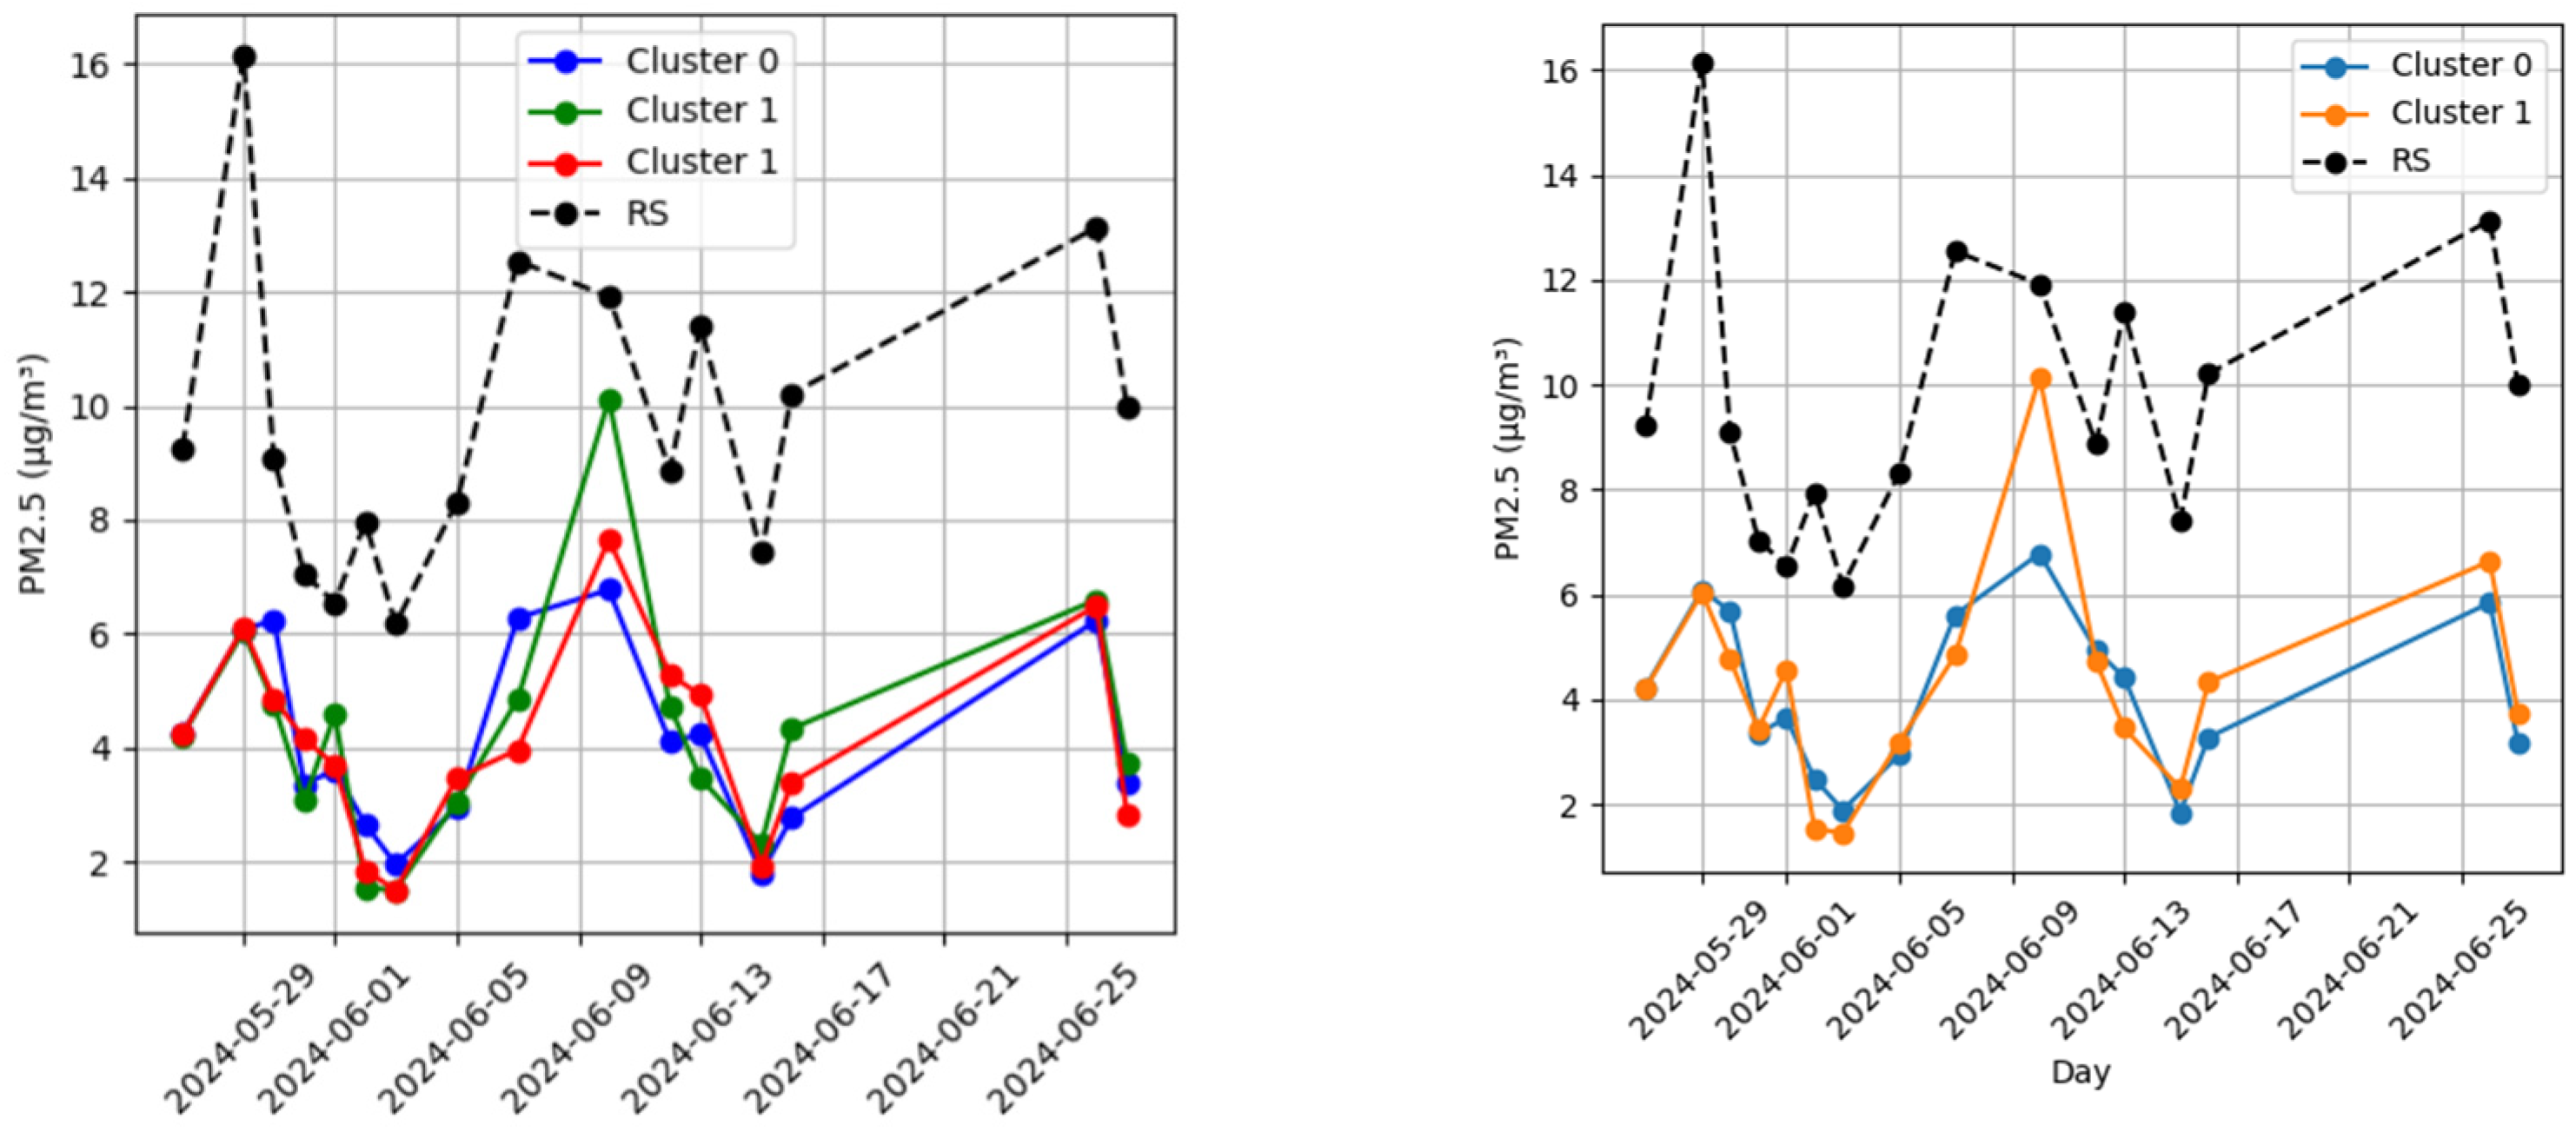
For each cluster, we computed the daily mean of the measurements and compared it with the daily mean from the reference station, calculating the associated relative error. The comparison between the cluster measurements and reference station data revealed a correlation coefficient (
r) of 0.75 and 0.63 for clusters 0 and 1, respectively, for the case of K = 2. For K = 3, the
r was 0.74, 0.63, and 0.68 for K = 0, 1, and 2, respectively. Despite these differences, the high correlation between cluster measurements and the reference station suggests that the data can be considered qualitatively reliable (
Figure 12).
From a measurement discrepancy perspective, we analyzed the mean percentage errors for K = 2 and K = 3, computed against the data collected from the RSs (
Table 6).
For the Ancona pilot, CS measurements taken farther from the reference station were compared to understand whether they remained meaningful. For this purpose, the GIS coordinates of each cluster centroid were considered and, for each measurement day, the distance between the centroid and the reference station was computed.
Table 7 reports the correlation coefficient
r between the relative error for each day, and the average distance from the RS.
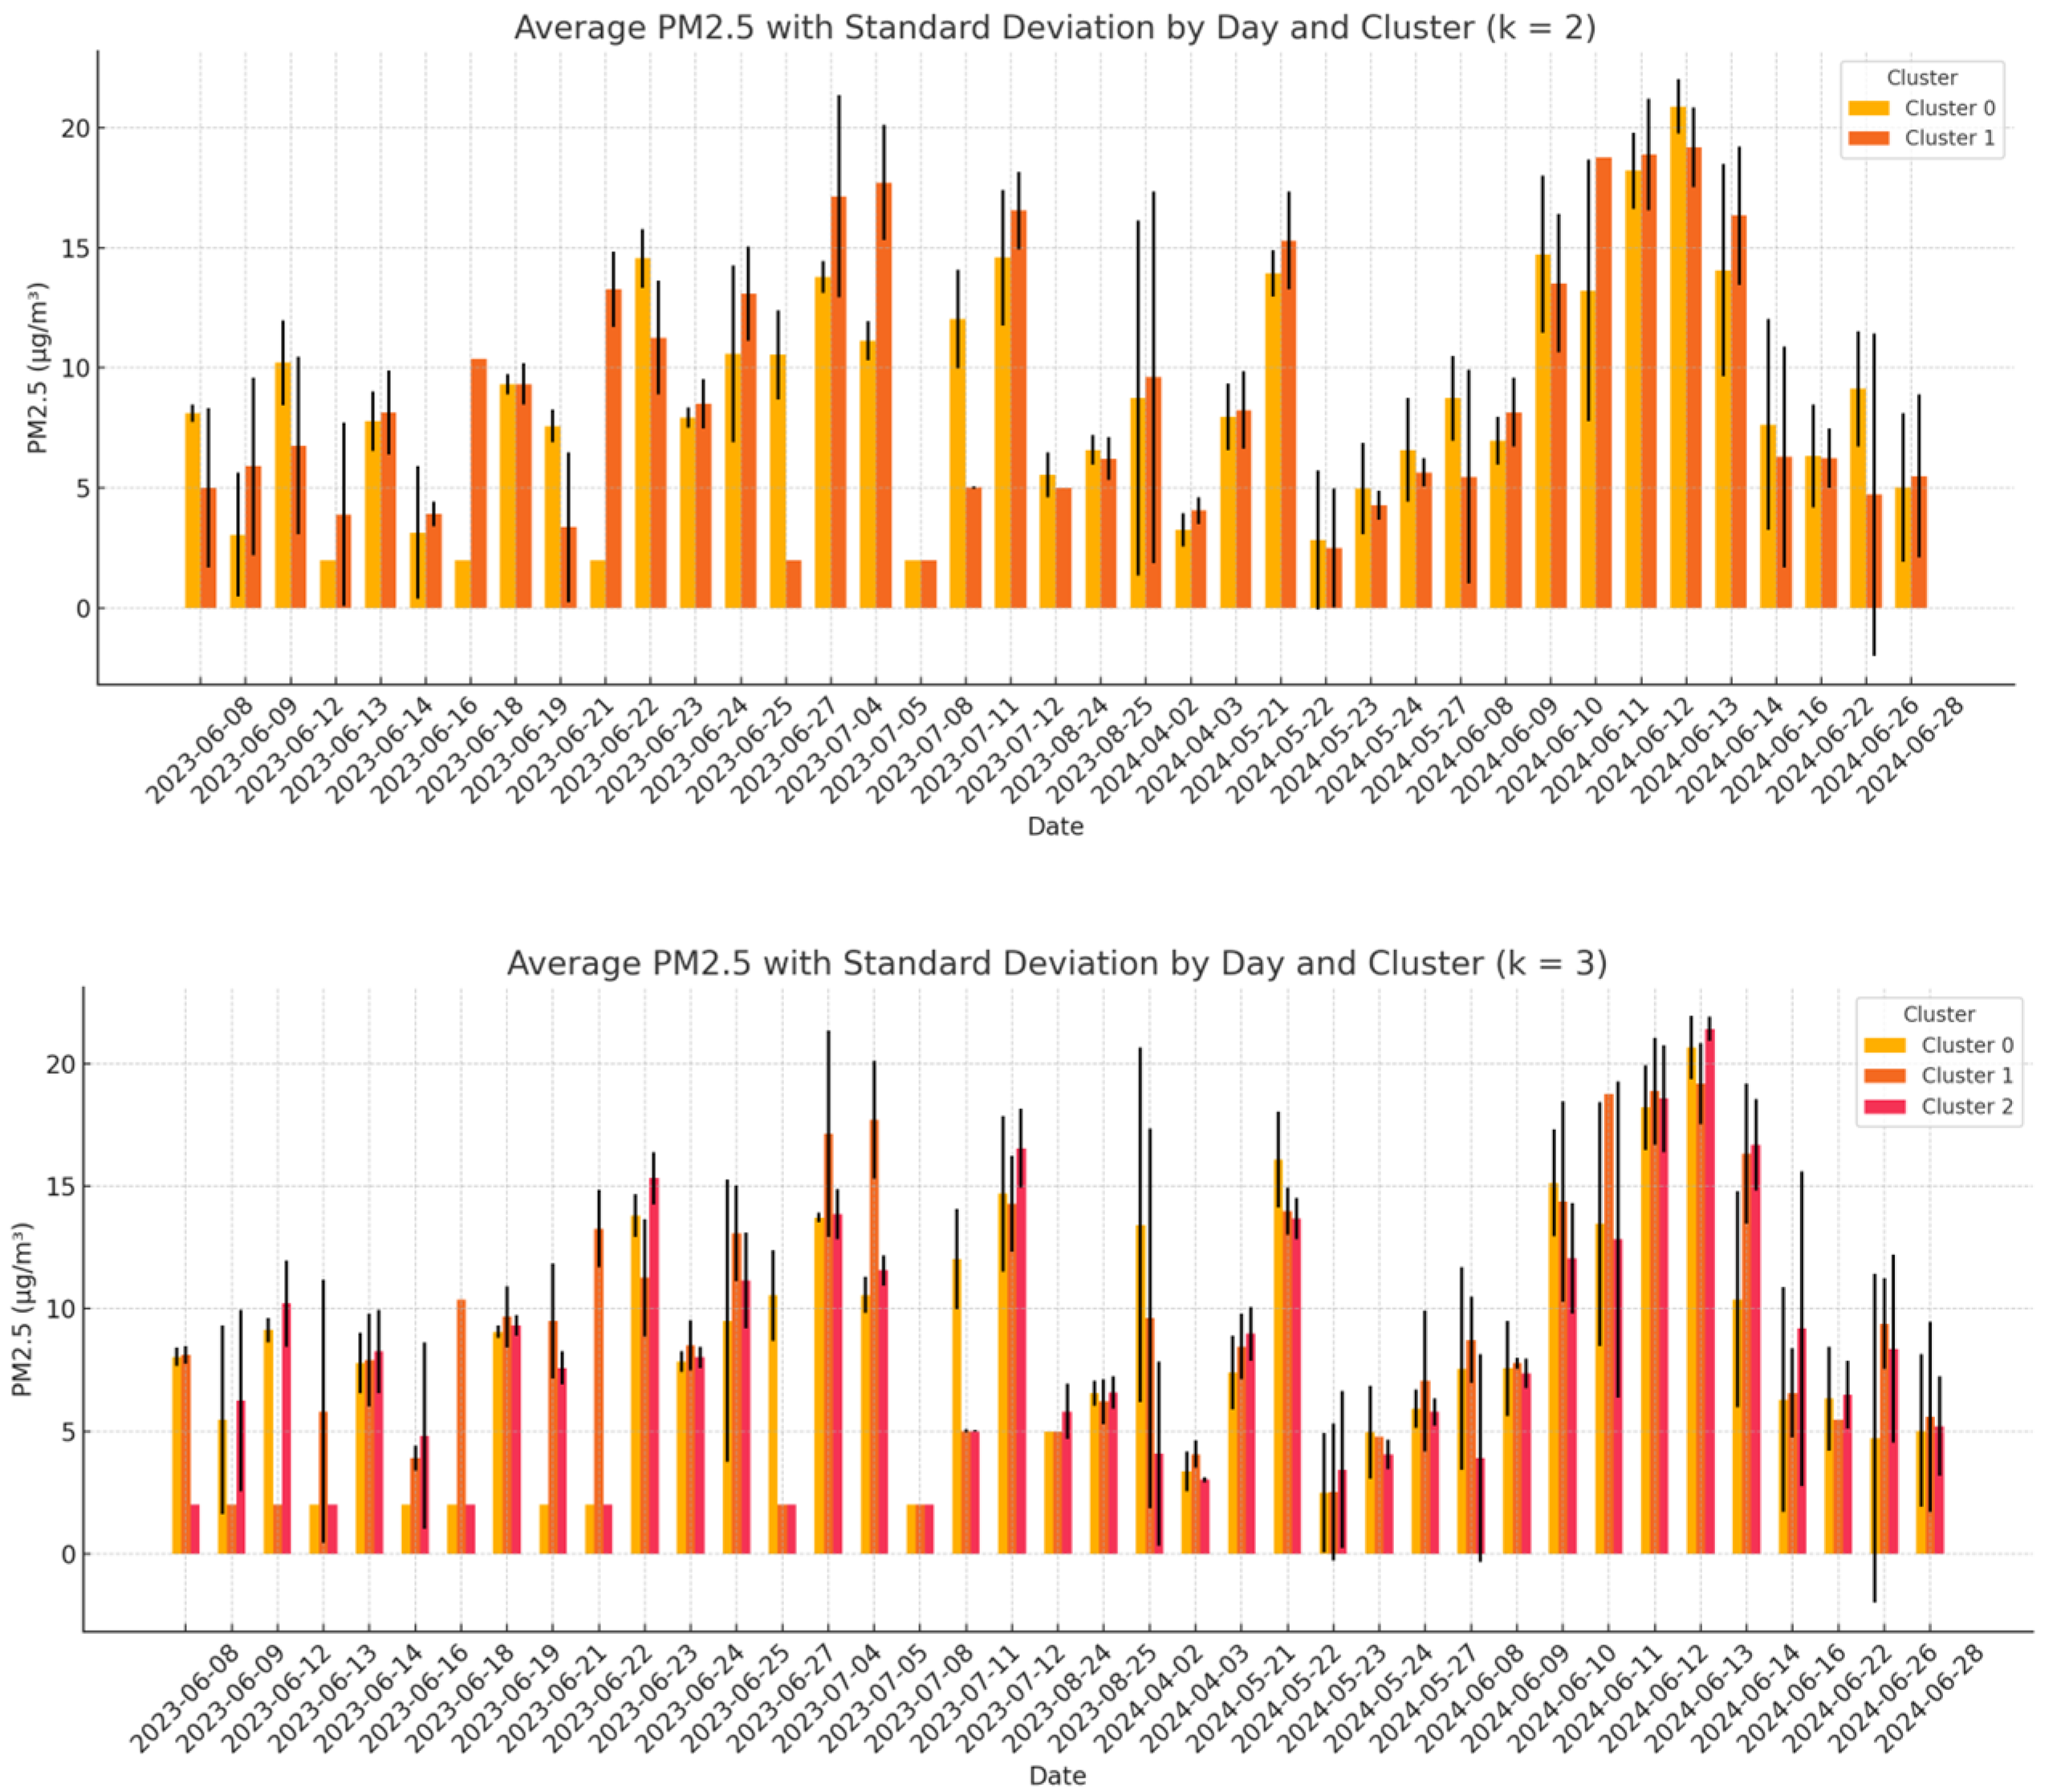
As previously mentioned, in this analysis, a comparison among data collected from the WSNs was conducted, in order to analyze the variability in these data. As a first step, the daily clustering approach was applied using K = 2 and K = 3. For each clustering configuration, the mean PM2.5 concentration and the data dispersion (expressed as the standard deviation) were computed. The coefficient of variation (CV) was then calculated for each cluster, and the results were averaged across all days. Moreover, the analysis aimed to assess the internal consistency of the measurements and to determine whether closely spaced sensors tend to report similar values. A low CV would suggest homogeneous readings within a cluster, supporting the reliability of the data. Conversely, a high CV may indicate local anomalies, sensor instability, or contextual environmental differences, all of which may require further investigation or validation.
Figure 13 illustrates the distribution of the average PM
2.5 concentrations for each cluster on each day, along with the associated dispersion, highlighting both the temporal and spatial variability.
Table 8 summarizes the overall results, showing that, for K = 2, the standard deviation averaged 5.9 ± 6.9 µg/m
3 with a mean CV of 0.50 ± 0.40, while for K = 3, slightly lower values were observed (5.8 ± 7.5 µg/m
3 and CV = 0.5 ± 0.4). These results suggest that increasing the number of clusters may slightly reduce the internal dispersion, potentially improving the spatial resolution of the analysis.
Similarly, the analysis was conducted in Zaragoza.
Table 9 summarizes the overall results, showing that, for K = 2, the standard deviation averaged 2.3 ± 1.6 µg/m
3 with a mean CV of 0.30 ± 0.30, while for K = 3, slightly lower values were observed (2.1 ± 1.7 µg/m
3 and CV = 0.28 ± 0.30). Also, in this case, increasing the number of clusters reduced the internal dispersion, potentially improving the spatial resolution of the analysis.
Figure 14 illustrates the distribution of the average PM
2.5 concentrations for each cluster on each day, along with the associated dispersion, highlighting both the temporal and spatial variability.
4.3. Impact Assessment and KPIs
This section examines the impact of the SOCIO-BEE solution and measurement campaigns from multiple perspectives. It analyses age, gender, role, education level, digital proficiency, and employment status across the pilots. The data presented include all citizens who responded to PRE- or POST-campaign surveys, or both, in each city.
Figure 8 illustrates the gender distribution of the participants. Most users chose to specify their gender, identifying as either male or female. Zaragoza and Maroussi showed a relatively balanced distribution between men and women, whereas Ancona had a higher proportion of male participants. Notice that in the case of Zaragoza, although measurements in the name of only 79 citizens were collected, those measurements were often performed by couples or trios of volunteers. This explains the total number of volunteers specified for Zaragoza, i.e., 233.
Figure 9 illustrates the age distribution of the participants, showing that younger individuals were predominant in the Zaragoza pilot, middle-aged users were predominant in Maroussi, and older participants in Ancona. Additionally, due to the fact that complete classes of secondary education students were involved in Zaragoza, this pilot had a significantly higher number of participants compared to the others (
Figure 15a,b).
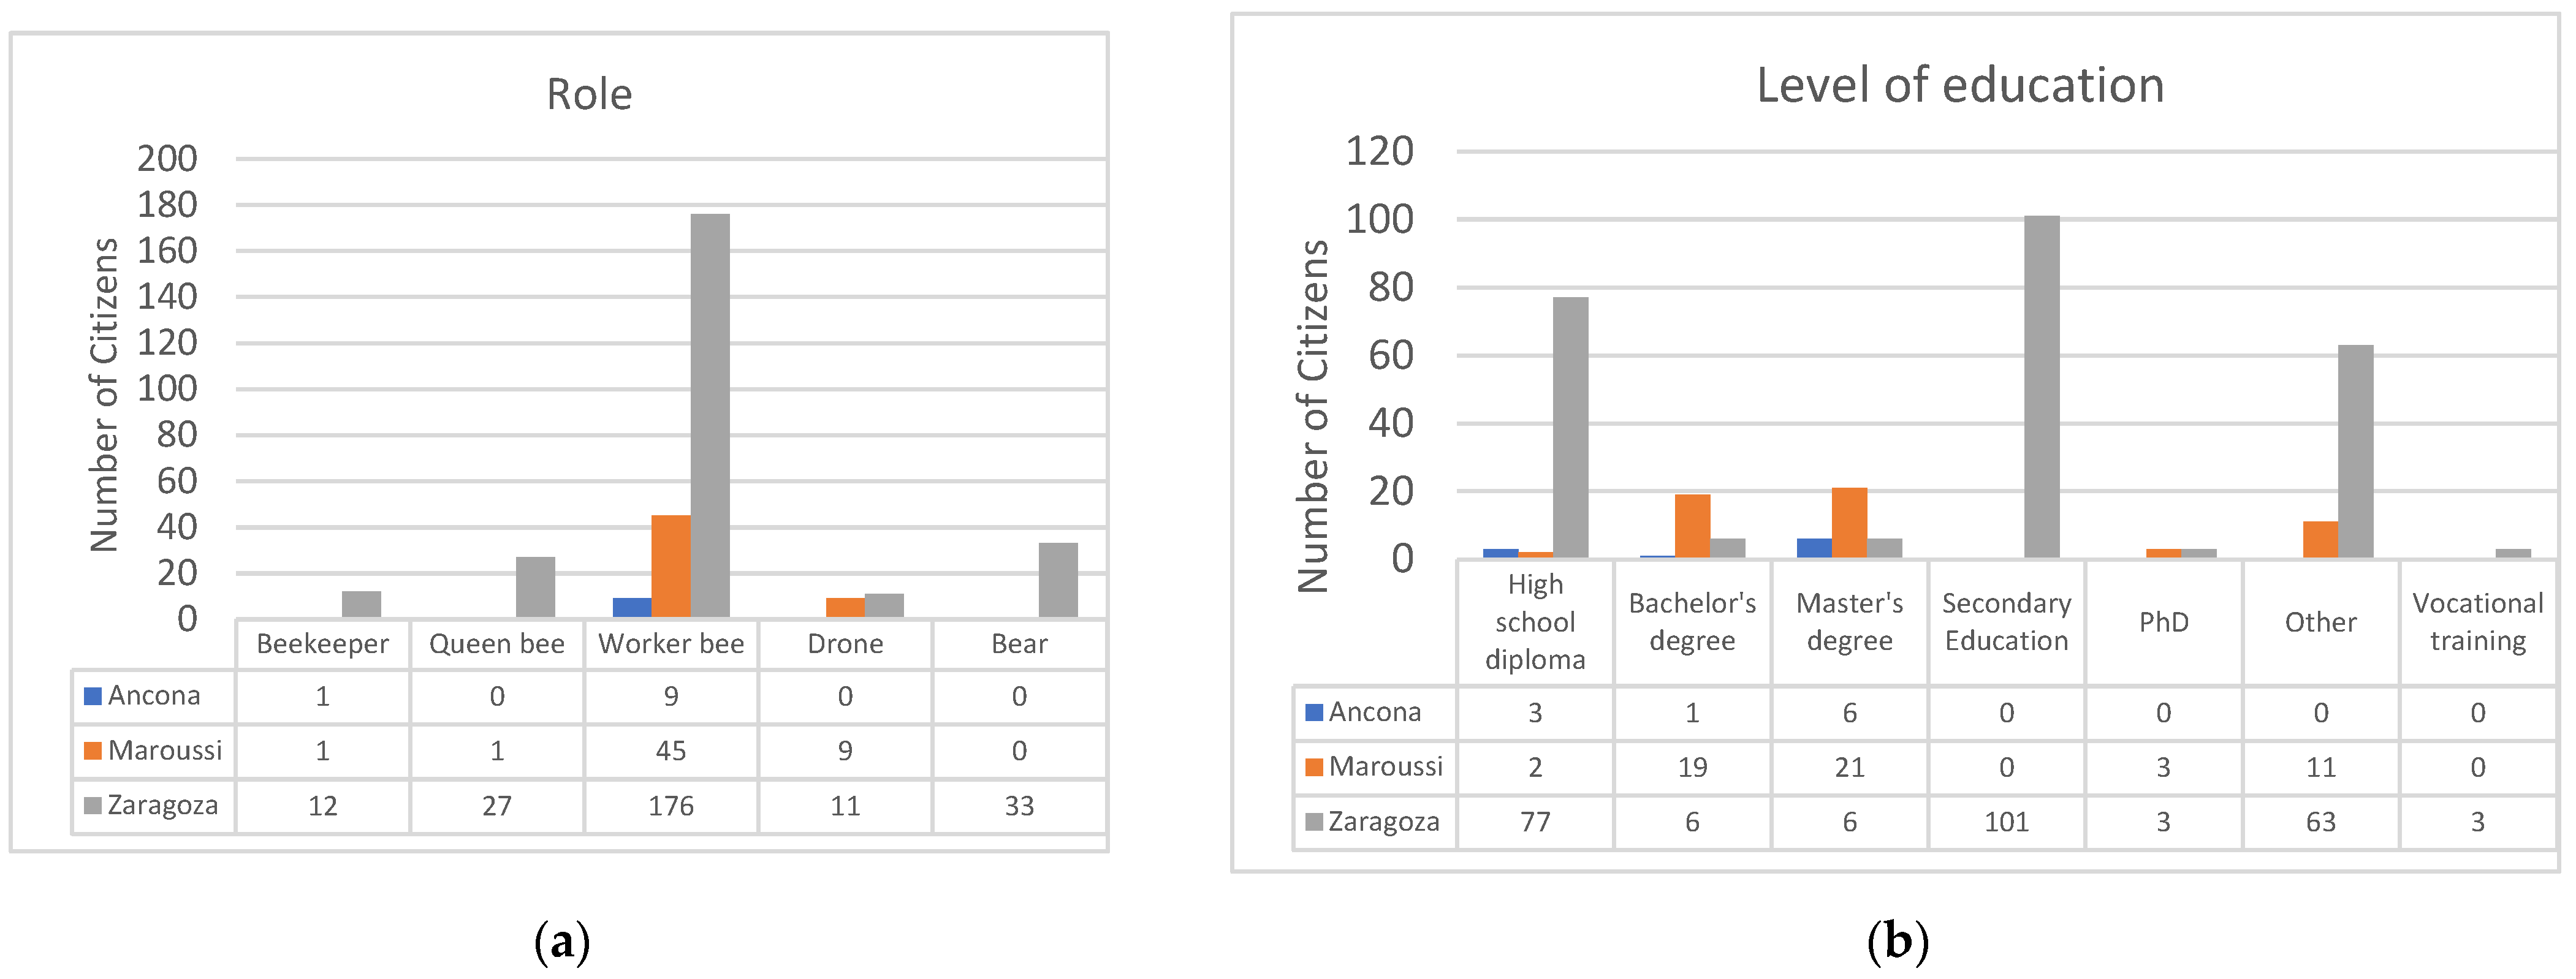
Regarding the role of citizens (
Figure 16a), the “working bee” is the predominant role, as intended, since it represents the main type of members of the community of practice who collect and reflect upon the collected data, while the other roles are less represented. In terms of education level (
Figure 16b), Maroussi had a higher proportion of citizens with a bachelor’s or master’s degree. In Zaragoza, most participants had a secondary education or a high school diploma. In Ancona, the majority held either a master’s degree or a high school diploma.
Figure 17a illustrates the citizens’ proficiency levels with digital tools. In Zaragoza, most participants had an intermediate or advanced level of proficiency, since they were digital native youngsters. In Maroussi, the majority possessed an advanced level, as they were middle aged people, while in Ancona, the users were evenly divided between advanced and intermediate proficiency levels. They were elderly people with a middle–high educational level.
Regarding work status (see
Figure 17b), most of the volunteers in Zaragoza were students, while in Maroussi, the majority were employed people. In Ancona, most participants were retired, which aligns with the demographic analysis of the age distribution of the users.
This section discusses the KPIs that were designed to evaluate the extent to which SOCIO-BEE democratizes CS experiments, particularly those related to air pollution. To assess whether SOCIO-BEE enhances the co-design and co-delivery of evidence-gathering CS experiments that support decision-making in air quality, data were collected from tool logs, databases, and responses from a set of Google Forms surveys created for the project. Below, the most significant KPIs used to inform evaluation dimensions are analyzed.
Only responses from users who completed both the pre- and post-surveys are considered; therefore, 7 citizens in Ancona, 50 in Maroussi, and 103 in Zaragoza were included in this analysis.
The KPIs can be divided into two types: (1) those that measure an increase in favorable user perception towards Citizen Science by comparing pre- and post-intervention dimensions, and (2) those evaluated solely based on post-intervention data. The first category includes metrics such as the increase in technology acceptance, heightened interest or engagement in science, the percentage of EU citizens who feel more aware of air pollution issues after participating in a SOCIO-BEE project, and user behavior changes driven by SOCIO-BEE. The second category includes KPIs that assess aspects such as user satisfaction with SOCIO-BEE (AcadeMe), tool accessibility, inclusiveness, and perceived usability. All values are calculated using the mean and standard deviation (SD) of user responses to the survey questions. Responses were measured on a Likert scale from 1 to 5, where 1 represents ‘strongly disagree’ and 5 indicates ‘strongly agree’.
In the case of the first category of KPIs, the means and SD for both the pre- and post-intervention questionnaire answers, as well as the increase in mean values, were calculated. These values are shown in
Table 10,
Table 11 and
Table 12, for the Ancona, Maroussi, and Zaragoza pilots, respectively.
In the Ancona pilot, some results (acceptance and air pollution awareness) showed a decline in the post-intervention values. This can be attributed to the average age of participants who had limited technological literacy and found the technology that they were offered not entirely usable. Consequently, the decrease in the technology acceptance rate KPI is understandable. Similarly, the fact that understanding the importance of air quality and other factors is not entirely straightforward may also explain the reduction in the percentage of citizens who felt an increased awareness and knowledge about air pollution. The respondents learned about air pollution, but they also realized that there is still a lot more to learn on this matter. Notably, all the average values obtained for the indicators considered in the case of Ancona were higher than 3.69 over 5.0, i.e., over 73% positive perception, which can be regarded as positive, since volunteers felt that their acceptance rate for SOCIO-BEE’s technology and approach, their engagement in CS, and their knowledge about air pollution had increased and their behavior had changed positively.
The Maroussi pilot demonstrated a positive increase in all measured KPIs. Since this pilot involved middle-aged participants with a high level of technological acquaintance and high educational level, they were able to comprehend concepts about air quality and use the technology efficiently. Therefore, the values obtained indicate their positive opinion about SOCIO-BEE in terms of its technology and approach, how engagement is promoted by the project, their awareness about air quality, and their positive influence regarding practices that limit air pollution.
In the Zaragoza pilot, discrepancies were observed in the post-intervention results, with all examined KPIs showing a decrease, exhibiting the biggest decrease of 0.33 out of 5 points. This could be attributed to the involvement of younger participants who are experienced with modern mobile apps and are very sensitive to the usability and user experience of the apps they use on a daily basis. Other factors such as the short duration of the campaigns and technical issues encountered during the interventions could have also affected these results. Remember that the campaigns in Zaragoza were conducted in schools, and each session lasted no more than an hour. Therefore, comparing pre- and post-intervention evaluations in this case may not be highly significant, given the limited interaction period of the citizens with the system. For the second category of KPIs, comprising satisfaction, accessibility, inclusiveness, and usability, the mean and standard deviation were also calculated, but in this case, they were calculated exclusively based on the post-survey responses. The results for each measured value are presented in
Table 13. All these values confirm that the measured factors—acceptability, satisfaction, inclusion, and usability—were positively rated across the three population groups corresponding to the three pilots. These findings support the core hypothesis of this paper, demonstrating that the SOCIO-BEE technology and its approach to organizing, executing, and evaluating citizen science (CS) campaigns effectively meet key criteria that are necessary for widespread adoption. Specifically, the solution achieved an average satisfaction agreement of over 70%, accessibility of over 76%, inclusiveness of over 73%, and usability above 60%. These strong results across fundamental evaluation dimensions indicate that SOCIO-BEE is making significant progress toward the democratization of CS campaigns. The consistently high levels of agreement across these multiple evaluation dimensions affirm the platform’s potential to engage a broad and diverse range of participants in meaningful scientific contribution.
4.4. Citizen Science and Policy Integration: Lessons from SOCIO-BEE
One of the key challenges in citizen science (CS) initiatives is ensuring that citizen-generated data are not only collected but also meaningfully integrated into policymaking and urban planning. SOCIO-BEE has addressed this challenge by implementing a structured participatory framework across three European pilot cities—Ancona, Maroussi, and Zaragoza. The project demonstrated that CS could bridge the gap between community engagement and policy impact by aligning citizen-collected air quality data with municipal decision-making processes.
The Ancona pilot exemplified how CS can inform targeted public health and urban mobility policies. The project engaged senior citizens in air quality monitoring, revealing pollution hotspots in high-traffic areas like the city center and port. The findings underscored the need for pedestrian-friendly zones and alternative traffic routes to minimize exposure to harmful pollutants. The Municipality of Ancona recognized the value of these data and proposed the integration of CS-driven insights into future urban planning and social assistance strategies.
In Maroussi, the project demonstrated the feasibility of integrating citizen-generated air quality data into municipal monitoring frameworks. By engaging commuters and deploying wearable sensors on public transport, SOCIO-BEE provided real-time pollution data that complemented traditional monitoring stations. The municipal government actively participated in data validation efforts and acknowledged the potential for CS to enhance evidence-based traffic management policies. Additionally, high-profile local policymakers supported the initiative, strengthening its legitimacy and potential for policy uptake.
The Zaragoza pilot showcased the long-term potential of CS by embedding air quality monitoring into local education systems. Engaging students in scientific data collection not only raised environmental awareness but also positioned CS as a continuous, scalable policy tool. The Municipality of Zaragoza integrated the project’s findings into its broader climate neutrality strategy and encouraged further citizen participation in air quality governance.
The results of the SOCIO-BEE projects highlight that the successful policy integration of CS data depends on three critical factors:
Validation and standardization—ensuring that citizen-collected data meet scientific and regulatory standards to be considered in official decision-making;
Institutional collaboration—establishing formal partnerships between CS initiatives and municipal authorities to create structured pathways for policy adoption;
Community engagement—building long-term citizen involvement through education, awareness campaigns, and participatory urban planning.
By addressing these factors, SOCIO-BEE has established a replicable model for embedding citizen-generated environmental data into local and national policymaking. Future efforts should focus on scaling this approach, fostering cross-border collaborations, and further integrating CS methodologies into formal environmental governance structures.


 ,
, 


