Segment Anything Model (SAM) and Medical SAM (MedSAM) for Lumbar Spine MRI

 and
and
Abstract
1. Introduction
2. Materials and Methods
| I = imread('input image'); imageSize = size(imtemp); model = SegmentAnythingModel; % model = medicalSegmentAnythingModel; % for MedSAM embeddings = extractEmbeddings(model,I); points = 'coordinates for point prompt for IVD or VB' backgroundPoints = 'coordinate for background point' box = 'coordinates for a bounding box prompt for IVD or VB' % using point input segmentation = segmentObjectsFromEmbeddings(model,embeddings,imageSize, ... ForegroundPoints=points,BackgroundPoints=backgroundPoints); % using box input segmentation = segmentObjectsFromEmbeddings(model,embeddings,... imageSize,BoundingBox=box); |

3. Results
4. Discussion
5. Conclusions
Author Contributions
Funding
Institutional Review Board Statement
Informed Consent Statement
Data Availability Statement
Acknowledgments
Conflicts of Interest
References
- Freburger, J.K.; Holmes, G.M.; Agans, R.P.; Jackman, A.M.; Darter, J.D.; Wallace, A.S.; Castel, L.D.; Kalsbeek, W.D.; Carey, T.S. The rising prevalence of chronic low back pain. Arch. Intern. Med. 2009, 169, 251–258. [Google Scholar] [CrossRef]
- An, H.S.; Anderson, P.A.; Haughton, V.M.; Iatridis, J.C.; Kang, J.D.; Lotz, J.C.; Natarajan, R.N.; Oegema, T.R., Jr.; Roughley, P.; Setton, L.A.; et al. Introduction: Disc degeneration: Summary. Spine 2004, 29, 2677–2678. [Google Scholar] [CrossRef]
- Abu-Ghanem, S.; Ohana, N.; Abu-Ghanem, Y.; Kittani, M.; Shelef, I. Acute schmorl node in dorsal spine: An unusual cause of a sudden onset of severe back pain in a young female. Asian Spine J. 2013, 7, 131–135. [Google Scholar] [CrossRef]
- Natalia, F.; Sudirman, S.; Ruslim, D.; Al-Kafri, A. Lumbar spine MRI annotation with intervertebral disc height and Pfirrmann grade predictions. PLoS ONE 2024, 19, e0302067. [Google Scholar] [CrossRef] [PubMed]
- Lund, T.; Schlenzka, D.; Lohman, M.; Ristolainen, L.; Kautiainen, H.; Klemetti, E.; Osterman, K. The intervertebral disc during growth: Signal intensity changes on magnetic resonance imaging and their relevance to low back pain. PLoS ONE 2022, 17, e0275315. [Google Scholar] [CrossRef] [PubMed]
- Takashima, H.; Yoshimoto, M.; Ogon, I.; Takebayashi, T.; Imamura, R.; Akatsuka, Y.; Yamashita, T. T1rho, T2, and T2* relaxation time based on grading of intervertebral disc degeneration. Acta Radiol. 2023, 64, 1116–1121. [Google Scholar] [CrossRef]
- Yeung, K.H.; Man, G.C.W.; Deng, M.; Lam, T.P.; Cheng, J.C.Y.; Chan, K.C.; Chu, W.C.W. Morphological changes of Intervertebral Disc detectable by T2-weighted MRI and its correlation with curve severity in Adolescent Idiopathic Scoliosis. BMC Musculoskelet. Disord. 2022, 23, 655. [Google Scholar] [CrossRef]
- Kamei, N.; Nakamae, T.; Nakanishi, K.; Tamura, T.; Tsuchikawa, Y.; Morisako, T.; Harada, T.; Maruyama, T.; Adachi, N. Evaluation of intervertebral disc degeneration using T2 signal ratio on magnetic resonance imaging. Eur. J. Radiol. 2022, 152, 110358. [Google Scholar] [CrossRef] [PubMed]
- Yeung, K.H.; Man, G.; Hung, A.; Lam, T.P.; Cheng, J.; Chu, W. Morphological changes of intervertebral disc in relation with curve severity of patients with Adolescent Idiopathic Scoliosis—A T2-weighted MRI study. Stud. Health Technol. Inform. 2021, 280, 37–39. [Google Scholar] [CrossRef]
- Belavy, D.L.; Owen, P.J.; Armbrecht, G.; Bansmann, M.; Zange, J.; Ling, Y.; Pohle-Frohlich, R.; Felsenberg, D. Quantitative assessment of the lumbar intervertebral disc via T2 shows excellent long-term reliability. PLoS ONE 2021, 16, e0249855. [Google Scholar] [CrossRef]
- Haughton, V. Imaging intervertebral disc degeneration. J. Bone Jt. Surg. Am. 2006, 88 (Suppl. 2), 15–20. [Google Scholar] [PubMed]
- Pfirrmann, C.W.; Metzdorf, A.; Zanetti, M.; Hodler, J.; Boos, N. Magnetic resonance classification of lumbar intervertebral disc degeneration. Spine 2001, 26, 1873–1878. [Google Scholar] [CrossRef]
- Joe, E.; Lee, J.W.; Park, K.W.; Yeom, J.S.; Lee, E.; Lee, G.Y.; Kang, H.S. Herniation of cartilaginous endplates in the lumbar spine: MRI findings. AJR Am. J. Roentgenol. 2015, 204, 1075–1081. [Google Scholar] [CrossRef]
- Marinelli, N.L.; Haughton, V.M.; Anderson, P.A. T2 relaxation times correlated with stage of lumbar intervertebral disk degeneration and patient age. AJNR Am. J. Neuroradiol. 2010, 31, 1278–1282. [Google Scholar] [CrossRef]
- Trattnig, S.; Stelzeneder, D.; Goed, S.; Reissegger, M.; Mamisch, T.C.; Paternostro-Sluga, T.; Weber, M.; Szomolanyi, P.; Welsch, G.H. Lumbar intervertebral disc abnormalities: Comparison of quantitative T2 mapping with conventional MR at 3.0 T. Eur. Radiol. 2010, 20, 2715–2722. [Google Scholar] [CrossRef]
- Pfirrmann, C.W.; Metzdorf, A.; Elfering, A.; Hodler, J.; Boos, N. Effect of aging and degeneration on disc volume and shape: A quantitative study in asymptomatic volunteers. J. Orthop. Res. 2006, 24, 1086–1094. [Google Scholar] [CrossRef] [PubMed]
- Klein, J.A.; Hickey, D.S.; Hukins, D.W. Radial bulging of the annulus fibrosus during compression of the intervertebral disc. J. Biomech. 1983, 16, 211–217. [Google Scholar] [CrossRef]
- Castoldi, N.M.; O’Rourke, D.; Antico, M.; Sansalone, V.; Gregory, L.; Pivonka, P. Assessment of age-dependent sexual dimorphism in paediatric vertebral size and density using a statistical shape and statistical appearance modelling approach. Bone 2024, 189, 117251. [Google Scholar] [CrossRef] [PubMed]
- Otsu, N. A threshold selection method from gray-level histograms. IEEE Trans. Sys. Man. Cyber. 1979, 9, 62–66. [Google Scholar] [CrossRef]
- Schneiderman, H.; Kanade, T. A histogram-based method for detection of faces and cars. In Proceedings of the 2000 International Conference on Image Processing (Cat. No.00CH37101), Vancouver, BC, Canada, 10–13 September 2000; Volume 503, pp. 504–507. [Google Scholar]
- Zhu, S.C.; Lee, T.S.; Yuille, A.L. Region competition: Unifying snakes, region growing, energy/Bayes/MDL for multi-band image segmentation. In Proceedings of the IEEE International Conference on Computer Vision, Cambridge, MA, USA, 20–23 June 1995; pp. 416–423. [Google Scholar]
- Pohle, R.; Toennies, K. Segmentation of Medical Images Using Adaptive Region Growing; SPIE: Pune, MA, USA, 2001; Volume 4322. [Google Scholar]
- Biratu, E.S.; Schwenker, F.; Debelee, T.G.; Kebede, S.R.; Negera, W.G.; Molla, H.T. Enhanced Region Growing for Brain Tumor MR Image Segmentation. J. Imaging 2021, 7, 22. [Google Scholar] [CrossRef]
- Long, J.; Shelhamer, E.; Darrell, T. Fully convolutional networks for semantic segmentation. In Proceedings of the IEEE Conference on Computer Vision and Pattern Recognition, Boston, MA, USA, 7–12 June 2015; pp. 3431–3440. [Google Scholar]
- Ronneberger, O.; Fischer, P.; Brox, T. U-Net: Convolutional Networks for Biomedical Image Segmentation; Springer: Cham, Switzerland, 2015; pp. 234–241. [Google Scholar]
- Chen, L.-C.; Zhu, Y.; Papandreou, G.; Schroff, F.; Adam, H. Encoder-decorder with atrous separable convolution for semantic image segmentation. arXiv 2018, arXiv:1802.02611. [Google Scholar]
- Kim, S.; Bae, W.C.; Masuda, K.; Chung, C.B.; Hwang, D. Fine-Grain Segmentation of the Intervertebral Discs from MR Spine Images Using Deep Convolutional Neural Networks: BSU-Net. Appl. Sci. 2018, 8, 1656. [Google Scholar] [CrossRef]
- Baur, D.; Bieck, R.; Berger, J.; Schofer, P.; Stelzner, T.; Neumann, J.; Neumuth, T.; Heyde, C.E.; Voelker, A. Automated Three-Dimensional Imaging and Pfirrmann Classification of Intervertebral Disc Using a Graphical Neural Network in Sagittal Magnetic Resonance Imaging of the Lumbar Spine. J. Imaging Inform. Med. 2024, 38, 979–987. [Google Scholar] [CrossRef] [PubMed]
- Wang, M.; Su, Z.; Liu, Z.; Chen, T.; Cui, Z.; Li, S.; Pang, S.; Lu, H. Deep Learning-Based Automated Magnetic Resonance Image Segmentation of the Lumbar Structure and Its Adjacent Structures at the L4/5 Level. Bioengineering 2023, 10, 963. [Google Scholar] [CrossRef]
- Niemeyer, F.; Zanker, A.; Jonas, R.; Tao, Y.; Galbusera, F.; Wilke, H.J. An externally validated deep learning model for the accurate segmentation of the lumbar paravertebral muscles. Eur. Spine J. 2022, 31, 2156–2164. [Google Scholar] [CrossRef]
- Hess, M.; Allaire, B.; Gao, K.T.; Tibrewala, R.; Inamdar, G.; Bharadwaj, U.; Chin, C.; Pedoia, V.; Bouxsein, M.; Anderson, D.; et al. Deep Learning for Multi-Tissue Segmentation and Fully Automatic Personalized Biomechanical Models from BACPAC Clinical Lumbar Spine MRI. Pain. Med. 2023, 24, S139–S148. [Google Scholar] [CrossRef] [PubMed]
- Carl, M.; Lall, K.; Pai, D.; Chang, E.Y.; Statum, S.; Brau, A.; Chung, C.B.; Fung, M.; Bae, W.C. Shoulder bone segmentation with DeepLab and U-Net. Osteology 2024, 4, 98–110. [Google Scholar] [CrossRef]
- Huang, J.; Shen, H.; Wu, J.; Hu, X.; Zhu, Z.; Lv, X.; Liu, Y.; Wang, Y. Spine Explorer: A deep learning based fully automated program for efficient and reliable quantifications of the vertebrae and discs on sagittal lumbar spine MR images. Spine J. 2020, 20, 590–599. [Google Scholar] [CrossRef]
- Ibtehaz, N.; Rahman, M.S. MultiResUNet: Rethinking the U-Net architecture for multimodal biomedical image segmentation. Neural Netw. 2020, 121, 74–87. [Google Scholar] [CrossRef]
- Cheng, Y.K.; Lin, C.L.; Huang, Y.C.; Lin, G.S.; Lian, Z.Y.; Chuang, C.H. Accurate Intervertebral Disc Segmentation Approach Based on Deep Learning. Diagnostics 2024, 14, 191. [Google Scholar] [CrossRef]
- Zunair, H.; Ben Hamza, A. Sharp U-Net: Depthwise convolutional network for biomedical image segmentation. Comput. Biol. Med. 2021, 136, 104699. [Google Scholar] [CrossRef] [PubMed]
- Isensee, F.; Jaeger, P.F.; Kohl, S.A.A.; Petersen, J.; Maier-Hein, K.H. nnU-Net: A self-configuring method for deep learning-based biomedical image segmentation. Nat. Methods 2021, 18, 203–211. [Google Scholar] [CrossRef]
- Kirillov, A.; Mintun, E.; Ravi, N.; Mao, H.; Rolland, C.; Gustafson, L.; Xiao, T.; Whitehead, S.; Berg, A.C.; Lo, W.-Y.; et al. Segment Anything. In Proceedings of the 2023 IEEE/CVF International Conference on Computer Vision (ICCV), Paris, France, 1–6 October 2023; pp. 3992–4003. [Google Scholar] [CrossRef]
- Ma, J.; He, Y.; Li, F.; Han, L.; You, C.; Wang, B. Segment anything in medical images. Nat. Commun. 2024, 15, 654. [Google Scholar] [CrossRef] [PubMed]
- Carion, N.; Massa, F.; Synnaeve, G.; Usunier, N.; Kirillov, A.; Zagoruyko, S. End-to-end object detection with transformers. In Proceedings of the European Conference on Computer Vision, Glasgow, UK, 23–28 August 2020; pp. 213–229. [Google Scholar]
- Dosovitskiy, A. An image is worth 16x16 words: Transformers for image recognition at scale. arXiv 2020, arXiv:2010.11929. [Google Scholar]
- Finkenstaedt, T.; Siriwananrangsun, P.; Masuda, K.; Bydder, G.M.; Chen, K.C.; Bae, W.C. Ultrashort time-to-echo MR morphology of cartilaginous endplate correlates with disc degeneration in the lumbar spine. Eur. Spine J. 2023, 32, 2358–2367. [Google Scholar] [CrossRef]
- Sollmann, N.; Fields, A.J.; O’Neill, C.; Nardo, L.; Majumdar, S.; Chin, C.T.; Tosun, D.; Han, M.; Vu, A.T.; Ozhinsky, E.; et al. Magnetic Resonance Imaging of the Lumbar Spine: Recommendations for Acquisition and Image Evaluation from the BACPAC Spine Imaging Working Group. Pain. Med. 2023, 24, S81–S94. [Google Scholar] [CrossRef]
- Schneider, C.A.; Rasband, W.S.; Eliceiri, K.W. NIH Image to ImageJ: 25 years of image analysis. Nat. Methods 2012, 9, 671–675. [Google Scholar] [CrossRef] [PubMed]
- Moreno, R.; Koppal, S.; de Muinck, E. Robust estimation of distance between sets of points. Pattern Recognit. Lett. 2013, 34, 2192–2198. [Google Scholar] [CrossRef]
- Mazurowski, M.A.; Dong, H.; Gu, H.; Yang, J.; Konz, N.; Zhang, Y. Segment anything model for medical image analysis: An experimental study. Med. Image Anal. 2023, 89, 102918. [Google Scholar] [CrossRef]
- Roy, S.; Wald, T.; Koehler, G.; Rokuss, M.R.; Disch, N.; Holzschuh, J.; Zimmerer, D.; Maier-Hein, K.H. Sam. md: Zero-shot medical image segmentation capabilities of the segment anything model. arXiv 2023, arXiv:2304.05396. [Google Scholar]
- He, S.; Bao, R.; Li, J.; Stout, J.; Bjornerud, A.; Grant, P.E.; Ou, Y. Computer-vision benchmark segment-anything model (sam) in medical images: Accuracy in 12 datasets. arXiv 2023, arXiv:2304.09324. [Google Scholar]
- Soydan, Z.; Bayramoglu, E.; Karasu, R.; Sayin, I.; Salturk, S.; Uvet, H. An Automatized Deep Segmentation and Classification Model for Lumbar Disk Degeneration and Clarification of Its Impact on Clinical Decisions. Glob. Spine J. 2023, 15, 554–563. [Google Scholar] [CrossRef] [PubMed]
- Nazir, A.; Cheema, M.N.; Sheng, B.; Li, P.; Li, H.; Xue, G.; Qin, J.; Kim, J.; Feng, D.D. ECSU-Net: An Embedded Clustering Sliced U-Net Coupled With Fusing Strategy for Efficient Intervertebral Disc Segmentation and Classification. IEEE Trans. Image Process 2022, 31, 880–893. [Google Scholar] [CrossRef]
- Zijdenbos, A.P.; Dawant, B.M.; Margolin, R.A.; Palmer, A.C. Morphometric analysis of white matter lesions in MR images: Method and validation. IEEE Trans. Med. Imaging 1994, 13, 716–724. [Google Scholar] [CrossRef]
- Boehringer, A.S.; Sanaat, A.; Arabi, H.; Zaidi, H. An active learning approach to train a deep learning algorithm for tumor segmentation from brain MR images. Insights Imaging 2023, 14, 141. [Google Scholar] [CrossRef] [PubMed]
- Ramos, J.S.; Cazzolato, M.T.; Linares, O.C.; Maciel, J.G.; Menezes-Reis, R.; Azevedo-Marques, P.M.; Nogueira-Barbosa, M.H.; Traina Junior, C.; Traina, A.J.M. Fast and accurate 3-D spine MRI segmentation using FastCleverSeg. Magn. Reson. Imaging 2024, 109, 134–146. [Google Scholar] [CrossRef]
- Stojšić, K.; Miletić Rigo, D.; Jurković, S. Automated Vertebral Bone Quality Determination from T1-Weighted Lumbar Spine MRI Data Using a Hybrid Convolutional Neural Network–Transformer Neural Network. Appl. Sci. 2024, 14, 10343. [Google Scholar] [CrossRef]
- Gu, H.; Colglazier, R.; Dong, H.; Zhang, J.; Chen, Y.; Yildiz, Z.; Chen, Y.; Li, L.; Yang, J.; Willhite, J.; et al. SegmentAnyBone: A universal model that segments any bone at any location on MRI. Med. Image Anal. 2025, 101, 103469. [Google Scholar] [CrossRef]
- Zhao, S.; Wang, J.; Wang, X.; Wang, Y.; Zheng, H.; Chen, B.; Zeng, A.; Wei, F.; Al-Kindi, S.; Li, S. Attractive deep morphology-aware active contour network for vertebral body contour extraction with extensions to heterogeneous and semi-supervised scenarios. Med. Image Anal. 2023, 89, 102906. [Google Scholar] [CrossRef]
- Tang, Z.; Chen, B.; Zeng, A.; Liu, M.; Li, S. Progressive Deep Snake for Instance Boundary Extraction in Medical Images. Expert Syst. Appl. 2024, 249, 123590. [Google Scholar] [CrossRef]
- Qian, L.; Wang, Y.; Zhang, H.; Li, Y.; Li, S. A Sequential Geometry Reconstruction-Based Deep Learning Approach to Improve Accuracy and Consistency of Lumbar Spine MRI Image Segmentation. In Proceedings of the 2023 45th Annual International Conference of the IEEE Engineering in Medicine & Biology Society (EMBC), Sydney, Australia, 24–27 July 2023; pp. 1–4. [Google Scholar]
- Saha, A.; van der Pol, C.B. Liver Observation Segmentation on Contrast-Enhanced MRI: SAM and MedSAM Performance in Patients With Probable or Definite Hepatocellular Carcinoma. Can Assoc Radiol J 2024, 75, 771–779. [Google Scholar] [CrossRef]
- Khalil, Y.A.; Becherucci, E.A.; Kirschke, J.S.; Karampinos, D.C.; Breeuwer, M.; Baum, T.; Sollmann, N. Multi-scanner and multi-modal lumbar vertebral body and intervertebral disc segmentation database. Sci. Data 2022, 9, 97. [Google Scholar] [CrossRef] [PubMed]
- van den Heuvel, M.M.; Oei, E.H.G.; Renkens, J.J.M.; Bierma-Zeinstra, S.M.A.; van Middelkoop, M. Structural spinal abnormalities on MRI and associations with weight status in a general pediatric population. Spine J. 2021, 21, 465–476. [Google Scholar] [CrossRef]
- Chen, C.; Miao, J.; Wu, D.; Zhong, A.; Yan, Z.; Kim, S.; Hu, J.; Liu, Z.; Sun, L.; Li, X.; et al. MA-SAM: Modality-agnostic SAM adaptation for 3D medical image segmentation. Med. Image Anal. 2024, 98, 103310. [Google Scholar] [CrossRef] [PubMed]
- Liu, X.; Woo, J.; Ma, C.; Ouyang, J.; Fakhri, G.E. Point-supervised Brain Tumor Segmentation with Box-prompted MedSAM. arXiv 2024, arXiv:2408.00706v1. [Google Scholar]


| Intervertebral Disc | Vertebral Body | ||||||||
|---|---|---|---|---|---|---|---|---|---|
| Parameter | Dice | Sensitivity | Specificity | RHD | Dice | Sensitivity | Specificity | RHD | |
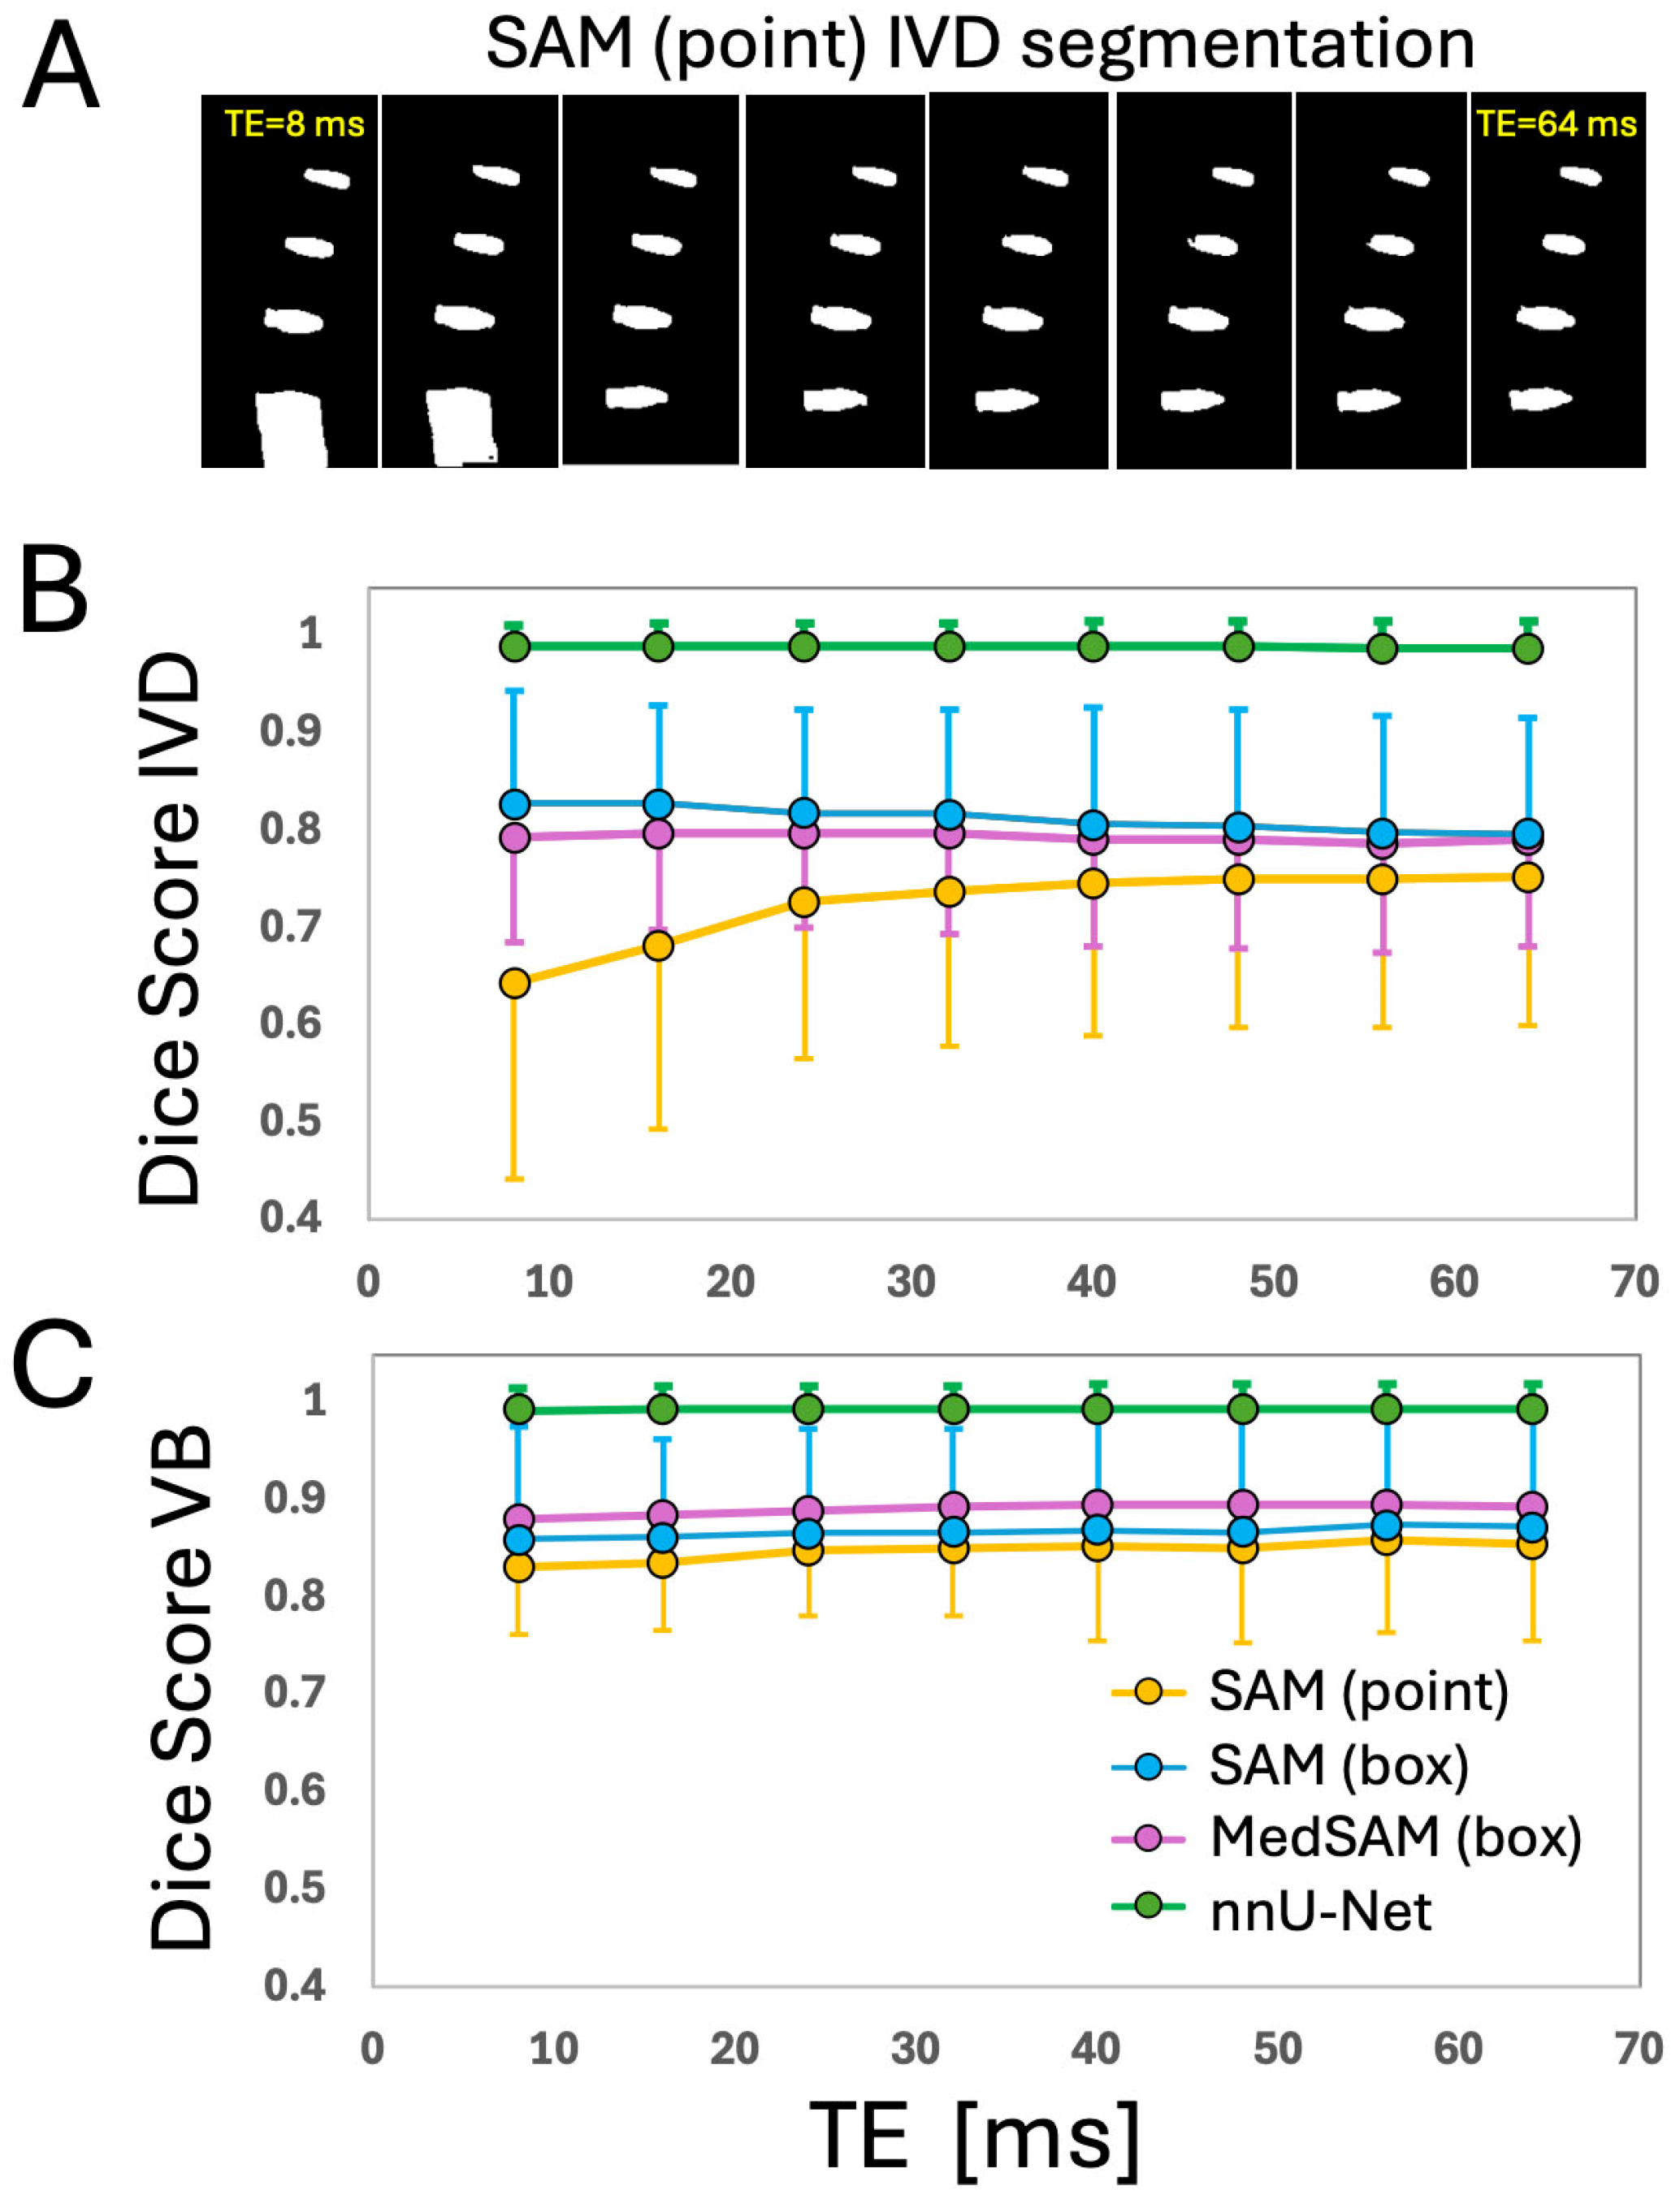
| SAM (Pt), mean ± SD | 0.64 ± 0.20 | 0.56 ± 0.28 | 0.995 ± 0.003 | 7.4 ± 3.6 | 0.83 ± 0.07 | 0.77 ± 0.10 | 0.988 ± 0.014 | 7.1 ± 1.5 | |
| SAM (box) | 0.83 ± 0.12 | 0.78 ± 0.14 | 0.995 ± 0.006 | 4.1 ± 1.3 | 0.86 ± 0.05 | 0.80 ± 0.07 | 0.989 ± 0.009 | 6.6 ± 1.3 | |
| MedSAM (box) | 0.79 ± 0.11 | 0.75 ± 0.14 | 0.993 ± 0.005 | 4.6 ± 1.3 | 0.88 ± 0.04 | 0.85 ± 0.06 | 0.986 ± 0.008 | 5.8 ± 1.0 | |
| nnUNet | 0.99 ± 0.22 | 0.99 ± 0.03 | 0.999 ± 0.001 | 0.5 ± 0.7 | 0.99 ± 0.01 | 0.99 ± 0.02 | 0.999 ± 0.002 | 0.6 ± 0.9 | |
| Effect of DL model | Friedman (Dice, Sensitivity, Specificity) or rmANOVA (RHD) p-values | ||||||||
| Overall | <0.001 | <0.001 | <0.001 | <0.001 | <0.001 | <0.001 | <0.001 | <0.001 | |
| Post hoc w/Bonferroni | |||||||||
| SAM (Pt) vs. SAM (box) | <0.001 | <0.001 | <0.001 | <0.001 | <0.001 | <0.001 | <0.001 | <0.001 | |
| SAM (Pt) vs. MedSAM | <0.001 | <0.001 | <0.001 | <0.001 | <0.001 | <0.001 | <0.001 | <0.001 | |
| SAM (Pt) vs. nnU-Net | <0.001 | <0.001 | <0.001 | <0.001 | <0.001 | <0.001 | <0.001 | <0.001 | |
| SAM (box) vs. MedSAM | <0.001 | <0.001 | <0.001 | <0.001 | 0.097 | <0.05 | 0.127 | <0.05 | |
| SAM (box) vs. nnU-Net | <0.001 | <0.001 | <0.001 | <0.001 | <0.001 | <0.001 | <0.001 | <0.001 | |
| MedSAM vs. nnU-Net | <0.001 | 0.104 | <0.001 | <0.001 | <0.001 | <0.001 | <0.001 | <0.001 | |
| IVD Dice | VB Dice | |
|---|---|---|
| SAM (Pt) | <0.001 | <0.001 |
| SAM (box) | <0.001 | <0.001 |
| MedSAM (box) | <0.05 | <0.001 |
| nnU-Net | <0.001 | <0.001 |
Disclaimer/Publisher’s Note: The statements, opinions and data contained in all publications are solely those of the individual author(s) and contributor(s) and not of MDPI and/or the editor(s). MDPI and/or the editor(s) disclaim responsibility for any injury to people or property resulting from any ideas, methods, instructions or products referred to in the content. |
© 2025 by the authors. Licensee MDPI, Basel, Switzerland. This article is an open access article distributed under the terms and conditions of the Creative Commons Attribution (CC BY) license (https://creativecommons.org/licenses/by/4.0/).
Share and Cite
Chang, C.; Law, H.; Poon, C.; Yen, S.; Lall, K.; Jamshidi, A.; Malis, V.; Hwang, D.; Bae, W.C. Segment Anything Model (SAM) and Medical SAM (MedSAM) for Lumbar Spine MRI. Sensors 2025, 25, 3596. https://doi.org/10.3390/s25123596
Chang C, Law H, Poon C, Yen S, Lall K, Jamshidi A, Malis V, Hwang D, Bae WC. Segment Anything Model (SAM) and Medical SAM (MedSAM) for Lumbar Spine MRI. Sensors. 2025; 25(12):3596. https://doi.org/10.3390/s25123596
Chicago/Turabian StyleChang, Christian, Hudson Law, Connor Poon, Sydney Yen, Kaustubh Lall, Armin Jamshidi, Vadim Malis, Dosik Hwang, and Won C. Bae. 2025. "Segment Anything Model (SAM) and Medical SAM (MedSAM) for Lumbar Spine MRI" Sensors 25, no. 12: 3596. https://doi.org/10.3390/s25123596
APA StyleChang, C., Law, H., Poon, C., Yen, S., Lall, K., Jamshidi, A., Malis, V., Hwang, D., & Bae, W. C. (2025). Segment Anything Model (SAM) and Medical SAM (MedSAM) for Lumbar Spine MRI. Sensors, 25(12), 3596. https://doi.org/10.3390/s25123596