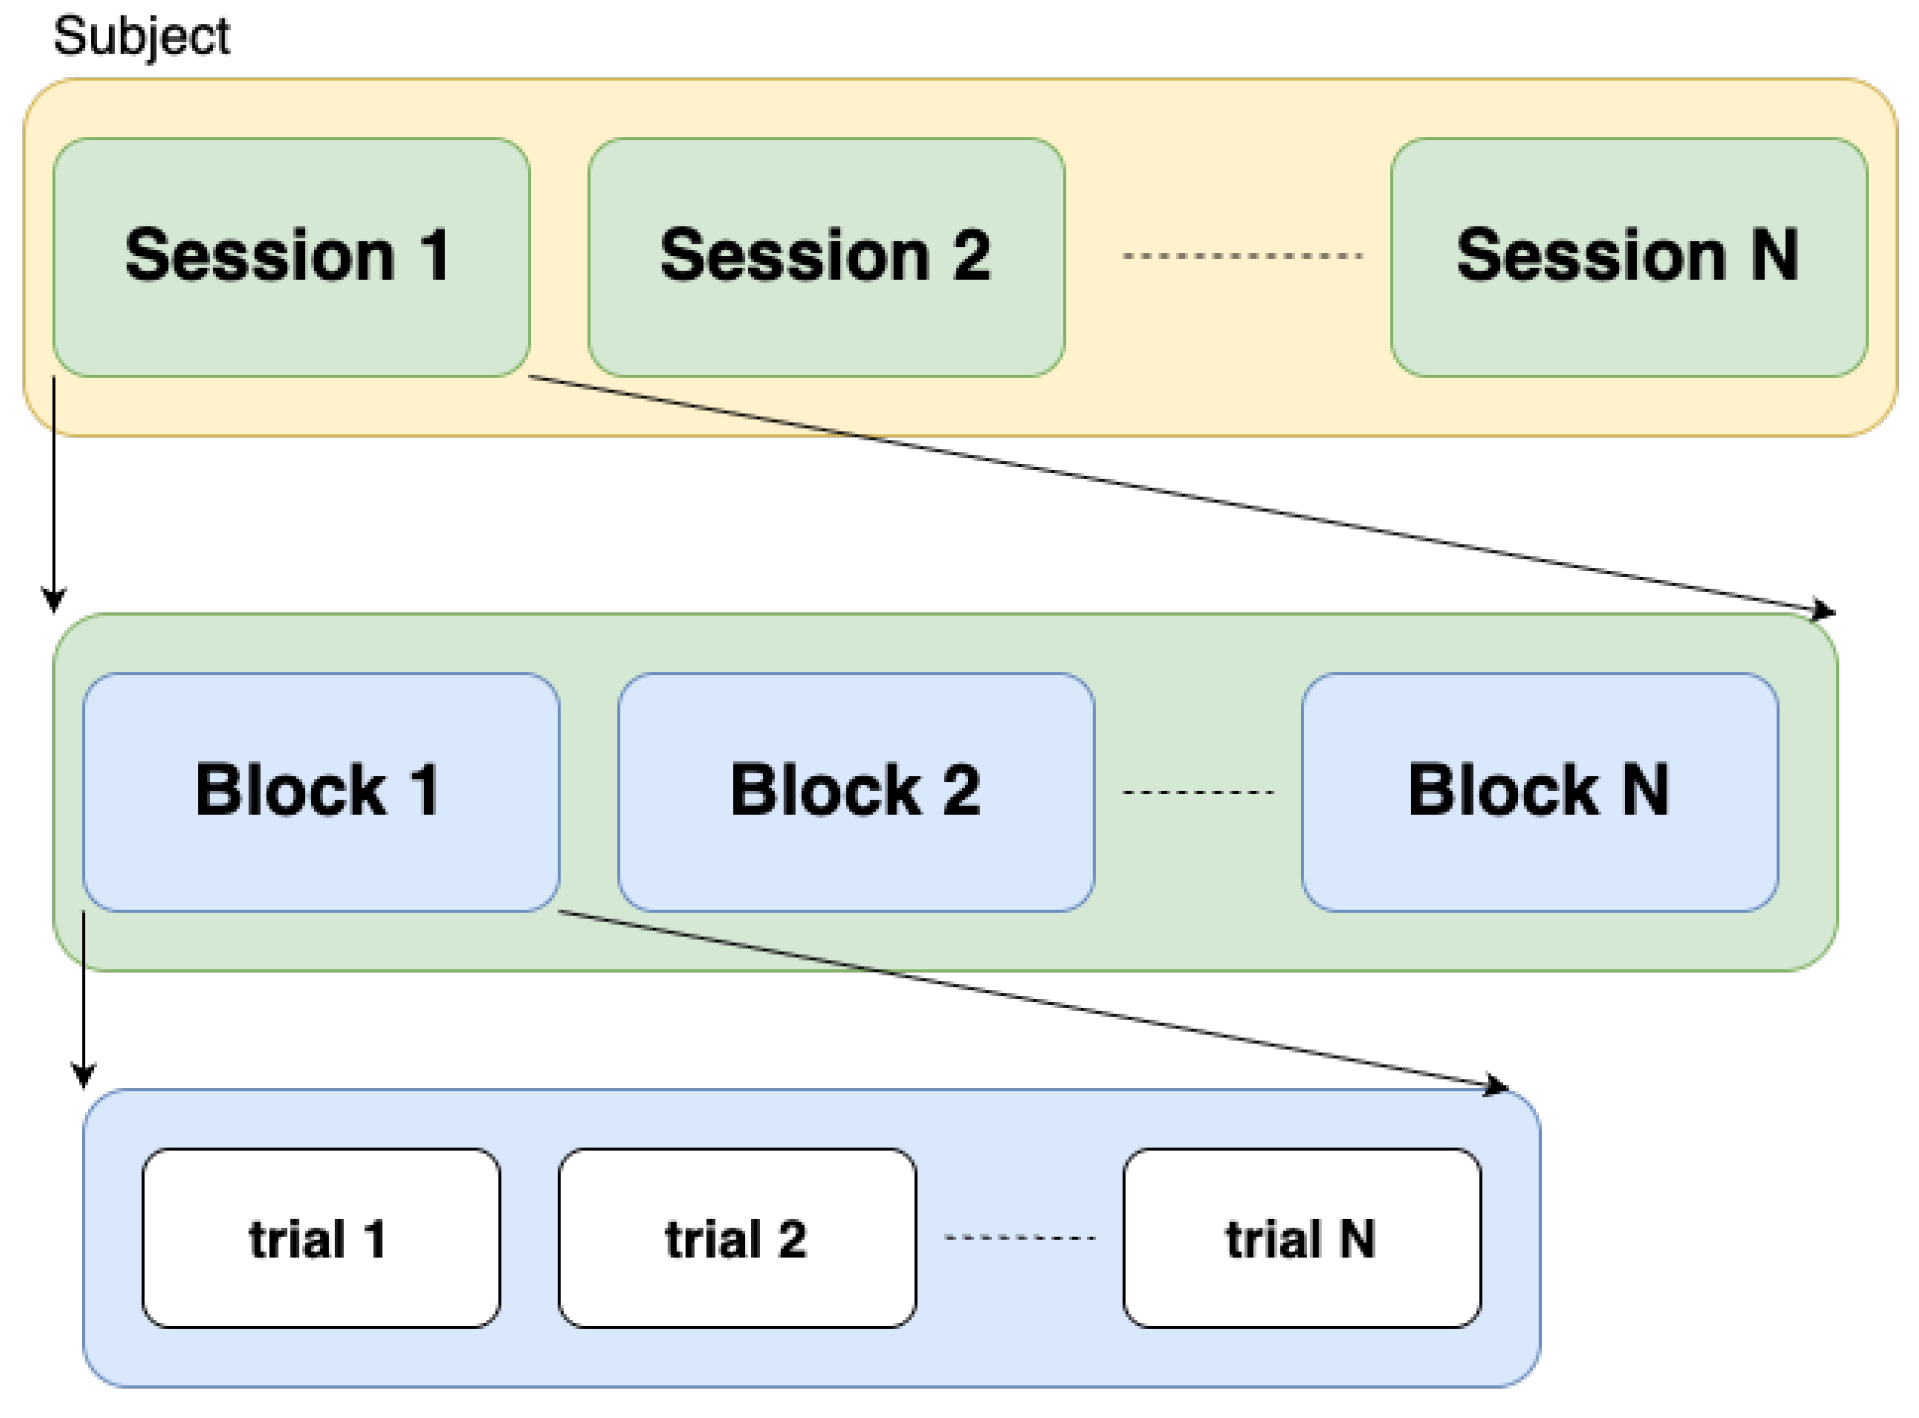
4.1. Datasets and the Experiment Setup
We conduct our experiments on the TUBerlin [
4], Tufts [
16], and FingerFootTapping (FFT) [
28] datasets. The TUBerlin [
4] and Tufts [
16] datasets were collected from
n-back tasks, and the FignerFootTapping (FFT) [
28] dataset was collected when participants were performing finger- and foot-tapping tasks.
TUBerlin Dataset: This dataset, presented by Shin et al. [
4], contains simultaneous EEG and fNIRS recordings of 26 participants, who performed three kinds of cognitive tasks:
n-back, discrimination/selection response task (DSR), and word generation (WG) tasks. The dataset is open-access and multi-modal, capturing brain activity from different sources. We use the data from the
n-back task to evaluate our method. The
n-back task involves 0-, 2-, and 3-back levels, and our aim is to classify the mental workload levels across subjects according to the difficulty of
n-back tasks. As
n increases, the working memory workload increases. The dataset of the
n-back task consists of three sessions. In each session, the subjects completed three blocks of 0-, 2-, and 3-back tasks in a counterbalanced order (i.e., 0 → 2 → 3 → 2 → 3 → 0 → 3 → 0 → 2). Thus, there are a total of nine blocks of
n-back tasks for each subject. Each block starts with a 2-s instruction that shows the task type (0-, 2-, or 3-back), followed by a 40-s task period, and ends with a 20-s rest period. During the task period, a single-digit number was randomly presented every 2 s, resulting in twenty trials per block. For each
n-back task, there are 180 trials in total (20 trials × 3 blocks × 3 sessions).
fNIRS data is acquired by a NIRScout device (NIRx Medizintechnik GmbH, Berlin, Germany) and further converted to deoxy-(HbR) and oxy-hemoglobin (HbO) intensity changes, using modified Beer-Lambert law [
48], and downsampled to 10 Hz. Following downsampling, a low-pass filter (6th order zero-phase Butterworth) with a 0.2 Hz cut-off frequency was applied to remove high-frequency instrument noise and systemic physiological artifacts, instead of using a band-pass filter.
The fNIRS device has sixteen sources and sixteen detectors that were positioned on the frontal, motor, parietal, and occipital regions of the head. An fNIRS channel is formed by a source-detector pair that was next to each other, resulting in 36 channels in total. Each channel has two features corresponding to the ΔHbR and ΔHbO data. The total number of features is 72, i.e., 36 spatial locations × 2 hemoglobin types × 1 optical data type (intensity).
FFT Dataset: Bak et al. [
28] presented an open-access fNIRS dataset, which contains data from 30 participants for three-class classification, namely left-hand unilateral complex finger-tapping (LHT) (Class 0), right-hand unilateral complex finger-tapping (RHT) (Class 1), and foot-tapping (FT) (Class 2). In each session, the order of tasks is randomly generated. A trial starts with a 2-s introduction, and then 10 s of task period followed by an 17–19 s of inter-trial break. There are a total of 225 trials (25 trials × 3 task types × 3 sessions).
fNIRS data was recorded by a three-wavelength continuous-time multi-channel fNIRS system (LIGHTNIRS, Shimadzu, Kyoto, Japan) consisting of eight sources and eight detectors. Four of the sources and detectors were placed around C3 on the left hemisphere, and the rest were placed around C4 on the right hemisphere. The raw fNRIS data was further converted to the intensity changes i.e., ΔHbR and ΔHbO using modified Beer-Lambert law [
48] with a sample rate of 13.33 Hz. Then, data was band-pass filtered through a zero-order filter implemented by a third-order Butterworth filter with a pass-band of 0.01–0.1 Hz to remove physiological noises. There are 20 fNIRS channels and the total number of features is 40, i.e., 20 spatial locations (10 for each hemisphere) × 2 hemoglobin types × 1 optical data type (intensity).
Tufts Dataset: More recently, Huang et al. [
16] presented the largest open-access fNIRS dataset including data from 68 participants performing
n-back tasks. The
n-back tasks involve 0-, 1-, 2-, and 3-back levels, and our aim is binary classification between 0- and 2- levels, same as what was achieved in Huang et al. [
16]. Each subject performed tasks in only one session, and completed 16 blocks of
n-back trials in a counterbalanced order (i.e., 0 → 1 → 2 → 3 → 1 → 2 → 3 → 0 → 2 → 3 → 0 → 1 → 3 → 0 → 1 → 2). Each block contains 40 trials lasting a total of 80 s (each trial lasting 2 s), followed by 10–30 s of rest period. For each participant, there are 640 trials in total (40 trials × 16 blocks × 1 session).
fNIRS data is acquired by an Imagent frequency-domain (FD) NIRS instrument manufactured by ISS (Champaign, IL, USA). Two sets (left and right) of custom probes with linear symmetric dual-slope (DS) [
26] sensor design were placed on the forehead. The raw data was further converted to the changes of HbR and HbO in intensity and phase [
27] and sampled at 10 Hz. Then, each univariate time-series was band-pass filtered using a third-order zero-phase Butterworth filter, retaining 0.001–0.2 Hz to remove noise. The data consists of total of eight features, coming from 2 spatial locations × 2 hemoglobin types × 2 optical data types (intensity and phase).
Experiment Setup: We used the data from all three datasets as is, without further preprocessing, since data had already been filtered with band-pass/low-pass filters to eliminate noise. We created the input data with sliding windows. The window size was the same as the task period of each trial, i.e., 2 s for TUBerlin and 10 s for FFT. For the Tufts dataset, we used a 15-s window as recommended by the original paper. The input shapes and corresponding sliding window durations that we used in our experiments, for all three datasets, are listed in
Table 3. It should be noted that, in FFT, the experiments are not in block-wise design. Thus, for FFT dataset, we applied our proposed BWise-DA on sessions instead of blocks.
All models, including our proposed method and the baseline models, were trained from scratch on a server equipped with a single NVIDIA RTX 2080 GPU (NVIDIA, Santa Clara, CA, USA), running Ubuntu 22.04 with Python 3.9 and PyTorch 1.12. Training was stopped when the evaluation loss did not improve for 50 consecutive epochs. We used the Adam optimizer [
49] for training. We performed a grid search to find the best hyper-parameters, namely the learning rate and the dropout ratio for all models. The learning rate was chosen from {
} and the dropout ratio was chosen from {0, 0.25, 0.5, 0.75}. The value of
in Equation (
8) is selected by grid search from {0.5, 0.6, 0.7, 0.8, 0.9, 1.0, 1.1} based on the test mean accuracy of the MLPMixer model. The learning rate was
, the dropout ratio was 0.0, and the
was set as 1.1 for Tufts, and as 1.0 for TUBerlin and FFT datasets.
4.2. Experimental Results
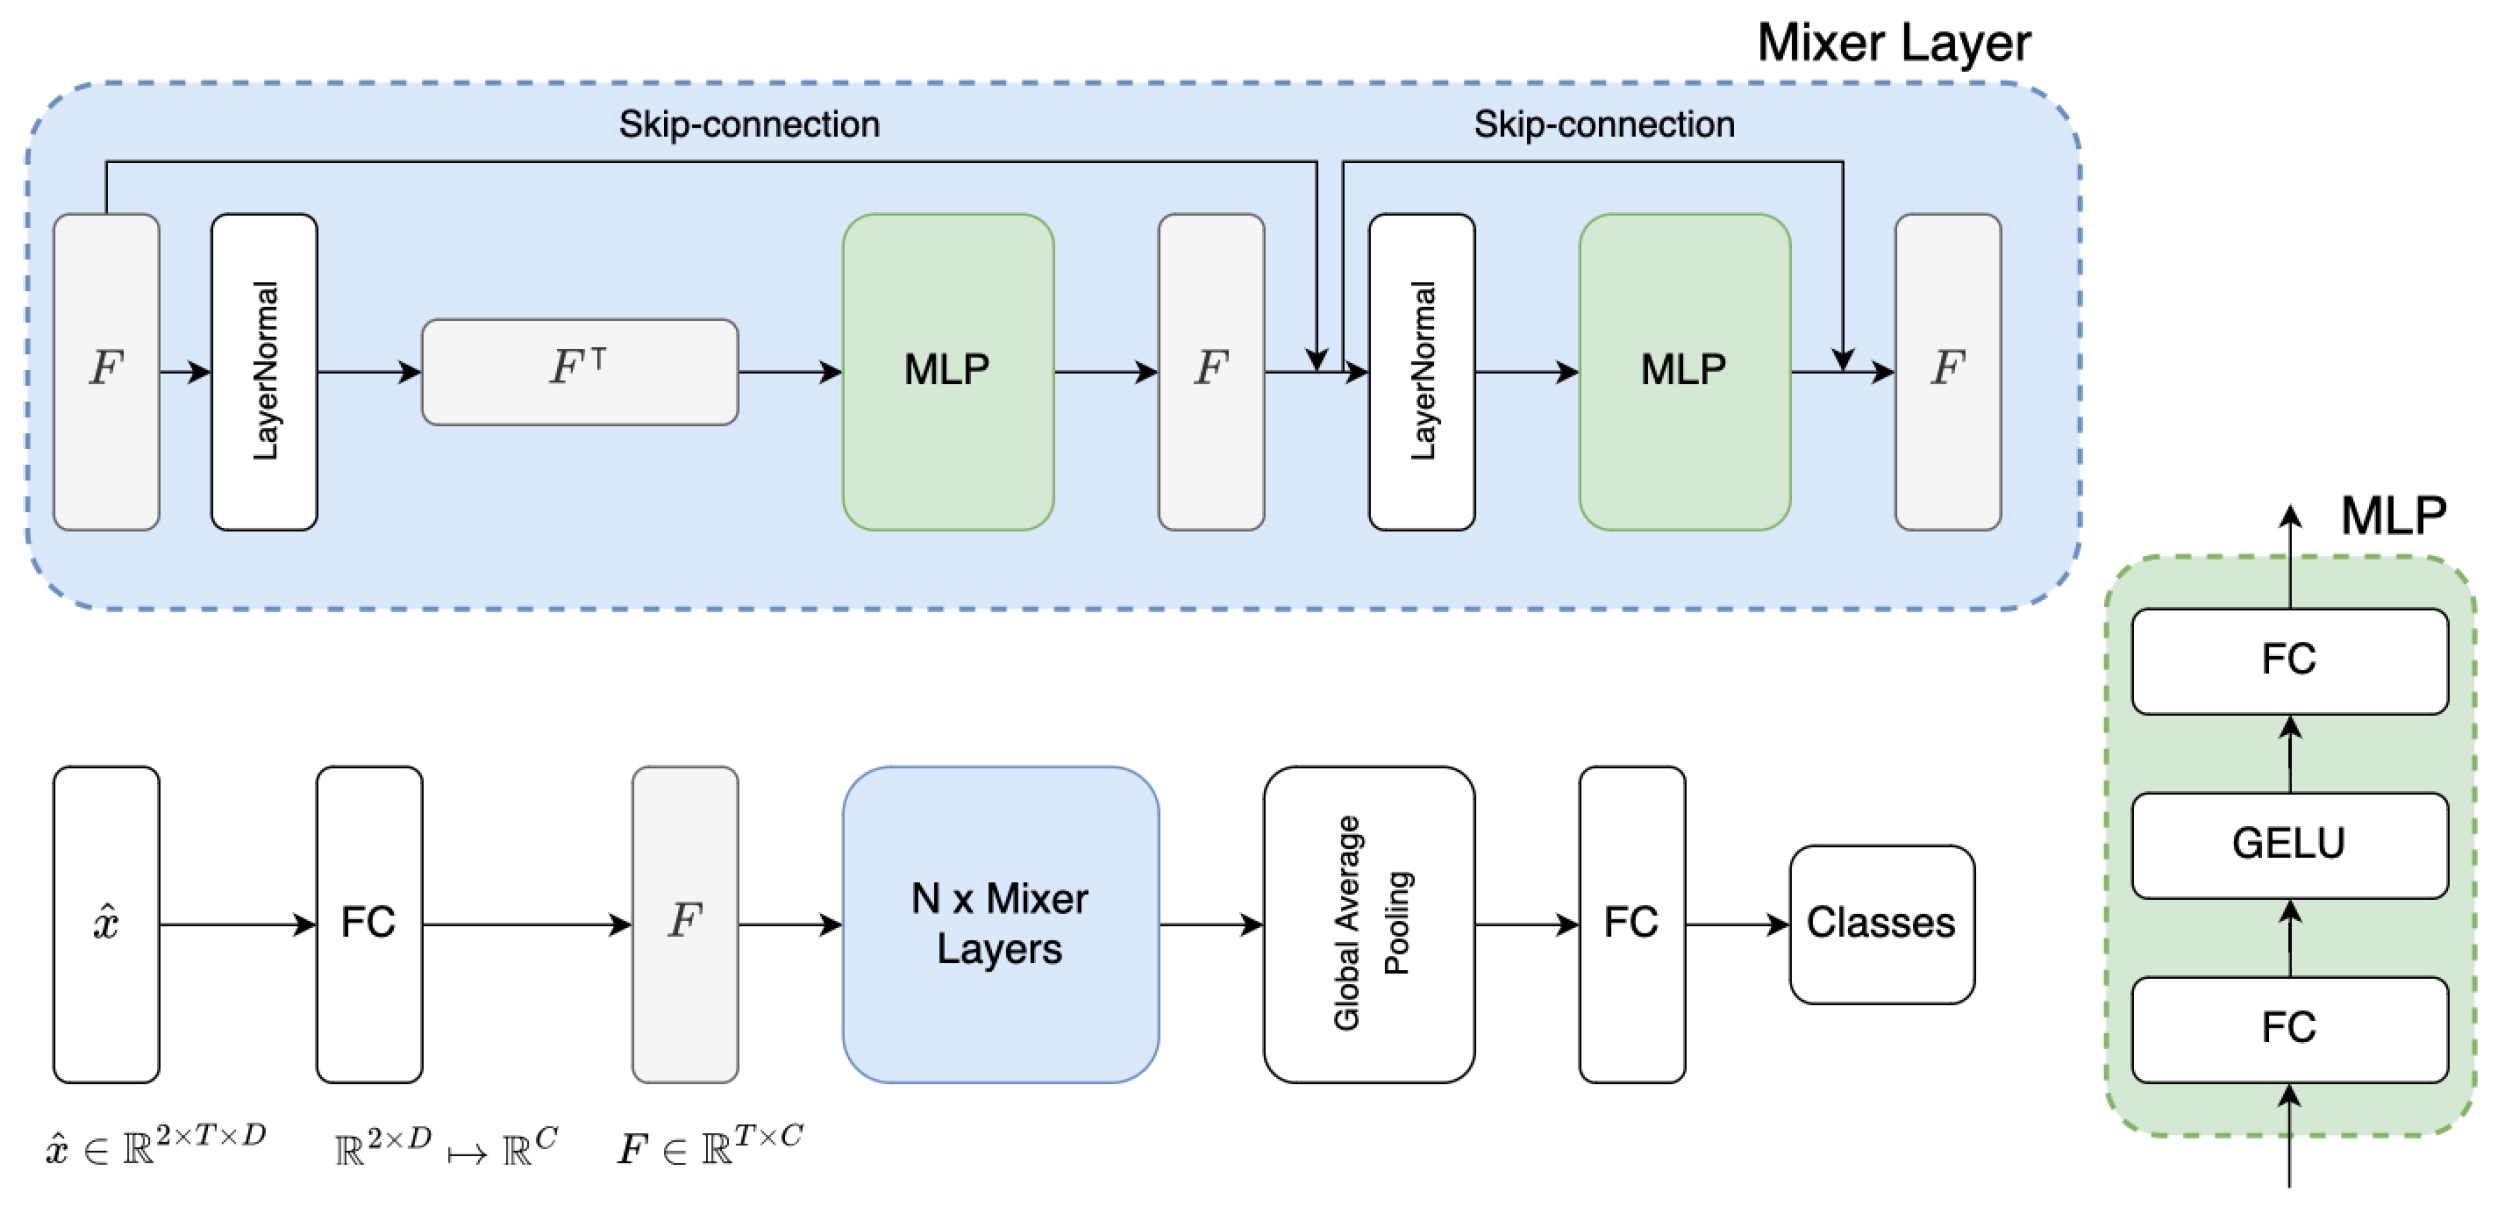
We have conducted four sets of experiments on three open-access datasets and compared our MLPMixer model with three baselines, namely DeepConv, EEGNet, and MLPBiGRU. We used
k-fold cross-subject validation and reported the mean accuracy and the F1 score over
k folds. For both TUBerlin and FFT datasets, we split the data into 10 folds based on subject IDs. In the TUBerlin dataset, each fold contains 18 subjects for training, 5 subjects for validation, and 3 subjects for testing. In the FFT dataset, each fold consists of 21 subjects for training, 6 subjects for validation, and 3 subjects for testing. For Tufts dataset, we used the splits provided in the original paper [
16], which also separated the folds by participants. Experimental results obtained on TUBerlin, FFT, and Tufts datasets, without DA and with different DA scenarios (subject-, session-, and block-wise), are shown in
Table 4,
Table 5 and
Table 6, respectively. In our presentation of the results, we highlight the highest value in each column in bold. The overall highest value in the entire table is both bolded and underlined for clear distinction. For domain adaptation (DA) methods, the differences between the DA outcomes and those obtained through training with cross-entropy (CE) are displayed in parentheses. A green color indicates an increase in performance thanks to the DA method, while a red color signifies a decrease.
In the first set of experiments, we only used cross-entropy (CE in tables), without domain adaptation, to train our proposed MLPMixer and compare its performance as a backbone with three different baselines.
Table 4,
Table 5 and
Table 6 show that, without DA, our proposed MLPMixer provided a mean accuracy of
(
Table 4) on the three-way workload
n-back (0- vs. 2- vs. 3-back) classification task on TUBerlin dataset, which is
lower than the best accuracy obtained by EEGNet. The classification task for TUBerlin is a three-way classification, in contrast to the binary classification with the FFT and Tufts datasets, making the task on this dataset more challenging. In addition, each sample from the TUBerlin dataset captures only 2 s of brain activity, a considerably shorter duration than the 10 s samples from the FFT dataset and the 15 s samples from the Tufts dataset. Moreover TUBerlin dataset contains the smallest number of subjects, with only 26 participants, compared to 30 and 68 participants in the FFT and Tufts datasets, respectively. The combination of these factors hinders the ability to demonstrate and highlight the generalizability of MLPMixer across a large number of subjects. Despite these challenges, the MLPMixer combined with our proposed Blockwise-DA achieves the highest F1 score on this dataset. On the FFT dataset (from 30 participants), our MLPMixer provided
(
Table 5) accuracy on the three-way LHT vs. RHT vs. FT classification task, outperforming all three baselines. For the binary workload
n-back (0- vs. 2-back) classification task on the Tufts dataset (from 68 participants), our MLPMixer again provided the highest mean accuracy of
(
Table 6), which is
higher than the second best accuracy obtained by MLPBiGRU. From these results, we can see that our proposed MLPMixer model shows better generalizability, even before DA, in handling fNIRS data obtained in different settings and for different tasks across subjects.
In the second sets of experiments, we assessed the impact of our proposed block-wise domain adaptation approach on our proposed MLPMixer model as well as on three baseline models. The results on TUBerlin dataset (last two columns of
Table 4) show that our proposed BWise-DA approach improves the F1 score of all models. The most significant improvement was achieved by applying BWise-DA to our MLPMixer-based model, which improved the accuracy from
to
, providing an increase of
, and improved the F1 score from 0.3899 to 0.4112. As for the FFT and Tufts datasets, our proposed BWise-DA approach improved the accuracy and F1 scores of
all models. Accuracy improvements of as much as 2.76% and 4.43% are achieved on the FFT and Tufts datasets, respectively, thanks to our block-wise DA approach. For the FFT dataset (last two columns of
Table 5), MLPBiGRU model experienced the largest improvement by using BWise-DA. More specifically, our block-wise DA approach improved its accuracy from
to
, providing an increase of
, and improved the F1 score from 0.5775 to 0.6279. With the incorporation of BWise-DA, our proposed MLPMixer provided the best overall performance on both FFT and Tufts datasets.
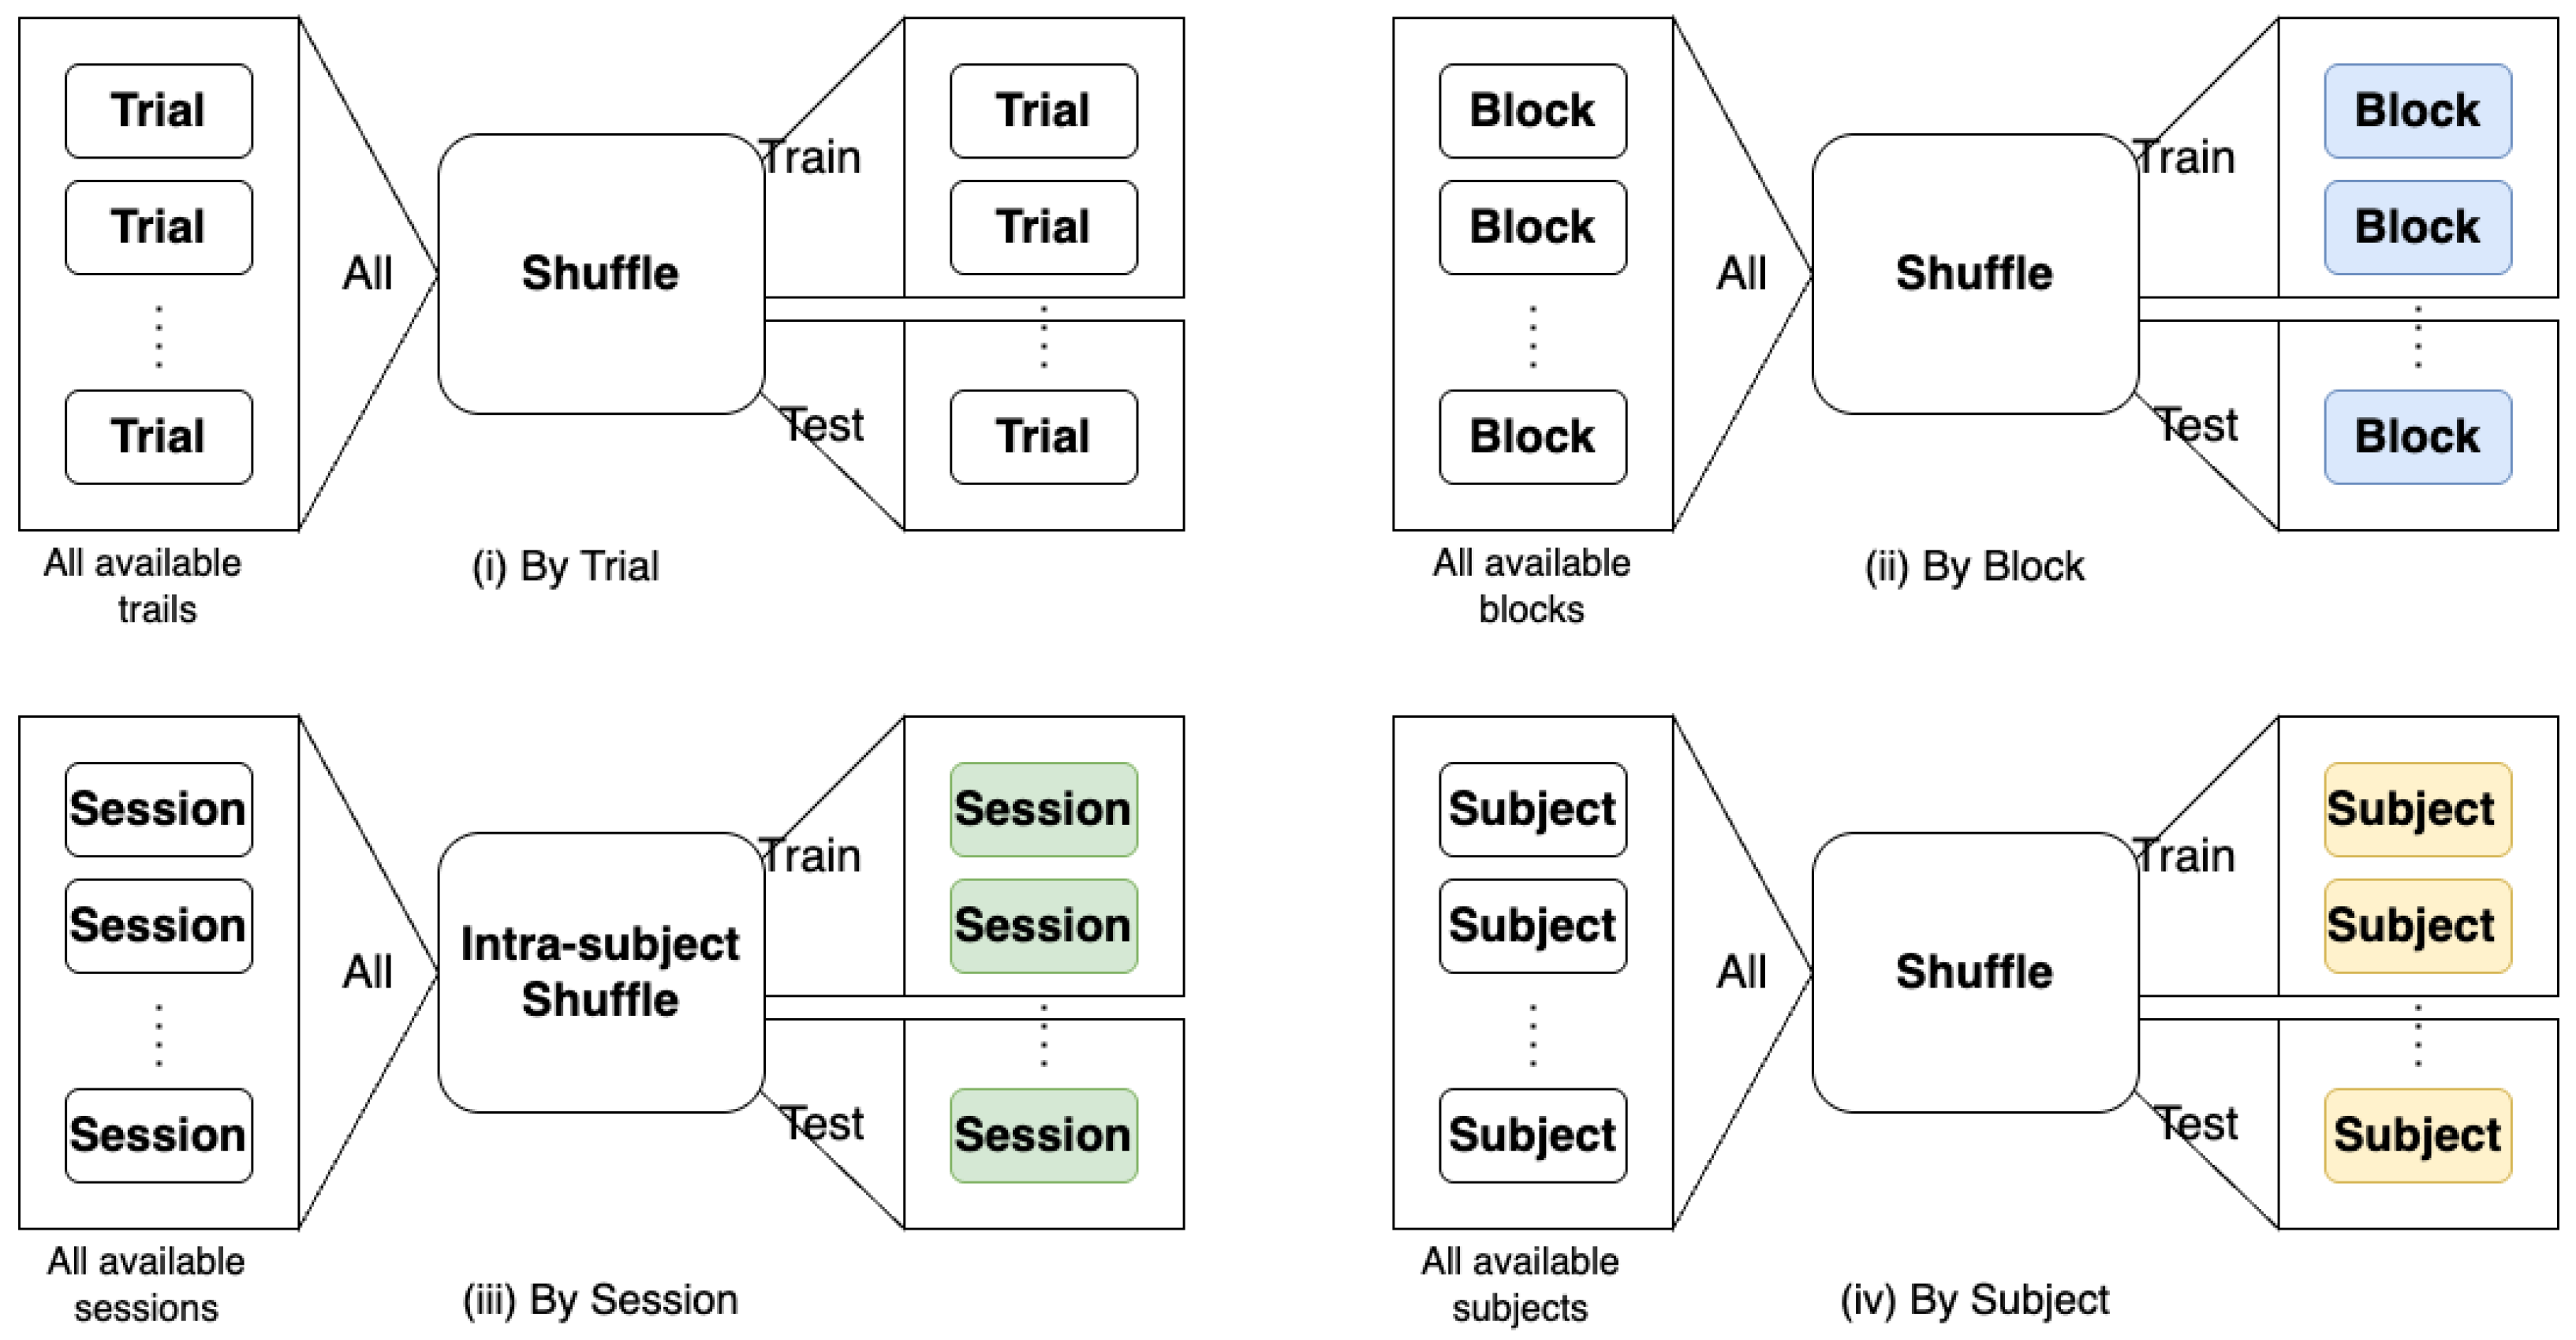
To explore the effect of treating samples from different blocks as different domains versus treating different subjects and sessions as different domains, we conducted two additional sets of experiments. When we treat different subjects as different domains, the second term of Equation (
8), i.e.,
, reduces to zero. When we treat different sessions as different domains, then
measures the discrepancy between samples with the same label from different sessions of the same subject. The results for subject-wise and session-wise DA are presented in the respective columns of
Table 4,
Table 5 and
Table 6. Since there is only one session for each subject in the Tufts dataset, the Session DA column of
Table 6 is not applicable. In all 12 cases, our proposed BWise-DA (with block wise DA) outperforms Subject-DA and Session-DA on TUBerlin and FFT datasets. For the Tufts dataset, BWise-DA outperforms Subject-DA for all models. As for the comparison of Subject-DA versus Session-DA, for five out of eight comparisons on TUBerlin and FFT datasets, Session-DA outperformed Subject-DA. Overall, for all 12 comparisons, our proposed BWise-DA provides improvement in the F1 score over CE (not using domain adaptation) and for 11 out of 12 comparisons, our proposed BWise-DA provides accuracy improvement over CE. In addition, all the overall best performances are reached by incorporating BWise-DA for all three datasets.
Our proposed MLPMixer with BWise-DA provided the highest F1 score on all three datasets. Paired
t-tests across Blockwise-DA and CE (
Table 7) revealed significant F1 score improvements (
p < 0.05) for MLPBiGRU on the FFT and for MLPMixer on TUBerlin dataset. On the Tufts dataset, Blockwise-DA provided significant improvement for three of the four models.
These results across three open-access fNIRS datasets demonstrate that our MLPMixer-based model has a high generalizability on fNIRS data for different types of tasks, such as three-way or binary n-back classification and the LHT vs. RHT vs. FT motion workload classification task. We also show that our proposed BWise-DA approach is versatile and effective when used with different kinds of networks, such as CNN-based (DeepConv and EEGNet), RNN-based (MLPBiGRU), and MLP-based (MLPMixer) methods, for the cognitive workload classification task. Moreover, we observe similar improvements on motion workload classification task.
In terms of computational complexity, our method does not add extra modules to networks. However, compared to conventional training with cross-entropy, training with BWise-DA incurs additional computational effort due to the calculation of
and
, necessitating the pairing of samples for network training. Given the shallow and lightweight nature of these networks, the increase in computational demand is minimal, which can be easily handled by modern computers equipped with graphics cards. More importantly, at the inference stage, BWise-DA does not introduce any extra computational cost. In our comparison of the Multiply-Accumulate operations (MACs) between baseline models and our proposed MLPMixer model across three datasets at inference, as detailed in
Table 8, we observe that our MLPMixer model ranks as the second least computationally intensive (after EEGNet) among the evaluated models. With the incorporation of BWise-DA, our MLPMixer model attained the highest accuracy on both the FFT and Tufts datasets. The compactness of EEGNet, being the smallest model evaluated, minimizes the risk of overfitting, especially for smaller datasets. Specifically, TUBerlin dataset contains data from only 22 participants, compared to the larger Tufts dataset, which comprises data from 68 participants. As seen by comparing
Table 4,
Table 5 and
Table 6, EEGNet’s performance, in comparison to other models, degrades on larger datasets, on which larger models can be better trained.
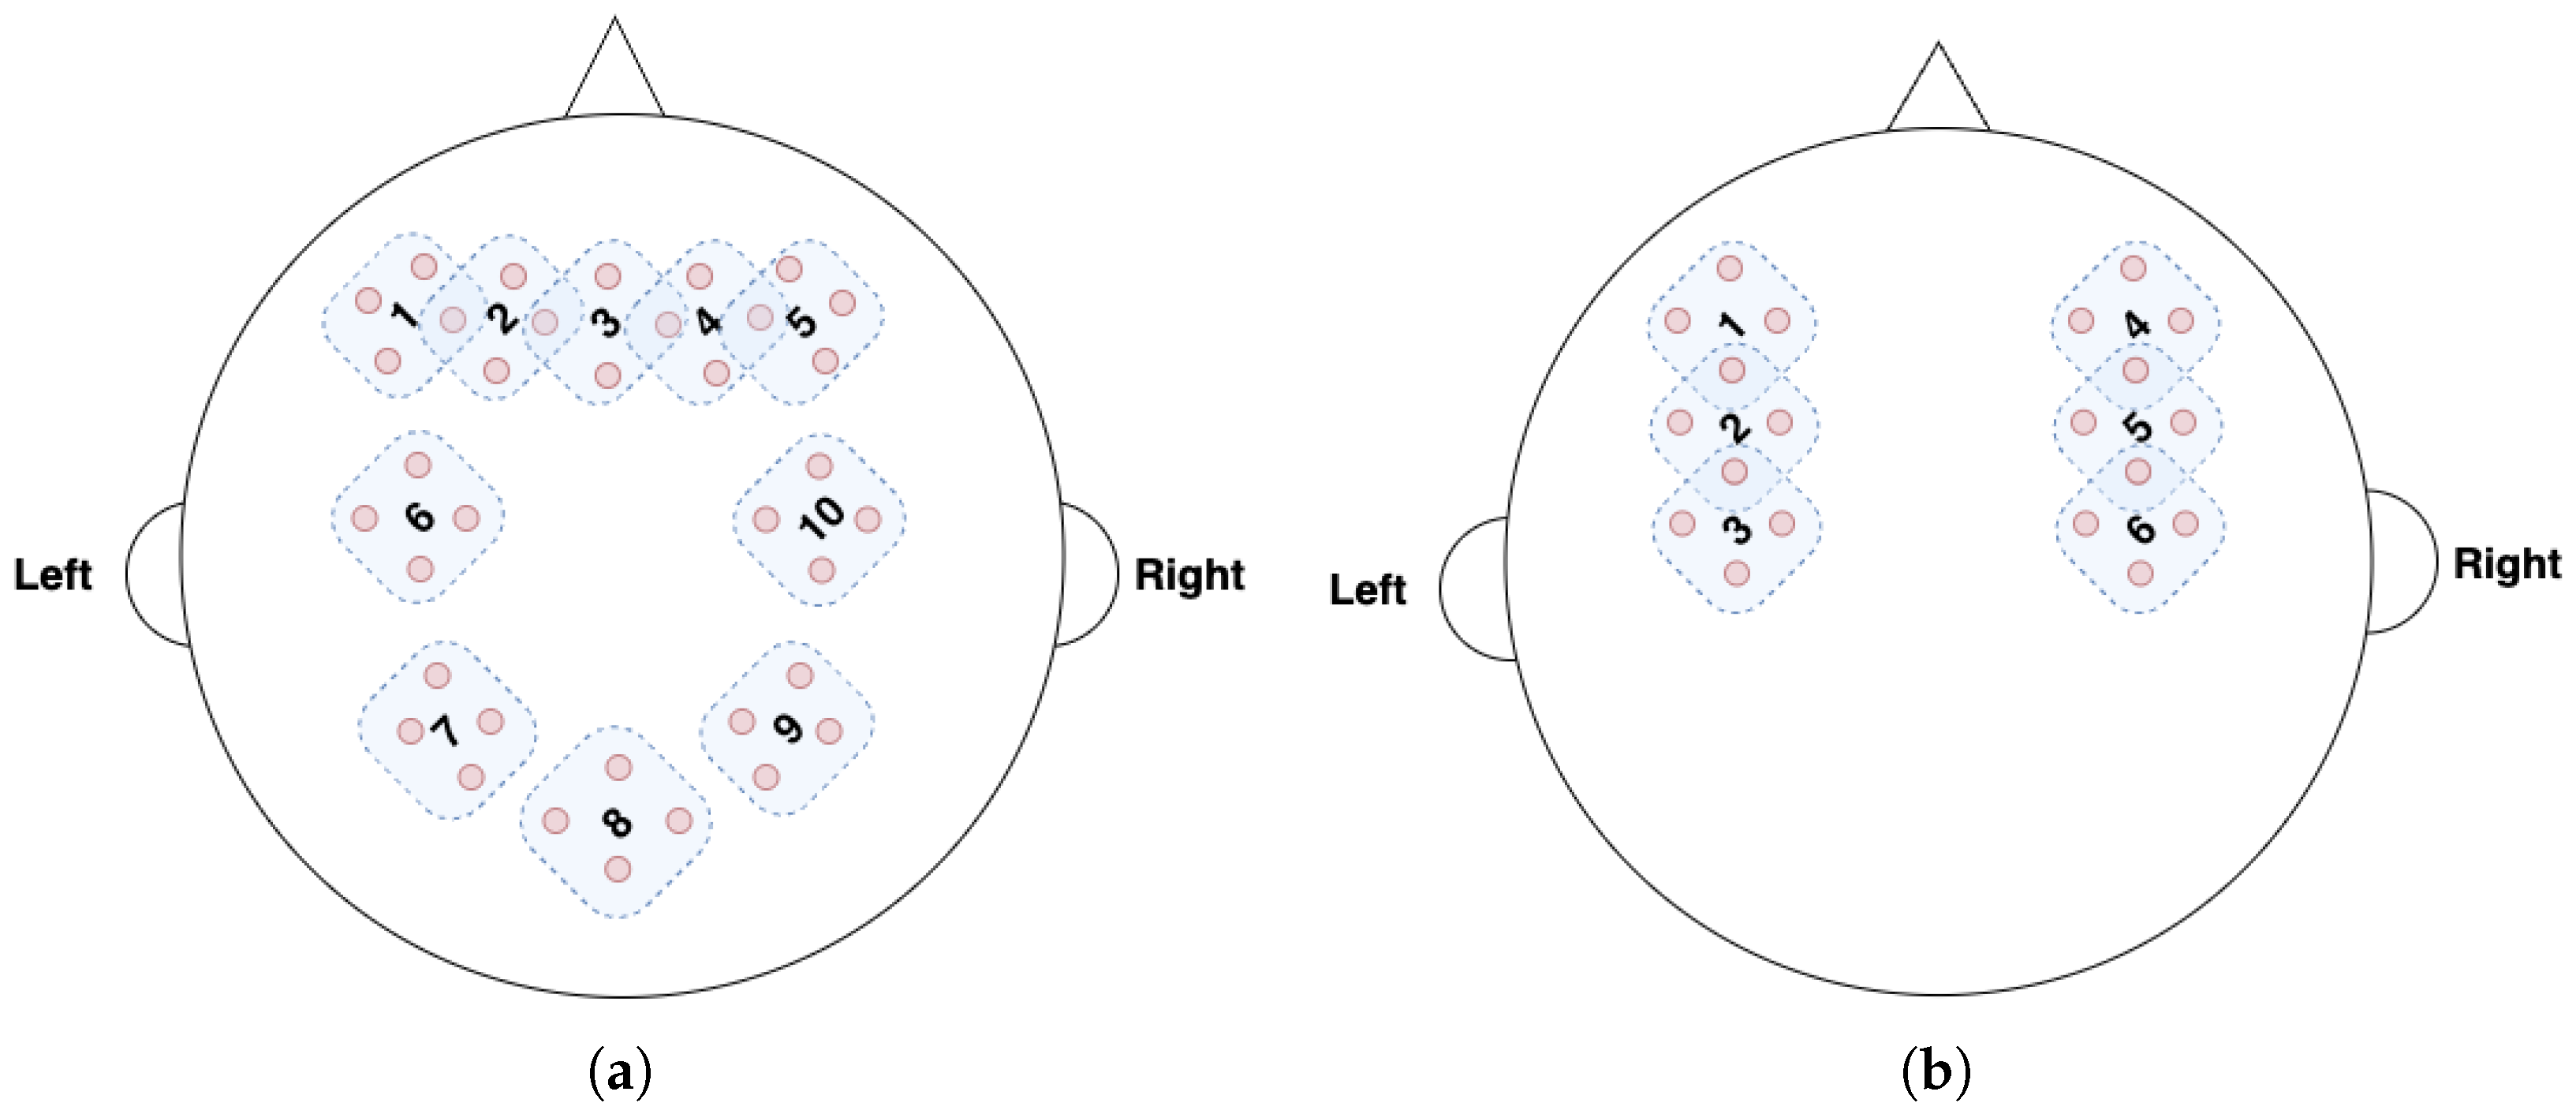
4.3. Visualization of Brain Regions
In this section, we visualize the brain regions, which are most influential on the workload classification outcome, by measuring how the performance changes when different fNIRS channels are masked, i.e., thrown away. To determine the most important areas for brain–computer interface (BCI) performance, we used two datasets with high-density fNIRS channels, namely TUBerlin and FFT datasets. We did not use the Tufts dataset, which is collected by only two probes on the frontal cortex.
Figure 4a and
Figure 4b show the fNIRS channels for the TUBerlin and FFT datasets, respectively, with the numbered masks. We used MLPBiGRU-BWise-DA and MLPMixer-BWise-DA on the TUBerlin and FFT datasets, respectively, since these combinations provided the best performance on the respective datasets. We applied each mask one at a time, i.e., we removed the data from the masked channels, and measured the change in accuracy of the trained model. More specifically, for each mask, we set corresponding channel values to 0 to block out the information contained at that position.
Figure 5 shows the results of this masking experiment. The black dotted lines indicate the average accuracy over all the remaining channels after masking for each dataset. The channels that caused a significant drop in accuracy, below the lower bound of the 95% confidence interval (green dotted line), were considered critical channels. As seen in
Figure 5a, for the TUBerlin dataset, the critical channels are 2, 7, and 9, which correspond to the AF3, P3, and P4 areas of the brain [
4,
50], respectively. The AF3 area is located in the left of the midline of the prefrontal cortex, which is considered as a part of working memory load. The P3 area is located in the left parietal lobe. Mirroring P3, P4 is located over the right parietal lobe. Our results indicate that areas in the prefrontal cortex and parietal lobes are involved when solving the
n-back task. For the FFT dataset, mask positions 2 and 5 (
Figure 5b) result in lower accuracy than the 95% confidence interval lower bound. These mask positions are associated with brain areas C3 and C4, respectively [
28], which are situated within the primary motor cortex. Hence, our findings are consistent with these brain areas, since the FFT dataset was collected when participants were performing motor tasks of finger- or foot-tapping. Results demonstrate that the model is focusing on the right brain areas, since the C3 and C4 regions are predominantly associated with the processing of motion-related workload.


