Article

Privacy-Conducive Data Ecosystem Architecture: By-Design Vulnerability Assessment Using Privacy Risk Expansion Factor and Privacy Exposure Index

by
Ionela Chereja
1,*,
Rudolf Erdei
1,
Daniela Delinschi
1,
Emil Pasca
1,
Anca Avram
1 and
Oliviu Matei
1,2
1
Department of Electrical, Electronics and Computer Engineering, Technical University of Cluj-Napoca, 400114 Cluj-Napoca, Romania
2
R&D Department, Holisun, Str. Cărbunari nr. 8, 430397 Baia Mare, Romania
*
Author to whom correspondence should be addressed.
Sensors 2025, 25(11), 3554; https://doi.org/10.3390/s25113554
Submission received: 6 May 2025 / Revised: 24 May 2025 / Accepted: 3 June 2025 / Published: 5 June 2025
(This article belongs to the Special Issue Privacy and Cybersecurity in IoT-Based Applications)

Abstract

The increasing complexity of data ecosystems demands advanced methodologies for systematic privacy risk assessment. This work introduces two complementary metrics—the privacy risk expansion factor (PREF) and the privacy exposure index (PEI)—to evaluate how architectural decisions influence the exposure and distribution of sensitive data. Several representative use cases validate the methodology, demonstrating how the metrics provide structured insights into the privacy impact of distinct design choices. By enabling comparative analysis across architectures, this approach supports the development of privacy-first data ecosystems and lays the groundwork for future research on dynamic, AI-driven risk monitoring.

1. Introduction

In the era of data-driven ecosystems, the protection of personal and sensitive information has become a cornerstone of responsible digital infrastructure design. As global regulatory frameworks such as the General Data Protection Regulation (GDPR) [1] and the California Consumer Privacy Act (CCPA) [2] underscore the critical importance of protecting individual privacy, organizations are under increasing pressure to embed privacy-preserving principles into every layer of their data architectures [3]. However, despite these advancements, many privacy assessments remain narrowly focused on data content [4], often overlooking or under-representing the architectural and operational dimensions that significantly contribute to data exposure.
Modern digital ecosystems often span complex multi-tiered architectures [5,6] that include source databases, staging environments, analytical layers, and long-term archives. Within such environments, data replication is not only common but often necessary for redundancy, disaster recovery, and high availability. However, each additional copy, whether in the form of a backup, a distributed node, or a persistent cache, represents a potential point of vulnerability. These data instances may reside in different geographic locations [7], operate under varying jurisdictional controls [8], and be subject to different access policies and logging practices. Such heterogeneity introduces inconsistencies in the protection mechanisms applied across the data life cycle [9,10]. Moreover, the inherent complexity of such architectures presents significant challenges to balancing performance with security considerations [11,12,13].
The dynamic nature of data access, governed by diverse authentication and access control configurations, further complicates the ability to accurately assess privacy risks. While encryption and anonymization are vital tools, they are insufficient without a comprehensive view of how and where data proliferates within an ecosystem. The lack of standardized methodologies to evaluate the privacy implications of architectural decisions—such as data duplication, localization, and access scope—poses a significant gap in current risk models.
This paper addresses these overlooked dimensions by proposing a framework that quantifies architectural contributions to risk expansion. By treating replication, localization, containment, and access control as key factors, the model highlights the often overlooked increase in exposure resulting from the proliferation of multiple data instances across a system, instances that can significantly amplify privacy risks if not properly managed. Furthermore, evaluating the geolocation of such instances [14] introduces additional concerns related to data sovereignty [15,16] and jurisdictional constraints, which, although challenging to quantify, can have substantial implications in a comprehensive risk assessment. The goal is to support the development of ecosystems that are not only functionally robust but privacy conscious by design.
The remainder of this paper is organized as follows: Section 2.1 and Section 2.2 review the background and related literature; Section 3.1 outlines the objectives and scope of the proposed methodology; Section 3 details the methodological framework; Section 4 presents validation scenarios and representative use cases; Section 5 and Section 6 summarize the results, known limitations, and future work; and finally, Section 7 concludes the paper with a summary of key findings and future directions.

2. Materials and Related Work

2.1. Background and Definitions

The concept of privacy by design (PbD) has emerged as a cornerstone in the development of modern data systems, advocating the integration of privacy and data protection principles from the earliest stages of system architecture and design [17,18]. As data ecosystems grow in complexity, including distributed infrastructures, multi-tiered storage, and cloud-based services, the potential for data exposure and misuse increases significantly [19,20,21,22]. PbD [23,24] emphasizes proactive rather than reactive measures, embedding safeguards directly into the technological framework rather than relying solely on post-deployment controls. This approach not only ensures compliance with regulatory requirements such as GDPR [1] and the Health Insurance Portability and Accountability Act (HIPAA) [25], but it also fosters trust, resilience, and accountability within digital infrastructures. Consequently, designing with privacy as a foundational principle is no longer optional but essential to ensure ethical, sustainable, and secure data-driven innovation. The PbD principles also seek to accommodate all legitimate interests and objectives without jeopardizing data privacy. However, each design choice made in the architecture of such an ecosystem must achieve the right balance between data functionality and availability, along with the measure of protection [26]. Changes in either of these settings will have an impact on the other and the overall infrastructure of a system [27].
A key implementation of privacy by design is the principle of data minimization [28], which entails collecting and retaining only the data strictly necessary for a specific purpose. This practice significantly reduces the vulnerability of the system by limiting the volume and sensitivity of stored data, thereby shrinking the attack surface. Embedded in legal frameworks like GDPR [1] and widely recognized in privacy engineering methodologies, data minimization not only supports compliance but reinforces the proactive ethos of privacy by design by limiting risk exposure from the outset [17,29].
However, in practice, achieving data minimization is often constrained by the architectural requirements of modern data systems. Data warehousing for analytics, machine learning pipelines, large language models (LLMs), and distributed database architectures frequently requires data duplication, prolonged retention, and complex storage hierarchies [30]. These designs, while optimizing performance and insight generation, can inadvertently conflict with minimization goals, making it critical to balance utility with privacy-preserving constraints [31,32].
Privacy-enhancing technologies (PETs) have become essential for safeguarding data in modern ecosystems. Techniques such as differential privacy, which injects statistical noise to obscure individual-level information [33], and homomorphic encryption, which allows computation on encrypted data without decryption [34], offer robust protection while maintaining data utility. Secure multiparty computation (SMPC) allows multiple entities to jointly compute outcomes without revealing their input [35], while trusted execution environments (TEE) protect sensitive computations in hardware-isolated environments [36]. Federated learning presents an alternative to centralized data processing by training machine learning models locally on edge devices and only sharing model updates [37], significantly reducing raw data exposure. Additional techniques such as synthetic data generation and pseudonymization/anonymization also help mitigate re-identification risks. However, despite their strengths, these PETs focus on protecting the content of the data and do not address the inherent vulnerability posed by its existence and replication. Unauthorized access to any copy of the data—whether a backup, distributed node, or replica—could potentially bypass content-level protections. Therefore, every additional copy increases the exposure surface of the system, highlighting the critical importance of evaluating architectural decisions that influence data duplication and localization.

2.2. Related Work

Several prior efforts have aimed to assess data protection within system architectures. Sion et al. [38] introduce a GDPR-aligned framework that provides an architectural perspective for data protection by design, emphasizing system responsibilities and data flows to help developers identify where privacy controls are necessary within the infrastructure. However, their approach is largely qualitative and lacks quantitative metrics for assessing architectural vulnerability or propagation of risk due to data replication or geopolitical concerns. Similarly, Morali et al. [39] propose a model-driven method for the assessment of confidentiality risk in architectures, focusing on identifying the propagation of threats across components and assets. Although more formalized, this model does not account for the number of data copies, geographic data dispersion, or the varying access scopes that can significantly impact exposure. Antignac and Le Métayer [40] present a formal approach to reasoning about privacy architectures, particularly focusing on principles such as data minimization and integrity, but they focus on abstract system guarantees rather than concrete data infrastructure or physical exposure risks. Wagner and Boiten [41] advance the discussion of privacy risk metrics, aiming to establish general-purpose privacy indicators, though these remain mostly content and policy centric, overlooking structural and operational aspects of system architecture.
Senarath et al. [42] emphasize the importance of minimizing unnecessary data use in accordance with the GDPR’s data minimization principle; however, they do not consider the impact of data replication or geographic distribution on privacy risks. Similarly, De and Le Métayer [43] focus on informing users about data risks and access governance, while Bakar et al. [44] advocate for quantifying risks related to developer access permissions, but neither addresses how architectural decisions, such as data replication or localization, affect overall risk. Cao et al. [45] analyze privacy risks in continuous data streams considering temporal correlations, but they overlook the influence of data sharing and replication across distributed systems. Giomi et al. [46] propose a framework for quantifying residual privacy risks in synthetic data, but their focus is limited to synthetic environments and does not extend to real-world infrastructures where data replication and access control are critical. Eldin et al. [47] present a risk scoring model for open data, but they do not account for how architectural factors influence privacy risks.
In the context of the Internet of Things (IoT) and event-driven systems [48,49], existing frameworks have made significant strides in identifying privacy challenges [50,51]. However, they often fail to address the architectural dynamics unique to sensor-based infrastructures. For example, Alwarafy et al. [52] provide a comprehensive survey of edge-assisted IoT environments and identify architectural vulnerabilities related to data localization and replication, but their treatment remains primarily categorical rather than quantitative. Similarly, Chakraborty et al. [53] introduce privacy-preserving mechanisms for quality assessment of IoT time series data, but they do not model how sensor data, often replicated across edge nodes, cloud layers, and storage silos, contribute to the expansion of privacy risk or how contextual architectural exposure (including geopolitical dispersion and access scope variation) further impacts the exposure of data.
While existing methodologies address aspects of privacy risk [54] and attack surface analysis, to the best of our knowledge, there is no established model that directly quantifies the expansion of the privacy attack surface resulting from architectural storage configurations for data storage systems in a formalized metric-based approach. Traditional attack surface metrics, such as those proposed by Manadhata and Wing [55], focus on quantifying system exposure through entry points, channels, and data types, primarily in software systems. In the realm of privacy risk assessment, frameworks like the NIST Privacy Risk Assessment Methodology (PRAM) [56] offer structured approaches to evaluate privacy risks. However, they do not specifically quantify the impact of architectural storage configurations on the expansion of risk.
To address these limitations, we propose the privacy risk expansion factor (PREF), a quantitative method that evaluates how architectural decisions affect the expansion and propagation of privacy risks across a system. In addition, by combining PREF with the vulnerability score (VS) from our previous work [57,58], which assesses data vulnerability, we present the privacy exposure index (PEI). This new index offers a comprehensive metric for evaluating both content-based and architecture-induced vulnerabilities in an effort to move closer to a generalized privacy exposure assessment framework, inspired by the principles of the Common Vulnerability Scoring System (CVSS) [59,60].

3. Methodology

3.1. Framework Objectives

This section defines the conceptual boundaries of the proposed privacy risk expansion factor (PREF) methodology. PREF is focused on quantifying the expansion of privacy risk that arises directly from architectural decisions within data systems. It captures how structural elements such as data replication, geographic location, access control configurations, and persistence of data in backups or logs contribute to the overall spread and durability of data exposure. For example, even after a user deletes their data at the application level, residual copies may continue to exist in system logs, persistent caches, or off-site backups, maintaining potential privacy risks. PREF treats these risks as inherent to the architecture itself, independent of the specific data content. In other words, even as the datasets change, the risk of structural exposure remains stable unless the system architecture is modified. By isolating and measuring this architecture-induced expansion of risk, PREF establishes a foundation for more comprehensive and infrastructure-aware privacy assessments, ultimately supporting efforts towards a standardized evaluation framework for data vulnerabilities.
The privacy risk expansion factor (PREF) is not intended to completely replace traditional security assessments at the data content or even architectural level. Instead, it complements such evaluations by quantifying how architectural decisions, captured through governance and access, retention and disposal, and secondary exposure metrics, contribute to the expansion of data exposure risk. The innovation introduced by PREF lies in its ability to model how variations in these dimensions amplify or attenuate the overall exposure, providing a structured way to assess how changes in architecture impact the exposure risk, regardless of the inherent sensitivity of the data.
To provide a more holistic and practical measure of privacy vulnerability, we propose the combined assessment of PREF and the previously introduced vulnerability score (VS). The VS captures the intrinsic sensitivity and exposure risk of the data itself and is explicitly designed to accommodate a variety of data types, including structured, semi-structured, and unstructured data. The proposed resulting composite metric, named the privacy exposure index (PEI), integrates both the data-centric and architecture-induced dimensions of risk.
By uniting PREF and VS into the PEI, this framework enables a more standardized, transparent, and adaptable methodology for assessing privacy vulnerabilities in complex data systems. Crucially, the framework is storage agnostic. It is applicable across relational databases, distributed file systems, NoSQL or NewSQL databases, and cloud native storage infrastructures. As the evaluation is grounded in system behavior and data properties rather than being tied to any specific storage technology, PEI provides a consistent basis to compare privacy exposure across diverse implementation environments.

3.2. Privacy Risk Expansion Factor (PREF)

We propose the introduction of the privacy risk expansion factor (PREF), which is designed to quantify the amplification of privacy risk within a data layer due to architectural design choices for the data storage system. The Privacy risk expansion factor (PREF) is defined by quantifying a series of architectural privacy metrics to be assessed for each data copy. In this context, a data copy refers to any additional instance of a dataset within a storage system, including but not limited to distributed or high-availability replicas, backups, persistent caches, disaster recovery copies, or any other form, complete or partial, that can be accessed independently and contains data potentially subject to exposure.
We proposed the following metrics, grouped into three main categories, based on the nature of the risk they capture:
  • Governance and Access Metrics capture how the storage architecture controls and restricts access to data, as well as the geopolitical implications of its location:
    (a)
    A i  (Access Control Scope): This represents the extent and granularity of access control mechanisms applied to the i-th data copy. Potential values are [1–2], where a lower value means strictly limited access with fine-grained roles and strong policies with automated auditing, and a higher value indicates broad or poorly enforced access rights (see Appendix A).
    (b)
    G i  (Geopolitical Location Risk): This reflects the privacy and regulatory risk associated with the physical or legal location of the i-th data copy. Potential values are [1–2], where low values represent the introduction of minimal risk relative to expected geopolitical and legal constraints, while higher values indicate increased potential for extraterritorial access, weak regulatory oversight, or misalignment with the required data localization standards (see Appendix B).
  • Retention and Disposal Metrics evaluate the policies and technical mechanisms for governing data lifespan and erasure:
    (a)
    R i  (Retention and Lifecycle Policy Compliance): This captures whether a data copy is governed by a defined and automatically enforced retention policy. Potential values are [0–1], where higher values indicate weak, absent or manual policies leading to prolonged exposure (see Appendix C).
    (b)
    D i  (Data Erasure Resistance): This represents how difficult it is to fully remove or delete the i-th data copy. Potential values are [0–1], where low values mean an easily erasable copy without the ability to recover data after deletion, and higher values indicate high persistence and/or potential to retrieve the data after deletion (see Appendix D).
  • Secondary Exposure Metrics consider indirect or auxiliary sources of privacy leakage outside the primary data store:
    (a)
    L i  (Log Accessibility Risk): This indicates the exposure of logs of the i-th copy. Potential values are [0–1], where low values reflect no exposed logs, and high values represent logs that are accessible, poorly secured, or maintain traces of deleted data (see Appendix E).
Privacy risk expansion factor (PREF) for a single data layer is calculated using the relation shown in Equation (1)
PREF = i = 1 n G i · A i · 1 + R i + D i + L i
where
  • n is the number of distinct data copies in the layer (e.g., database nodes, backups, distributed replicas).
The formulation of the privacy risk expansion factor (PREF) (Equation (1)) adopts a multiplicative structure to reflect the compounding nature of architectural privacy risks. Specifically, the product of  G i  and  A i  is used to model the interaction between geopolitical and access-related vulnerabilities. This formulation reflects that both geopolitical location and access control are primary determinants of systemic exposure risk [61,62,63,64] and thus carry greater weight in the final PREF score. A higher value in either metric not only indicates direct risk, but also amplifies the influence of secondary factors such as retention, erasure resistance, and log exposure whose impact is conditional on the accessibility of the data copy and its legal jurisdiction [14]. In scenarios where either governance or access is highly restrictive, the overall risk introduced by that copy should remain relatively low; hence, multiplication serves to attenuate risk when one component is well managed and to amplify it when both are weak.
Alternative aggregation strategies were considered during the design of PREF. Additive models, including simple or weighted summation, were found to inadequately represent situations where multiple weak controls should jointly elevate risk. In additive systems, a strong score in one dimension may offset a poor score in another, which contradicts the intended semantics of compounded vulnerability. For example, low geopolitical risk should not neutralize the consequences of overly permissive access.
Normalization-based approaches were also evaluated, but such models tended to reduce the interpretability and transparency of the aggregated metric, especially when assessing the marginal impact of individual architectural changes.
Thus, the multiplicative formulation was selected for its ability to preserve the independent contribution of the metrics while sensitively scaling the final PREF score in proportion to the systemic weakness across the proposed dimensions. This approach aligns with established practices in risk modeling, where multiplicative terms are used to capture interdependencies and conditional escalation of risk. As a result, we propose that the scales of the governance and access metrics range from 1 to 2 rather than 0 to 1 to ensure that their multiplicative role in the PREF formulation appropriately reflects their amplifying impact on overall risk (see Appendix A and Appendix B). This choice avoids nullifying the compounded risk in cases where one factor is well managed (i.e., near zero), but the other is critically weak. In contrast, the retention, disposal and secondary exposure metrics are assigned values between 0 and 1, as they serve to incrementally adjust total risk based on more localized or secondary vulnerabilities, which are conditionally affected by governance and access posture (see Appendix C, Appendix D and Appendix E).
For a clear overview of the entire ecosystem’s risk exposure, we also propose the calculation of an ecosystem privacy risk expansion factor ( P R E F E ), which is determined as the sum of all individual layers’ PREF scores within the system (Equation (2)). While the calculation of PREF for a single layer helps highlight the expansion of privacy risk, particularly when the resulting value exceeds 1, indicating risk amplification beyond baseline, we propose  P R E F E  as a means to evaluate the cumulative risk across all persistent storage components in a data ecosystem. By structuring the calculation of  P R E F E  through a matrix that includes each layer and its corresponding PREF value, this approach offers a valuable diagnostic tool to identify and troubleshoot components that contribute disproportionately to overall exposure.
P R E F E = L = 1 m P R E F L
Here,
  • m is the total number of data layers in the ecosystem architecture.
  • P R E F L  is the privacy risk expansion factor calculated for the Lth layer in the architecture, as defined in the layer-level calculation (see Equation (1)).
Upon analysis, it becomes evident that the resulting PREF and EPREF values lack a defined upper bound. This comes from the architectural flexibility that allows virtually unlimited replication of data across different storage components or services. As such, PREF values cannot be meaningfully normalized or mapped onto a fixed scale (e.g., 0 to 100), since there is no theoretical limit to the number of data copies an architecture may accommodate.
In practice, any addition of data copies or replication layers for performance, redundancy, or backup purposes will proportionally increase the PREF score. Likewise, architectural decisions that weaken privacy safeguards (e.g., applying less-restrictive access control or exposing logs) will also amplify the PREF value. This model allows for a more precise assessment of architectural decisions by factoring in both the quantity and the individual characteristics of each data copy within a specific layer as well as the overview of the entire ecosystem.

3.3. Ecosystem Vulnerability Score

Proposed in previous work [58], the vulnerability score (VS) is a metric that quantifies the inherent privacy risk associated with a given data layer. It reflects the extent to which the data is susceptible to exposure or misuse, serving as an indicator of its overall vulnerability within a system.
As defined in our previous research [58], the assessment of data vulnerability is divided into two primary categories: data persistence metrics and data contents metrics. Data persistence metrics evaluate the risk associated with the method of data storage. The encoding level (ENCD) measures whether data is anonymized or not, with values ranging from 1 to 2, where 1 indicates anonymized data, and 2 denotes non-anonymized data. Encryption (ENCR) assesses the strength of the encryption used; values also range from 1 to 2, where 1 represents strong, secure encryption methods and 2 represents weak or absent encryption (see Appendix F). Masking status (MASK) evaluates whether the data field is masked, using the same 1 to 2 scale—1 for fields that are masked according to a correctly applied secure policy, and 2 for unmasked fields or improper policies.
Data contents metrics assess how sensitive and exploitable the stored data is. Exploitability (EXPL) refers to how easily a piece of data can be leveraged or misused, with values from 1 to 2, where more exploitable data receives a higher score (see Appendix G). The personal information data metric (HPI) identifies the presence of personal identifiable information (PII), with values of 0 or 1. Sensitive/secret information (HSI) reflects whether the data contains confidential content, with values from 0 to 1. Nested sensitive data (HNS) refers to sensitive information that is embedded within semi-structured data fields, and it is also rated from 0 to 1 based on its complexity. Finally, the unstructured sensitive data (HUS) metric captures the presence of sensitive content in unstructured formats, and it is similarly scored between 0 and 1. To maintain clarity and avoid redundancy, the explanations of these sub-metrics have been kept concise in this manuscript. For comprehensive definitions, examples, and empirical justification of each component, we refer the reader to our previous work [58], where the development and rationale behind the vulnerability score and the ecosystem vulnerability score are detailed.
The following equations describe how the vulnerability risk of a specific data layer (Equation (3)) and the total ecosystem score (Equation (4)) are calculated:
V S L = i = 1 n ( E N C D i · E N C R i · M A S K i + E X P L i · ( 1 + H P I i + H S I i + H N S i + H U S i ) )
V S E = L = 1 m V S L
Here,
  • V S L  represents the vulnerability score of the data storage layer;
  • V S E  represents the ecosystem vulnerability score accounting for all data layers included;
  • n represents the number of fields in the dataset;
  • m represents the number of data storage layers in the ecosystem.
A higher vulnerability score indicates increased vulnerability of the data stored within a specific data layer.

3.4. Privacy Exposure Index (PEI)

The privacy exposure index (PEI) represents the overall risk of exposure for sensitive data by capturing the compounded effect of two critical dimensions: the vulnerability of the data content and the exposure introduced by the system architecture that stores or processes it. PEI is formally defined for a given persistent data layer as
P E I L = P R E F L · V S L
where
  • P R E F L  represents the privacy risk expansion factor for a single data layer;
  • V S L  represents the vulnerability score for the same data layer.
PEI is introduced as a single, unified metric that enables a structured assessment of compounded privacy risk by integrating both intrinsic data sensitivity and extrinsic architectural exposure. In developing this formulation, several aggregation approaches were considered to model the interaction between PREF and VS, including additive and weighted average models. However, due to the nature of the relationship between content-based vulnerability and system-induced exposure, which is not simply cumulative but mutually amplifying, a multiplicative formulation was selected.
This multiplicative model captures a core principle in risk modeling: When two independent but necessary components of risk are present, their interaction escalates the overall threat level disproportionately. For example, highly sensitive data (high VS) stored in a highly exposed or weakly governed architecture (high PREF) yields a significantly higher overall privacy risk than either factor alone would suggest. In contrast, additive models may fail to adequately reflect this escalation, especially in high-risk scenarios. While additive models are generally easier to interpret and normalize, they under-represent the compounding nature of exposure.
The total ecosystem PEI is calculated as
P E I E = L = 1 m P R E F L · V S L
where
  • P R E F L  represents the privacy risk expansion factor for the data layer;
  • V S L  represents the vulnerability score of the same data layer;
  • m represents the number of data storage layers in the ecosystem.
It is important to be able to calculate the scores at each data layer as well as for the entire ecosystem, as each layer can have a separate configuration in place for the replication, distribution, and retention of the data stored. Assessing the scores for each layer and as a total will indicate both where the system has the most risk exposure and data vulnerability, as well as how it compares overall with a different type of architecture design that includes other settings.
The natures of the privacy risk expansion factor (PREF), vulnerability score (VS), and privacy exposure index (PEI) are inherently dynamic, reflecting the evolving characteristics of both data and architectural design choices. As data schemas change and system configurations adapt, so too must the metrics used to assess risk. Future research should explore how these assessments can be partially or fully automated, for instance, through the use of data contracts or other declarative system specifications to evaluate VS metrics. Additionally, system configurations could be leveraged to dynamically compute and adjust PREF metrics in real time. The integration of machine learning models for automatic risk evaluation and continuous monitoring also represents a promising direction to enhance scalability and responsiveness.

3.5. Interpretation of VS, PREF, and PEI

The vulnerability score, by design, responds proportionally to the number and sensitivity of fields in the data storage layer. As data accumulates, particularly data deemed personally identifiable or sensitive, the vulnerability score naturally increases. This property highlights the importance of selective data minimization and careful schema design as proactive privacy strategies. Rather than treating all data equally, system architects are encouraged to evaluate the necessity and granularity of stored fields in order to manage vulnerability early in the pipeline.
While the VS metric reflects what is stored, the PREF metric captures how that data is exposed architecturally. A critical insight is that high PREF values can emerge even when the underlying data is not inherently high risk (i.e., has a low VS). This allows system designers to identify problematic architectural patterns that may unnecessarily increase surface exposure and operational complexity (such as excessive duplication or poorly governed storage copies). Therefore, PREF can act as a pressure point to reevaluate deployment decisions, such as whether all data copies need to persist across regions or services.
Combined, VS and PREF offer complementary perspectives that reflect two critical dimensions of privacy risk. PEI unifies both content-level and architecture-level risks into a single, interpretable value that represents the overall likelihood and impact of exposing sensitive or high-value data. This holistic view is essential for designing systems that are both privacy-aware and operationally sound.
Importantly, because neither metric is bounded to a fixed upper limit, they scale in ways that reflect real-world risk accumulation. Adding additional sensitive fields increases VS; creating additional exposed instances increases PREF. This characteristic reinforces their utility in dynamic environments, where changes to either the schema or architectural model can be tracked longitudinally to identify growing privacy risk before it becomes unmanageable.

4. Use Cases and Validation

To validate the proposed methodology, we employ it in two reduced-complexity empirical cases by proposing and evaluating several distinct data architecture designs. This approach enables a comparative analysis that illustrates how PREF, VS, and PEI metrics contribute to the assessment of privacy risks across different architectural choices while maintaining the datasets across deployment models. As PREF specifically quantifies the increase in exposure risk due to architectural decisions, we focus on several illustrative architecture variants derived from a video-on-demand (VOD) scenario, chosen for its relevance to real-world system designs, as well as an additional IoT-based example. This enables both a step-by-step demonstration of metric application and a practical reflection of how architecture configurations impact privacy exposure in diverse environments. We keep the same dataset across one case while only changing the data modeling and the architecture configuration. For brevity we only include the resulting values for the assessed metrics. Complete calculations are available at https://ionela-chereja.github.io/PrivacyRiskExpansionFactor/ (accessed on 24 May 2025).

4.1. Video-On-Demand (VOD) Ecosystem

This video-on-demand use case presents a simplified and partial view of a video-on-demand system, focusing on defining and including several source systems to illustrate how different architectural choices made throughout the entire data storage ecosystem will impact the calculation of risk exposure metrics. Specific implementation details and project identifiers are intentionally omitted in order to mitigate the potential risk of targeted attacks based on the disclosure of accurate architectural information.
The source systems, collectively referred to as business applications, constitute the core functionality of the data ecosystem. For each subsequent use case, we propose distinct architectural designs aimed at leveraging data from these source systems to generate analytical insights. The proposed architectures vary in the number and complexity of additional layers required to support this objective, while making the same dataset available for analysis. Within the business applications layer, the streaming service constitutes the primary customer-facing system. It maintains a dedicated database to support functionalities such as access provisioning, the presentation of video content and associated metadata, and the recording of user-specific streaming activities. The streaming service interfaces with two distinct back-end systems to enable subscription management: the backend video system and the subscription management system. Data originating from both systems are transmitted to the streaming service and persist independently within their respective storage layers.

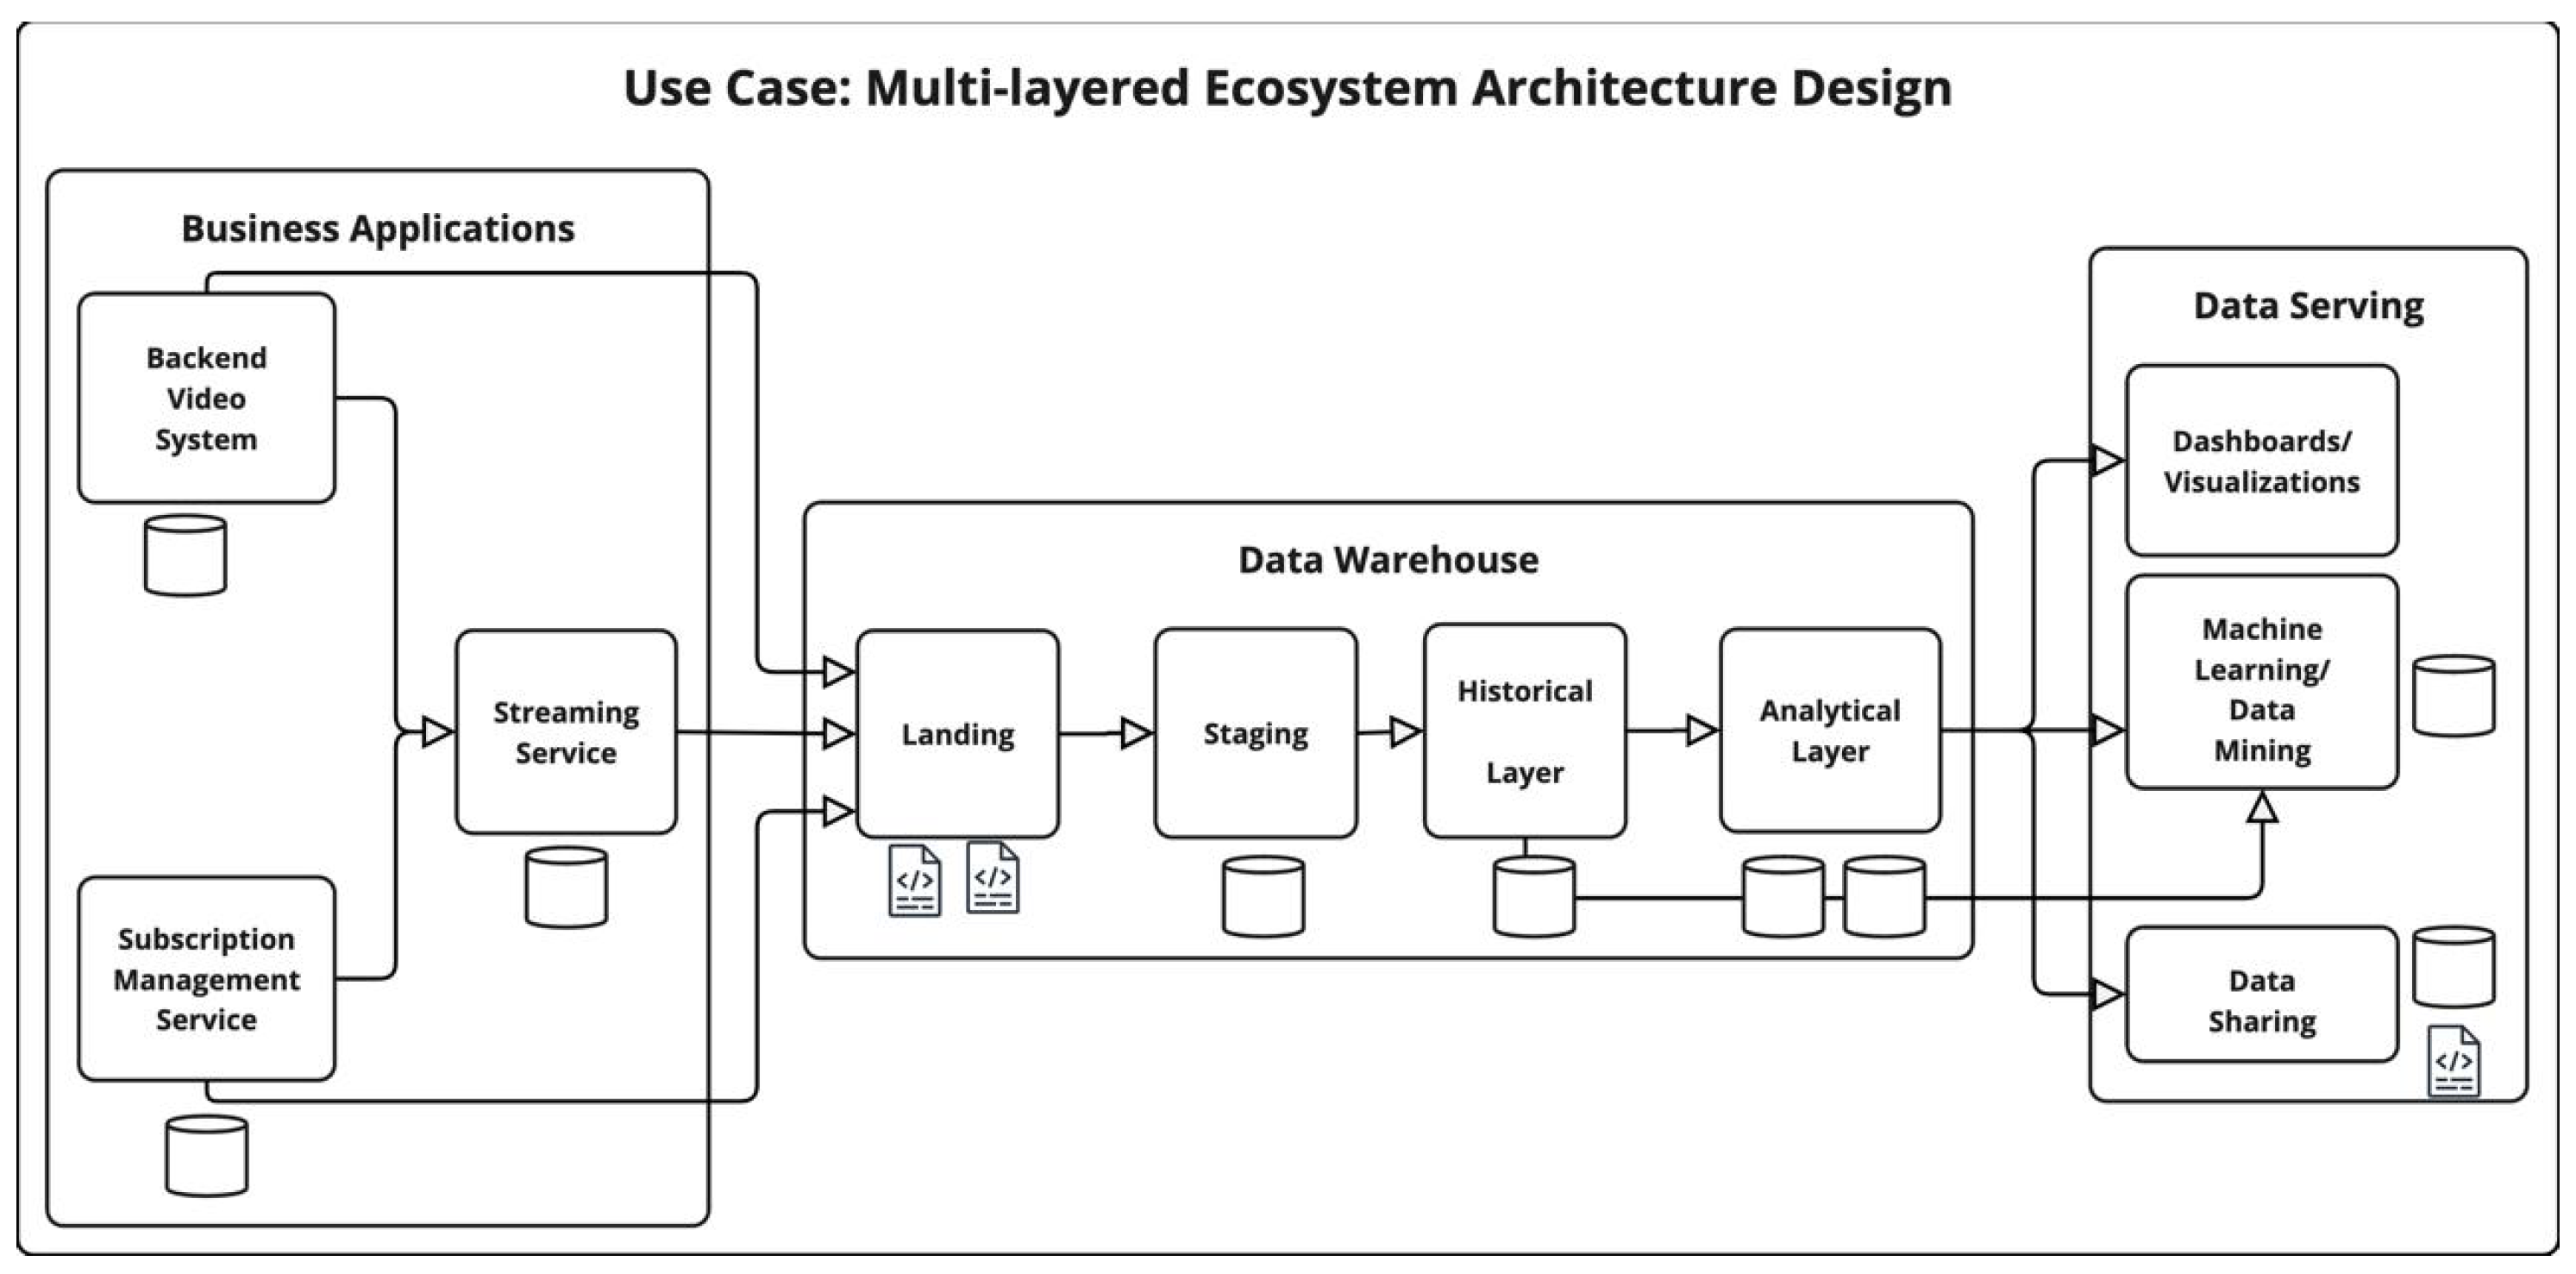
4.2. VOD—Multi-Layered Ecosystem Architecture Design

Three primary components are depicted in Figure 1 to illustrate the flow of data between multiple applications and systems. Data originating from each business application is transmitted to the data warehouse layer, which is organized into four sequential steps following a multi-layered enterprise (MLE) data warehouse architecture [65]. Initially, each system independently sends data to the landing storage component, where it is stored in raw files with a semi-structured format. Subsequently, the data undergoes flattening and normalization into a structured format and is loaded into the staging database. To preserve historical records, a further copy of the data is maintained in a dedicated historical layer. Finally, within the data warehouse, data is modeled, aggregated, and centralized into a unified view in the analytical layer. During this final stage, procedures such as encryption and masking are applied to further obfuscate sensitive information.
The final component, the data serving layer, encompasses three distinct processes, all of which can operate in parallel. For the dashboards/visualizations processes, it is assumed that systems directly consume data from the analytical layer; consequently, no additional storage layer is considered for this process. Internal transient storage mechanisms, such as in-memory storage and temporary caching, are excluded from the scope of this work. The remaining two serving processes, machine learning/data mining and data sharing, may each incorporate independent storage layers, either for persisting models used in machine learning/data mining or for maintaining exported data copies in semi-structured files or structured table formats within the data sharing component.

4.2.1. MLE Ecosystem Vulnerability Score

For each of the storage layers described in Figure 1 the vulnerability score is calculated along with the resulting ecosystem vulnerability score. The resulting values are shown, excluding detailed columnar information for brevity, in Table 1.

4.2.2. MLE Privacy Risk Expansion Factor (PREF)

For this use case, we assume the main operations of the business are conducted within the European Union with infrastructure and services designed to comply with regional data governance requirements.
The business applications are hosted on the public cloud, with two primary copies maintained in the main region (West Europe) and an additional replica for disaster recovery purposes [14]. The streaming service disaster recovery replica is located in the United States, while the other two business applications also keep their disaster recovery replicas in a data center in the EU. This creates a difference in the evaluation of the geopolitical location risk (G) metric (see Appendix B).
Each business application is configured with daily backup operations, with the resulting backups hosted in the same geolocation (G = 1.0) and an automated retention policy set to 90 days (R = 0.0). The backend video system and the subscription management system utilize relational database systems, incorporating embedded logging mechanisms that cycle logs, where data marked for deletion remains accessible until it is physically overwritten, resulting in a value of 1.0 for the log accessibility risk metric (L) for all database copies. The streaming service employs a NoSQL database system characterized by high log exposure, which also results in L = 1.0. Across all system components, role-based access control (RBAC) with automated policy enforcement mechanisms is uniformly implemented to ensure secure access management, resulting in a value of 1.0 for the access control scope (A) for the database copies. The backups, however, are stored in a location with shared access, creating a resulting value of A = 1.5 for all business applications.
For all business applications, the main and secondary replicas cannot be removed completely, resulting in a value of D = 1.0. For the streaming service database, the disaster recovery replica hosted outside the EU could be erased; however, the hosting service provides default retention for recoverability, which renders a value of D = 0.5 for this instance. All backup copies could be removed without the possibility to recover the data after removal, resulting in D = 0. Business applications depend on the presence of secondary replicas to enable failovers during updates or unforeseen faults in addition to the disaster recovery replica.
Table 2, Table 3 and Table 4 reflect the values for each of the metrics per copy and layer.
Within the data warehouse and data sharing layers, OLTP storage systems are deployed, each maintaining a single replica dedicated to disaster recovery within the European geolocation; logs for these systems are not accessible and are configured not to retain deleted information after deletion. In addition, the warehouse and sharing databases are configured with automated weekly backups subject to a 30-day retention policy. Data erasure resistance is high across all three business applications, ensuring resilience against data loss, whereas the warehousing and data serving systems demonstrate lower data erasure resistance, given that these systems can be reconstructed if necessary. With the exception of the landing layer, which has been configured for recoverability in case data is removed (as it holds historical raw data from which all the subsequent layers can be reloaded), resulting in D = 0.5 for its secondary copy, and the historical layer, which is configured to maintain a secondary copy that cannot be completely removed due to business constraints (generating D = 1.0), the rest of the warehouse secondary or backup copies result in D = 0.0.
Both the landing and the sharing storage layers result in R = 0.5 for the backup copy, as the retention policies are manually, not automatically, enforced. Details and resulting PREF scores for each of the warehouse and sharing systems are available in Table 5, Table 6, Table 7, Table 8 and Table 9.
An overview of the resulting calculations evaluating PREF are shown in Table 10.

4.2.3. MLE Privacy Exposure Index (PEI)

The overview of the resulting privacy exposure index (PEI) for all layers, including the ecosystem PEI, is available in Table 11.
While the business application layers (streaming service, subscription management service, and backend streaming hosting service) have relatively modest VS scores, they exhibit the highest PREF values. This reflects the operational need for multiple persistent, often deletion-resistant, copies to ensure system availability, failover support, and responsiveness. In contrast, the data warehouse layers, such as the staging, historical, and analytical layers, demonstrate lower PREF scores, as they are less critical to real-time operations, and some can be reconstructed from upstream data, reducing the need for long-term retention.
Importantly, the landing layer stands out with the highest PEI, despite having a lower PREF score than the business applications. This is due to its very high VS, driven by the aggregation of raw and unfiltered data from all source systems. The landing layer thus represents the most exposed component in the architecture, not because of excessive replication, but because of the nature and sensitivity of the data it holds at an early stage. This underscores how architectural context, not just data duplication, plays a pivotal role in privacy exposure and highlights the need for early-stage mitigation strategies.

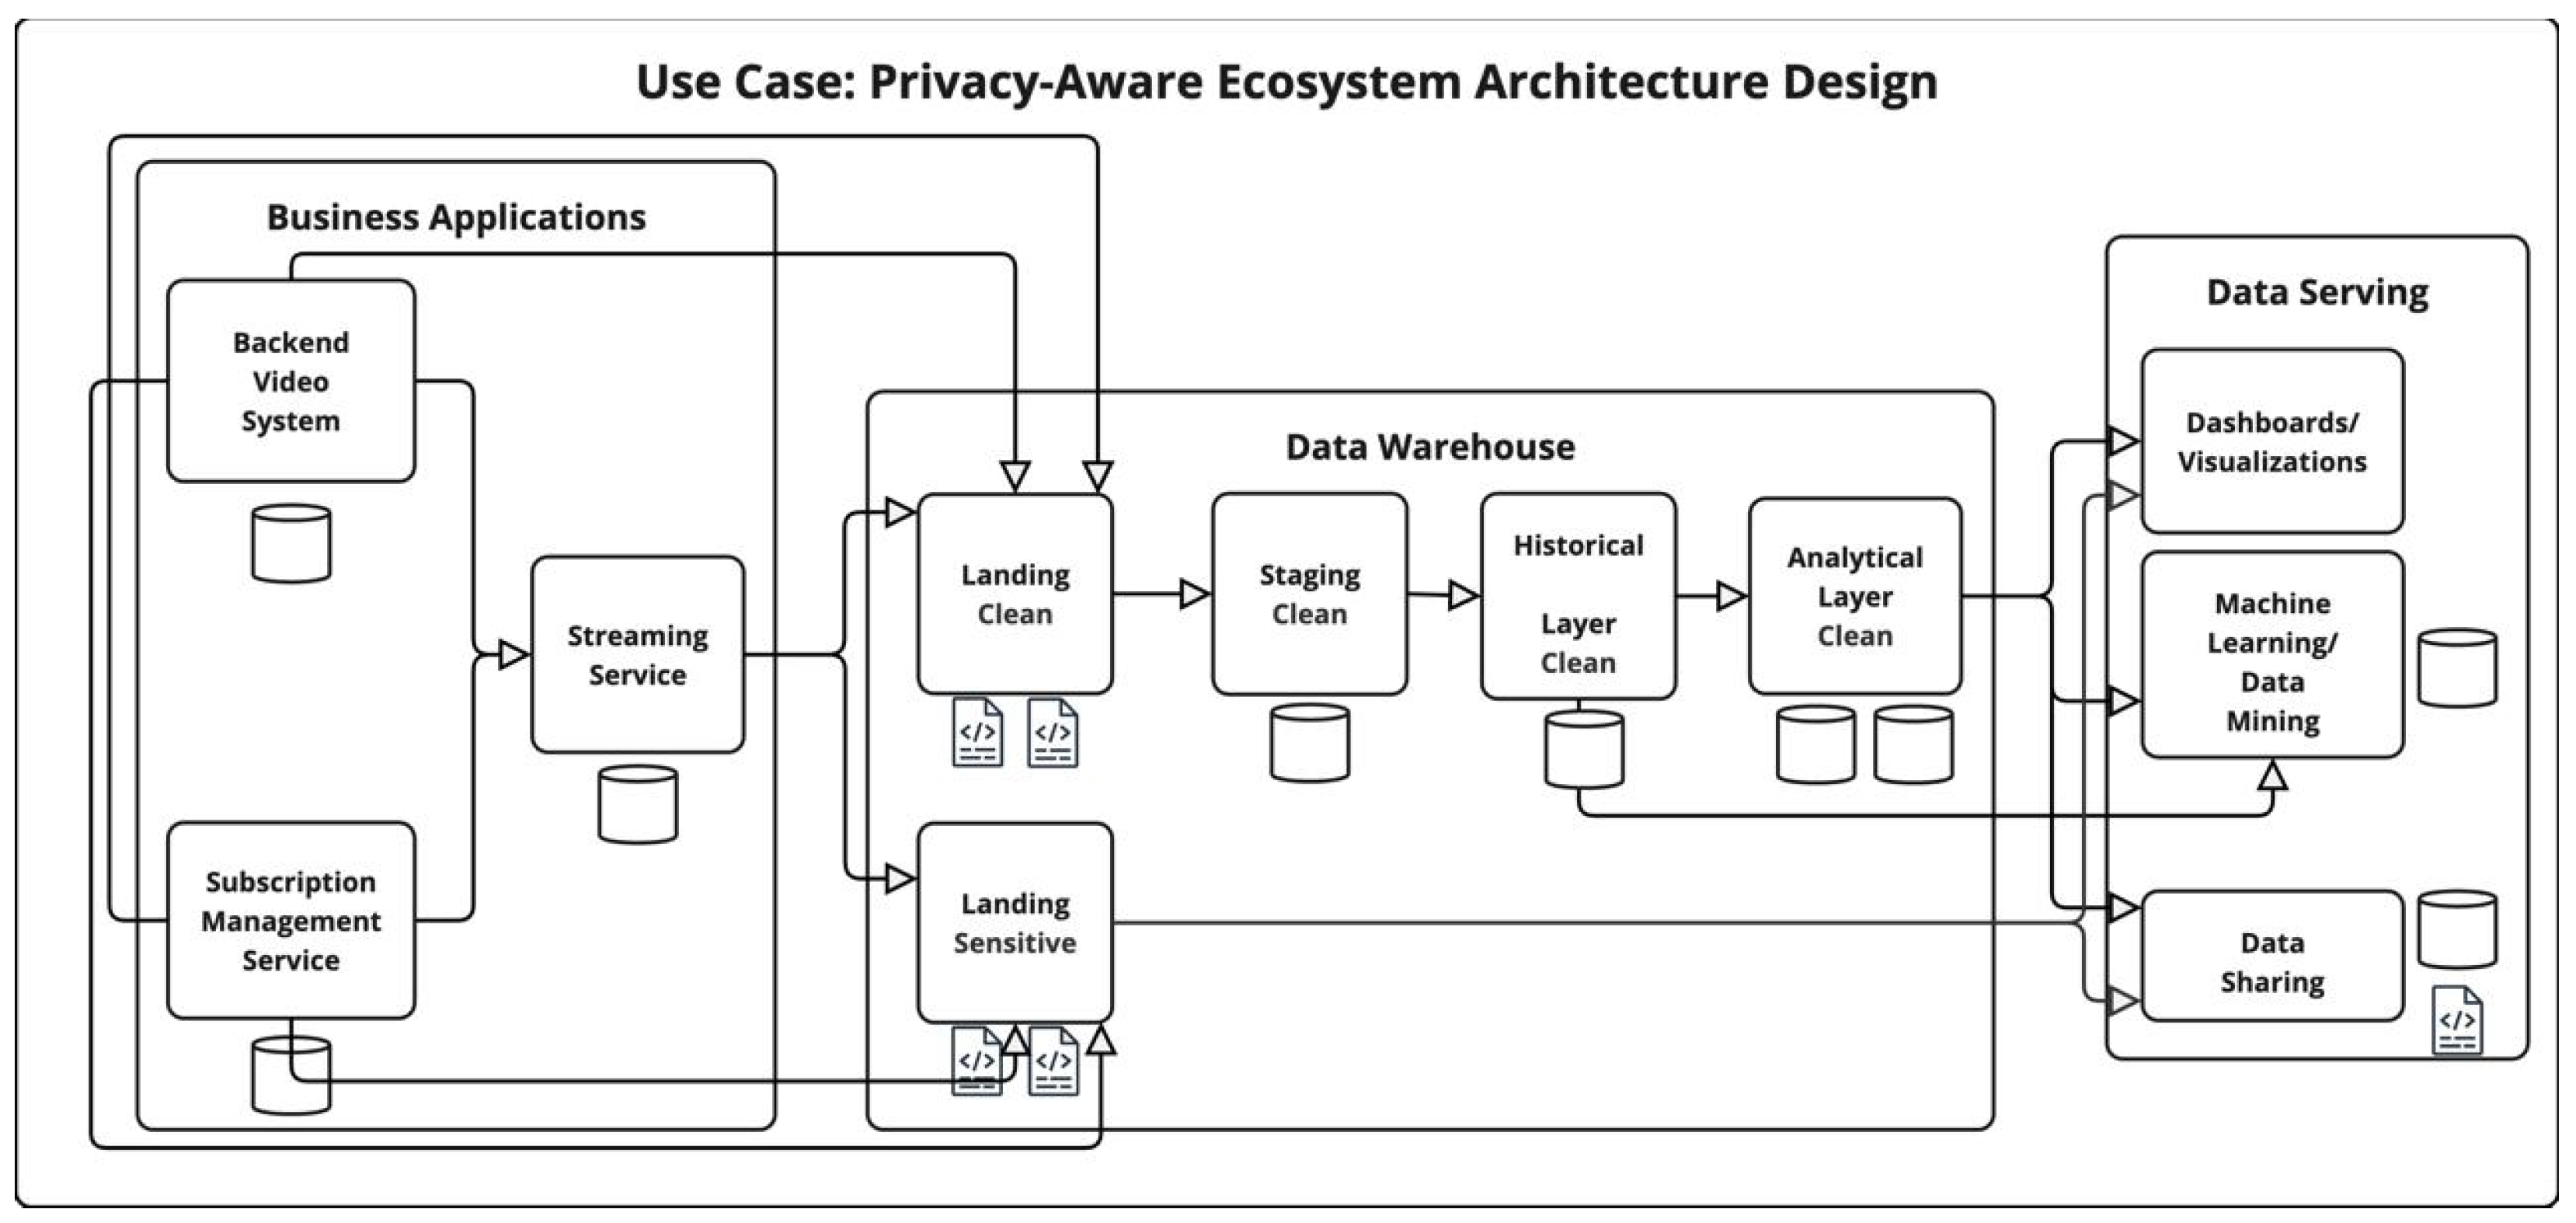
4.3. VOD—Privacy-Aware Ecosystem Architecture Design

In the privacy-aware ecosystem architecture design (PAE), a dedicated warehousing layer is integrated to support analytical and operational needs while ensuring stringent data protection measures. In the initial stage, the traditional landing layer is divided into two distinct storage spaces: a clean landing layer and a sensitive landing layer. The sensitive landing layer stores the complete raw datasets, including sensitive information, whereas the clean landing layer retains only the non-sensitive portions of the incoming data. This architectural separation facilitates a privacy-aware approach by ensuring that all subsequent transformations, processing, and storage operations within the warehousing layer are based exclusively on non-sensitive data. Sensitive data is accessed directly from the sensitive landing layer only when absolutely necessary, thus minimizing the exposure and duplication of sensitive information across other system components. Serving layers consume non-sensitive data by default, with direct interaction with sensitive data being tightly controlled and limited. Although this design introduces additional storage complexity, it enhances data privacy and results in varying levels of data vulnerability depending on the sensitivity and accessibility of each storage space. An overview of the architectural design and data flow is available in Figure 2.

4.3.1. PAE Ecosystem Vulnerability Score

The resulting vulnerability scores for each layer in the privacy-aware architecture are available in Table 12.

4.3.2. PAE Privacy Risk Expansion Factor (PREF)

The resulting PREF for the design of privacy-aware ecosystem (PAE) is shown in Table 13.

4.3.3. PAE Privacy Exposure Index (PEI)

The privacy exposure index (PEI) calculations are shown in Table 14.

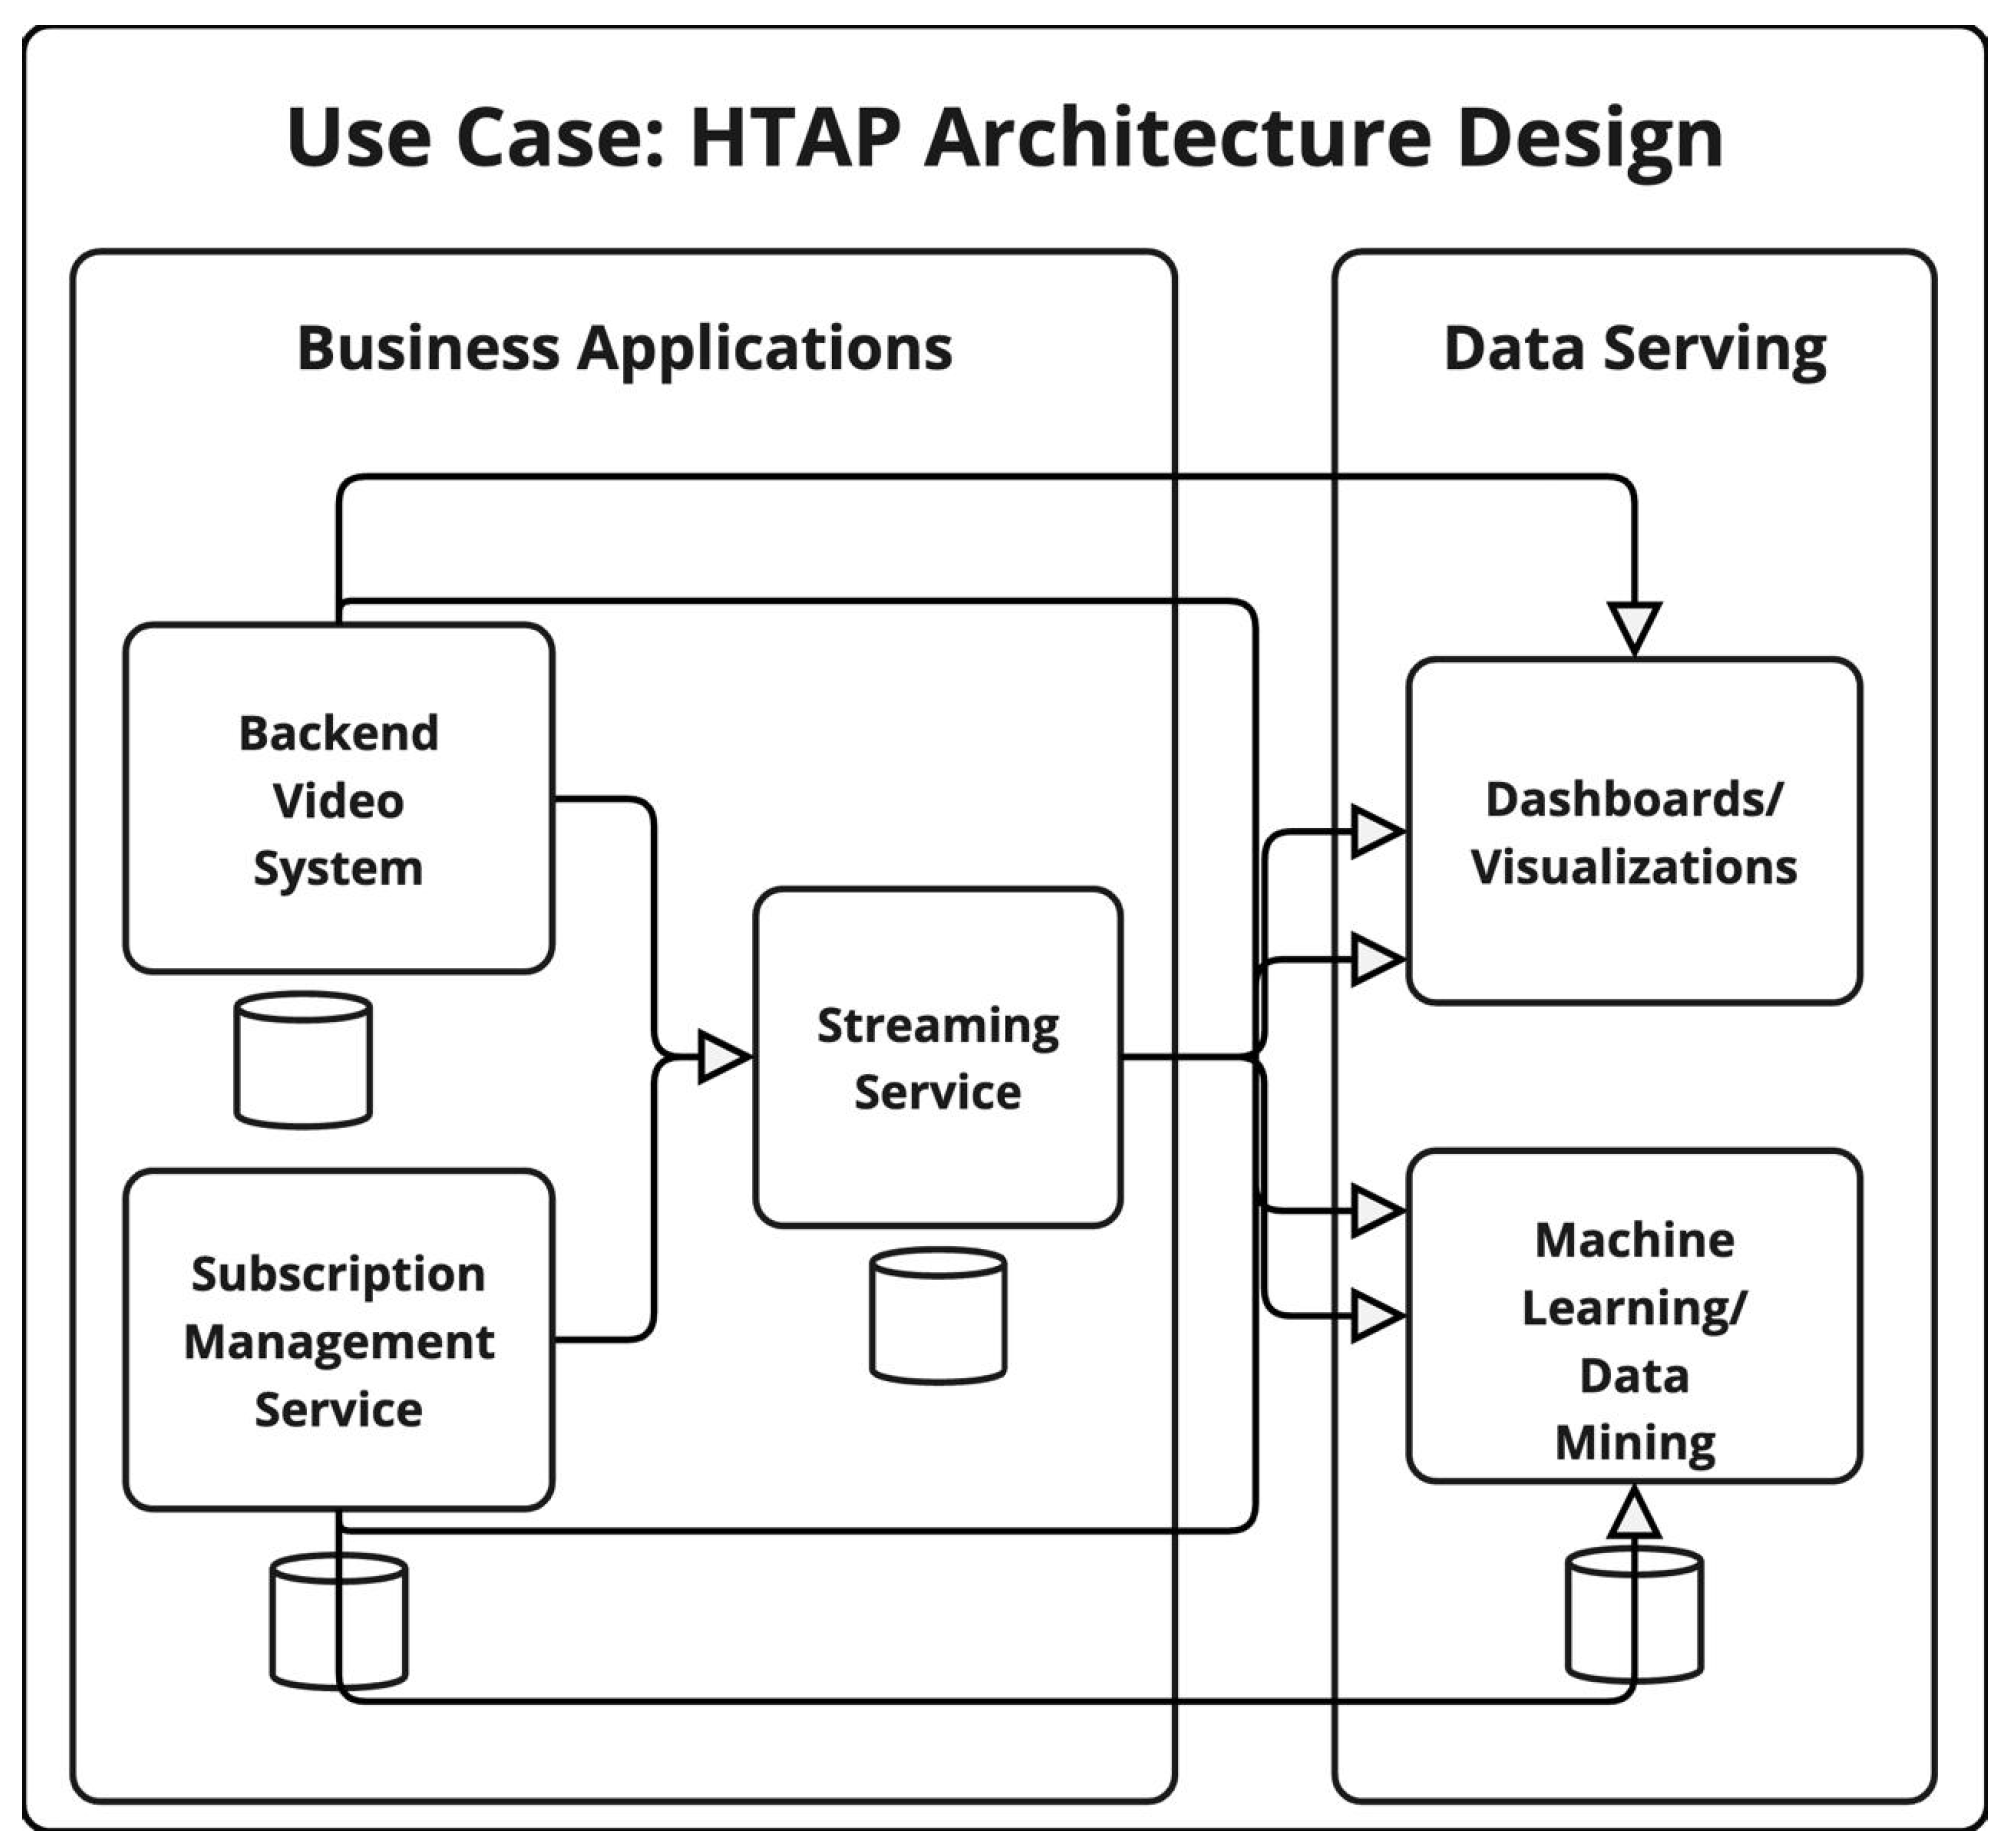
4.4. VOD—HTAP Ecosystem Architecture Design

In the proposed hybrid transactional/analytical processing (HTAP) architecture, NewSQL storage systems are utilized for all business application systems to enable seamless support for both transactional and analytical workloads within a single database layer. This eliminates the need for additional warehousing storage layers that are traditionally required to provide analytics capabilities for data serving processes [66,67,68]. While this architecture is intended to provide the ability to conduct analysis in real-time, it also lacks historical data.
The architectural setup follows a configuration similar to the previously introduced designs, maintaining consistent parameters regarding the number of replicas, geographical deployment and hosting [69], backup strategies, access control mechanisms, logging configurations, and retention policies. In alignment with the methodological boundaries established for this study, within which metrics are not evaluated for nonpermanent storage layers, no metric evaluations are conducted for the data serving components in this architecture. An overview of the architecture is shown in Figure 3.

4.4.1. HTAP Ecosystem Vulnerability Score

The calculations for the vulnerability scores of the proposed architecture are available in Table 15.

4.4.2. HTAP Privacy Risk Expansion Factor (PREF)

The resulting PREP for the design of an HTAP ecosystem is shown in Table 16.

4.4.3. HTAP Privacy Exposure Index (PEI)

The privacy exposure index (PEI) calculations are shown in Table 17.

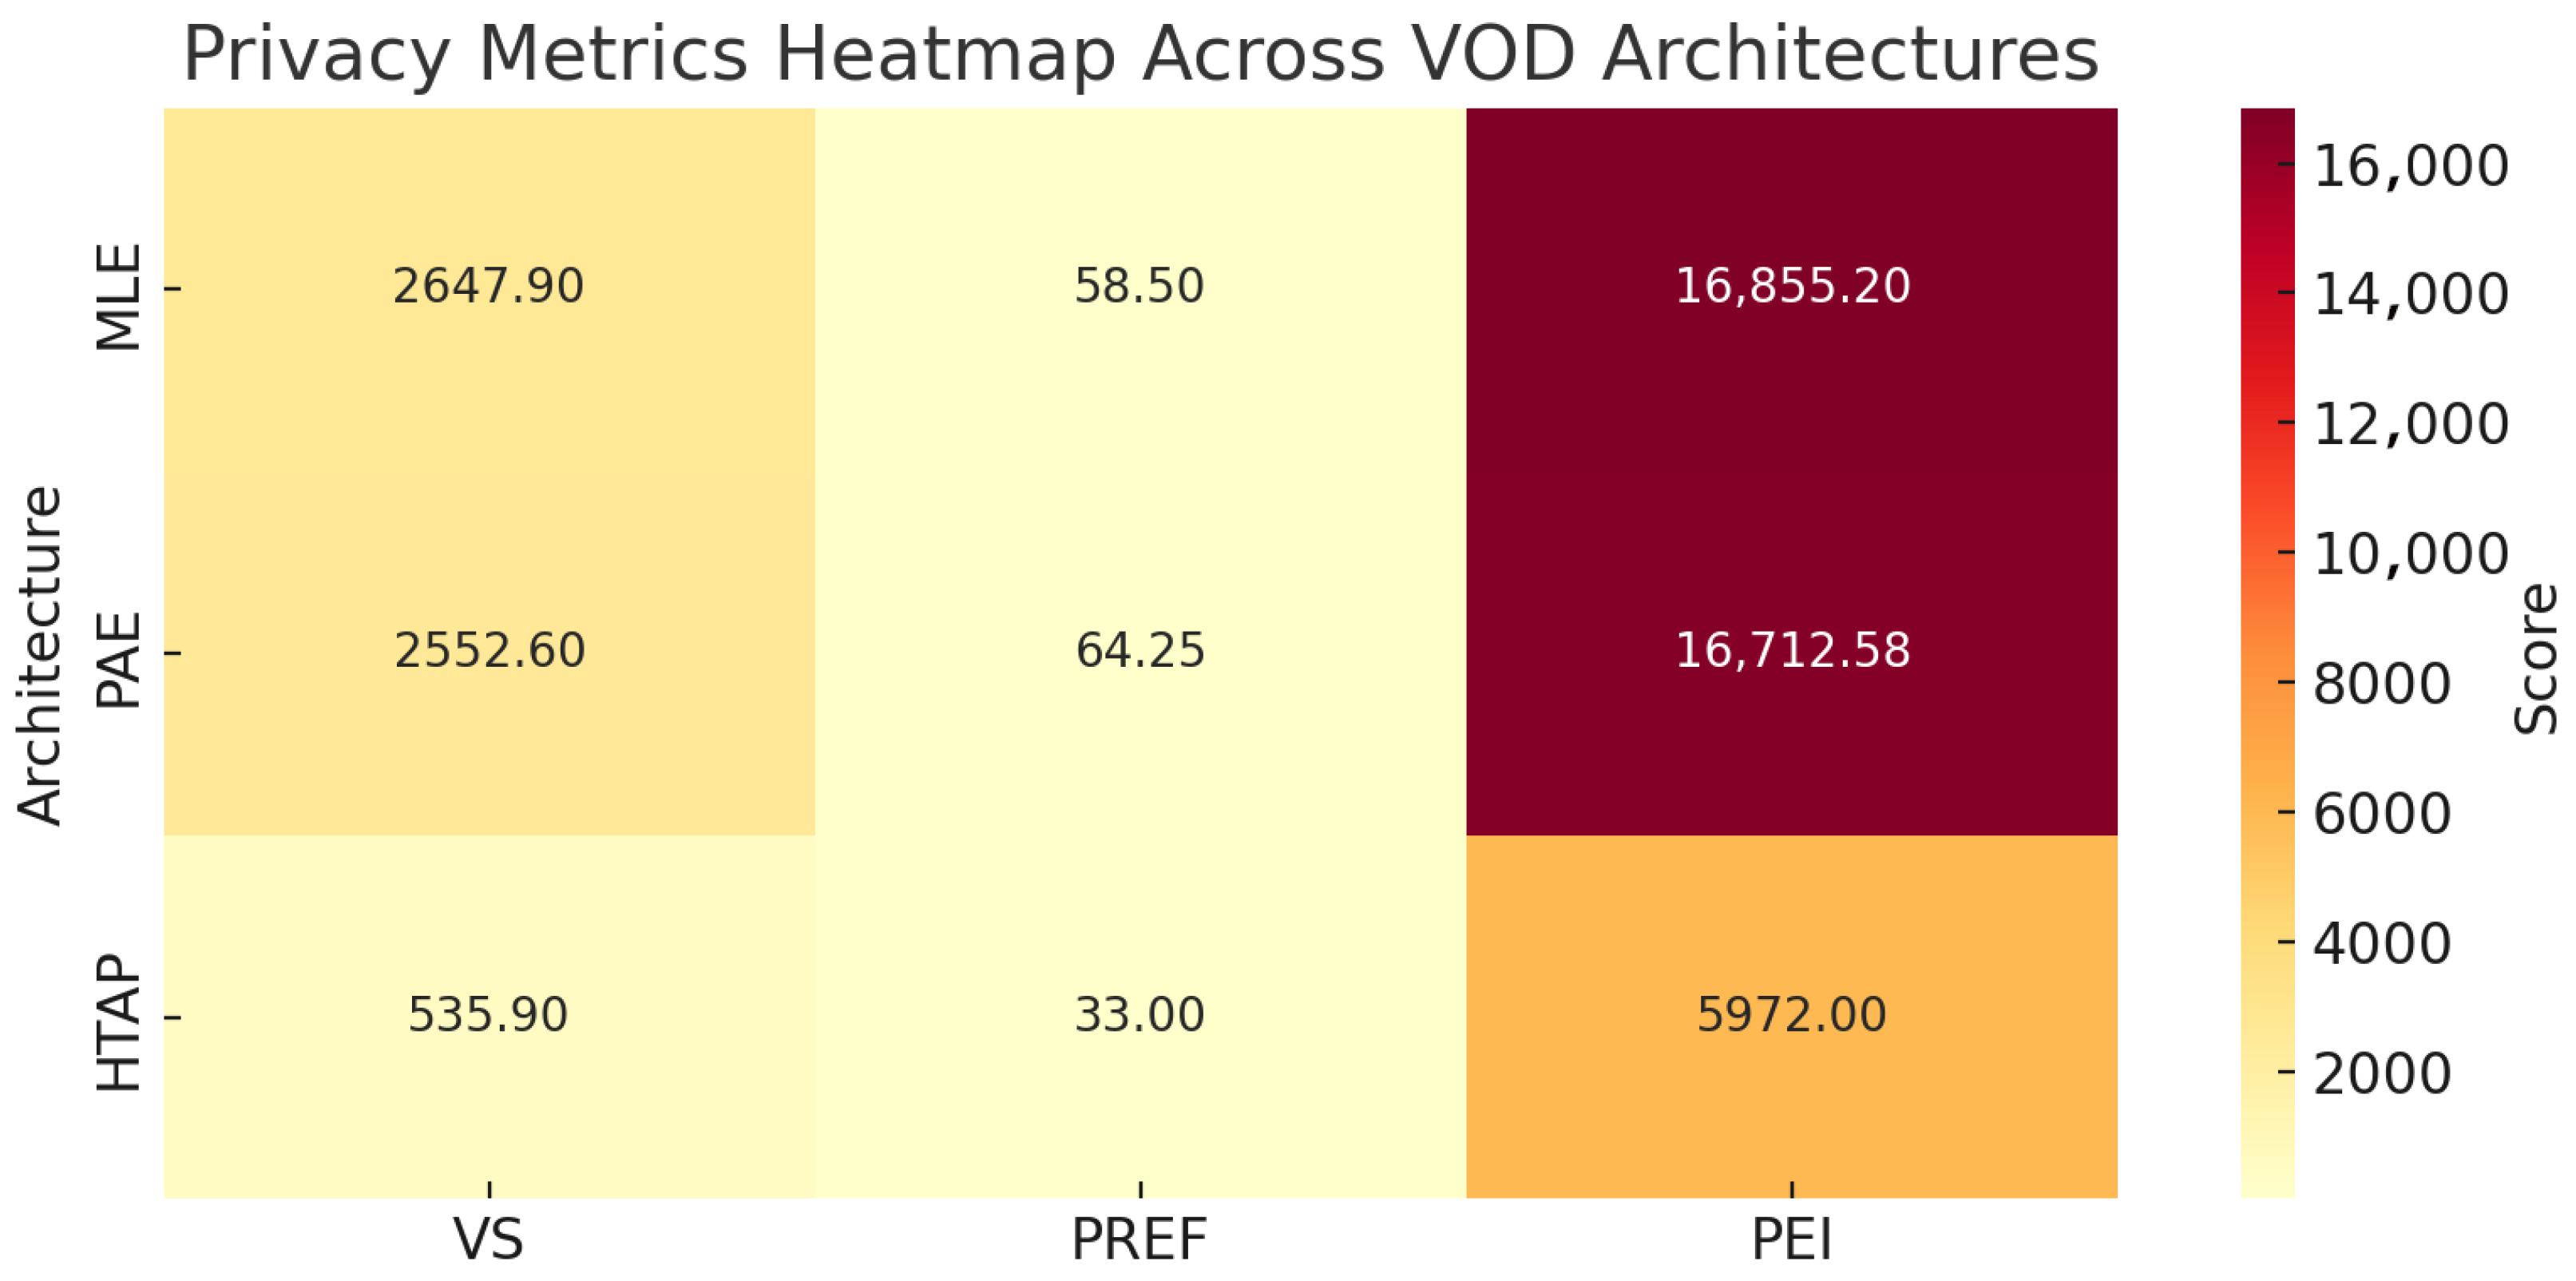
4.5. VOD Use Case Evaluation and Discussion

The results of the VOD use case (Figure 4) highlight how architectural choices shape privacy outcomes through measurable impacts on the privacy exposure index (PEI), privacy risk exposure factor (PREF), and vulnerability score (VS). As shown in Table 18, these metrics, while not absolute indicators, offer practical insight into how data modeling and system design affect exposure and privacy vulnerability. MLE exhibits the highest values across all three metrics, reflecting the cost of high-duplication and high-availability configurations. HTAP, with minimal redundancy and centralized processing, shows significantly lower exposure indicators. PAE offers a middle ground, balancing separation and sensitivity management. Collectively, these metrics can serve as analytical and design instruments for assessing how modifications to architectural configurations or dataset characteristics influence data exposure and vulnerability risk, thereby supporting informed decision-making in privacy-oriented system design.

4.6. IoT Room Cooling Ecosystem

This IoT room cooling use case presents a set of sensor data commonly found in smart environmental cooling systems. The columns used in this particular use case are the controller, sensor, and room IDs, along with the temporal data and sensor values. Sensor data is transmitted to cloud storage to be persisted and analyzed.

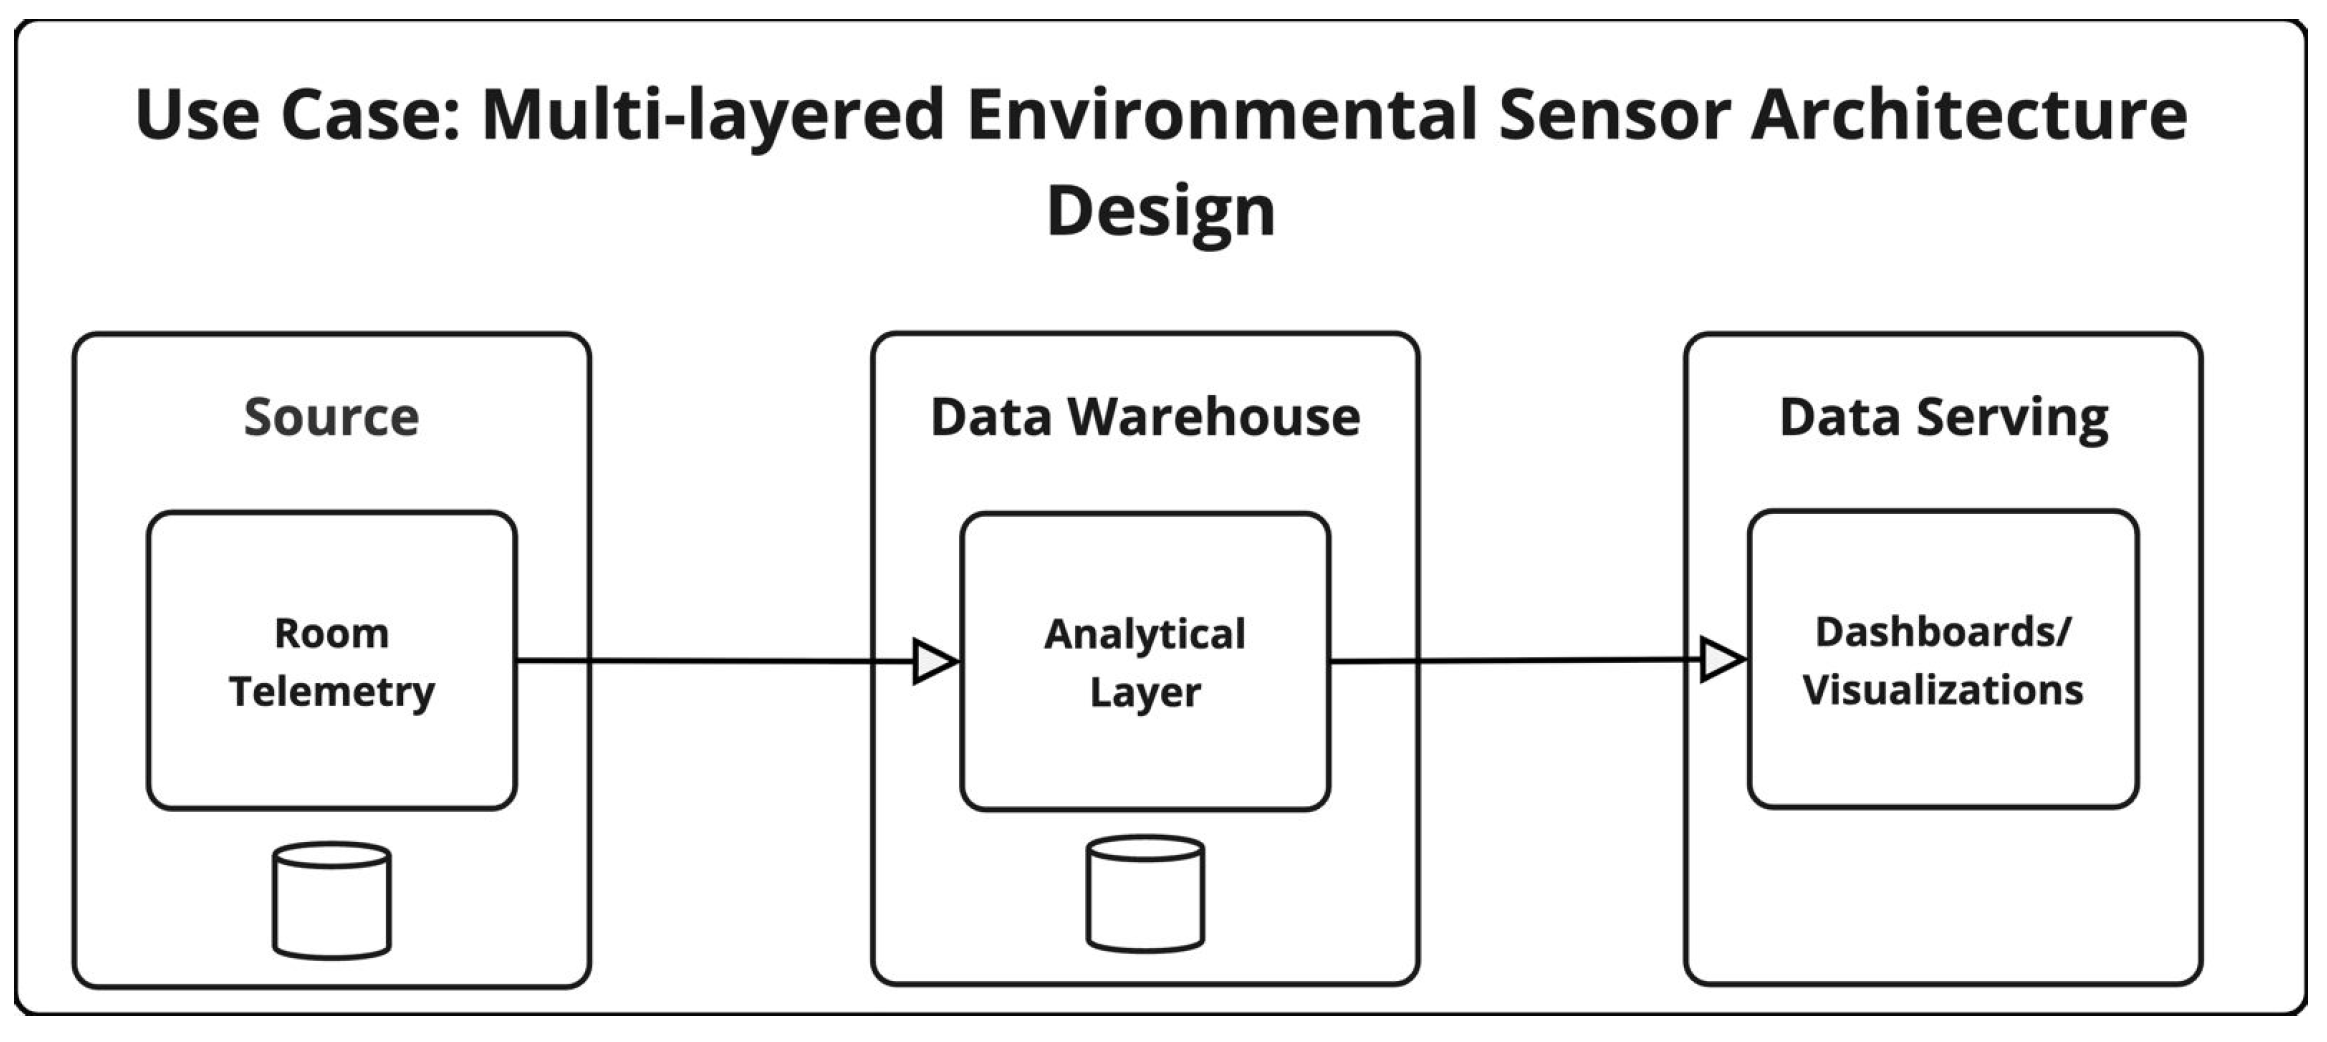
4.7. IoT—Multi-Layered Environmental Sensor Ecosystem Architecture Design

The architecture of this IoT environmental sensor system involves multiple stages of data handling that influence its privacy exposure. Sensor data, including identifiers, environmental readings, and occupancy metrics, are first collected locally and transmitted to a centralized time series database in the cloud for real-time storage. From there, the data is duplicated into a separate data analysis database where it is aggregated and processed for insights on smart cooling and room usage. The source database for the room telemetry is configured to have two replicas and one daily backup with automated retention, whereas the analytical layer is configured to have three replicas (this includes a disaster recovery replica) and a daily backup with strict enforcement of retention. A visual overview of the MLES architecture is available in Figure 5.

4.7.1. MLES Ecosystem Vulnerability Score

The resulting vulnerability score for the persistent data layer in the multi-layered environmental sensor architecture is available in Table 19.

4.7.2. MLES Privacy Risk Expansion Factor (PREF)

The resulting PREP for the proposed design of the multi-layered environmental sensor ecosystem (MLES) is shown in Table 20.

4.7.3. MLES Privacy Exposure Index (PEI)

The privacy exposure index (PEI) calculations are shown in Table 21.

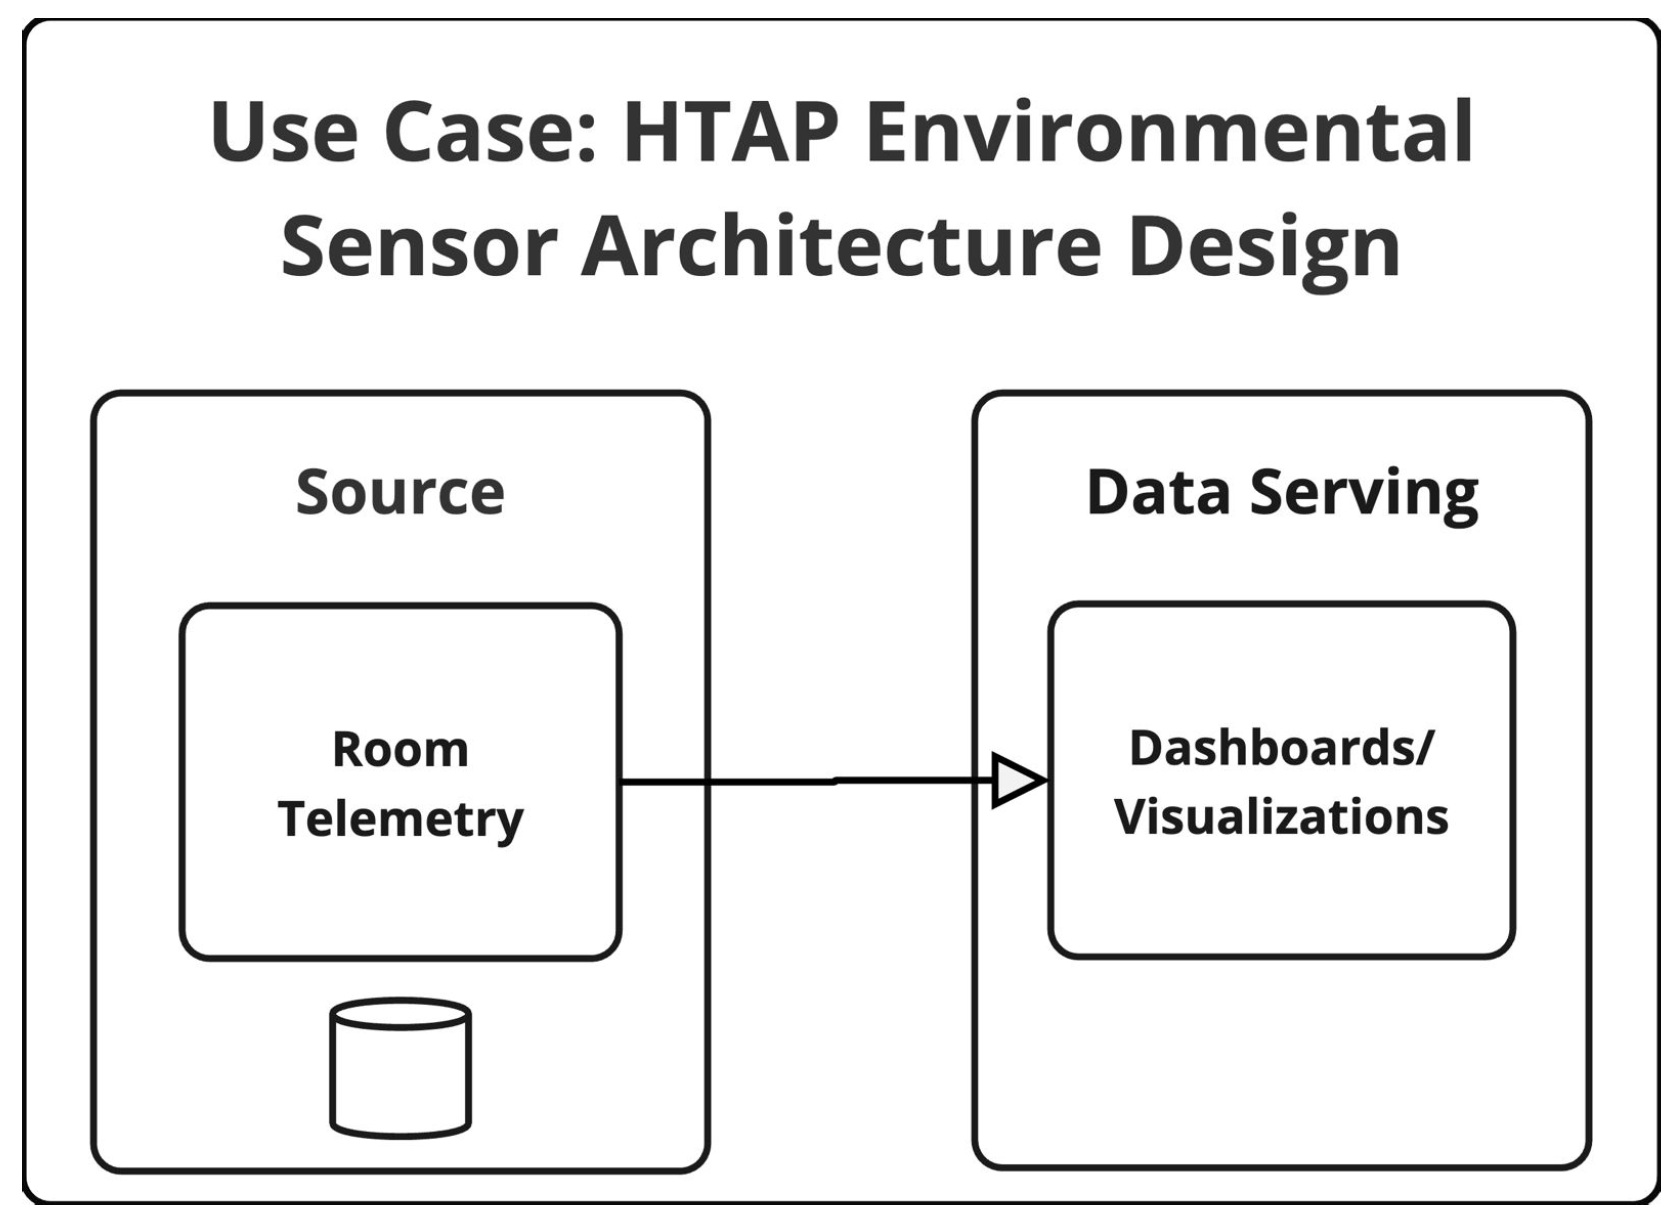
4.8. IoT—HTAP Environmental Sensor Ecosystem Architecture Design

The proposed architecture of this IoT environmental sensor system involves only one stage of data handling. Data is transmitted to a centralized cloud-based HTAP (hybrid transactional/analytical processing) storage system. This HTAP database supports both high-throughput ingestion of real-time sensor streams and low-latency analytical queries, enabling direct access for monitoring dashboards and analytical applications without the need for duplicating or moving data into a separate analytical layer. By consolidating transactional and analytical processing within the same infrastructure, the architecture minimizes data replication, reduces architectural exposure points, and supports efficient privacy risk management. An overview of the proposed HTAP architecture is available in Figure 6.

4.8.1. HTAPS Ecosystem Vulnerability Score

The resulting vulnerability score for the persistent data layer in the environmental sensor architecture is available in Table 22.

4.8.2. HTAPS Privacy Risk Expansion Factor (PREF)

The resulting PREP for the proposed design of the HTAP architecture is shown in Table 23.

4.8.3. HTAPS Privacy Exposure Index (PEI)

The privacy exposure index (PEI) calculations are shown in Table 24.

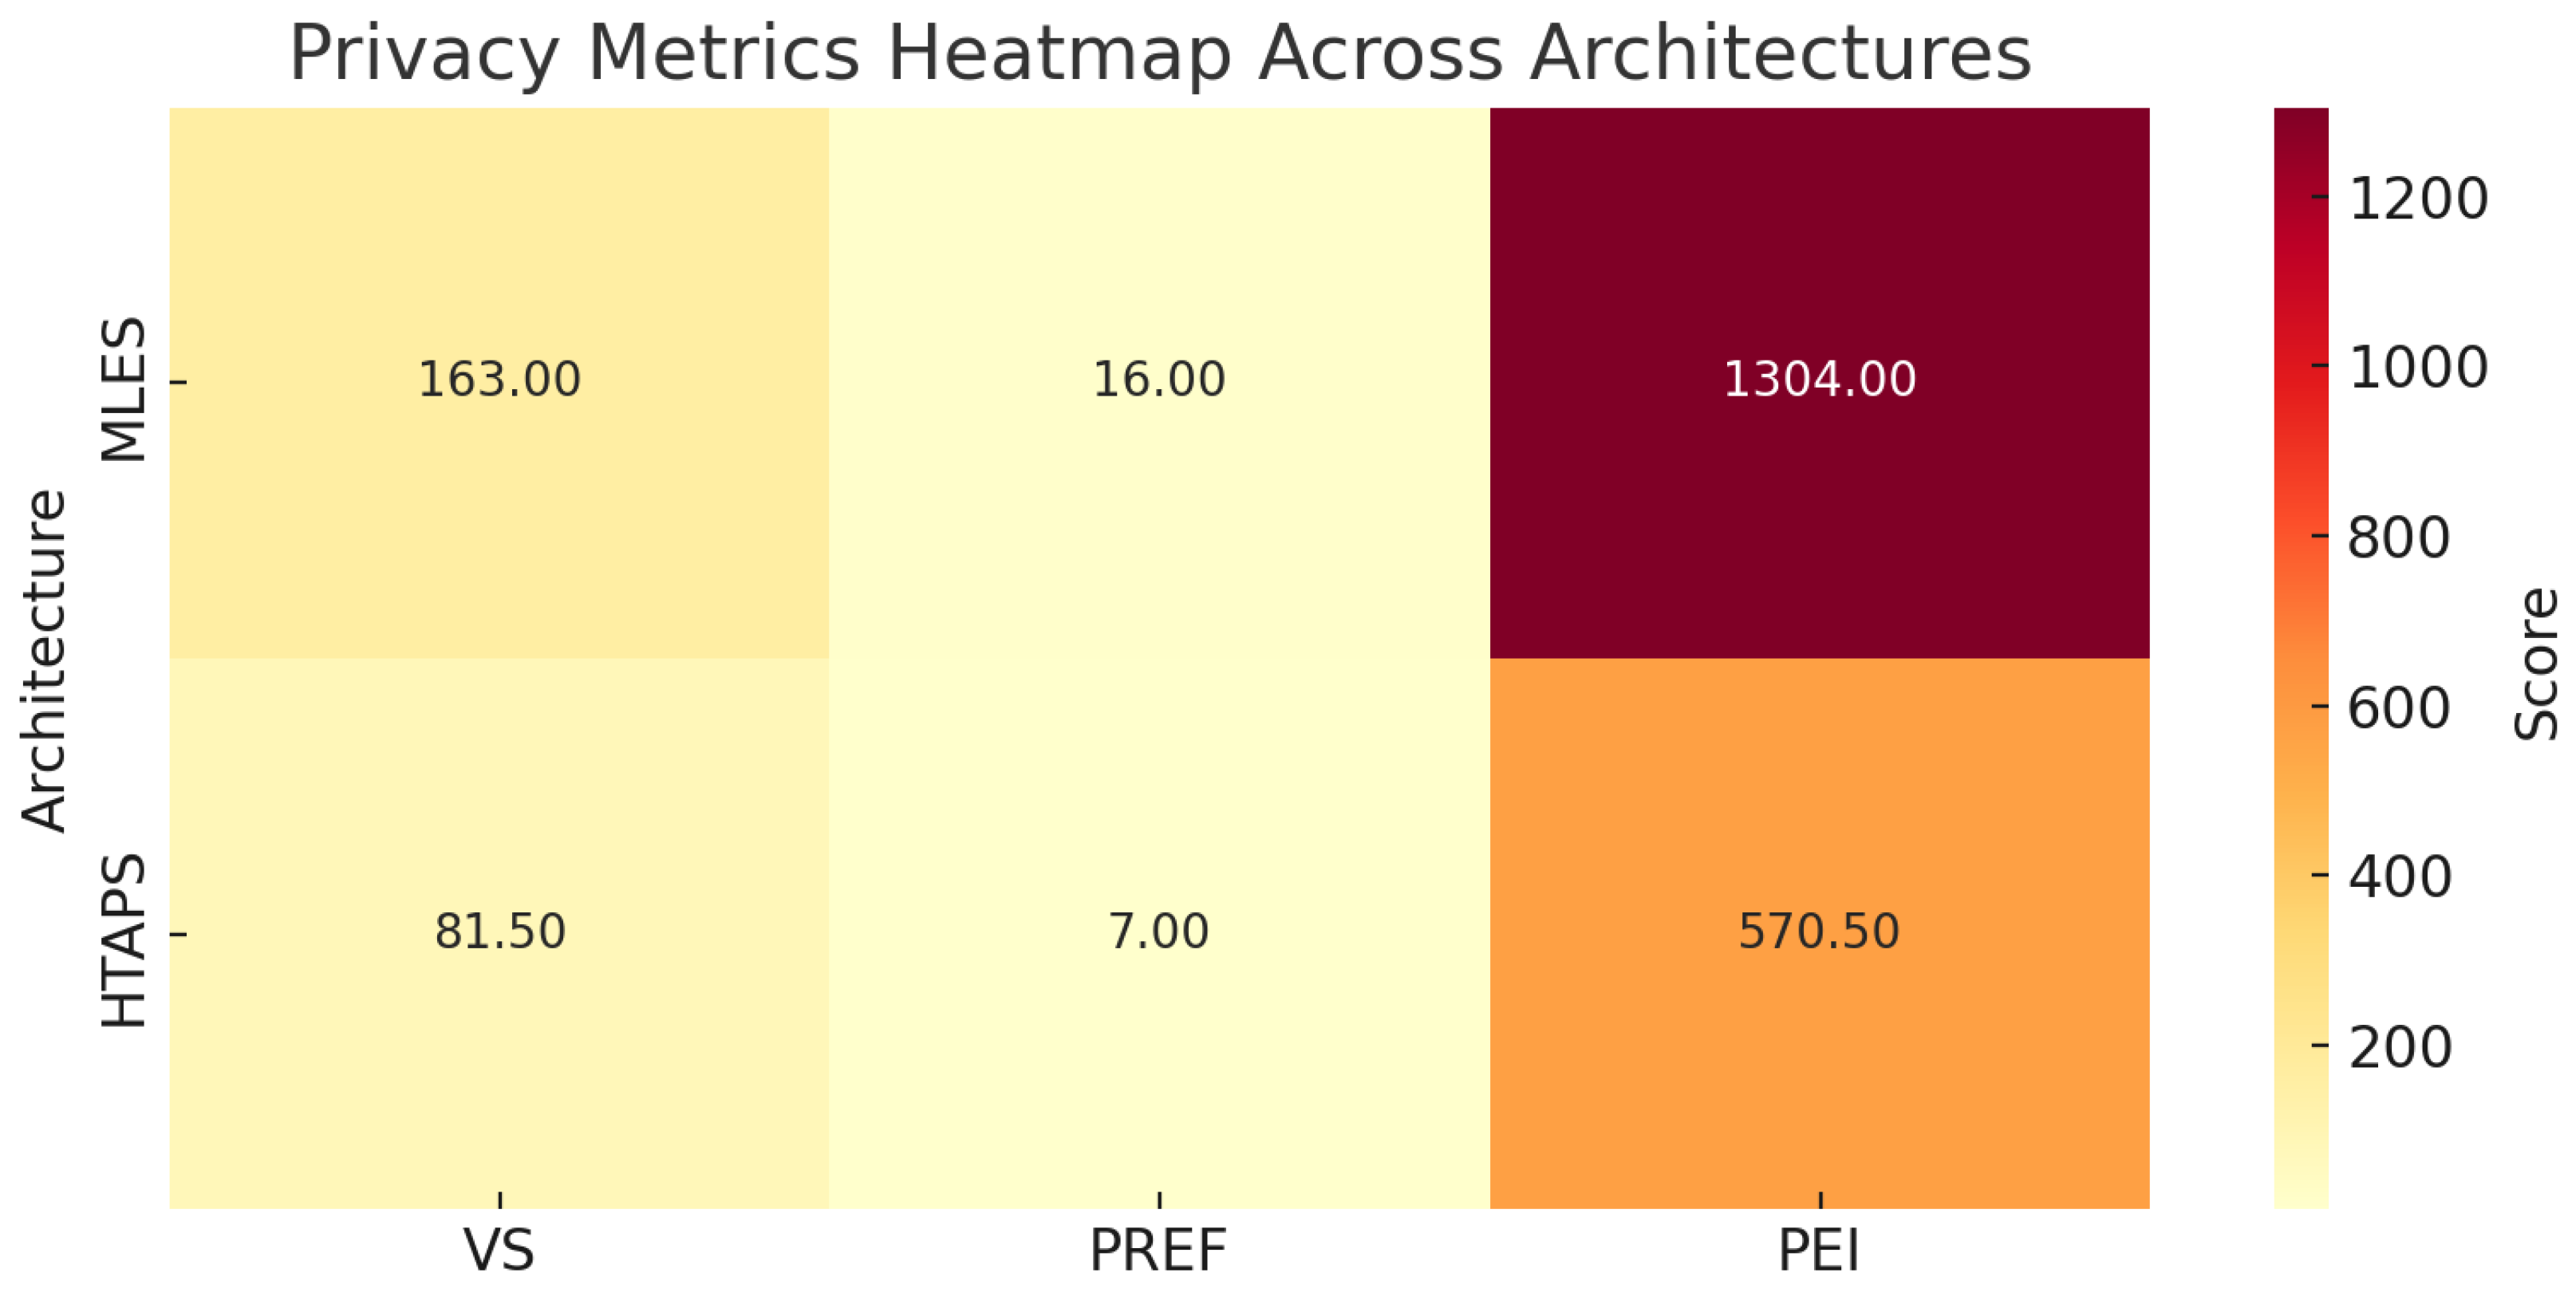
4.9. IoT Use Case Evaluation and Discussion

The analysis in Table 25 shows how PREF and PEI offer practical metrics for informing architectural decisions. While not absolute indicators, they help quantify privacy and exposure risks. As shown in Figure 7, MLES scores higher due to data replication and backups, reflecting greater exposure despite benefits like high availability and disaster recovery. HTAP, with lower PREF and PEI, reduces risk through minimal data movement, though it may sacrifice analytical flexibility and performance. These metrics support more informed trade-offs between resilience, efficiency, and privacy in architectural design.

5. Results

The computational analysis across the use case scenarios shows that even when data types are uniform within an architectural layer, exposure risk varies significantly based on architectural design. In classic warehousing setups, where data is repeatedly copied across multiple layers, the vulnerability score (VS) rises due to increased exposure points. While VS highlights where sensitive data resides, the privacy risk expansion factor (PREF) adds context by capturing how architectural configurations such as duplication, persistence, and geolocation amplify exposure. Combined, they form the privacy exposure index (PEI), offering a quantifiable, though not absolute, measure of relative exposure risk.
The comparative analysis highlights how PREF and PEI provide actionable insights into the privacy trade-offs of architectural choices. For instance, privacy-aware designs reduce overall exposure by limiting the propagation of sensitive data, reflected in a lower PEI. However, their layered structure sustains a moderate PREF, indicating residual architectural complexity. Conversely, the two proposed HTAP configurations achieve the lowest PREF and PEI values by minimizing data replication and movement, demonstrating an efficient, low-exposure approach. However, while these architectures can be highly effective in reducing exposure and data duplication, they may be less suitable for systems requiring extensive historical data retention or those with intensive analytical workloads, where HTAP’s unified processing model could introduce performance constraints.
While these metrics do not measure exposure in absolute terms, they enable early-stage, data-agnostic evaluations of design alternatives. As illustrated in Table 18 and Table 25, PREF and PEI help quantify relative risk expansion and data exposure and guide the development of privacy-conscious architectures.

6. Discussion

The results presented in this work demonstrate the potential of the proposed methodology to quantitatively assess exposure risks across varying data architectures and types through metrics such as the privacy risk expansion factor (PREF), the vulnerability score (VS), and the privacy exposure index (PEI). These metrics offer a structured and objective foundation to evaluate how architectural and data-handling choices affect the exposure and propagation of sensitive information across systems.
However, the framework also has several known limitations. First, it operates under the assumption of static inputs—governance, access, and replication parameters are treated as fixed, while in practice these attributes evolve over time. Without dynamic and continuous recalibration, this can lead to inaccuracies in the evaluated risk profile. Additionally, the current metric ranges and weightings are heuristic, lacking empirical calibration against historical incident data or observed breach patterns.
Future work could address these challenges through multiple avenues. Incorporating time-aware or dynamic variants of PREF and PEI could enable the framework to reflect evolving system topologies and retention behaviors. Integration with automated tools for architecture analysis and data discovery would support continuous risk assessment and reduce the manual burden of computation. Further, future work could focus on empirically calibrating these values through real-world breach datasets, expert risk assessment surveys, and controlled audit-based validations. As privacy threats grow in complexity, expanding the framework to include inter-copy correlation modeling and attacker profiling could be a good avenue for capturing the full scope of system vulnerability.
Furthermore, future research could address the challenges that arise from dynamic and distributed data ecosystems, where components, data flows, and exposures constantly evolve. Developing comprehensive dashboards and visualization frameworks to interpret real-time metrics would also be instrumental in translating technical assessments into actionable insights.

7. Conclusions

This work introduces two new privacy assessment metrics, the privacy risk expansion factor (PREF) and the privacy exposure index (PEI), which build on and complement existing approaches to data vulnerability, particularly the previously established vulnerability score (VS) for data content. Together, these metrics provide a more comprehensive framework for evaluating privacy risks in data architecture designs. PREF captures the impact of architectural complexity on the spread and exposure of data, while PEI integrates content vulnerability with architectural exposure into a single, interpretable index. By combining these aspects, the methodology supports a more systematic identification of privacy risks across different layers and stages of data processing.
The contribution of this work lies in formalizing the interplay between data contents and architectural configurations that further expose the data contents, offering objective metrics that can guide the design and evaluation of privacy-aware systems from an early stage. The proposed approach facilitates comparative analysis between architectures, highlighting how different design choices affect privacy exposure. Moreover, it lays the groundwork for future research into dynamic, real-time privacy risk monitoring and AI-driven privacy assessment tools. By extending static assessments with adaptable metrics, this framework supports the development of more resilient and privacy-preserving data ecosystems.

Author Contributions

Conceptualization, I.C. and R.E.; methodology, I.C.; validation, I.C., R.E., E.P., D.D., A.A. and O.M.; formal analysis, I.C.; investigation, I.C.; resources, I.C.; data curation, I.C.; writing—original draft preparation, I.C.; writing—review and editing, I.C.; visualization, I.C.; supervision, I.C. and O.M.; project administration, I.C.; funding acquisition, O.M. All authors have read and agreed to the published version of the manuscript.

Funding

This work was supported by a grant from the Romanian National Authority for Scientific Research and Innovation, CCCDI—UEFISCDI, project number ERANET-M-3-ERANET-REPLACER 17/2024, within PNCDI IV. This work is also supported by the project “Collaborative Framework for Smart Agriculture”—COSA, which received funding from Romania’s National Recovery and Resilience Plan PNRR-III-C9-2022-I8, under grant agreement 760070. This research has also been supported by the CLOUDUT Project, cofunded by the European Fund of Regional Development through the Competitiveness Operational Programme 2014–2020, contract no. 235/2020.

Institutional Review Board Statement

Not applicable.

Informed Consent Statement

Not applicable.

Data Availability Statement

The raw data supporting the conclusions of this article will be made available by the authors upon request.

Conflicts of Interest

The authors declare no conflicts of interest.

Abbreviations

The following abbreviations are used in this manuscript:
AIArtificial intelligence
CCPACalifornia Consumer Privacy Act
CVSSCommon vulnerability scoring system
ENCDEncoded data metric
ENCREncrypted data metric
EXPLExploitability data metric
GDPRGeneral Data Protection Regulation
HPIPersonal information data metric
HSISensitive/secret information data metric
HNSNested sensitive information data metric
HUSUnstructured sensitive/secret information data metric
HTAPHybrid transactional/analytical processing
IoTInternet of Things
LLMLarge language model
MASKMasked data metric
PbDPrivacy by design
PEIPrivacy exposure index
PETPrivacy-enhancing technologies
PIIPersonal identifiable information
PREFPrivacy risk expansion factor
SMPCSecure multi-party computation
TEETrusted execution environment
VSVulnerability score

Appendix A. Access Control Scope Score

The access control scoring metric (A) provides a structured approach to evaluating the strength of access control mechanisms within a system. Lower values indicate stronger, more granular and auditable enforcement, while higher values reflect weaker or absent controls. While the Table A1 offers representative categories, assessors may assign intermediate scores to capture edge cases or hybrid implementations, provided they stay within the defined bounds. This flexibility supports more precise evaluation across diverse architectural contexts.
Table A1. A Access control scope score.
ValueAccess Control LevelExamples
1.0Strong Access ControlRole-based access control (RBAC) with
automated enforcement, attribute-based
access control (ABAC), database-level
row/column restrictions, just-in-time (JIT)
access with expiry and audit trails
1.5Moderate or Weak Access ControlSingle access role for multiple users,
stale or unrevoked access rights, lack
of context-aware or fine-grained policies
2.0Minimal or No Access ControlShared or hardcoded credentials,
no access logging or monitoring,
anonymous or unrestricted access

Appendix B. Geopolitical Location Risk Score

The geopolitical location risk score (G) offers a structured lens for assessing the privacy and legal exposure associated with where data is physically and jurisdictionally hosted. Lower values represent low-risk environments, typically jurisdictions with strong privacy laws and regulatory alignment while higher values denote settings with weak protections or legal conflicts. While the categories in Table A2 provide clear guidance, assessors may apply intermediate scores to account for hybrid or evolving legal contexts that are relevant to the internal policies and jurisdictional considerations.
Table A2. G Geopolitical location risk score.
ValueGeopolitical Risk LevelExample
1.0Low RiskData hosted in jurisdictions with strong privacy
robust enforcement, and strong alignment with
the data owner’s legal and operational base.
(on premises, private, or public cloud: legally under
full control of the data owner’s organization)
2.0High RiskData located in or accessible from jurisdictions with
extraterritorial surveillance laws, weak privacy
enforcement, or conflicting legal systems.
Providers in non-adequate countries
without contractual/legal protections.

Appendix C. Retention and Life Cycle Policy Compliance Score

Table A3 lists possible values for retention and life cycle policy compliance (R). R represents the extent to which the data copy adheres to defined data retention and deletion policies. Even if data is erasable, retention policies dictate how long the copy persists. If there is no automated expiration, the copy might live indefinitely. Higher values indicate weaker or absent policy enforcement, increasing the risk of prolonged or unnecessary data storage and exposure. The value 0 can be used for cases where automatic retention policies are irrelevant, such as for primary copies stored in operational data systems, under the ‘Not Applicable’ category.
Table A3. R Retention and life cycle policy compliance score.
ValuePolicy Enforcement LevelExample
0.0Strictly enforced or
Not Applicable
Automated deletion based on policy;
retention schedules enforced by system;
temporary or read-only data copies not subject
to policy due to non-persistence; Not Applicable
0.5Partially enforced policyRetention policy defined but
dependent on manual enforcement;
risk of human error or delays in deletion
1.0Unclear or missing policyNo defined retention schedule;
data retained indefinitely or deleted
without auditability

Appendix D. Data Erasure Resistance Score

Table A4 lists possible values for data erasure resistance (D). D represents how easily an entire copy of the data is securely and verifiably erased. This takes into account whether a database node, backup, or distributed replica can be completely wiped or destroyed. Measurement at the copy level captures both physical and logical persistence, which is especially relevant in the context of incident response and regulatory compliance.
Table A4. D Data erasure resistance score.
ValueErasure Resistance LevelExample
0.0Low erasure resistanceData copies can be fully deleted;
no residual data remains;
complete erasure confirmed
0.5Moderate erasure resistanceErasure possible but incomplete;
copy may be recoverable through
shadow copies or incomplete
deletion of replica
1.0High erasure resistanceCopies are immutable or persistent
by design; includes backups, unmodifiable
snapshots, or retention-locked archives

Appendix E. Log Accessibility Risk Score

Log accessibility risk (L) assesses the extent to which system logs might expose sensitive data or internal operations. Lower scores indicate well-protected logging practices, while higher scores reflect risky configurations like unencrypted logs, overexposure, or excessive retention. Although Table A5 is not exhaustive, it offers a structured basis for evaluating log-related risks. Assessors may assign intermediate values to capture detailed scenarios or edge cases more accurately.
Table A5. L Log accessibility risk score.
ValueRisk CategoryExample
0.0Low RiskLogs encrypted at rest and in transit,
access-controlled platforms,
log redaction of sensitive data,
short retention with auto-deletion
0.5Medium RiskPartial encryption (e.g., only at rest),
basic access control with limited auditing,
inconsistent redaction, moderate retention periods,
occasional inclusion of metadata like IPs or user IDs
1.0High RiskLogs in plain text,
broad or unmonitored access,
over-retention or missing expiration policy,
debug/trace logs exposing internals,
soft deletion allowing sensitive data recovery

Appendix F. Encryption Algorithms Score

Table A6 lists example values for commonly used data encryption algorithms. While not exhaustive, it serves as a quick reference rather than a comprehensive evaluation of all existing methods. Stronger, more secure algorithms are assigned values closer to 1.0 (top of the scale), whereas weaker or easily compromised methods trend toward 2.0, with “No Encryption” representing the upper bound of risk.
Table A6. Encryption algorithm score.
ValueAlgorithm
1.00AES
1.10ECC
1.203DES
1.30
1.40
1.50RSA 1024
1.60
1.70
1.80SHA-1
1.90MD5
2.00No Encryption

Appendix G. Exploitability Score

Exploitability (Table A7) measures the potential for a malicious actor to misuse the data for illicit purposes. The assigned values are derived through relative scaling, comparing each data element with the most- and least-critical in terms of sensitivity and misuse potential.
Table A7. Data exploitability score.
ValueContentsExamples
1.00Data with no direct or indirect link
to specific persons, groups of persons,
families, or neighborhoods
Environmental data (temperature)
1.10
1.20Data with a weak potential link to personsLand GPS coordinates that
might be private property
1.30
1.40Data with a strong potential link to personsAnonymous information about houses that might
be used to locate them (price or neighborhood)
1.50Non-exploitable personal information
(that might still have potential economic value),
i.e., anonymized medical data
Height, hair color, eye color, blood test results, or preferences
(food, beverages, or deserts)
1.60
1.70Anonymized medical data
with demographic/personal information
Cancer screening results or AIDS patient data
1.80Low-exploitable personal information
(that is easy to change or cannot be used
to locate the person in real life)
Email (but no password!) or mobile number
1.90Non-anonymized medical data
2.00Highly-exploitable and secret personal information,
identity information, or national
security-related information
Complete name, social security number, home address,
home phone number, home building properties
(e.g., intercom code), intimate personal photos, personal
messages, sexual preferences, passwords,
religious views, or political affiliation

References

  1. Voigt, P.; Von dem Bussche, A. The EU General Data Protection Regulation (GDPR): A Practical Guide, 1st ed.; Springer International Publishing: Cham, Switzerland, 2017; Volume 10, pp. 10–5555. [Google Scholar]
  2. Bonta, R. California Consumer Privacy Act (CCPA). State of California Department of Justice. 2022. Available online: https://oag.ca.gov/privacy/ccpa (accessed on 4 May 2025).
  3. Zaeem, R.N.; Barber, K.S. The effect of the GDPR on privacy policies: Recent progress and future promise. ACM Trans. Manag. Inf. Syst. (TMIS) 2020, 12, 1–20. [Google Scholar] [CrossRef]
  4. Delinschi, D.; Erdei, R.; Pasca, E.; Matei, O. Data quality assessment methodology. In Proceedings of the International Conference on Soft Computing Models in Industrial and Environmental Applications, Salamanca, Spain, 9–11 October 2024; Springer: Cham, Switzerland, 2024; pp. 199–209. [Google Scholar]
  5. Gupta, S.; Kumar, A.; Gupta, P. Security Landscape of a Strong Ecosystem to Protect Sensitive Information in E-Governance. Int. Res. J. Eng. Technol. (IRJET) 2023, 10, 362–369. [Google Scholar]
  6. Zahid, R.; Altaf, A.; Ahmad, T.; Iqbal, F.; Vera, Y.A.M.; Flores, M.A.L.; Ashraf, I. Secure data management life cycle for government big-data ecosystem: Design and development perspective. Systems 2023, 11, 380. [Google Scholar] [CrossRef]
  7. Raja, V.; Chopra, B. Exploring challenges and solutions in cloud computing: A review of data security and privacy concerns. J. Artif. Intell. Gen. Sci. (JAIGS) 2024, 4, 121–144. [Google Scholar]
  8. Celeste, E.; Fabbrini, F. Competing jurisdictions: Data privacy across the borders. In Data Privacy and Trust in Cloud Computing; Palgrave Macmillan: London, UK, 2020; pp. 43–58. [Google Scholar]
  9. Terzi, D.S.; Terzi, R.; Sagiroglu, S. A survey on security and privacy issues in big data. In Proceedings of the 2015 10th International Conference for Internet Technology and Secured Transactions (ICITST), London, UK, 14–16 December 2015; pp. 202–207. [Google Scholar] [CrossRef]
  10. Samaraweera, G.D.; Chang, J.M. Security and Privacy Implications on Database Systems in Big Data Era: A Survey. IEEE Trans. Knowl. Data Eng. 2021, 33, 239–258. [Google Scholar] [CrossRef]
  11. Schäfer, F.; Gebauer, H.; Gröger, C.; Gassmann, O.; Wortmann, F. Data-driven business and data privacy: Challenges and measures for product-based companies. Bus. Horiz. 2023, 66, 493–504. [Google Scholar] [CrossRef]
  12. Carvalho, T.; Moniz, N.; Faria, P.; Antunes, L. Towards a data privacy-predictive performance trade-off. Expert Syst. Appl. 2023, 223, 119785. [Google Scholar] [CrossRef]
  13. Erdei, R.; Delinschi, D.; Matei, O. Security centric scalable architecture for distributed learning and knowledge preservation. In Proceedings of the International Workshop on Soft Computing Models in Industrial and Environmental Applications, Salamanca, Spain, 5–7 September 2022; Springer: Cham, Switzerland, 2022; pp. 655–665. [Google Scholar]
  14. Erdem, M.; Özdemir, A. Sustainability and risk assessment of data center locations under a fuzzy environment. J. Clean. Prod. 2024, 450, 141982. [Google Scholar] [CrossRef]
  15. von Scherenberg, F.; Hellmeier, M.; Otto, B. Data sovereignty in information systems. Electron. Mark. 2024, 34, 15. [Google Scholar] [CrossRef]
  16. Singh, K.; Singh, A. Data Governance Best Practices in Cloud Migration Projects. Int. J. Res. Radic. Multidiscip. Fields 2024, 3, 821–836. [Google Scholar]
  17. Cavoukian, A. Privacy by Design: The 7 Foundational Principles; Information and Privacy Commissioner of Ontario: Toronto, ON, Canada, 2009; Volume 5, p. 12. [Google Scholar]
  18. Danezis, G.; Domingo-Ferrer, J.; Hansen, M.; Hoepman, J.H.; Metayer, D.L.; Tirtea, R.; Schiffner, S. Privacy and data protection by design-from policy to engineering. arXiv 2015, arXiv:1501.03726. [Google Scholar]
  19. Makridis, C.A. Do data breaches damage reputation? Evidence from 45 companies between 2002 and 2018. J. Cybersecur. 2021, 7, tyab021. [Google Scholar] [CrossRef]
  20. Mayer, P.; Zou, Y.; Lowens, B.M.; Dyer, H.A.; Le, K.; Schaub, F.; Aviv, A.J. Awareness, Intention, (In)Action: Individuals’ Reactions to Data Breaches. ACM Trans.-Comput.-Hum. Interact. 2023, 30, 1–53. [Google Scholar] [CrossRef]
  21. Johnson, M.; Kang, M.J.; Lawson, T. Stock price reaction to data breaches. J. Financ. Issues 2017, 16, 1–13. [Google Scholar] [CrossRef]
  22. Wolff, J.; Atallah, N. Early GDPR penalties: Analysis of implementation and fines through May 2020. J. Inf. Policy 2021, 11, 63–103. [Google Scholar] [CrossRef]
  23. Gürses, S.; Troncoso, C.; Diaz, C. Engineering privacy by design. Comput. Priv. Data Prot. 2011, 14, 25. [Google Scholar]
  24. Spiekermann, S.; Cranor, L.F. Engineering privacy. IEEE Trans. Softw. Eng. 2008, 35, 67–82. [Google Scholar] [CrossRef]
  25. Park, H.A. The DtMin Protocol: Implementing Data Minimization Principles in Medical Information Sharing. Electronics 2025, 14, 1501. [Google Scholar] [CrossRef]
  26. Bu, F.; Wang, N.; Jiang, Q.; Tian, X. Research on Privacy-by-Design Behavioural Decision-Making of Information Engineers Considering Perceived Work Risk. Systems 2024, 12, 250. [Google Scholar] [CrossRef]
  27. Ali, T.; Al-Khalidi, M.; Al-Zaidi, R. Information security risk assessment methods in cloud computing: Comprehensive review. J. Comput. Inf. Syst. 2024, 1–28. [Google Scholar] [CrossRef]
  28. Luehr, P.; Reilly, B. Data minimisation: A crucial pillar of cyber security. Cyber Secur.-Peer-Rev. J. 2025, 8, 243–254. [Google Scholar] [CrossRef]
  29. Hoepman, J.H. Privacy design strategies. In Proceedings of the IFIP International Information Security Conference, Marrakech, Morocco, 2–4 June 2014; Springer: Cham, Switzerland, 2014; pp. 446–459. [Google Scholar]
  30. Das, B.C.; Amini, M.H.; Wu, Y. Security and privacy challenges of large language models: A survey. ACM Comput. Surv. 2025, 57, 1–39. [Google Scholar] [CrossRef]
  31. Finck, M.; Biega, A. Reviving purpose limitation and data minimisation in personalisation, profiling and decision-making systems. Technol. Regul. 2021, 2021, 44–61. [Google Scholar] [CrossRef]
  32. Zarsky, T.Z. Incompatible: The GDPR in the age of big data. Seton Hall Law Rev. 2016, 47, 995. [Google Scholar]
  33. Dwork, C.; Roth, A. The algorithmic foundations of differential privacy. Found. Trends® Theor. Comput. Sci. 2014, 9, 211–407. [Google Scholar] [CrossRef]
  34. Acar, A.; Aksu, H.; Uluagac, A.S.; Conti, M. A survey on homomorphic encryption schemes: Theory and implementation. ACM Comput. Surv. (Csur) 2018, 51, 1–35. [Google Scholar] [CrossRef]
  35. Sahinbas, K.; Catak, F.O. Secure multi-party computation-based privacy-preserving data analysis in healthcare IoT systems. In Interpretable Cognitive Internet of Things for Healthcare; Springer International Publishing: Cham, Switzerland, 2023; pp. 57–72. [Google Scholar]
  36. Geppert, T.; Deml, S.; Sturzenegger, D.; Ebert, N. Trusted execution environments: Applications and organizational challenges. Front. Comput. Sci. 2022, 4, 930741. [Google Scholar] [CrossRef]
  37. Li, T.; Sahu, A.K.; Talwalkar, A.; Smith, V. Federated learning: Challenges, methods, and future directions. IEEE Signal Process. Mag. 2020, 37, 50–60. [Google Scholar] [CrossRef]
  38. Sion, L.; Dewitte, P.; Van Landuyt, D.; Wuyts, K.; Emanuilov, I.; Valcke, P.; Joosen, W. An architectural view for data protection by design. In Proceedings of the 2019 IEEE International Conference on Software Architecture (ICSA), Hamburg, Germany, 25–29 March 2019; IEEE: New York, NY, USA, 2019; pp. 11–20. [Google Scholar]
  39. Morali, A.; Zambon, E.; Etalle, S.; Overbeek, P. It confidentiality risk assessment for an architecture-based approach. In Proceedings of the 2008 3rd IEEE/IFIP International Workshop on Business-Driven IT Management, Salvador, Brazil, 7 April 2008; IEEE: New York, NY, USA, 2008; pp. 31–40. [Google Scholar]
  40. Antignac, T.; Le Métayer, D. Privacy architectures: Reasoning about data minimisation and integrity. In Proceedings of the International Workshop on Security and Trust Management, Wroclaw, Poland, 10–11 September 2014; Springer: Cham, Switzerland, 2014; pp. 17–32. [Google Scholar]
  41. Wagner, I.; Boiten, E. Privacy risk assessment: From art to science, by metrics. In Proceedings of the Data Privacy Management, Cryptocurrencies and Blockchain Technology: ESORICS 2018 International Workshops, DPM 2018 and CBT 2018, Barcelona, Spain, 6–7 September 2018; Proceedings 13. Springer: Cham, Switzerland, 2018; pp. 225–241. [Google Scholar]
  42. Senarath, A.; Grobler, M.; Arachchilage, N.A.G. A model for system developers to measure the privacy risk of data. arXiv 2018, arXiv:1809.10884. [Google Scholar]
  43. De, S.J.; Le Métayer, D. Privacy risk analysis to enable informed privacy settings. In Proceedings of the 2018 IEEE European Symposium on Security and Privacy Workshops (EuroS&PW), London, UK, 23–27 April 2018; IEEE: New York, NY, USA, 2018; pp. 95–102. [Google Scholar]
  44. Abu Bakar, A.; Mahinderjit Singh, M.; Mohd Shariff, A.R. A privacy preservation quality of service (Qos) model for data exposure in android smartphone usage. Sensors 2021, 21, 1667. [Google Scholar] [CrossRef]
  45. Cao, Y.; Yoshikawa, M.; Xiao, Y.; Xiong, L. Quantifying differential privacy in continuous data release under temporal correlations. IEEE Trans. Knowl. Data Eng. 2018, 31, 1281–1295. [Google Scholar] [CrossRef] [PubMed]
  46. Giomi, M.; Boenisch, F.; Wehmeyer, C.; Tasnádi, B. A unified framework for quantifying privacy risk in synthetic data. arXiv 2022, arXiv:2211.10459. [Google Scholar] [CrossRef]
  47. Ali-Eldin, A.; Zuiderwijk-van Eijk, A.; Janssen, M. Opening more data: A new privacy risk scoring model for open data. In Proceedings of the 7th International Symposium on Business Modeling and Software Design, BMSD 2017, Barcelona, Spain, 3–5 July 2017; pp. 146–154. [Google Scholar]
  48. Matei, O.; Erdei, R.; Delinschi, D.; Andreica, L. Data based message validation as a security cornerstone in loose coupling software architecture. In Proceedings of the Computational Intelligence in Security for Information Systems Conference, Bilbao, Spain, 22–24 September 2021; Springer: Cham, Switzerland, 2021; pp. 214–223. [Google Scholar]
  49. Erdei, R.; Delinschi, D.; Pașca, E.; Matei, O. Orchestrator architecture and communication methodology for flexible event driven message based communication. In Proceedings of the Computational Intelligence in Security for Information Systems Conference, Salamanca, Spain, 5–7 September 2022; Springer: Cham, Switzerland, 2022; pp. 127–137. [Google Scholar]
  50. Sun, P.; Shen, S.; Wan, Y.; Wu, Z.; Fang, Z.; Gao, X.Z. A survey of iot privacy security: Architecture, technology, challenges, and trends. IEEE Internet Things J. 2024, 11, 34567–34591. [Google Scholar] [CrossRef]
  51. Khan, N.e.; Rudman, R.J. IoT medical device risks: Data security, privacy, confidentiality and compliance with HIPAA and COBIT 2019. S. Afr. J. Bus. Manag. 2025, 56, 4796. [Google Scholar] [CrossRef]
  52. Alwarafy, A.; Al-Thelaya, K.A.; Abdallah, M.; Schneider, J.; Hamdi, M. A survey on security and privacy issues in edge-computing-assisted internet of things. IEEE Internet Things J. 2020, 8, 4004–4022. [Google Scholar] [CrossRef]
  53. Chakraborty, N.; Sharma, A.; Dutta, J.; Kumar, H.D. Privacy-Preserving Data Quality Assessment for Time-Series IoT Sensors. In Proceedings of the 2024 IEEE International Conference on Internet of Things and Intelligence Systems (IoTaIS), Bali, Indonesia, 28–30 November 2024; IEEE: New York, NY, USA, 2024; pp. 51–57. [Google Scholar]
  54. Buitrago, M.; Borne, I.; Buisson, J. Model-Based Assessment of Conformance to Acknowledged Security-Related Software Architecture Good Practices. In Proceedings of the 12th International Conference on Model-Based Software and Systems Engineering, Rome, Italy, 21–23 February 2024; SCITEPRESS-Science and Technology Publications: Porto, Portugal, 2024; pp. 117–124. [Google Scholar]
  55. Manadhata, P.K.; Wing, J.M. An attack surface metric. IEEE Trans. Softw. Eng. 2010, 37, 371–386. [Google Scholar] [CrossRef]
  56. Maclean, D. The NIST risk management framework: Problems and recommendations. Cyber Secur.-Peer-Rev. J. 2017, 1, 207–217. [Google Scholar] [CrossRef]
  57. Erdei, R.; Pasca, E.; Delinschi, D.; Avram, A.; Chereja, I.; Matei, O. Privacy assessment methodology for machine learning models and data sources. In Proceedings of the International Conference on Soft Computing Models in Industrial and Environmental Applications, Salamanca, Spain, 9–11 October 2024; Springer: Cham, Switzerland, 2024; pp. 210–220. [Google Scholar]
  58. Chereja, I.; Erdei, R.; Pasca, E.; Delinschi, D.; Avram, A.; Matei, O. A Privacy Assessment Framework for Data Tiers in Multilayered Ecosystem Architectures. Mathematics 2025, 13, 1116. [Google Scholar] [CrossRef]
  59. Mell, P.; Scarfone, K.; Romanosky, S. Common vulnerability scoring system. IEEE Secur. Priv. 2006, 4, 85–89. [Google Scholar] [CrossRef]
  60. Mell, P.; Scarfone, K.; Romanosky, S. A Complete Guide to the Common Vulnerability Scoring System Version 2.0. FIRST—Forum of Incident Response and Security Teams, 2007; Volume 1, p. 23. Available online: https://tsapps.nist.gov/publication/get_pdf.cfm?pub_id=51198 (accessed on 4 May 2025).
  61. Sargiotis, D. Data security and privacy: Protecting sensitive information. In Data Governance: A Guide; Springer: Cham, Switzerland, 2024; pp. 217–245. [Google Scholar]
  62. Coche, E.; Kolk, A.; Ocelík, V. Unravelling cross-country regulatory intricacies of data governance: The relevance of legal insights for digitalization and international business. J. Int. Bus. Policy 2024, 7, 112–127. [Google Scholar] [CrossRef]
  63. Pimenta Rodrigues, G.A.; Marques Serrano, A.L.; Lopes Espiñeira Lemos, A.N.; Canedo, E.D.; Mendonça, F.L.L.d.; de Oliveira Albuquerque, R.; Sandoval Orozco, A.L.; García Villalba, L.J. Understanding data breach from a global perspective: Incident visualization and data protection law review. Data 2024, 9, 27. [Google Scholar] [CrossRef]
  64. Pestana, G.; Sofou, S. Data governance to counter hybrid threats against critical infrastructures. Smart Cities 2024, 7, 1857–1877. [Google Scholar] [CrossRef]
  65. Nambiar, A.; Mundra, D. An overview of data warehouse and data lake in modern enterprise data management. Big Data Cogn. Comput. 2022, 6, 132. [Google Scholar] [CrossRef]
  66. Chereja, I.; Hahn, S.M.L.; Matei, O.; Avram, A. Operationalizing analytics with NewSQL. In Proceedings of the Software Engineering and Algorithms: Proceedings of 10th Computer Science On-line Conference 2021, Online, 1 April 2021; Springer: Cham, Switzerland, 2021; Volume 1, pp. 249–263. [Google Scholar]
  67. Chereja, I.; Hahn, S.M.L.; Matei, O.; Avram, A. Multidimensional analysis of NewSQL database systems. In Proceedings of the Computer Science On-line Conference, Online, 1 April 2021; Springer: Cham, Switzerland, 2021. [Google Scholar]
  68. Hahn, S.M.L.; Chereja, I.; Matei, O. Analysis of transformation tools applicable on NewSQL databases. In Proceedings of the Software Engineering and Algorithms: Proceedings of 10th Computer Science On-line Conference 2021, Online, 1 April 2021; Springer: Cham, Switzerland, 2021; Volume 1, pp. 180–195. [Google Scholar]
  69. Chereja, I.; Hahn, S.M.L.; Matei, O. Benchmarking NewSQL Cloud-Native or Cloud-Hosted Databases. In Proceedings of the Software Engineering Application in Informatics: Proceedings of 5th Computational Methods in Systems and Software 2021, Online, 1 October 2021; Springer: Cham, Switzerland, 2021; Volume 1, pp. 296–310. [Google Scholar]
Figure 1. Overview of the Multi-layered Ecosystem (MLE) Architecture Design.
Sensors 25 03554 g001
Figure 2. Overview of the Privacy-Aware Ecosystem (PAE) Architecture Design.
Sensors 25 03554 g002
Figure 3. Overview of the HTAP Ecosystem Architecture Design.
Sensors 25 03554 g003
Figure 4. Overview of evaluated metrics for the proposed VOD architectures.
Sensors 25 03554 g004
Figure 5. Overview of Multi-Layered Environmental Sensor (MLES) Ecosystem Architecture Design.
Sensors 25 03554 g005
Figure 6. Overview of HTAP Environmental Sensor (HTAPS) Ecosystem Architecture Design.
Sensors 25 03554 g006
Figure 7. Overview of evaluated metrics for the proposed IoT architectures.
Sensors 25 03554 g007
Table 1. Vulnerability score overview for the multi-layered ecosystem architecture.
Data LayerVulnerability Score
Streaming Service212.4
Subscription Management Service164.0
Backend Streaming Hosting Service159.5
Landing559.7
Staging535.9
Historical524.7
Analytical285.2
Sharing206.5
Ecosystem2647.9
Table 2. Streaming service privacy risk expansion factor.
Copy TypeGARDLPREF
Main Copy1.001.000.001.001.003.00
Secondary Copy1.001.000.001.001.003.00
Disaster Recovery Copy2.001.000.000.501.005.00
Daily Backup1.001.500.000.000.001.50
Total PREF 12.50
Table 3. Subscription management service privacy risk expansion factor.
Copy TypeGARDLPREF
Main Copy1.001.000.001.001.003.00
Secondary Copy1.001.000.001.001.003.00
Disaster Recovery Copy1.001.000.001.001.003.00
Daily Backup1.001.500.000.000.001.50
Total PREF 10.50
Table 4. Backend streaming hosting service privacy risk expansion factor.
Copy TypeGARDLPREF
Main Copy1.001.000.001.001.003.00
Secondary Copy1.001.000.001.001.003.00
Disaster Recovery Copy1.001.000.000.501.002.50
Daily Backup1.001.500.000.000.001.50
Total PREF 10.00
Table 5. Landing privacy risk expansion factor.
Copy TypeGARDLPREF
Main Copy1.001.000.001.000.002.00
Secondary Copy1.001.000.000.500.001.50
Weekly Backup1.001.500.500.000.002.25
Total PREF 5.75
Table 6. Staging privacy risk expansion factor.
Copy TypeGARDLPREF
Main Copy1.001.000.001.000.002.00
Secondary Copy1.001.000.000.000.001.00
Weekly Backup1.001.500.000.000.001.50
Total PREF 4.50
Table 7. Historical privacy risk expansion factor.
Copy TypeGARDLPREF
Main Copy1.001.000.001.000.002.00
Secondary Copy1.001.000.001.000.002.00
Weekly Backup1.001.500.000.000.001.50
Total PREF 5.50
Table 8. Analytical privacy risk expansion factor.
Copy TypeGARDLPREF
Main Copy1.001.000.001.000.002.00
Secondary Copy1.001.000.000.000.001.00
Weekly Backup1.001.500.000.000.001.50
Total PREF 4.50
Table 9. Sharing privacy risk expansion factor.
Copy TypeGARDLPREF
Main Copy1.001.000.001.000.002.00
Secondary Copy1.001.000.000.000.001.00
Manual Backup1.001.500.500.000.002.25
Total PREF 5.25
Table 10. PREF score overview for the multi-layered ecosystem architecture.
Data LayerPREF Score
Streaming Service12.5
Subscription Management Service10.5
Backend Streaming Hosting Service10.0
Landing5.75
Staging4.5
Historical5.5
Analytical4.5
Sharing5.25
Ecosystem58.5
Table 11. PEI score overview for the multi-layered ecosystem architecture.
Data LayerVSPREFPEI
Streaming Service212.412.52655.0
Subscription Management Service164.010.51722.0
Backend Streaming Hosting Service159.510.01595.0
Landing559.75.753218.275
Staging535.94.52411.55
Historical524.75.52885.85
Analytical285.24.51283.4
Sharing206.55.251084.125
Ecosystem2647.958.516,855.2
Table 12. Vulnerability score overview for the Privacy-Aware Ecosystem Architecture.
Data LayerVulnerability Score
Streaming Service212.4
Subscription Management Service164.0
Backend Streaming Hosting Service159.5
Landing Sensitive559.7
Landing Clean368.5
Staging Clean350.3
Historical Clean350.3
Analytical Clean181.4
Sharing206.5
Ecosystem2552.6
Table 13. PREF score overview for the Privacy-Aware Ecosystem Architecture.
Data LayerPREF
Streaming Service12.5
Subscription Management Service10.5
Backend Streaming Hosting Service10.0
Landing Sensitive5.75
Landing Clean5.75
Staging Clean4.5
Historical Clean5.5
Analytical Clean4.5
Sharing5.25
Ecosystem64.25
Table 14. Privacy exposure index (PEI) overview for the Privacy-Aware Ecosystem Architecture.
Data LayerVSPREFPEI
Streaming Service212.412.52655.0
Subscription Management Service164.010.51722.0
Backend Streaming Hosting Service159.510.01595.0
Landing Sensitive559.75.753218.275
Landing Clean368.55.752118.875
Staging Clean350.34.51576.35
Historical Clean350.35.51926.65
Analytical Clean181.44.5816.3
Sharing206.55.251084.125
Ecosystem2552.664.2516,712.575
Table 15. Vulnerability score overview for the HTAP architecture.
Data LayerVulnerability Score
Streaming Service212.4
Subscription Management Service164.0
Backend Streaming Hosting Service159.5
Ecosystem535.9
Table 16. PREF score overview for the HTAP architecture.
Data LayerPREF
Streaming Service12.5
Subscription Management Service10.5
Backend Streaming Hosting Service10.0
Ecosystem33.0
Table 17. Privacy exposure index (PEI) overview for the HTAP architecture.
Data LayerVSPREFPEI
Streaming Service212.412.52655.0
Subscription Management Service164.010.51722.0
Backend Streaming Hosting Service159.510.01595.0
Ecosystem535.933.05972.0
Table 18. Privacy risk trade-off matrix across architectural designs.
ArchitectureDesign Trade-OffsPrivacy Risk Summary
MLEHigh duplication,
persistent storage across layers
High PREF and highest PEI,
especially in the landing
and historical layers
PAELayer separation,
minimized duplication,
clean/sensitive data split
Highest PREF,
lower PEI, improved
downstream privacy posture
HTAPMinimal redundancy,
centralized processing,
real-time access
Lowest PREF, lowest PEI
centralized in single
processing tier
Table 19. Vulnerability score overview for the Multi-Layered Environmental Sensor Architecture.
Data LayerVulnerability Score
Room Telemetry81.5
Analytical Layer81.5
Ecosystem163.0
Table 20. PREF score overview for the Multi-Layered Environmental Sensor Architecture.
Data LayerPREF
Room Telemetry7.0
Analytical Layer9.0
Ecosystem16.0
Table 21. Privacy exposure index (PEI) overview for the Multi-Layered Environmental Sensor Architecture.
Data LayerVSPREFPEI
Room Telemetry81.57.0570.5
Analytical Layer81.59.0733.5
Ecosystem16316.01304.0
Table 22. Vulnerability score overview for the HTAP Environmental Sensor Architecture.
Data LayerVulnerability Score
Room Telemetry81.5
Ecosystem81.5
Table 23. PREF score overview for the HTAP Environmental Sensor Architecture.
Data LayerPREF
Room Telemetry7.0
Ecosystem7.0
Table 24. Privacy exposure index (PEI) overview for the HTAP Environmental Sensor Architecture.
Data LayerVSPREFPEI
Room Telemetry81.57.0570.5
Ecosystem81.57.0570.5
Table 25. Privacy risk trade-off matrix across iot architectural designs.
ArchitectureDesign Trade-OffsPrivacy Risk Summary
MLESMulti-stage data handling,
separate analytical layer,
multiple replicas and backups
Increased exposure from
duplication and retention layers;
higher PREF and PEI due to
redundancy across tiers
HTAPSingle-stage HTAP system,
unified transactional and
analytical processing
Minimal replication and movement;
lower PREF and PEI;
reduced vulnerability surface
Disclaimer/Publisher’s Note: The statements, opinions and data contained in all publications are solely those of the individual author(s) and contributor(s) and not of MDPI and/or the editor(s). MDPI and/or the editor(s) disclaim responsibility for any injury to people or property resulting from any ideas, methods, instructions or products referred to in the content.

