
Small Scale Multi-Object Segmentation in Mid-Infrared Image Using the Image Timing Features–Gaussian Mixture Model and Convolutional-UNet

 ,
,
Abstract
1. Introduction
2. Methods
2.1. Proposed Computational Flow Chart
2.2. Key Computational Methods
2.2.1. ITF-GMM
- Dynamic adjustment of LR
- Dynamic adjustment of Gaussian distribution numbers
| Algorithm 1: ITF-GMM |
| 1. Input Video frame sequence |
| 2. Output Foreground masks for each frame |
| 3. Initialization for each pixel x do Initialize N Gaussian distributions end for |
| 4. Procedure process for each frame do Extract ROI Compute dynamic LR via Equation (11) in ROI Compute dynamic Gaussian components via Equations (12)–(13) in ROI for each pixel xt do Compare xt with existing model via Equation (4) if a match is found then Mark xt as background Update parameter via Equations (5)–(7) else if no match then Mark xt as foreground Update weights via Equation (8) end if if xt ∈ ROI then update LR and N else N = 2 end if Normalize all weights to ensure sum is 1 and N satisfies Equation (9) end for end for |
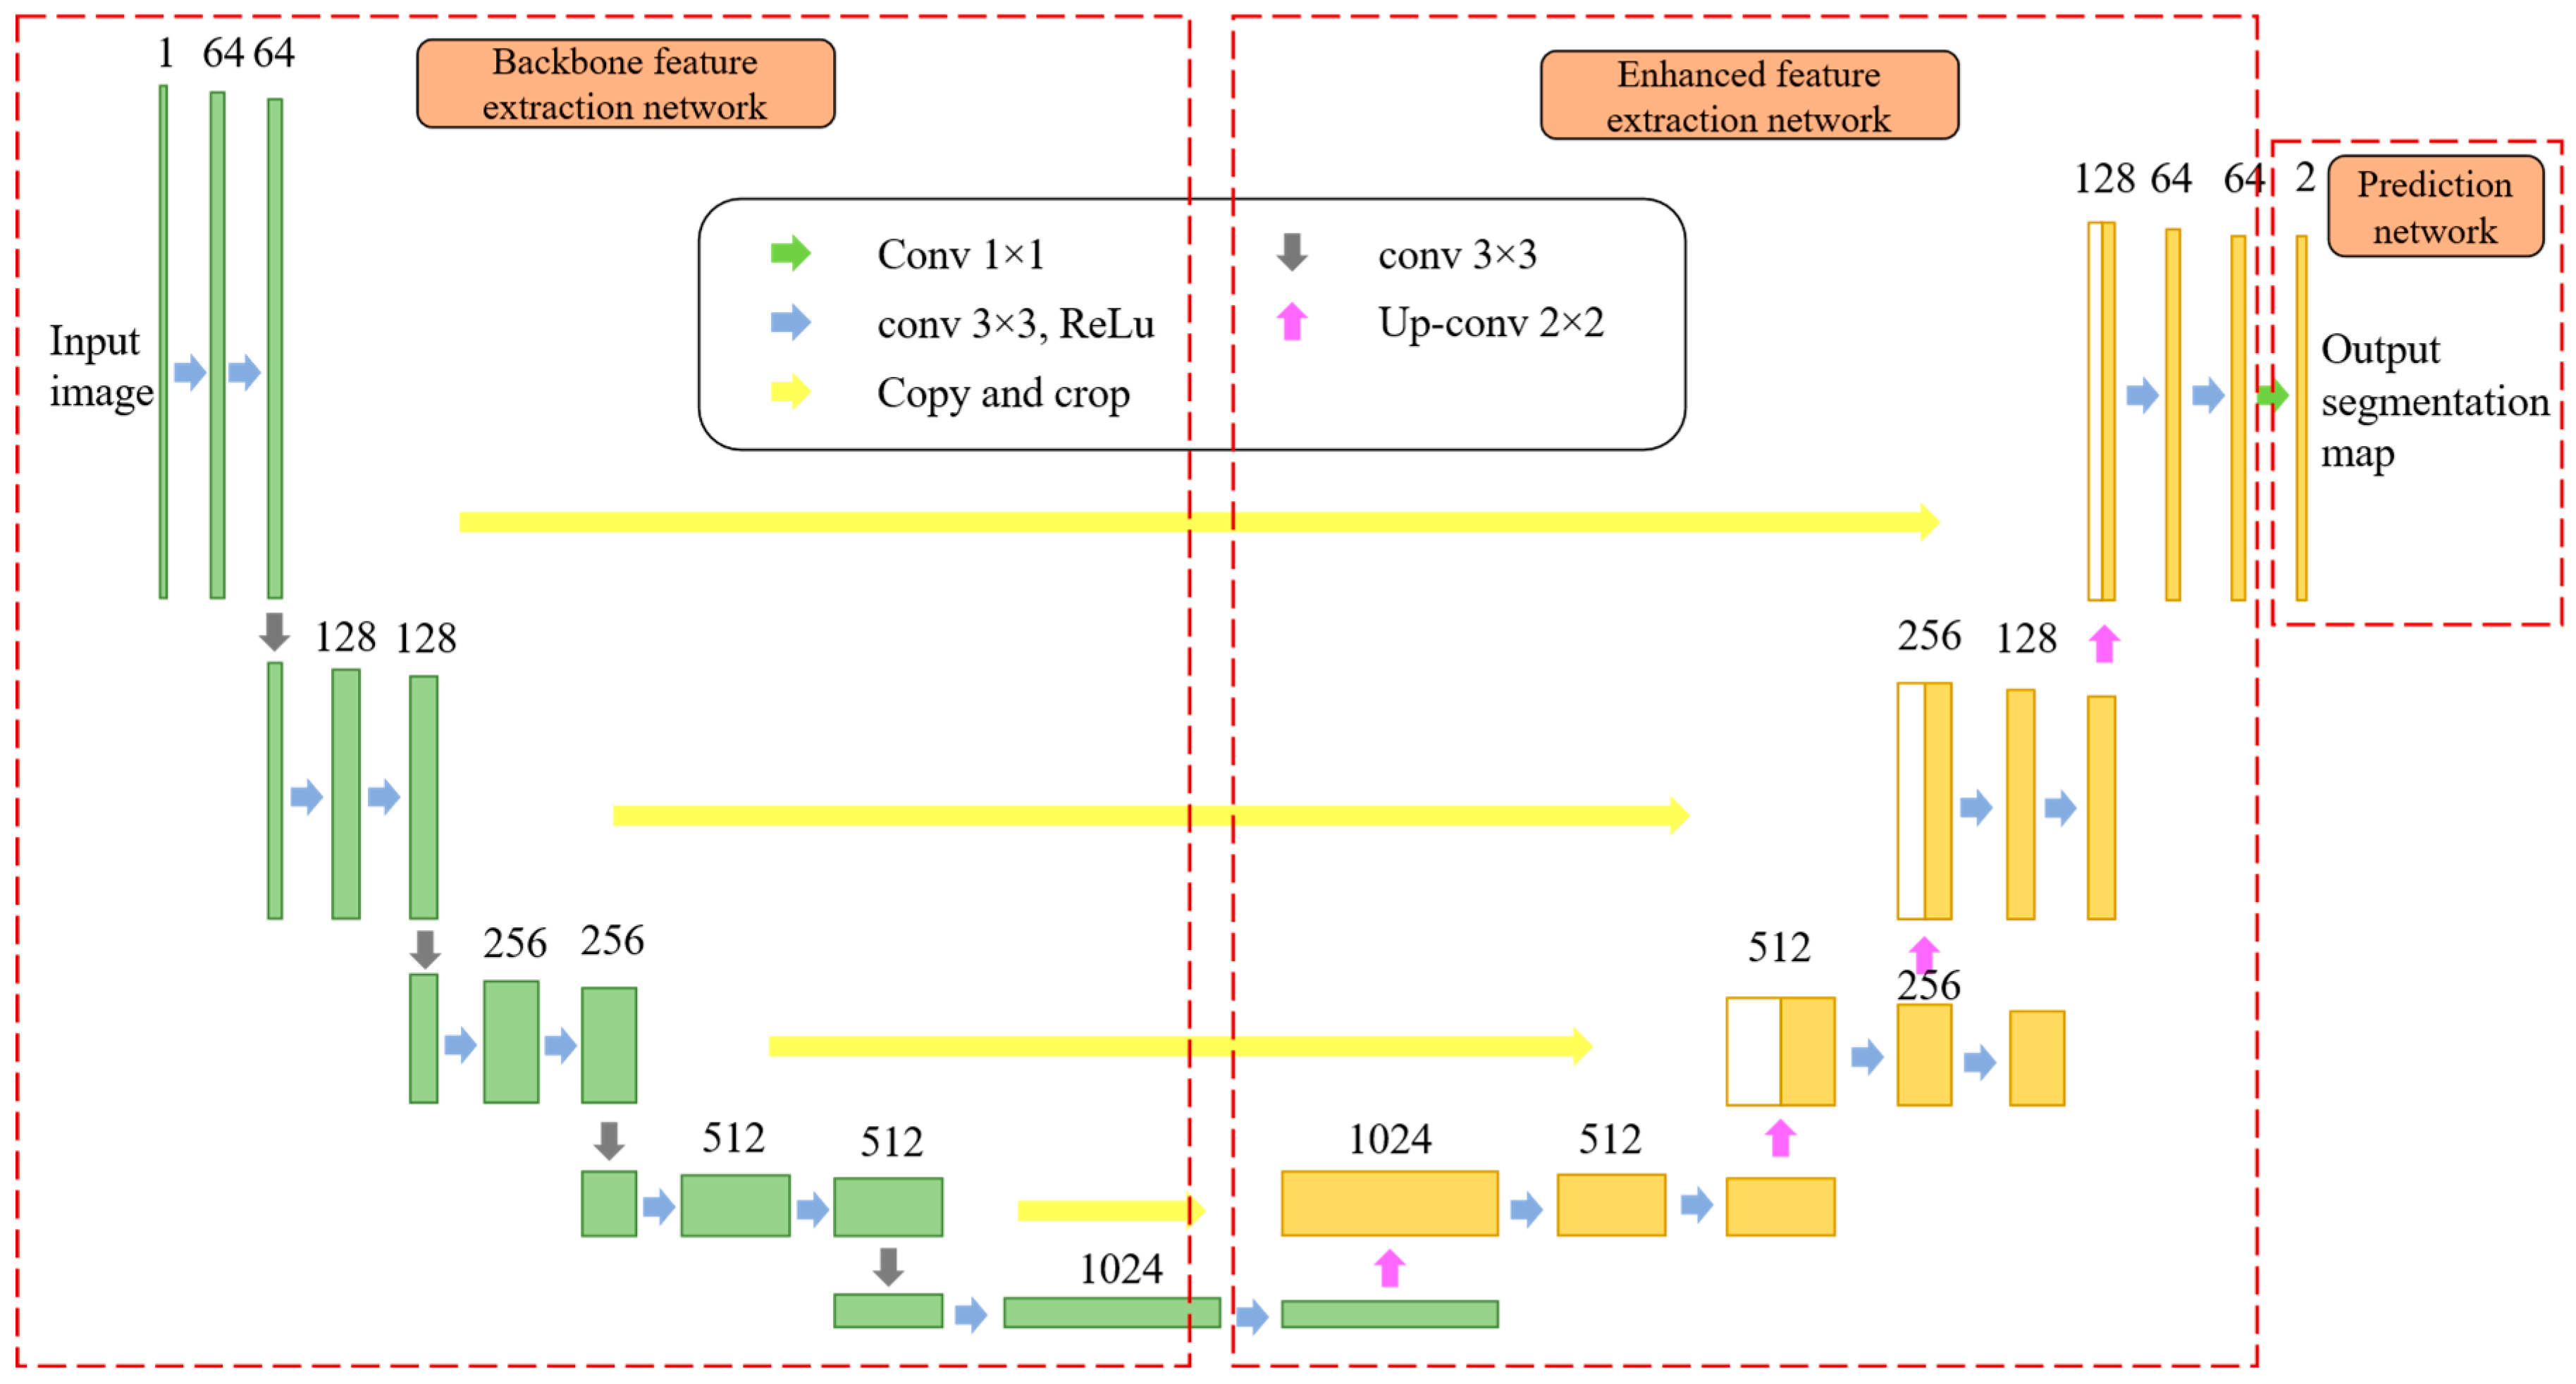
2.2.2. Con-UNet
3. Results
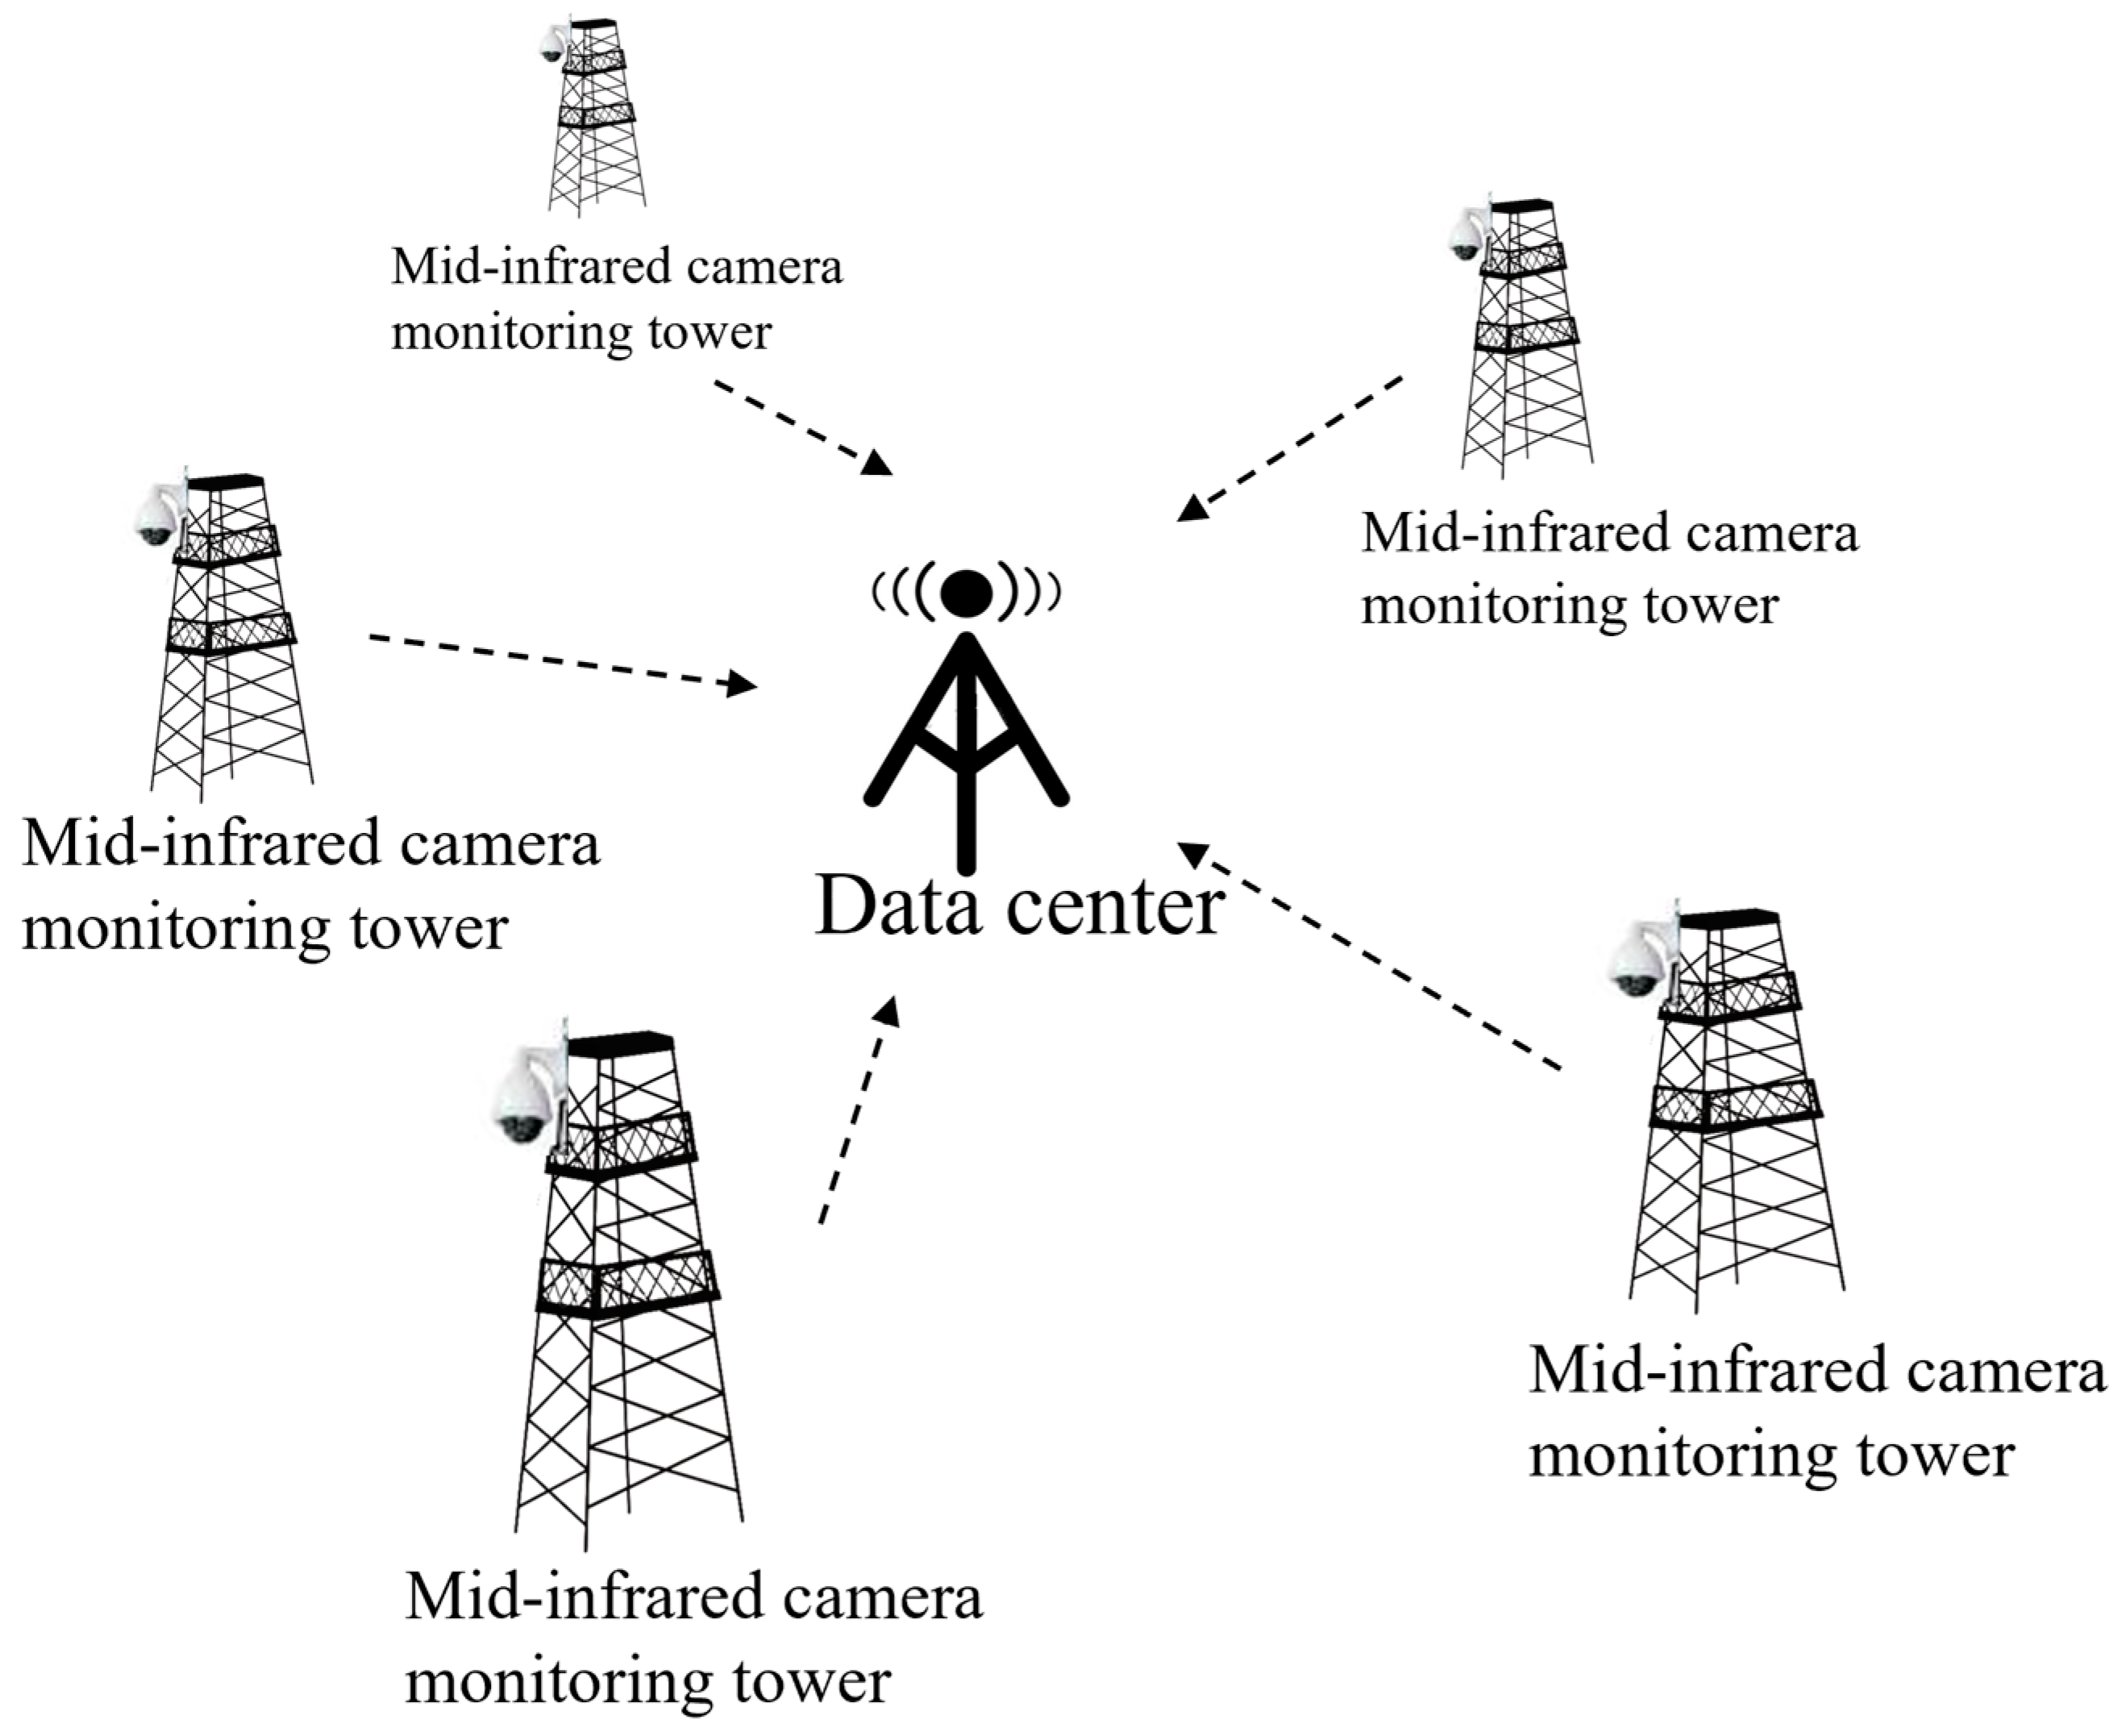
3.1. Experimental Environment
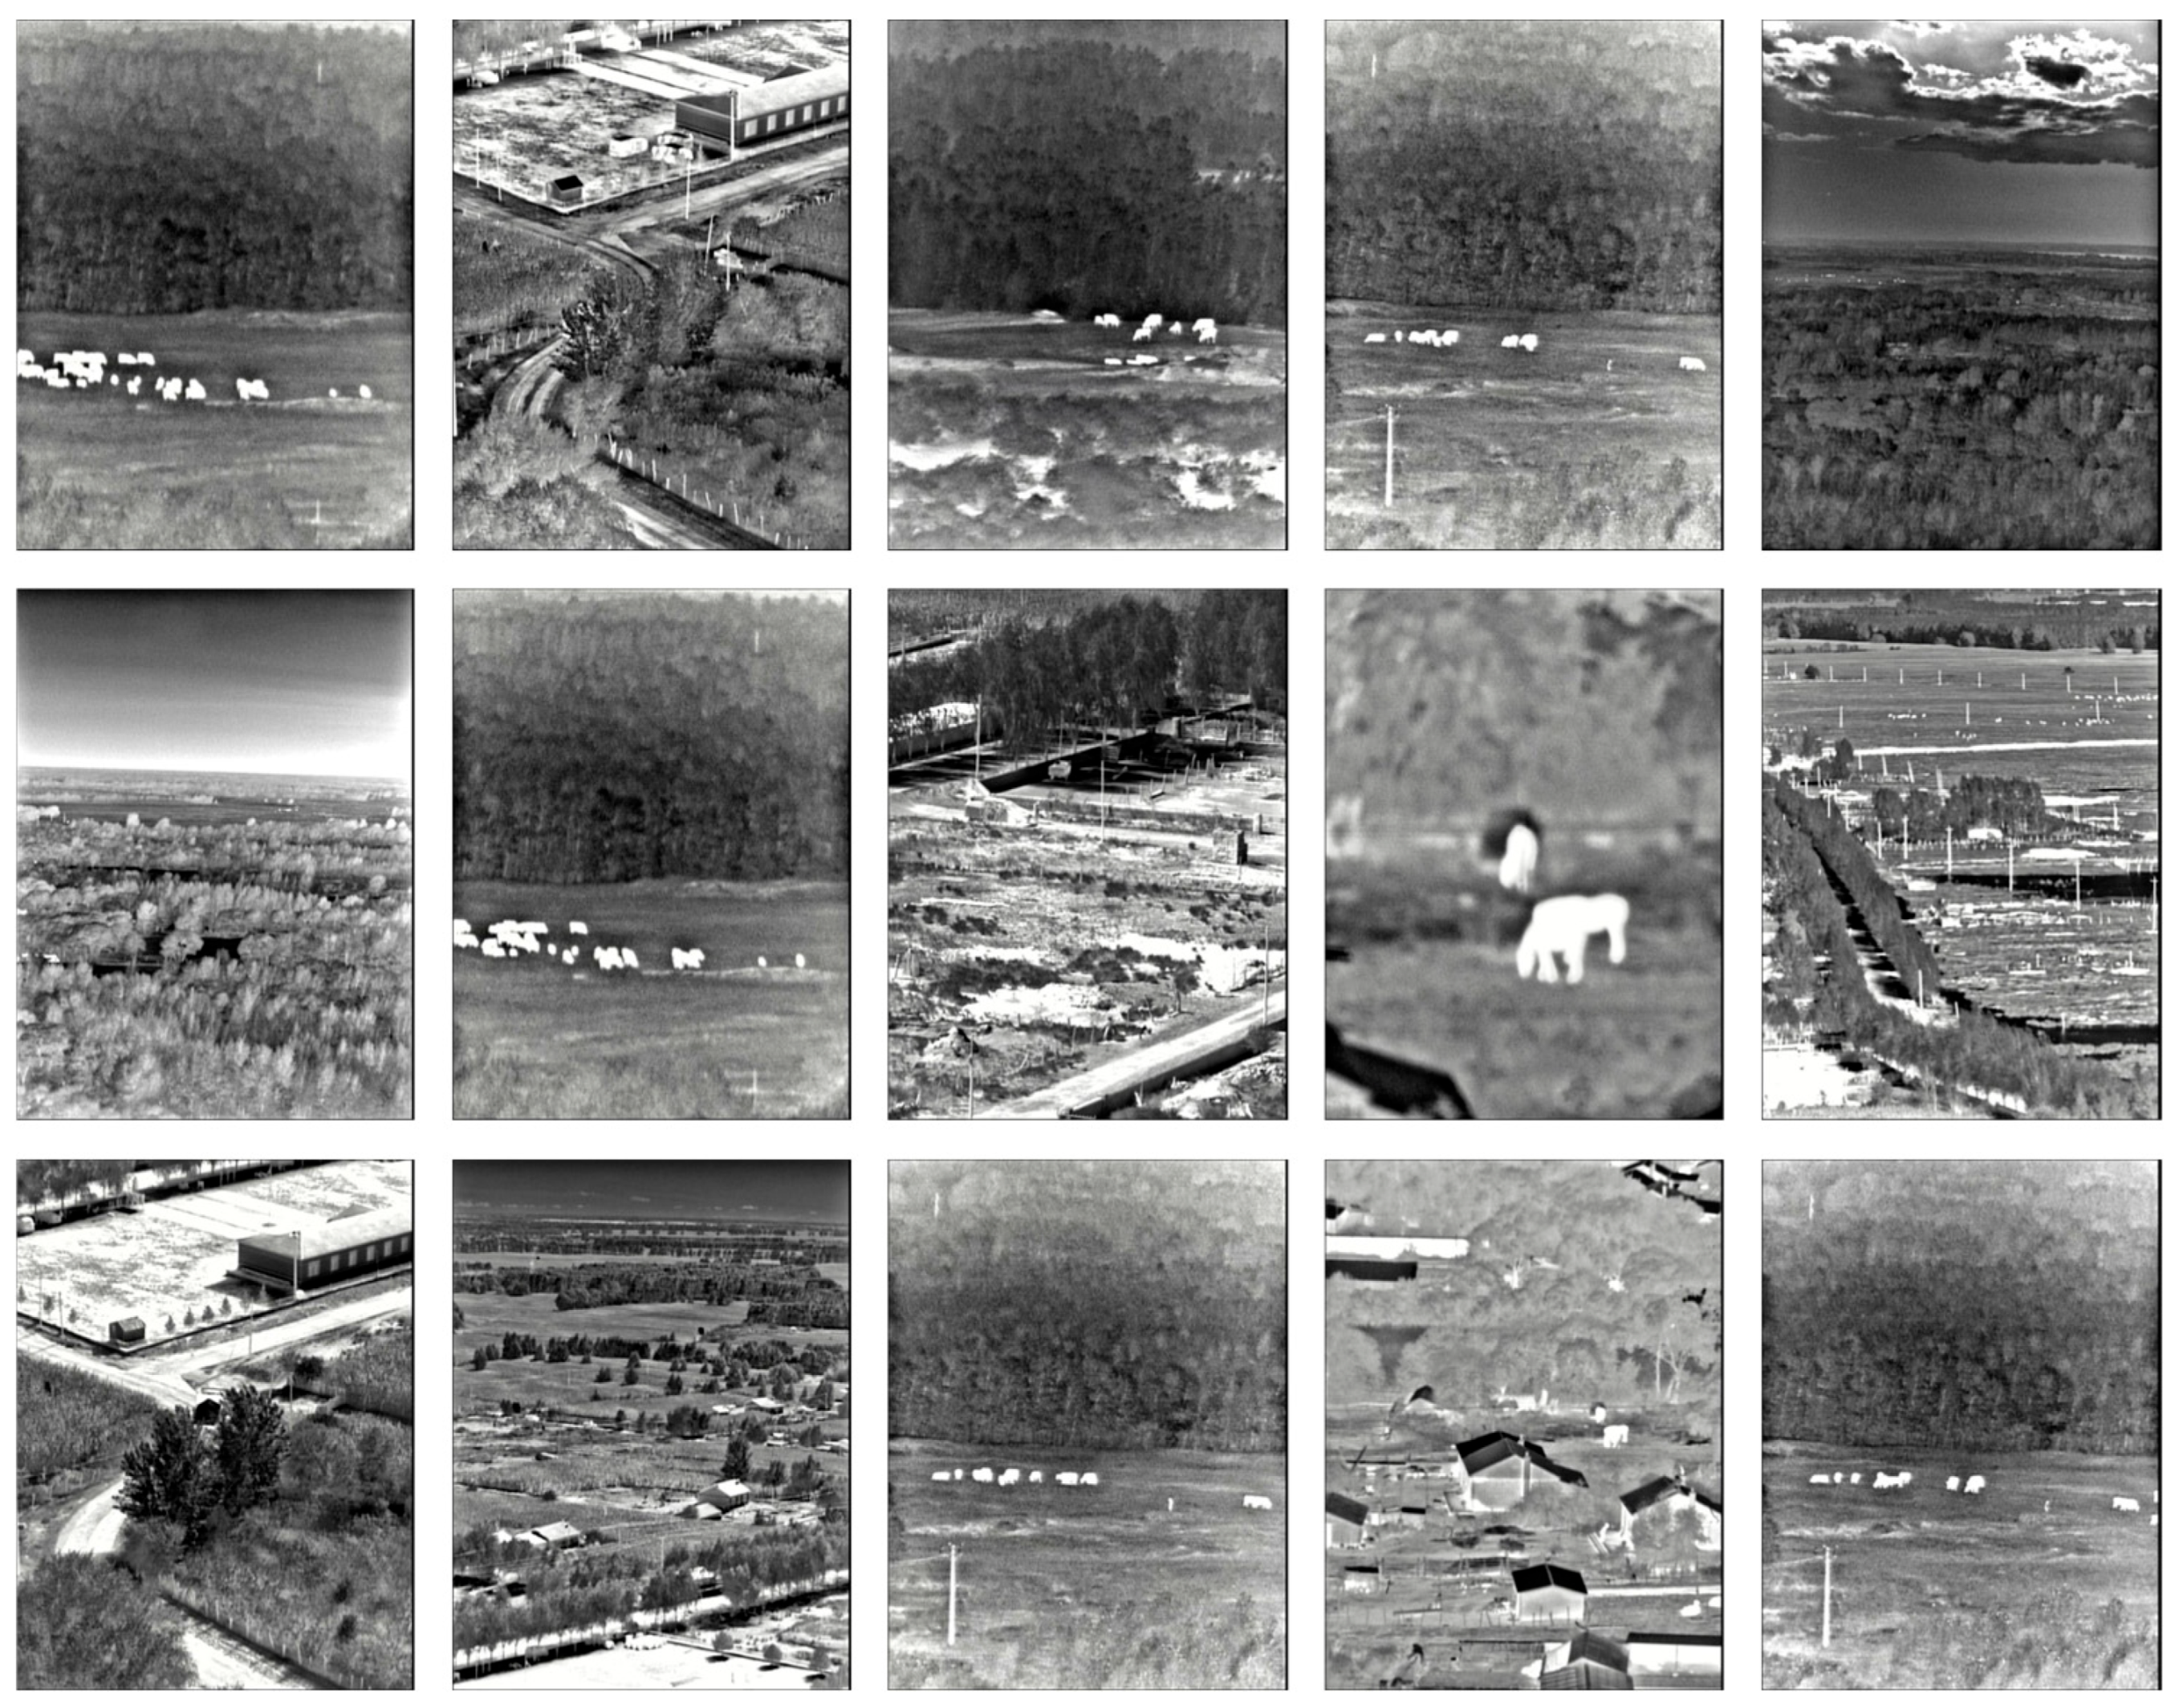
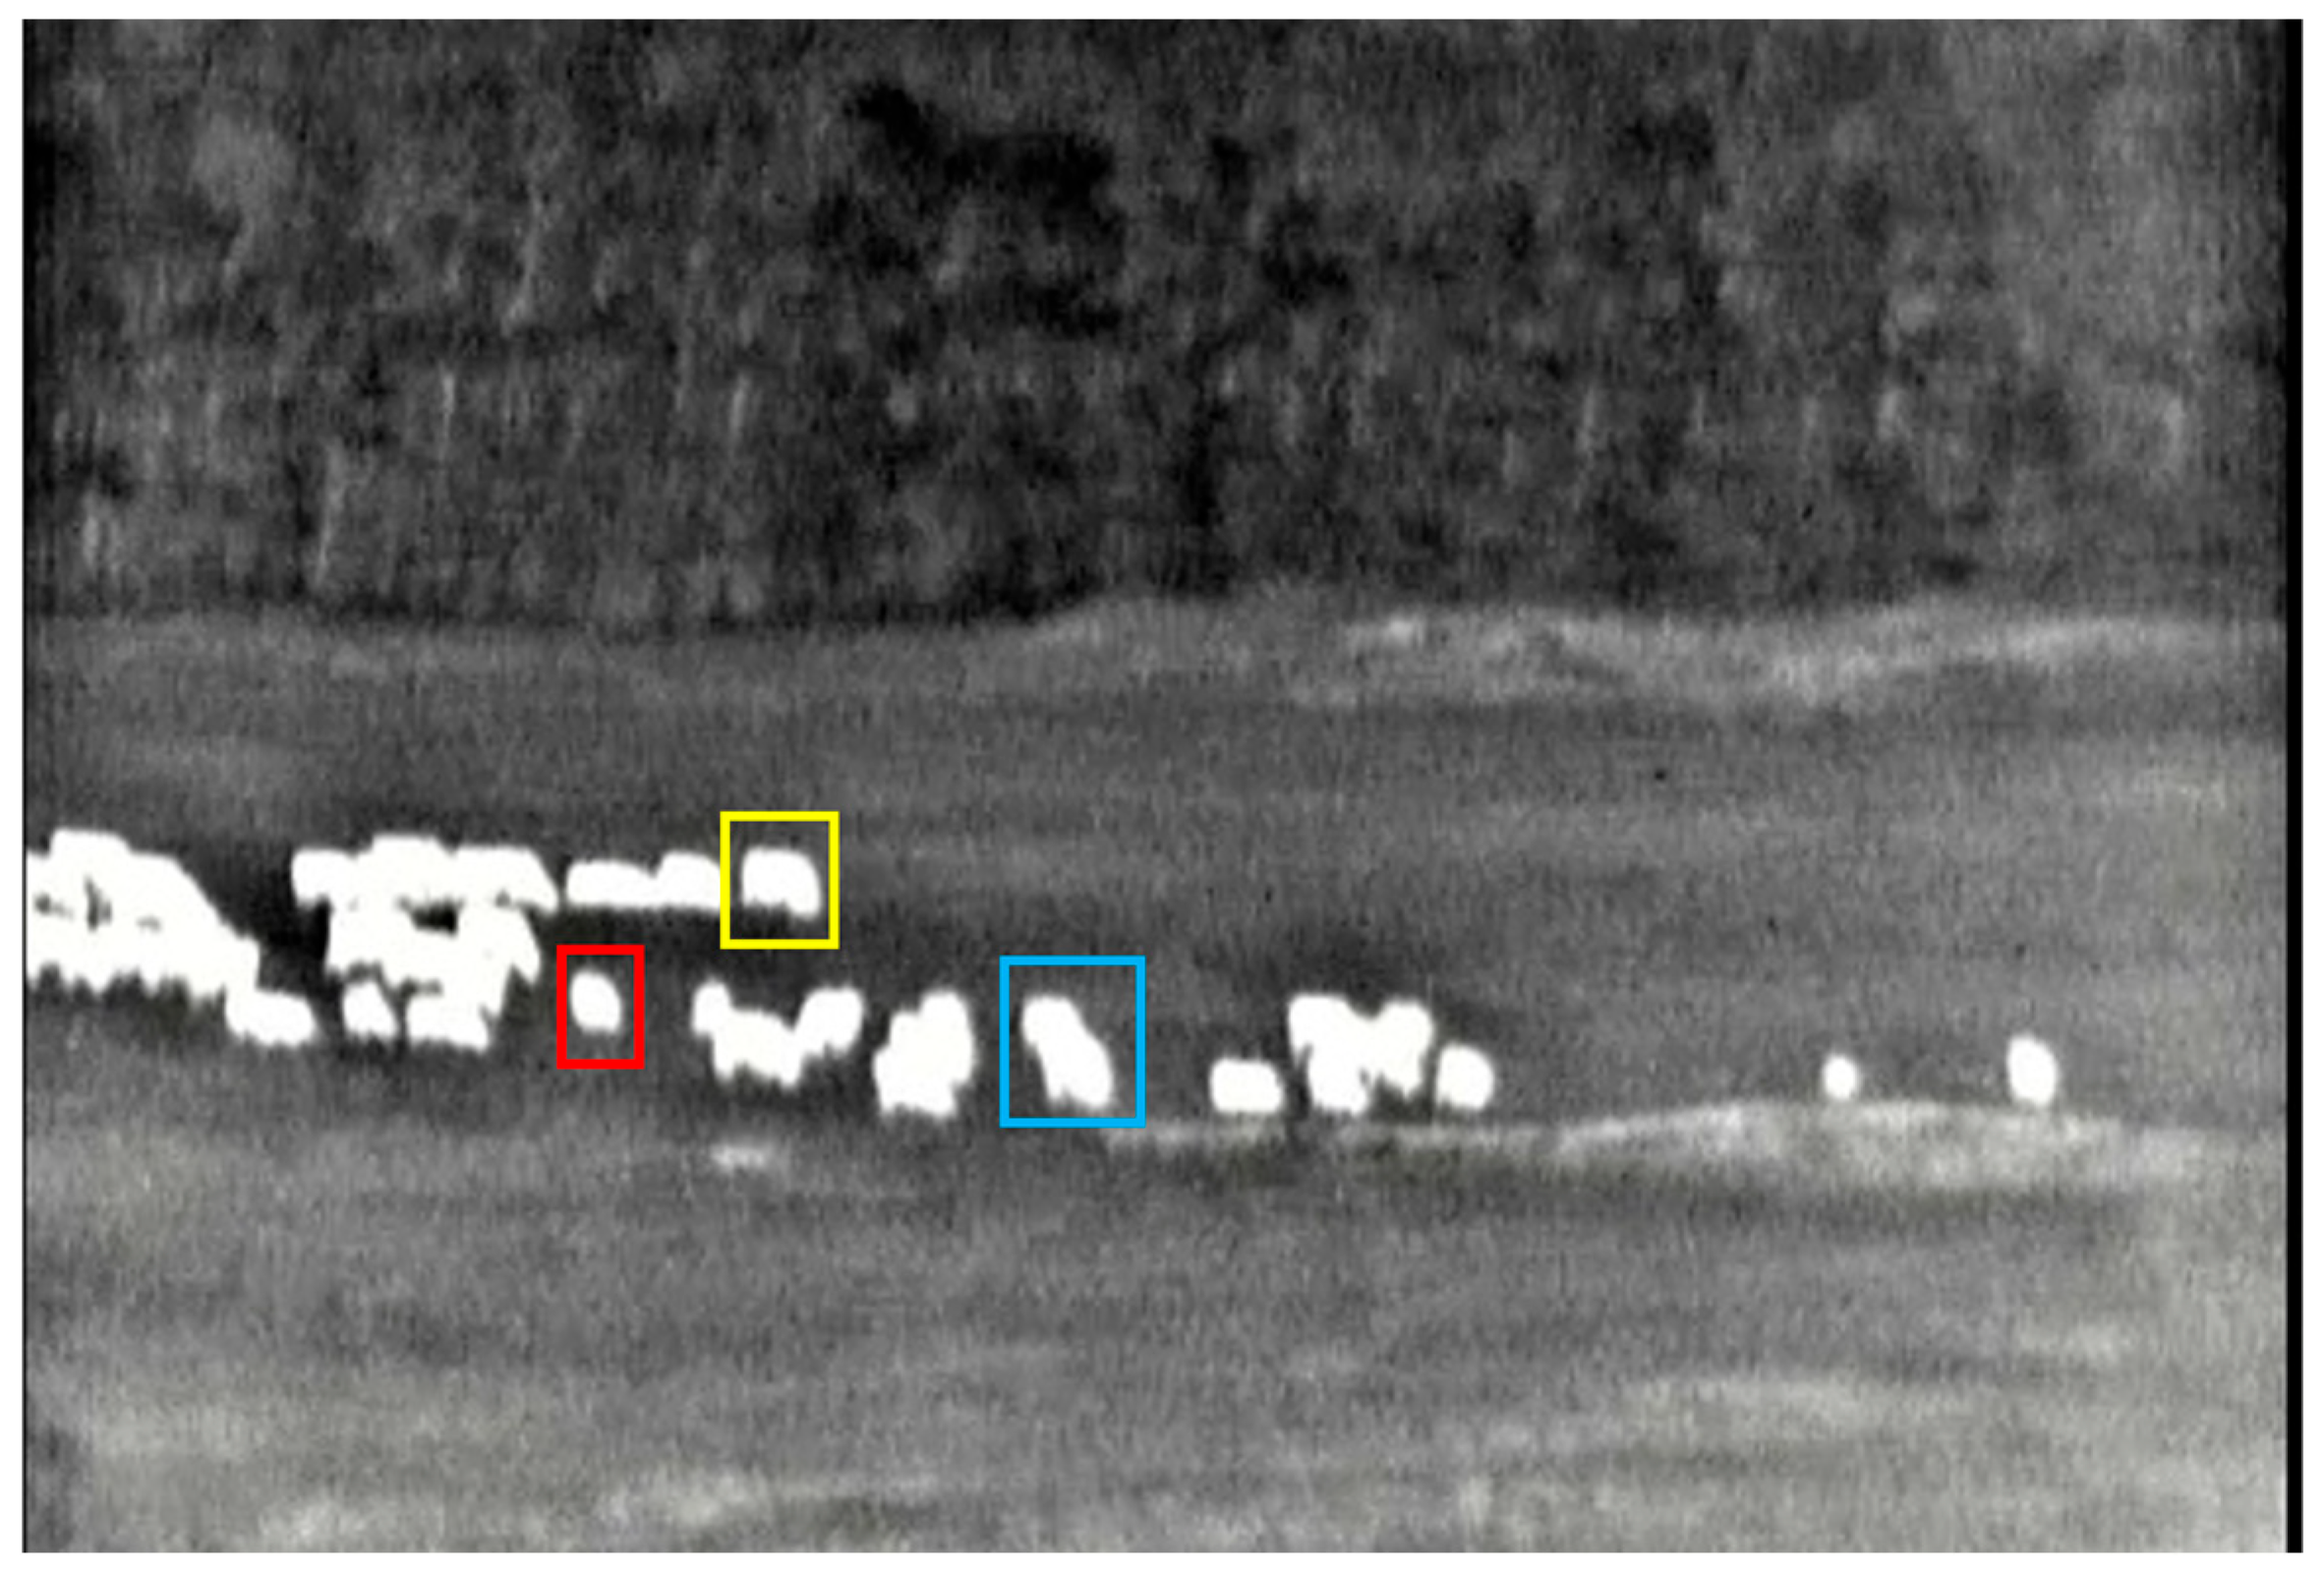
3.2. Dataset
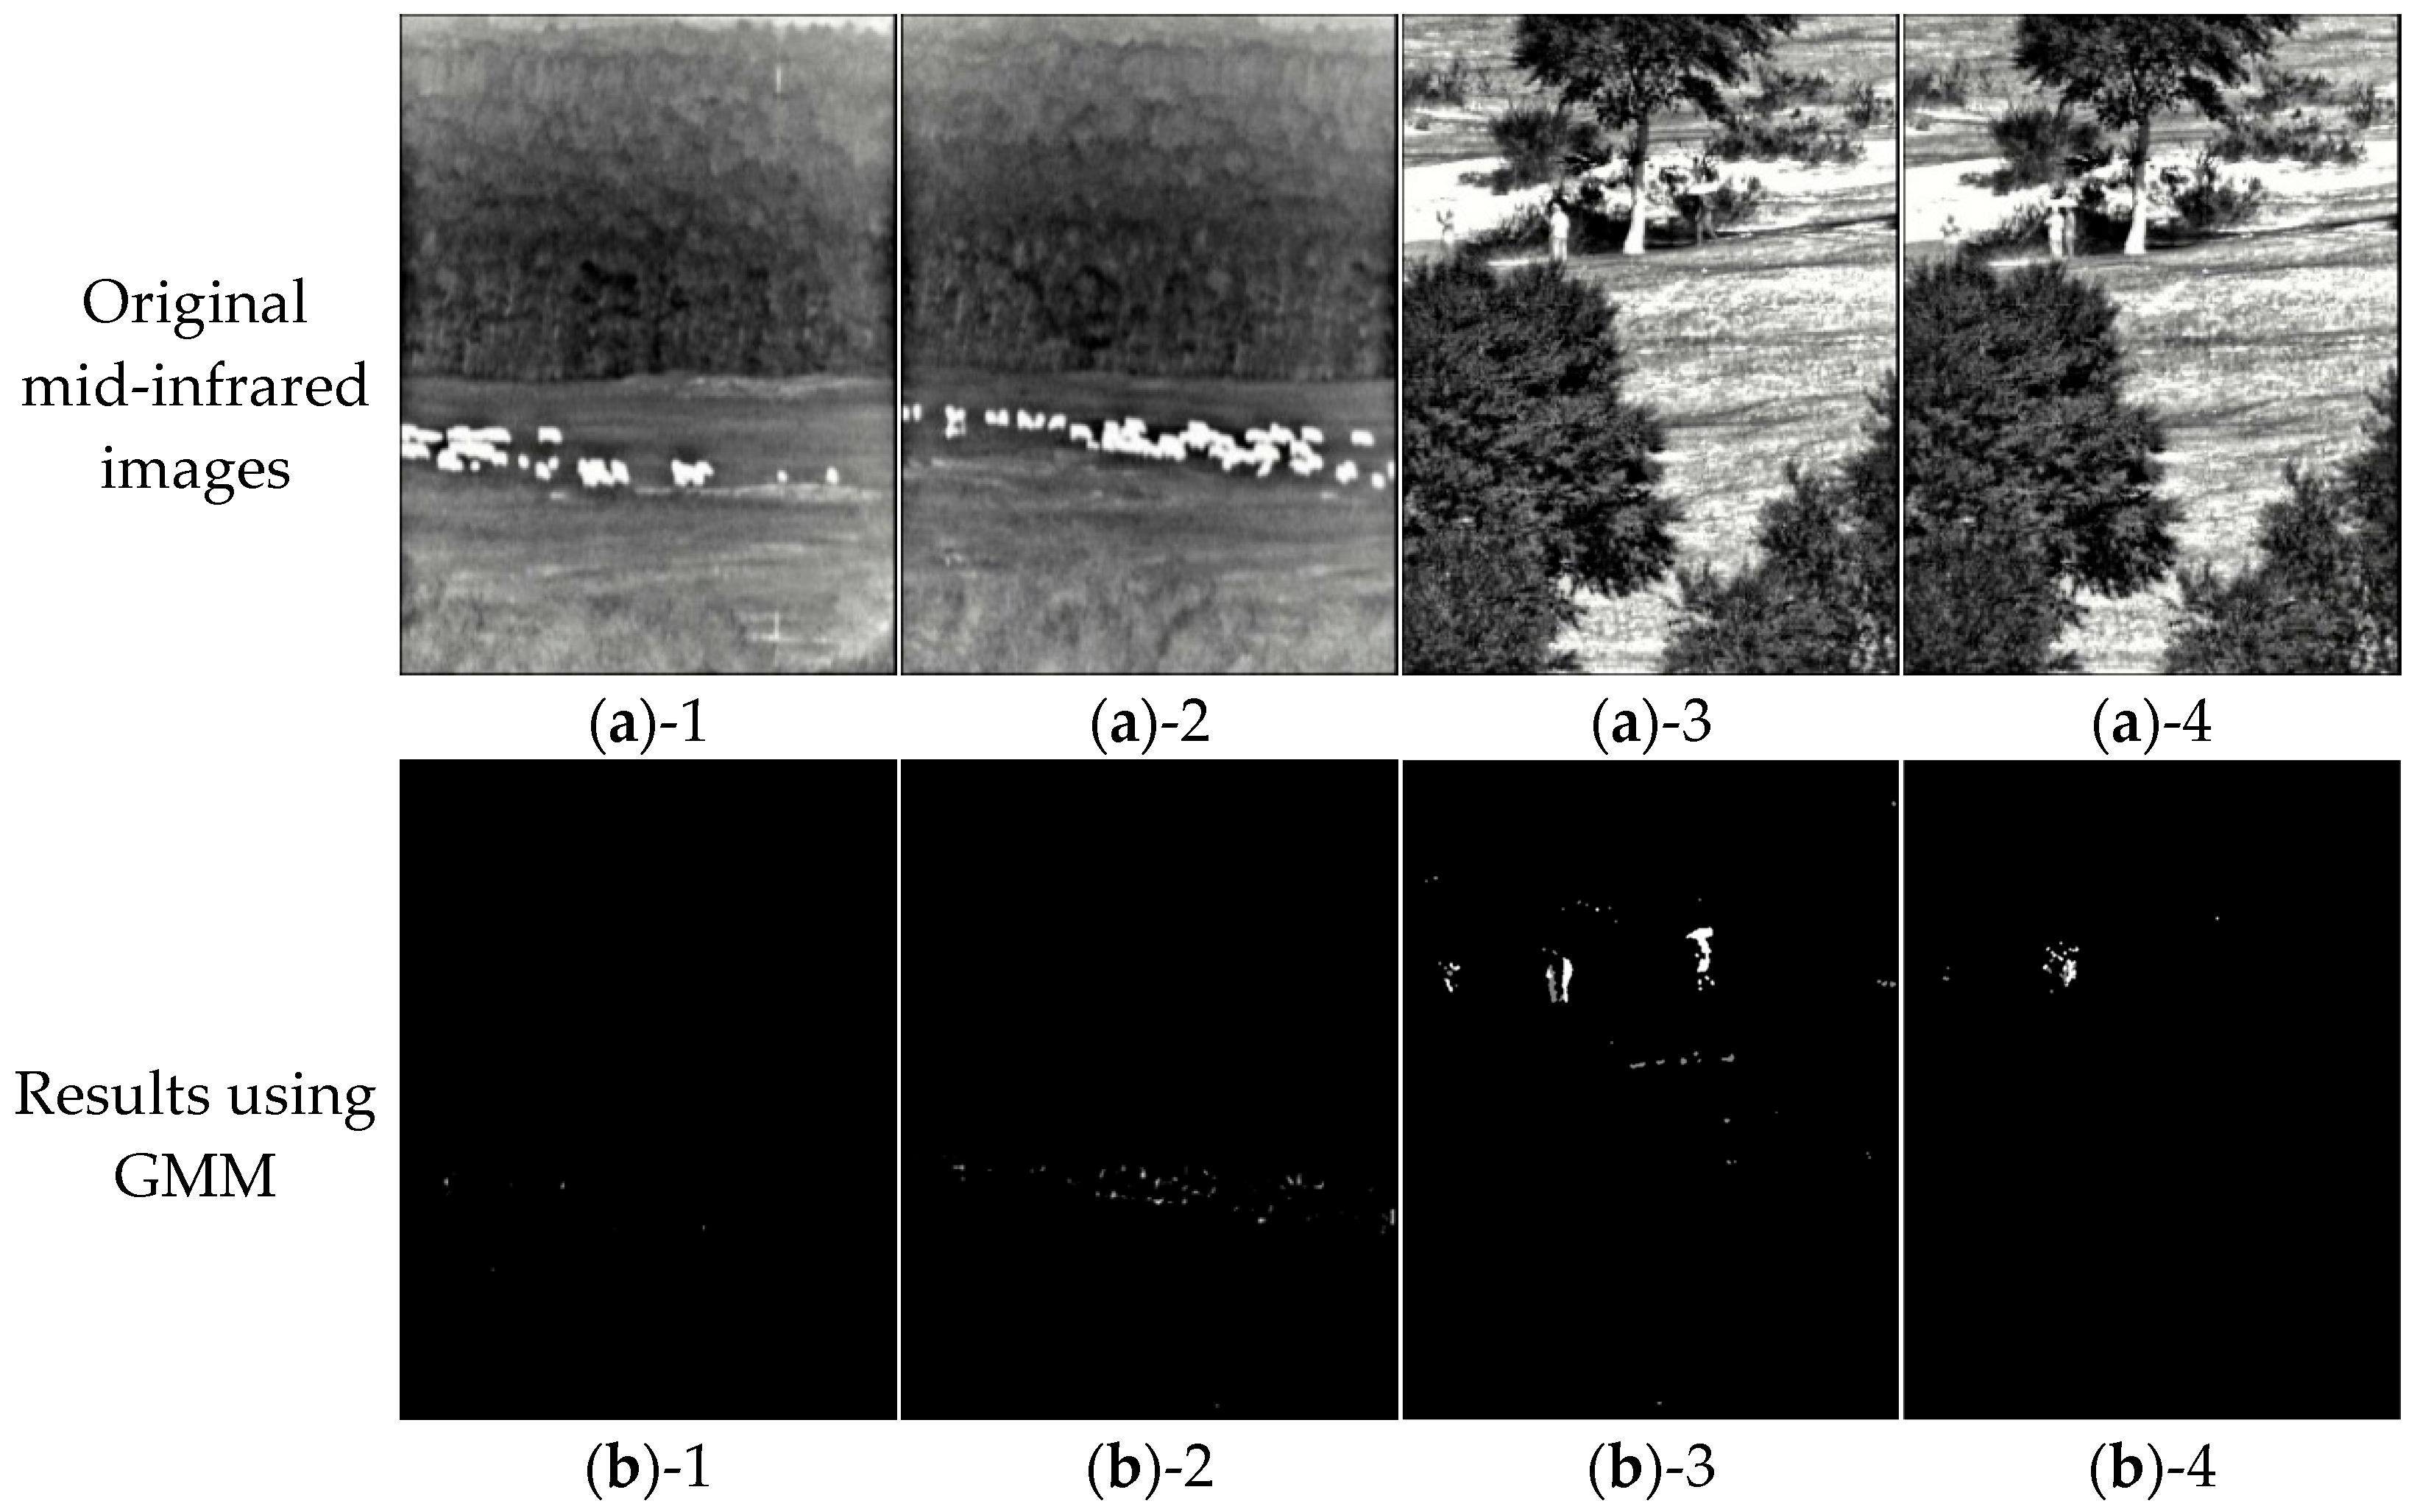
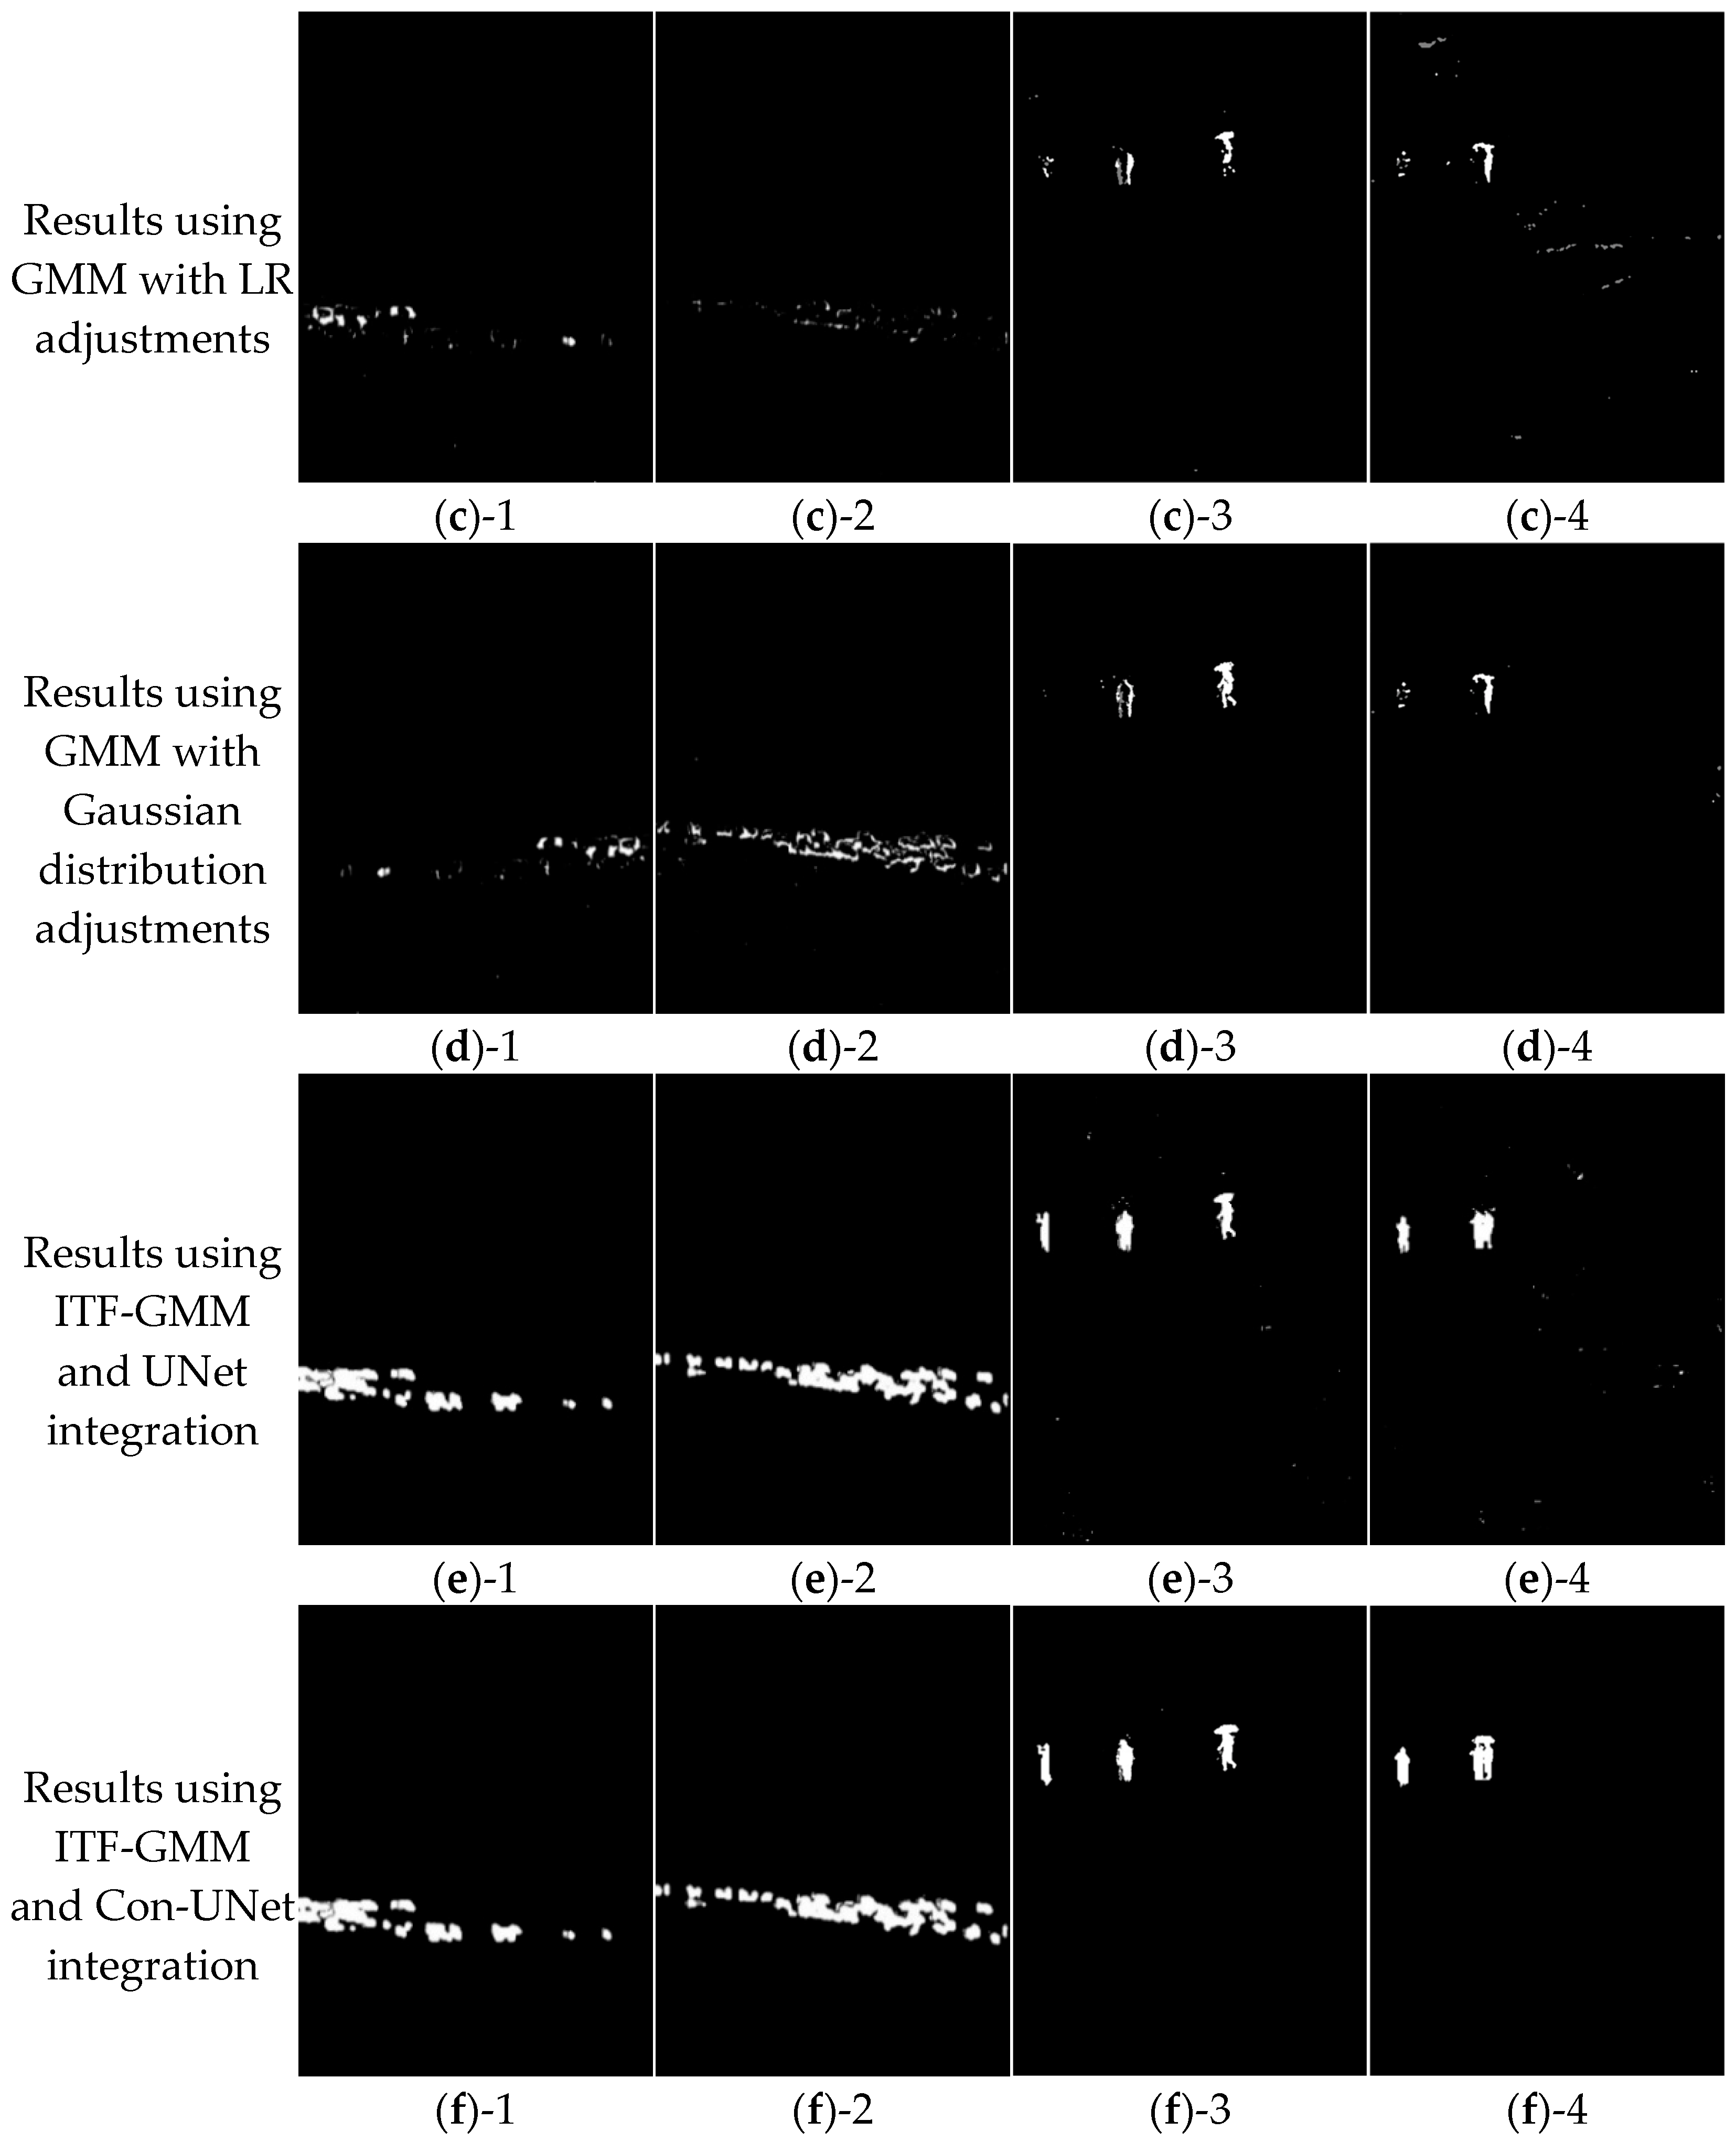
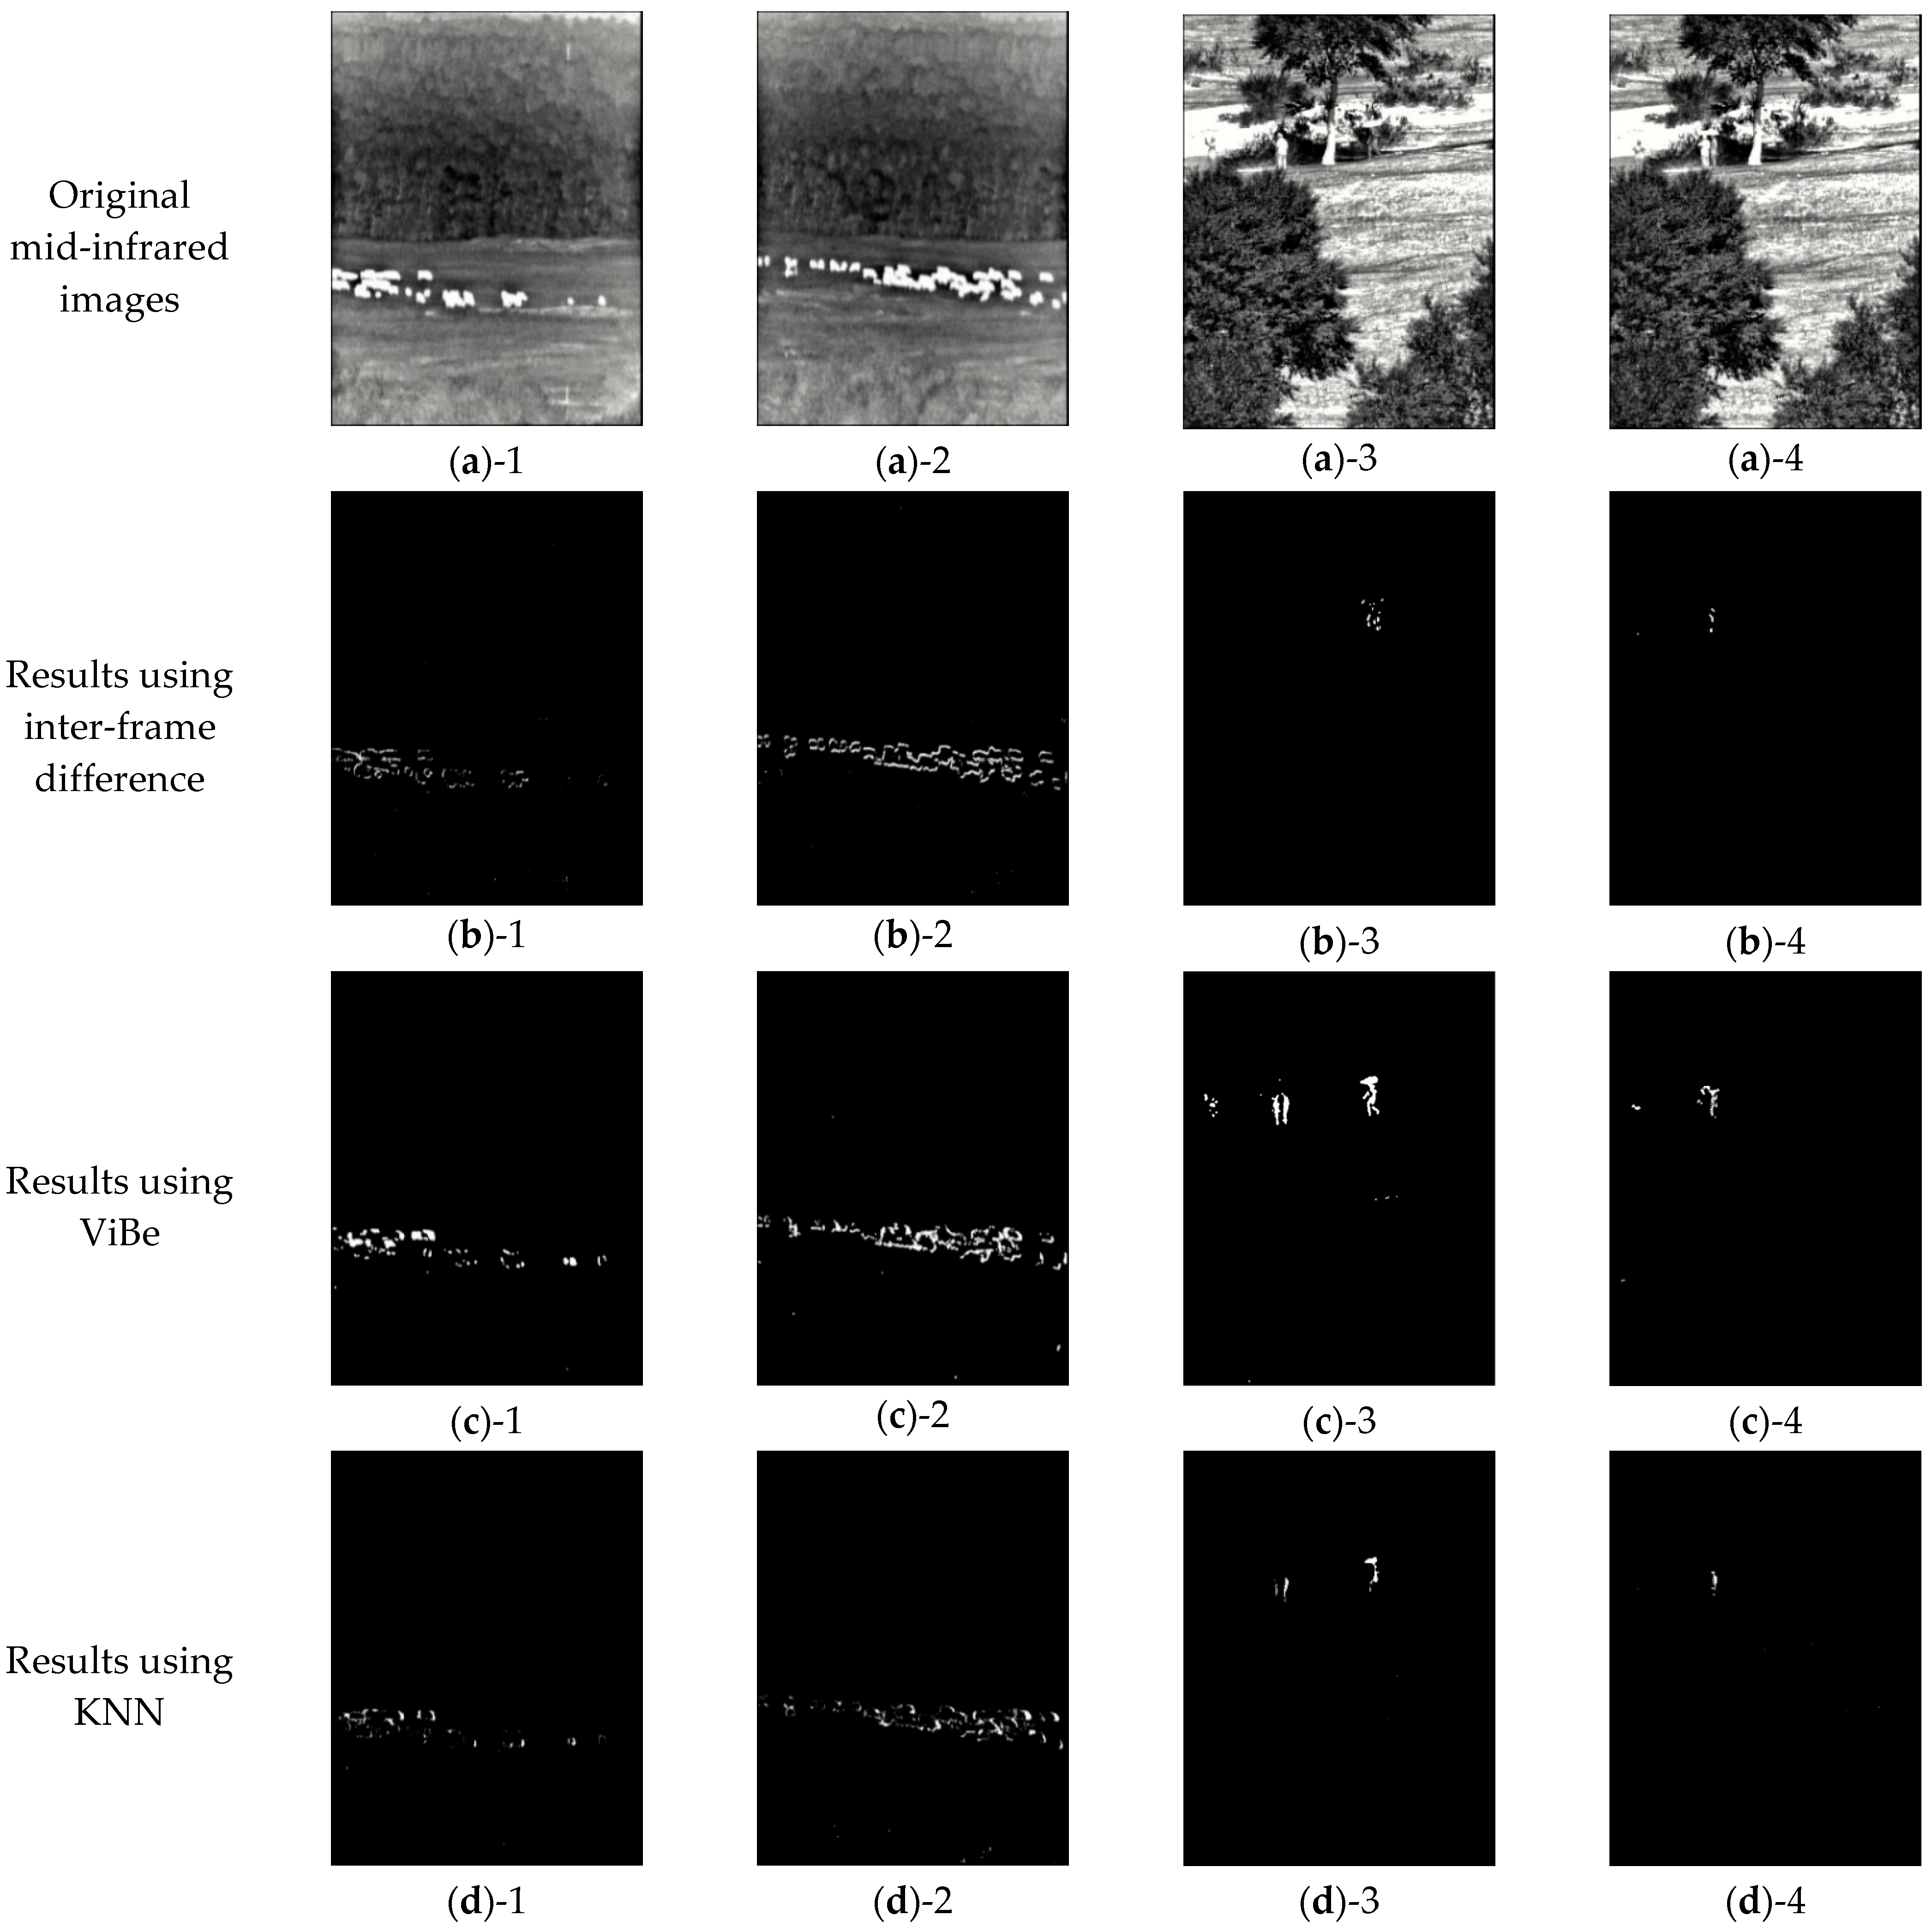
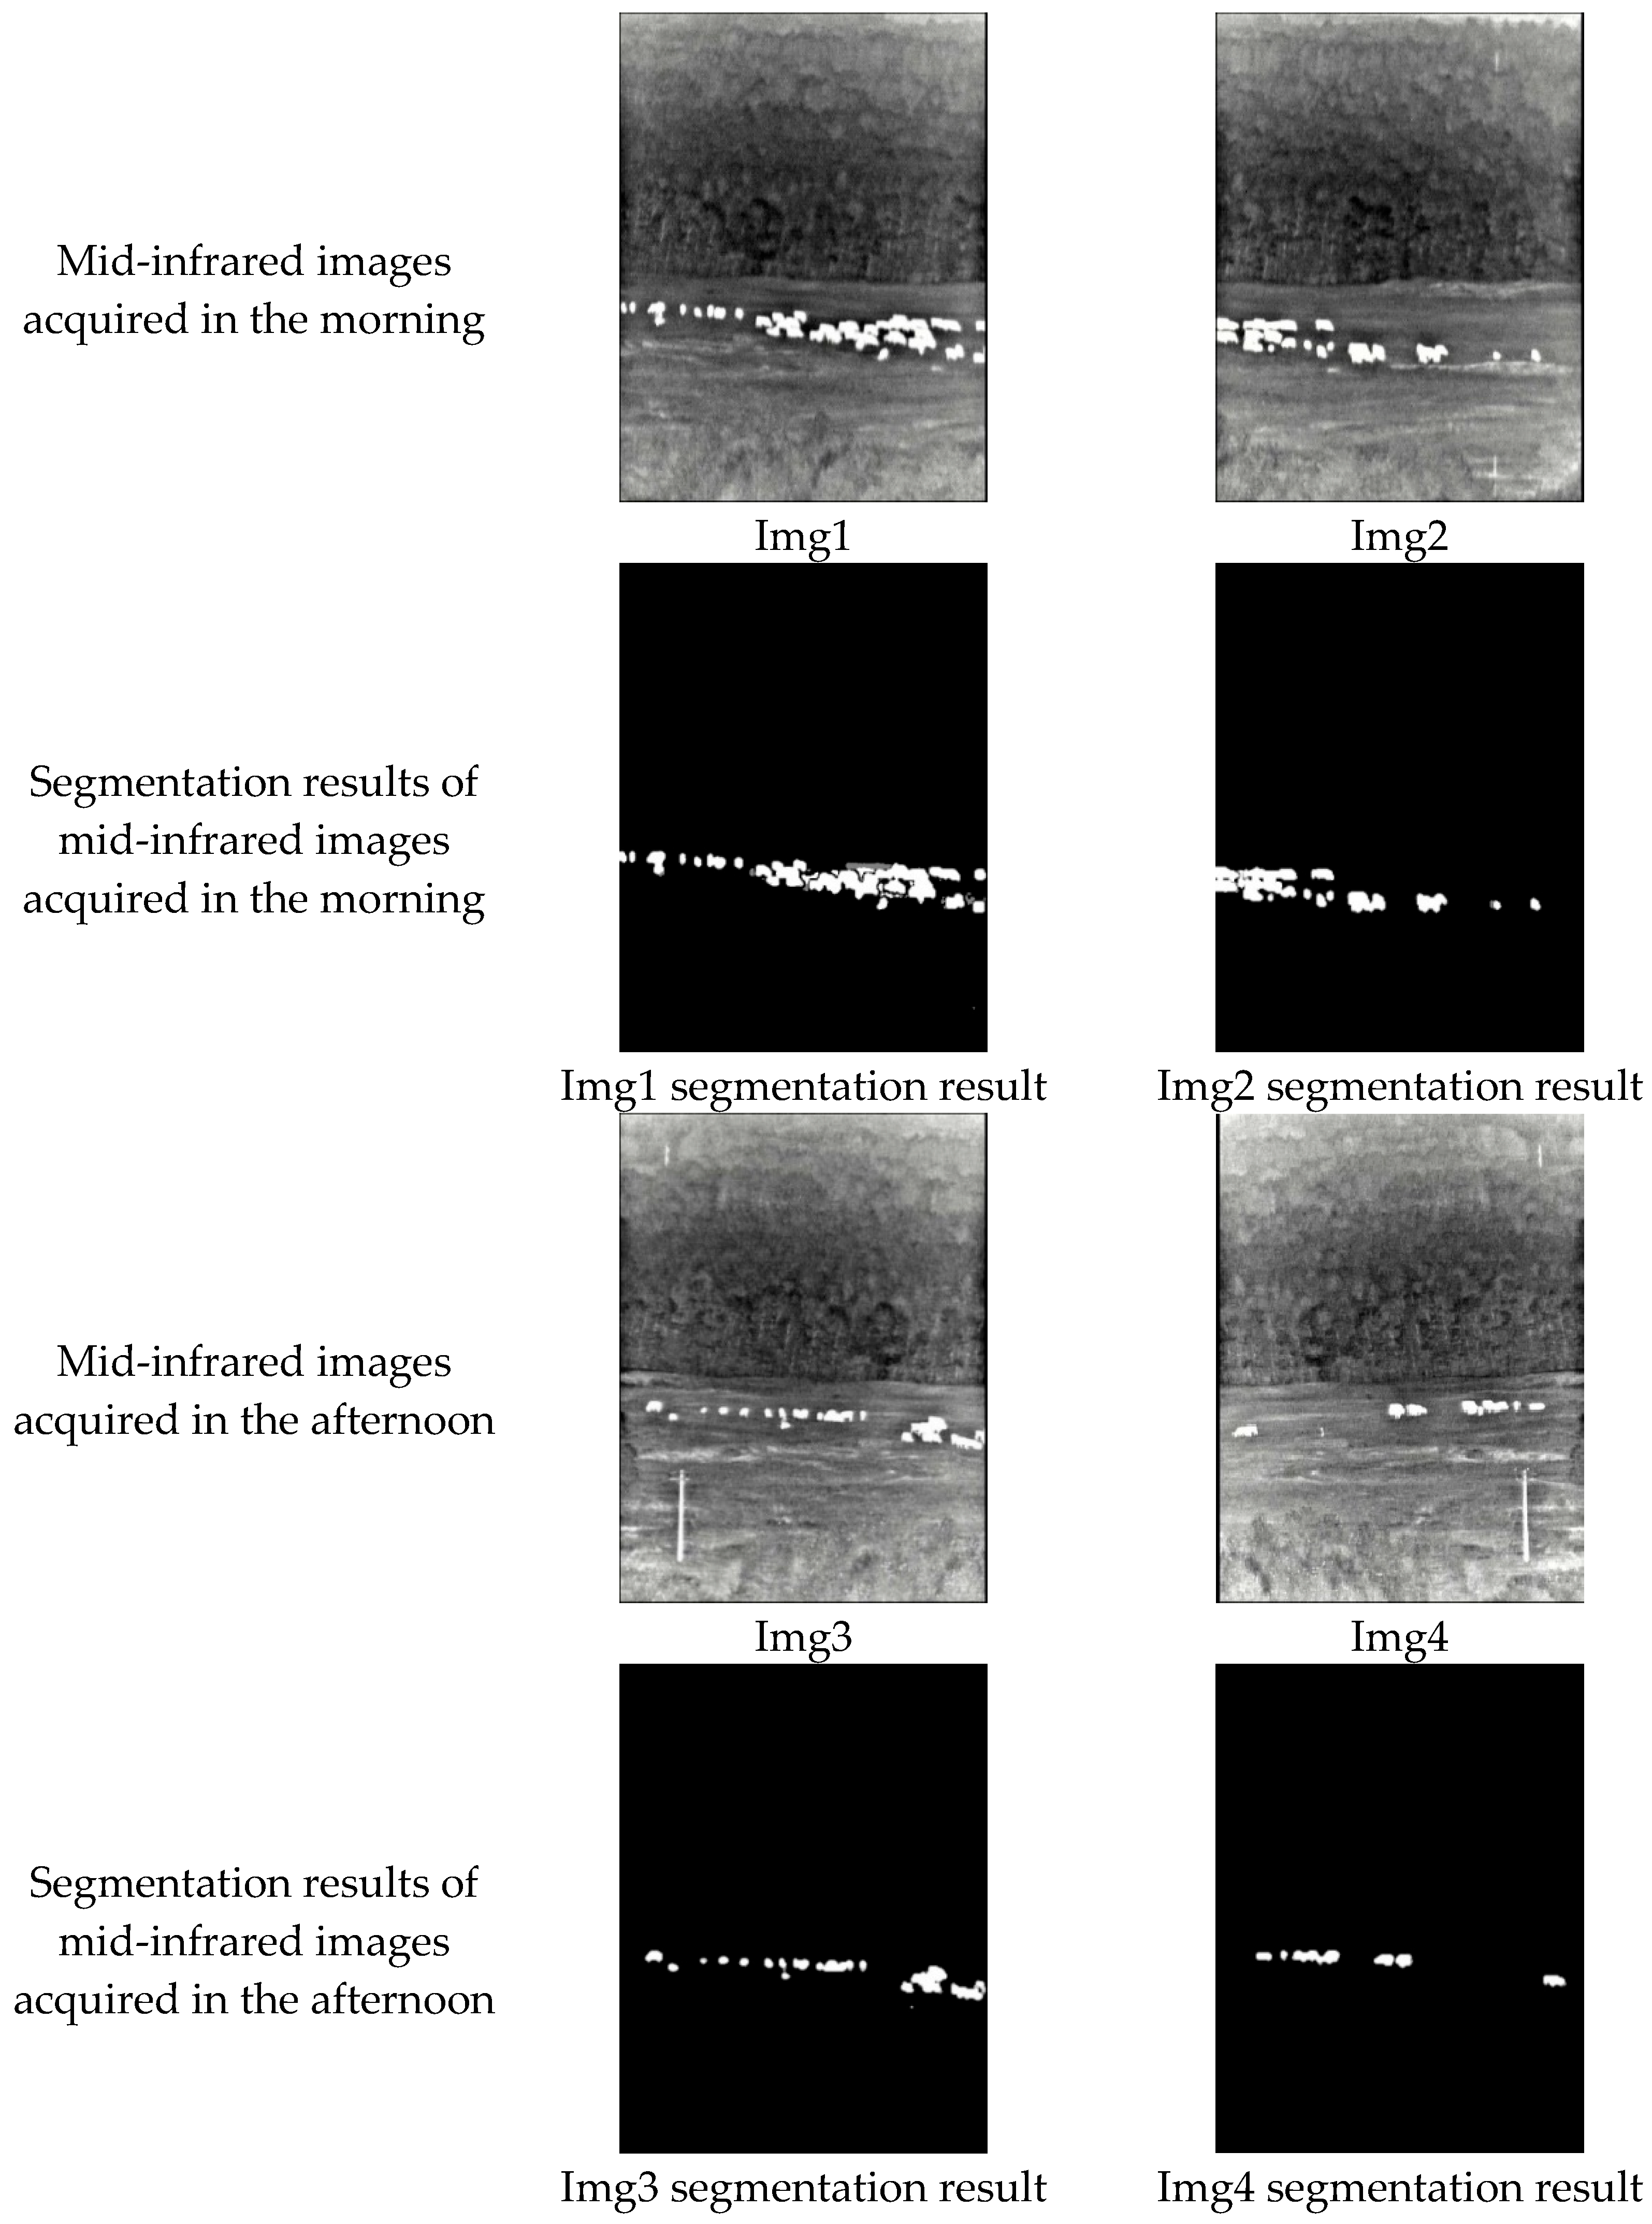
3.3. Evaluation of Proposed Computational Methods
4. Discussions and Interpretive Analyses
5. Conclusions
Author Contributions
Funding
Institutional Review Board Statement
Informed Consent Statement
Data Availability Statement
Conflicts of Interest
References
- Zhao, Y.; Huang, Z.; Liu, H. Intelligent Identification and Information Calculation of Slope Crack in Open-Pit Mine. Chin. J. Eng. 2024, 46, 1041–1053. [Google Scholar]
- Qiu, H.; Su, L.; Feng, X.; Tang, J. Role of Monitoring in Environmental Regulation: An Empirical Analysis of Grazing Restrictions in Pastoral China. Environ. Sci. Policy 2020, 114, 295–304. [Google Scholar] [CrossRef]
- Xing, C.; Wang, Z.; Meng, F.; Dong, C. Fusion of Infrared and Visible Images with Gaussian Smoothness and Joint Bilateral Filtering Iteration Decomposition. IET Comput. Vis. 2019, 13, 44–52. [Google Scholar] [CrossRef]
- Barbedo, J.G.A.; Koenigkan, L.V.; Santos, P.M.; Ribeiro, A.R.B. Counting Cattle in UAV Images—Dealing with Clustered Animals and Animal/Background Contrast Changes. Sensors 2020, 20, 2126. [Google Scholar] [CrossRef]
- Sarwar, F.; Griffin, A.; Rehman, S.U.; Pasang, T. Detecting Sheep in UAV Images. Comput. Electron. Agric. 2021, 187, 106219. [Google Scholar] [CrossRef]
- Sant’Ana, D.A.; Carneiro Brito Pache, M.; Martins, J.; Astolfi, G.; Pereira Soares, W.; Neves de Melo, S.L.; da Silva Heimbach, N.; de Moraes Weber, V.A.; Gonçalves Mateus, R.; Pistori, H. Computer Vision System for Superpixel Classification and Segmentation of Sheep. Ecol. Inform. 2022, 68, 101551. [Google Scholar] [CrossRef]
- Ayub, M.Y.; Hussain, A.; Hassan, M.F.U.; Khan, B.; Khan, F.A.; Al-Jumeily, D.; Khan, W. A Non-Restraining Sheep Activity Detection and Surveillance Using Deep Machine Learning. In Proceedings of the 2023 16th International Conference on Developments in eSystems Engineering (DeSE), Istanbul, Turkiye, 18–20 December 2023; pp. 66–72. [Google Scholar] [CrossRef]
- Wang, Z.; Ma, Y.; Zhang, Y.; Shang, J. Review of Remote Sensing Applications in Grassland Monitoring. Remote Sens. 2022, 14, 2903. [Google Scholar] [CrossRef]
- Fletcher, R. Mid-Infrared Digital Electronic Camera System for Assessing Natural Resources. J. Appl. Remote Sens. 2007, 1, 013542. [Google Scholar] [CrossRef]
- Stauffer, C.; Grimson, W.E.L. Adaptive Background Mixture Models for Real-Time Tracking. In Proceedings of the Proceedings. 1999 IEEE Computer Society Conference on Computer Vision and Pattern Recognition (Cat. No PR00149), Fort Collins, CO, USA, 23–25 June 1999; pp. 246–252. [Google Scholar] [CrossRef]
- Lee, J.; Park, M. An Adaptive Background Subtraction Method Based on Kernel Density Estimation. Sensors 2012, 12, 12279–12300. [Google Scholar] [CrossRef]
- Barnich, O.; Van Droogenbroeck, M. ViBe: A Universal Background Subtraction Algorithm for Video Sequences. IEEE Trans. Image Process. 2011, 20, 1709–1724. [Google Scholar] [CrossRef]
- Jun, Z.; Xinhua, Z. Foreground Object Detection Combining Gaussian Mixture Model and Inter-Frame Difference in the Application of Classroom Recording Apparatus. In Proceedings of the 2018 10th International Conference on Computer and Automation Engineering, Brisbane, Australia, 24–26 February 2018; pp. 111–115. [Google Scholar] [CrossRef]
- Kim, K.; Chalidabhongse, T.H.; Harwood, D.; Davis, L. Real-Time Foreground–Background Segmentation Using Codebook Model. Real-Time Imaging 2005, 11, 172–185. [Google Scholar] [CrossRef]
- Martins, I.; Carvalho, P.; Corte-Real, L.; Alba-Castro, J.L. BMOG: Boosted Gaussian Mixture Model with Controlled Complexity for Background Subtraction. Pattern Anal. Appl. 2018, 21, 641–654. [Google Scholar] [CrossRef]
- Lu, X.; Xu, C.; Wang, L.; Teng, L. Improved Background Subtraction Method for Detecting Moving Objects Based on GMM. IEEJ Trans. Electr. Electron. Eng. 2018, 13, 1540–1550. [Google Scholar] [CrossRef]
- Liu, J.; Guo, R.; Wang, Y. Gaussian Mixture Model Target Detection Algorithm Based on Kalman Filter. J. Detect. Control 2022, 44, 79–84. [Google Scholar]
- Zhang, X.; Fu, Q.; Li, Y.; Han, Z.; Jiang, N.; Li, C. A Dynamic Detection Method for Railway Slope Falling Rocks Based on the Gaussian Mixture Model Segmentation Algorithm. Appl. Sci. 2024, 14, 4454. [Google Scholar] [CrossRef]
- Li, J.; Duan, F.; Fu, X.; Niu, G.; Wang, R.; Zheng, H. Moving Target Detection Based on Improved Gaussian Mixture Model in Dynamic and Complex Environments. IET Image Process. 2025, 19, e70001. [Google Scholar] [CrossRef]
- Braham, M.; Van Droogenbroeck, M. Deep Background Subtraction with Scene-Specific Convolutional Neural Networks. In Proceedings of the 2016 International Conference on Systems, Signals and Image Processing (IWSSIP), Bratislava, Slovakia, 23–25 May 2016; pp. 1–4. [Google Scholar] [CrossRef]
- Lim, L.A.; Yalim Keles, H. Foreground Segmentation Using Convolutional Neural Networks for Multiscale Feature Encoding. Pattern Recognit. Lett. 2018, 112, 256–262. [Google Scholar] [CrossRef]
- Liu, P.; Feng, J.; Sang, J.; Kim, Y.K. Fusion Attention Mechanism for Foreground Detection Based on Multiscale U-Net Architecture. Comput. Intell. Neurosci. 2022, 2022, 7432615. [Google Scholar] [CrossRef]
- Gowda, V.; Gopalakrishna, M.; Megha, J.; Mohankumar, S. Foreground Segmentation Network Using Transposed Convolutional Neural Networks and Up Sampling for Multiscale Feature Encoding. Neural Netw. 2024, 170, 167–175. [Google Scholar] [CrossRef]
- Li, B.; Rao, P.; Su, Y.; Chen, X. HMCNet: A Hybrid Mamba–CNN UNet for Infrared Small Target Detection. Remote Sens. 2025, 17, 452. [Google Scholar] [CrossRef]
- Tian, Z.; Zheng, N.; Xue, J.; Lan, X.; Li, C.; Zhou, G. Video Object Segmentation with Shape Cue Based on Spatiotemporal Superpixel Neighbourhood. IET Comput. Vis. 2014, 8, 16–25. [Google Scholar] [CrossRef]
- Abdoli, M.; Sarikhani, H.; Ghanbari, M.; Brault, P. Gaussian Mixture Model-based Contrast Enhancement. IET Image Process. 2015, 9, 569–577. [Google Scholar] [CrossRef]
- Sara, U.; Akter, M.; Uddin, M.S. Image Quality Assessment through FSIM, SSIM, MSE and PSNR—A Comparative Study. J. Comput. Commun. 2019, 7, 8–18. [Google Scholar] [CrossRef]
- Ronneberger, O.; Fischer, P.; Brox, T. U-Net: Convolutional Networks for Biomedical Image Segmentation. In Proceedings of the Medical Image Computing and Computer-Assisted Intervention—MICCAI 2015: 18th International Conference, Munich, Germany, 5–9 October 2015; pp. 234–241. [Google Scholar] [CrossRef]
- Yan, Y.; Wang, P.; Wu, Y.; Feng, G.; Yang, Z.P. Mid-Infrared Detector Responsivity Measurement Method Based on Blackbody Source and Band-Pass Filter. Mod. Appl. Phys. 2013, 4, 242–245. [Google Scholar]
- Russell, B.C.; Torralba, A.; Murphy, K.P.; Freeman, W.T. LabelMe: A Database and Web-Based Tool for Image Annotation. Int. J. Comput. Vis. 2008, 77, 157–173. [Google Scholar] [CrossRef]
- Li, A.; Li, D.; Wang, A. A Two-Stage YOLOv5s–U-Net Framework for Defect Localization and Segmentation in Overhead Transmission Lines. Sensors 2025, 25, 2903. [Google Scholar] [CrossRef] [PubMed]
- Peng, Y.; Chen, D.; Sonka, M. U-Net v2: Rethinking the Skip Connections of U-Net for Medical Image Segmentation. In Proceedings of the 2025 IEEE 22nd International Symposium on Biomedical Imaging (ISBI), Houston, TX, USA, 14–17 April 2025; pp. 1–5. [Google Scholar] [CrossRef]
- Stojnić, V.; Risojević, V.; Muštra, M.; Jovanović, V.; Filipi, J.; Kezić, N.; Babić, Z. A Method for Detection of Small Moving Objects in UAV Videos. Remote Sens. 2021, 13, 653. [Google Scholar] [CrossRef]
- Alom, M.Z.; Hasan, M.; Yakopcic, C.; Taha, T.M.; Asari, V.K. Recurrent Residual Convolutional Neural Network Based on U-Net (R2U-Net) for Medical Image Segmentation. arXiv 2018, arXiv:1802.06955. [Google Scholar] [CrossRef]
- Oktay, O.; Schlemper, J.; Folgoc, L.L.; Lee, M.; Heinrich, M.; Misawa, K.; Mori, K.; McDonagh, S.; Hammerla, N.Y.; Kainz, B. Attention U-Net: Learning Where to Look for the Pancreas. arXiv 2018, arXiv:1804.03999. [Google Scholar] [CrossRef]
- Xue, Z. Digital Technology Can Help to Achieve the Goal of “Double Carbon”. China CIO News, 15 August 2024; pp. 9–11. [Google Scholar]
- Xu, M.; Zhou, H.; Lu, S.; Zhu, P.; Wang, X. Real-Time Panoramic Map Modeling Method Based on Multisource Image Fusion and Three-Dimensional Rendering. J. Electron. Imaging 2023, 32, 013036. [Google Scholar] [CrossRef]
- Razeghi, M.; Nguyen, B.M. Advances in Mid-Infrared Detection and Imaging: A Key Issues Review. Rep. Prog. Phys. 2014, 77, 082401. [Google Scholar] [CrossRef] [PubMed]


| Method | Representative Methods | Advantages | Disadvantages |
|---|---|---|---|
| Traditional background subtraction method | GMM, KDE, ViBe, etc. | High real-time performance | Poor performance in complex scenarios |
| Deep learning-based method | CNN, UNet, etc. | Strong feature extraction capability | High demand for computing resources |
| Experiment 1 | Experiment 2 | Experiment 3 | Experiment 4 | Experiment 5 | |
|---|---|---|---|---|---|
| GMM | √ | √ | √ | √ | √ |
| GMM with LR adjustments | - | √ | √ | √ | √ |
| GMM with N adjustments | - | - | √ | √ | √ |
| UNet | - | - | - | √ | - |
| Con-UNet | - | - | - | - | √ |
| Precision | 0.6307 | 0.5169 | 0.7562 | 0.9021 | 0.9613 |
| Accuracy | 0.9768 | 0.9864 | 0.9857 | 0.9806 | 0.9907 |
| IOU | 0.0172 | 0.0724 | 0.2448 | 0.9347 | 0.9461 |
| Recall | 0.0174 | 0.0777 | 0.2657 | 0.9136 | 0.9702 |
| Interfering Time (fps) | 22.33 | 21.07 | 17.56 | 9.15 | 7.26 |
| FLOPs (G) | - | - | - | 60.24 | 63.44 |
| Method | Precision | Accuracy | IOU | Recall | Training Time (s) | Interfering Time (fps) |
|---|---|---|---|---|---|---|
| Inter-frame difference | 0.5939 | 0.9871 | 0.0954 | 0.1020 | - | 80.78 |
| ViBe | 0.5748 | 0.9827 | 0.2112 | 0.2503 | - | 7.91 |
| KNN | 0.5180 | 0.9875 | 0.0506 | 0.0531 | - | 21.07 |
| Method in the literature [33] | 0.0 | 0.9873 | 0.0 | 0.0 | - | 10.06 |
| R2UNet | 0.9985 | 0.9947 | 0.0184 | 0.0185 | 1913.43 | 6.46 |
| Att UNet | 0.9428 | 0.9895 | 0.9131 | 0.9626 | 858.91 | 7.47 |
| Ours | 0.9692 | 0.9987 | 0.9481 | 0.9775 | 916.15 | 7.26 |
| Evaluation metrics |  Img1 |  Img2 |  Img3 |  Img4 |
| Brenner | 80,664,844 | 82,031,387 | 112,356,710 | 118,895,951 |
| Roberts | 163,247,568 | 160,109,764 | 216,976,433 | 237,461,410 |
| SMD2 | 16,377,601.0 | 17,695,173.0 | 25,543,868.0 | 27,485,529.0 |
| Image | Precision | Accuracy | IOU | Recall |
|---|---|---|---|---|
| Img1 | 0.9415 | 0.9990 | 0.9101 | 0.9646 |
| Img2 | 0.9236 | 0.9946 | 0.9046 | 0.9503 |
| Img3 | 0.9089 | 0.9992 | 0.8896 | 0.9767 |
| Img4 | 0.9322 | 0.9985 | 0.9052 | 0.9658 |
| Picture | Precision | Accuracy | IOU | Recall |
|---|---|---|---|---|
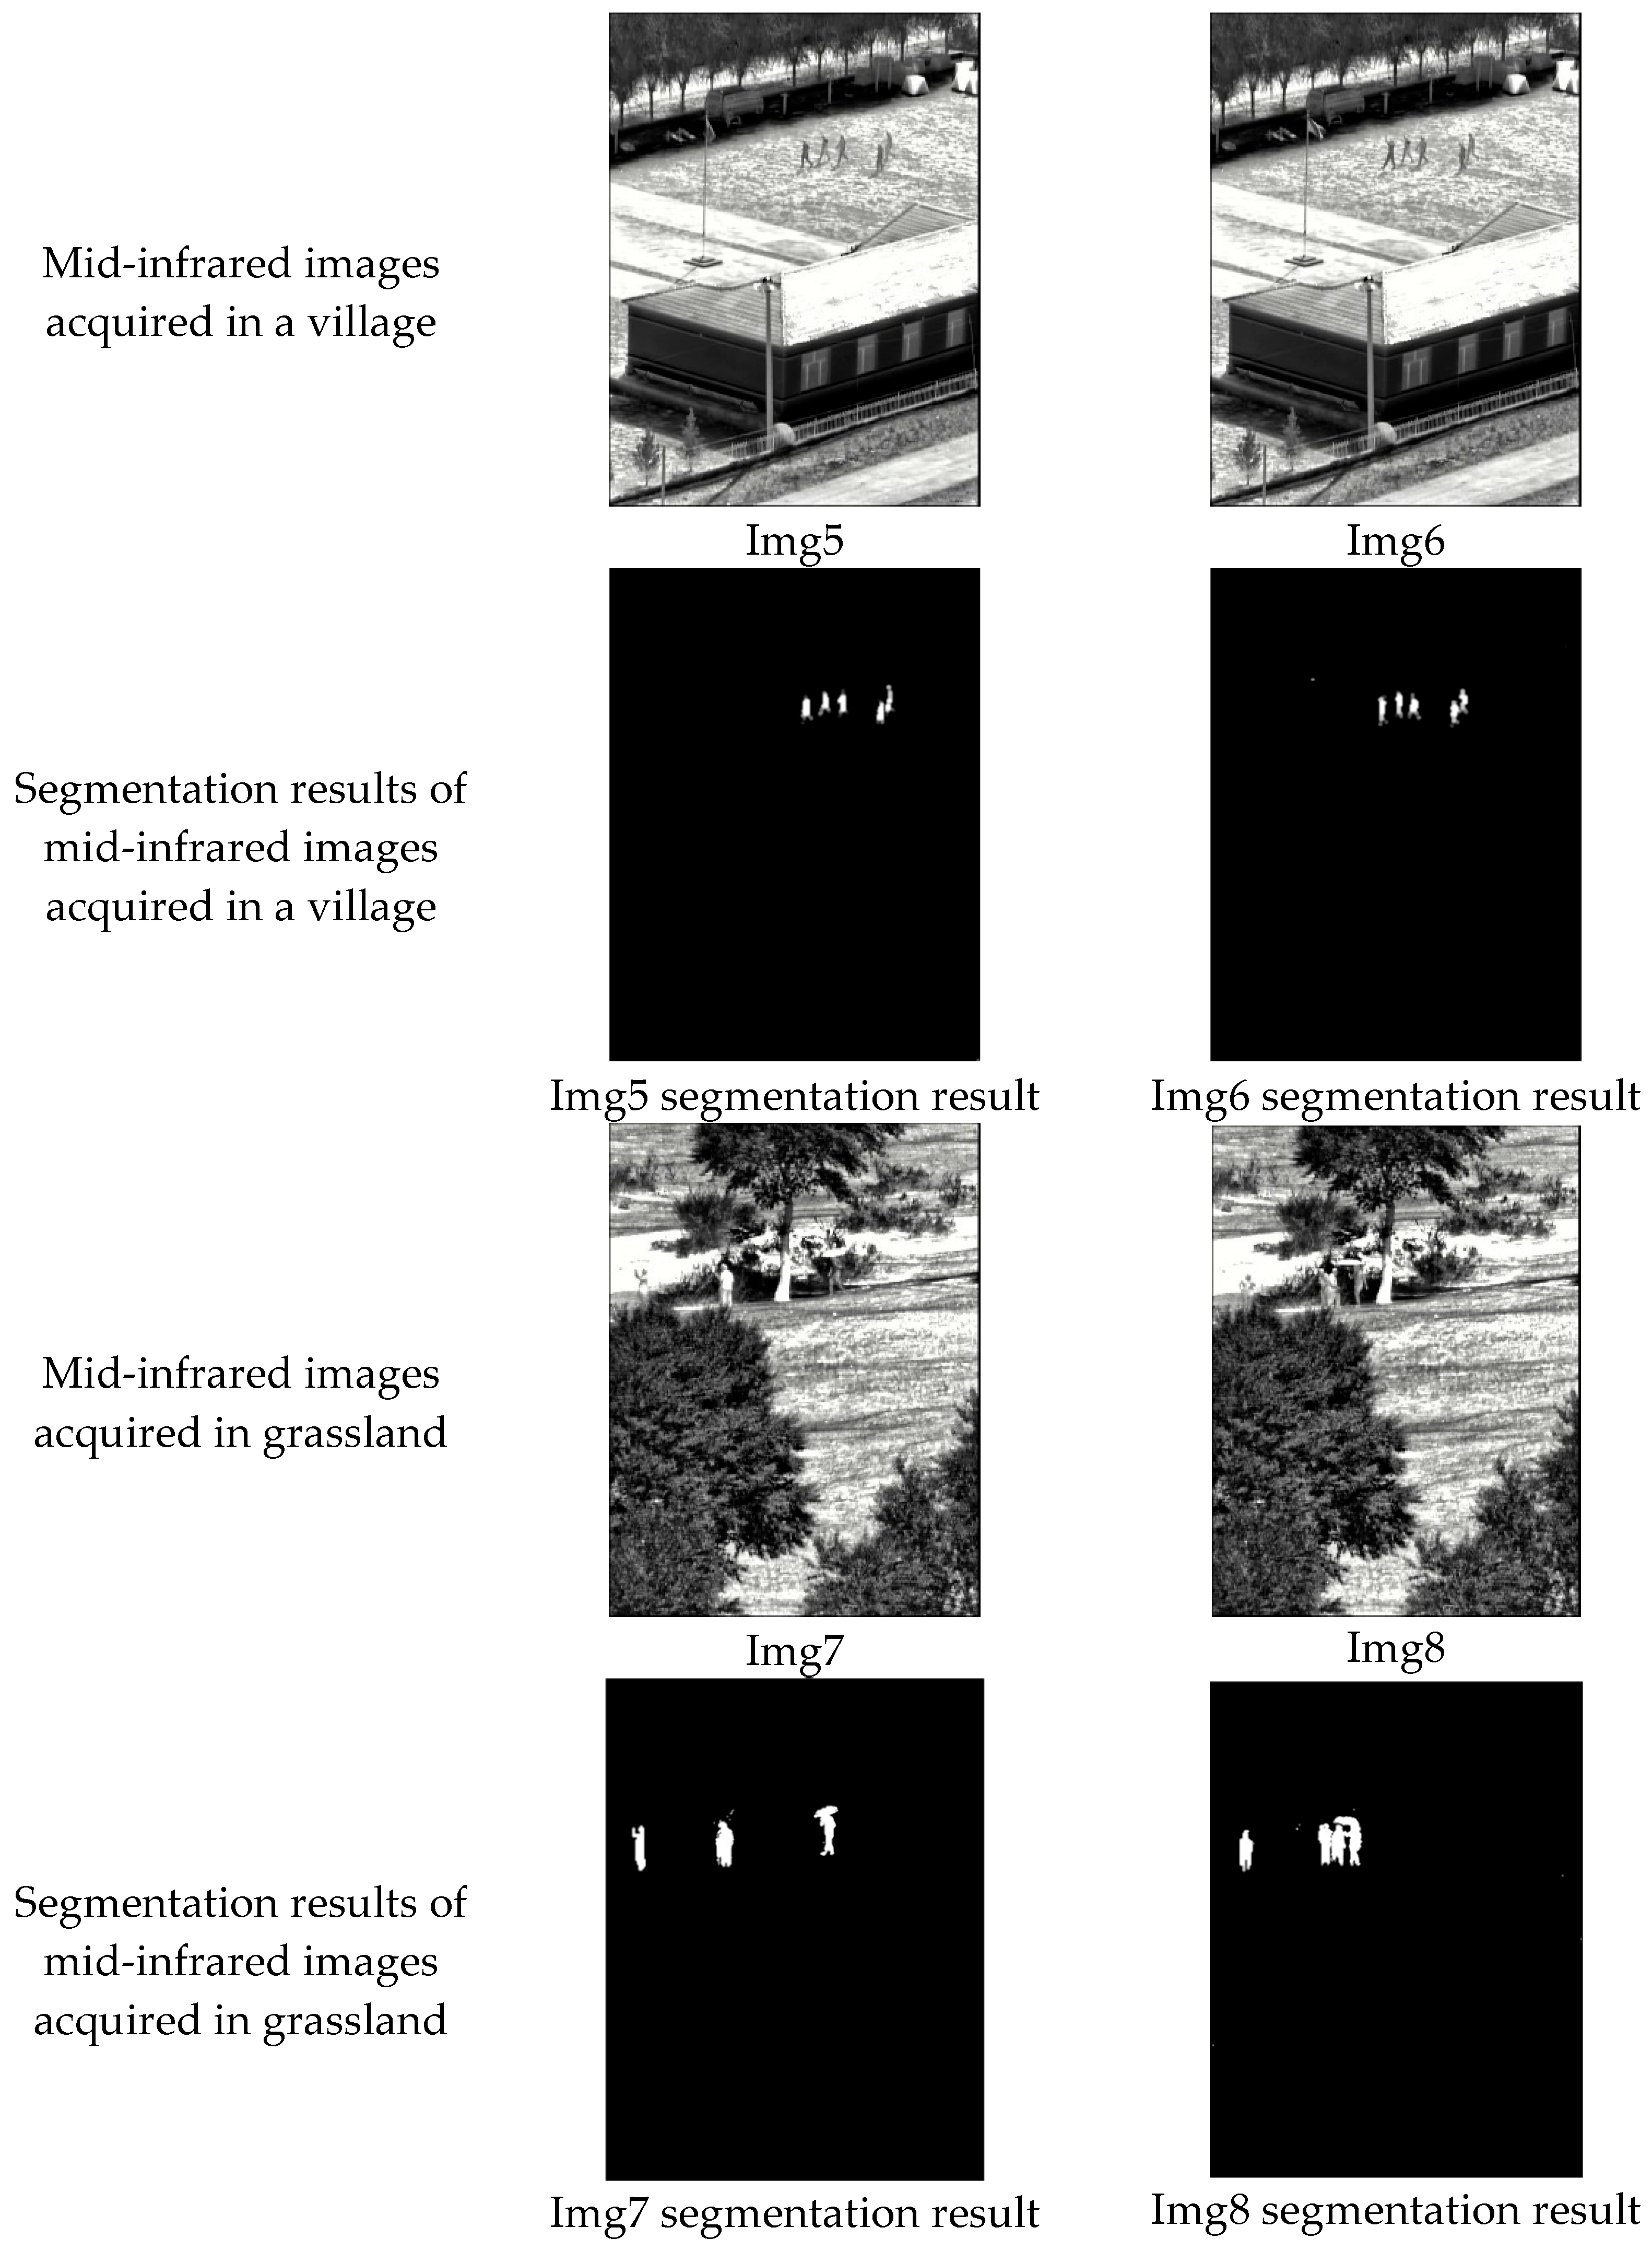
| Img5 | 0.9357 | 0.9821 | 0.9014 | 0.9656 |
| Img6 | 0.9012 | 0.9891 | 0.9159 | 0.9624 |
| Img7 | 0.9123 | 0.9932 | 0.9026 | 0.9423 |
| Img8 | 0.9115 | 0.9887 | 0.9244 | 0.9761 |
Disclaimer/Publisher’s Note: The statements, opinions and data contained in all publications are solely those of the individual author(s) and contributor(s) and not of MDPI and/or the editor(s). MDPI and/or the editor(s) disclaim responsibility for any injury to people or property resulting from any ideas, methods, instructions or products referred to in the content. |
© 2025 by the authors. Licensee MDPI, Basel, Switzerland. This article is an open access article distributed under the terms and conditions of the Creative Commons Attribution (CC BY) license (https://creativecommons.org/licenses/by/4.0/).
Share and Cite
Lv, M.; Liu, H.; Wang, M.; Wang, D.; Li, H.; Lu, X.; Guo, Z.; Li, Q. Small Scale Multi-Object Segmentation in Mid-Infrared Image Using the Image Timing Features–Gaussian Mixture Model and Convolutional-UNet. Sensors 2025, 25, 3440. https://doi.org/10.3390/s25113440
Lv M, Liu H, Wang M, Wang D, Li H, Lu X, Guo Z, Li Q. Small Scale Multi-Object Segmentation in Mid-Infrared Image Using the Image Timing Features–Gaussian Mixture Model and Convolutional-UNet. Sensors. 2025; 25(11):3440. https://doi.org/10.3390/s25113440
Chicago/Turabian StyleLv, Meng, Haoting Liu, Mengmeng Wang, Dongyang Wang, Haiguang Li, Xiaofei Lu, Zhenhui Guo, and Qing Li. 2025. "Small Scale Multi-Object Segmentation in Mid-Infrared Image Using the Image Timing Features–Gaussian Mixture Model and Convolutional-UNet" Sensors 25, no. 11: 3440. https://doi.org/10.3390/s25113440
APA StyleLv, M., Liu, H., Wang, M., Wang, D., Li, H., Lu, X., Guo, Z., & Li, Q. (2025). Small Scale Multi-Object Segmentation in Mid-Infrared Image Using the Image Timing Features–Gaussian Mixture Model and Convolutional-UNet. Sensors, 25(11), 3440. https://doi.org/10.3390/s25113440