Figure 1.
Our motivation and achievements. (
a) Our motivation. (
b–
d) Value of HOTA metric and frame rate for various two-shot tracking methods with (
b) 2-ball (
Section 5.2), (
c) 3-ball (
Section 4.3.4) and (
d) 4-ball (
Section 4.3.5) scenarios.
Figure 1.
Our motivation and achievements. (
a) Our motivation. (
b–
d) Value of HOTA metric and frame rate for various two-shot tracking methods with (
b) 2-ball (
Section 5.2), (
c) 3-ball (
Section 4.3.4) and (
d) 4-ball (
Section 4.3.5) scenarios.
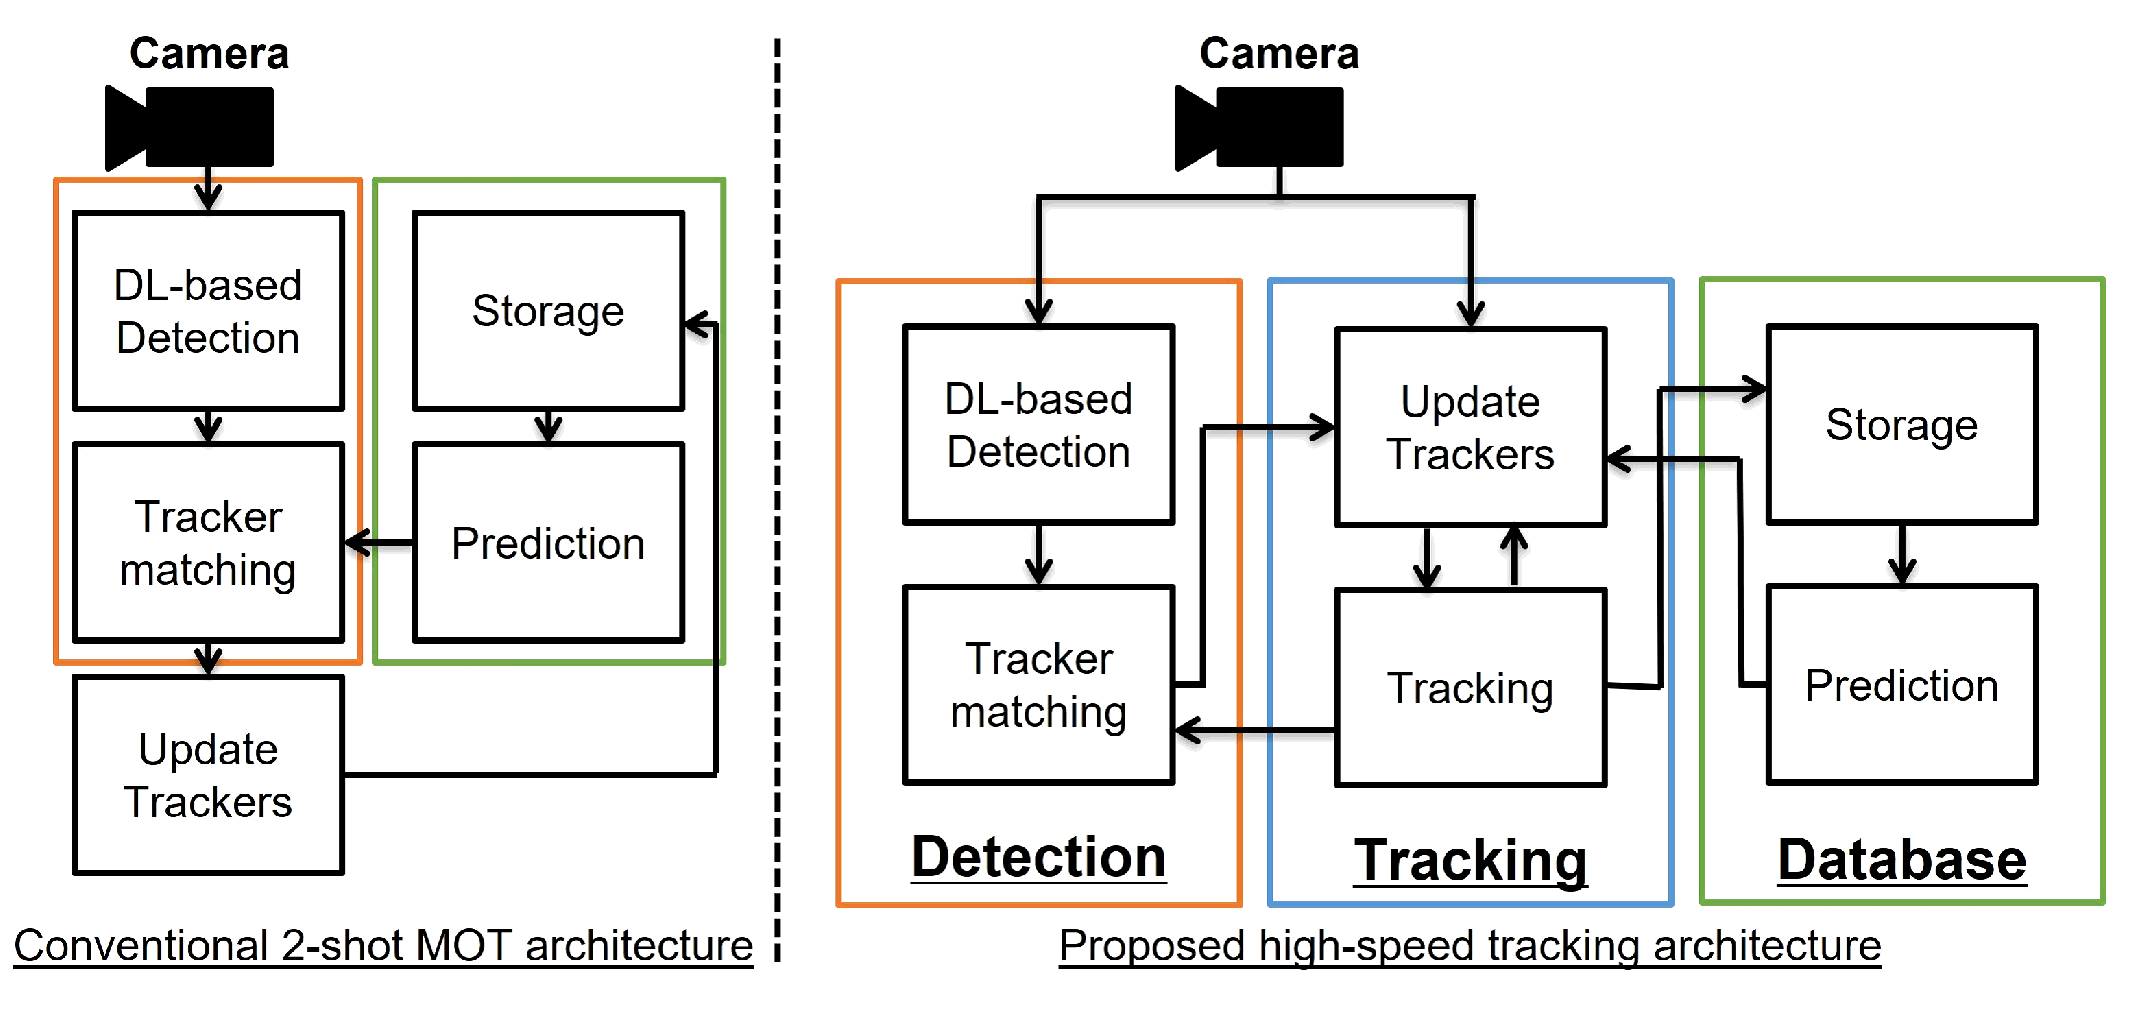
Figure 2.
Tracking architecture of the conventional two-shot multiple object tracking and the proposed high-speed tracking systems. The orange box represents the detection module, the blue box denotes the tracking module, and the green box illustrates the database module.
Figure 2.
Tracking architecture of the conventional two-shot multiple object tracking and the proposed high-speed tracking systems. The orange box represents the detection module, the blue box denotes the tracking module, and the green box illustrates the database module.
Figure 3.
Flowchart of the proposed multiple object tracking system. The orange box represents the detection thread, the blue box represents the tracking thread, and the green box represents the database thread.
Figure 3.
Flowchart of the proposed multiple object tracking system. The orange box represents the detection thread, the blue box represents the tracking thread, and the green box represents the database thread.
Figure 4.
Detection label-based tracker management. represents a list of detection labels. The arrows indicate data flow among the detection, tracking, and database threads. Rectangular boxes denote processes, while circular nodes represent exchanged data. Orange boxes indicate existing trackers, and blue boxes indicate new trackers detected by the detection thread.
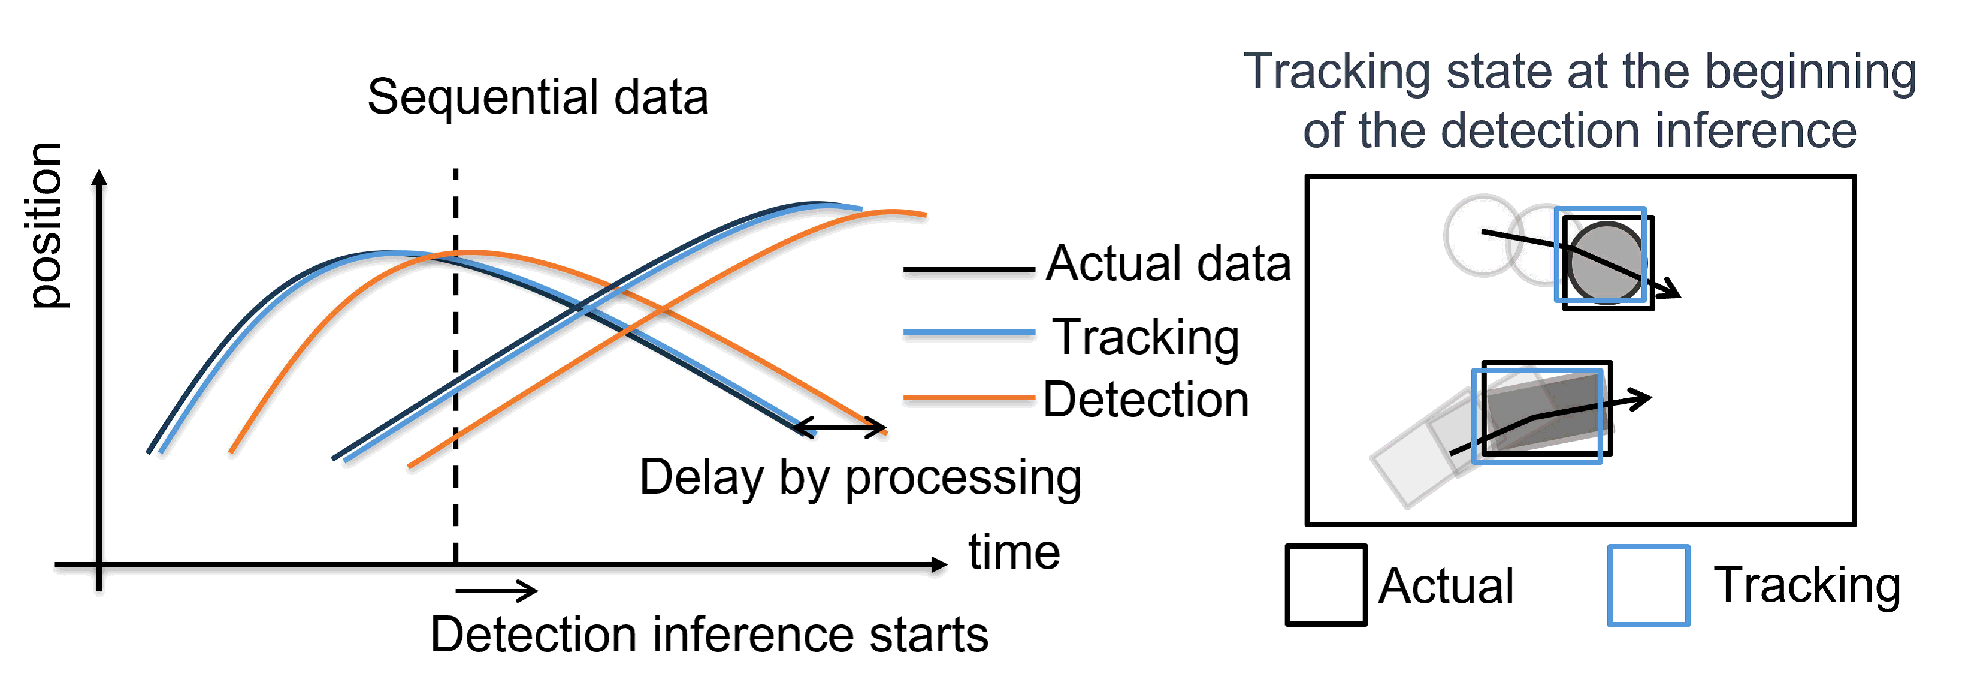
Figure 5.
(left) shows sequential data; the black line represents the ground truth, the blue line indicates the tracked data from the tracking thread, and the orange line shows the detection data from the detection thread. The horizontal offsets between the blue and orange lines relative to the black line illustrate the delays caused by processing time. The vertical dashed line marks the moment when deep learning-based detection inference begins. (right) illustrates the tracking state corresponding to the time indicated by the dashed line in the left figure.
Figure 6.
Overview of the hybrid tracking system combining deep learning-based low-frequency detection with classical high-frequency tracking methods. In the detection row, the large black box represents the entire image, while the smaller boxes around the objects indicate their ROIs. In the tracking row, the larger black boxes denote the search areas, and the smaller boxes represent the ROIs of the tracked objects. The horizontal axis indicates the time sequence. Orange boxes highlight the moments when the templates and correlation filters in the tracking thread are updated based on detection results.
Figure 7.
Experiment settings. (left) illustrates the cameras used to capture videos. (right) illustrates objects, plastic case and balls.
Figure 7.
Experiment settings. (left) illustrates the cameras used to capture videos. (right) illustrates objects, plastic case and balls.
Figure 8.
Tracking results for two accelerated balls. (a) Trajectories of the horizontal position (x-coordinate) of the ball centers tracked by ByteTrack, OC-SORT, and the proposed method. Plots with colors, but black represents each estimated trackers. (b) Temporal transition of IoU for each ground-truth tracker. (c) Comparison of each method in terms of frame rate and mean IoU. (d) Top row: Relationship between IoU threshold and performance metrics including mAP, MOTA, IDF1, HOTA, DetA, and AssA. Bottom row: Relationship between frame rate and each performance metric.
Figure 9.
Tracking results for box tracking. (a) Trajectories of the horizontal position (x-coordinate) of the ball centers tracked by ByteTrack, OC-SORT, and the proposed method. (b) Temporal transition of IoU for each ground-truth tracker. (c) Comparison of each method in terms of frame rate and mean IoU. (d) Top row: Relationship between IoU threshold and performance metrics. Bottom row: Relationship between frame rate and each performance metric.
Figure 10.
Tracking results for two thrown balls. (a) Trajectories of the horizontal position (x-coordinate) of the ball centers tracked by ByteTrack, OC-SORT, and the proposed method. (b) Temporal transition of IoU for each ground-truth tracker. (c) Comparison of each method in terms of frame rate and mean IoU. (d) Top row: Relationship between IoU threshold and performance metrics. Bottom row: Relationship between frame rate and each performance metric.
Figure 11.
Tracking results for three balls. (a) Trajectories of the horizontal position (x-coordinate) of the ball centers tracked by ByteTrack, OC-SORT, and the proposed method. (b) Temporal transition of IoU for each ground-truth tracker. (c) Comparison of each method in terms of frame rate and mean IoU. (d) Top row: Relationship between IoU threshold and performance metrics. Bottom row: Relationship between frame rate and each performance metric.
Figure 12.
Tracking results for four balls. (a) Trajectories of the horizontal position (x-coordinate) of the ball centers tracked by ByteTrack, OC-SORT, and the proposed method. (b) Temporal transition of IoU for each ground-truth tracker. (c) Comparison of each method in terms of frame rate and mean IoU. (d) Top row: Relationship between IoU threshold and performance metrics. Bottom row: Relationship between frame rate and each performance metric.
Figure 13.
Tracking results for two balls. (a) Trajectories of the horizontal position (x-coordinate) of the ball centers tracked by 8 methods. (b) Temporal transition of IoU for each ground-truth tracker. (c) Comparison of each method in terms of frame rate and mean IoU. (d) Top row: Relationship between IoU threshold and performance metrics. Bottom row: Relationship between frame rate and each performance metric.
Figure 14.
Tracking results for two balls. (a) Trajectories of the horizontal position (x-coordinate) of the ball centers tracked by ByteTrack, OC-SORT, and the proposed method. (b) Temporal transition of IoU for each ground-truth tracker. (c) Comparison of each method in terms of frame rate and mean IoU. (d) Top row: Relationship between IoU threshold and performance metrics. Bottom row: Relationship between frame rate and each performance metric.
Table 1.
Comparison between conventional methods and the proposed method. ✓ represents “good quality”.
Table 1.
Comparison between conventional methods and the proposed method. ✓ represents “good quality”.
| Method | Low Latency | Accuracy | Environments | Types and Number of Targets |
|---|
| Hybrid method [41] | ✓ | ✓ | ✓ | |
| One-shot method [9,10] | | ✓ | ✓ | ✓ |
| Two-shot method [13,14] | | ✓ | ✓ | ✓ |
| Proposed Method | ✓ | ✓ | ✓ | ✓ |
Table 2.
Hyperparameters in the proposed MOT system.
Table 2.
Hyperparameters in the proposed MOT system.
| Parameter | Value |
|---|
| Tracker lifespan | | 4 |
| 5 |
| Tracking score | | 5.0 |
| 0.0 |
| Duplicate Trackers (Equation (3)) | | 0.6 |
| Skip updating (Equation (4)) | | 2.0 |
| |
| 3 |
Table 3.
Tracking results for two accelerated balls with mean IoU, mAR, mAP, MOTA, IDF1, HOTA, DetA and AssA. The bold value indicates the best score for each metric.
Table 3.
Tracking results for two accelerated balls with mean IoU, mAR, mAP, MOTA, IDF1, HOTA, DetA and AssA. The bold value indicates the best score for each metric.
| Method | Frame Rate (fps) | IoU | mAR | mAP | MOTA | IDF1 | HOTA | DetA | AssA |
|---|
| 1st | 2nd | Average |
|---|
| deepocsort | 12 | 0.184 | 0.206 | 0.195 | 0.196 | 0.502 | 0.157 | 0.282 | 0.187 | 0.186 | 0.188 |
| strongsort | 17 | 0.149 | 0.118 | 0.133 | 0.134 | 0.611 | 0.116 | 0.22 | 0.132 | 0.132 | 0.133 |
| boosttrack | 25 | 0.381 | 0.368 | 0.374 | 0.381 | 0.692 | 0.327 | 0.492 | 0.363 | 0.362 | 0.364 |
| imprassoc | 26 | 0.467 | 0.394 | 0.43 | 0.434 | 0.623 | 0.322 | 0.472 | 0.368 | 0.389 | 0.352 |
| botsort | 46 | 0.51 | 0.537 | 0.523 | 0.532 | 0.716 | 0.427 | 0.57 | 0.46 | 0.484 | 0.439 |
| bytetrack | 98 | 0.65 | 0.68 | 0.665 | 0.673 | 0.698 | 0.46 | 0.684 | 0.565 | 0.565 | 0.565 |
| ocsort | 98 | 0.665 | 0.71 | 0.688 | 0.699 | 0.782 | 0.56 | 0.704 | 0.605 | 0.628 | 0.584 |
| proposed | 470 | 0.686 | 0.823 | 0.755 | 0.767 | 0.785 | 0.685 | 0.776 | 0.736 | 0.73 | 0.744 |
Table 4.
Tracking results for ball and box tracking. The data are presented in the format of “ball’s metric/box’s metric”. The bold value indicates the best score for each metric.
Table 4.
Tracking results for ball and box tracking. The data are presented in the format of “ball’s metric/box’s metric”. The bold value indicates the best score for each metric.
| Method | Frame Rate (fps) | IoU | mAR | mAP | MOTA | IDF1 | HOTA | DetA | AssA |
|---|
| deepocsort | 12 | 0.01/0.021 | 0.007/0.02 | 0.06/0.377 | 0.002/0.018 | 0.012/0.035 | 0.007/0.019 | 0.007/0.02 | 0.007/0.018 |
| strongsort | 17 | 0.065/0.103 | 0.062/0.094 | 0.256/0.137 | 0.041/0.031 | 0.1/0.107 | 0.059/0.071 | 0.059/0.073 | 0.059/0.069 |
| boosttrack | 25 | 0.131/0.071 | 0.126/0.07 | 0.334/0.307 | 0.091/0.02 | 0.183/0.123 | 0.118/0.066 | 0.118/0.064 | 0.118/0.069 |
| imprassoc | 26 | 0.254/0.26 | 0.251/0.254 | 0.424/0.225 | 0.172/0.034 | 0.252/0.171 | 0.193/0.12 | 0.224/0.158 | 0.18/0.119 |
| botsort | 46 | 0.341/0.493 | 0.334/0.496 | 0.345/0.409 | 0.157/0.222 | 0.339/0.37 | 0.253/0.3 | 0.254/0.346 | 0.253/0.291 |
| bytetrack | 98 | 0.57/0.594 | 0.575/0.6 | 0.589/0.445 | 0.42/0.268 | 0.581/0.504 | 0.5/0.404 | 0.501/0.407 | 0.5/0.409 |
| ocsort | 98 | 0.609/0.563 | 0.615/0.571 | 0.63/0.539 | 0.451/0.308 | 0.622/0.489 | 0.538/0.391 | 0.538/0.43 | 0.537/0.384 |
| proposed | 460 | 0.675/0.42 | 0.684/0.423 | 0.691/0.373 | 0.583/0.137 | 0.686/0.314 | 0.632/0.248 | 0.633/0.286 | 0.631/0.222 |
Table 5.
Tracking results for two thrown balls. The bold value indicates the best score for each metric.
Table 5.
Tracking results for two thrown balls. The bold value indicates the best score for each metric.
| Method | Frame Rate (fps) | IoU | mAR | mAP | MOTA | IDF1 | HOTA | DetA | AssA |
|---|
| 1st | 2nd | Average |
|---|
| deepocsort | 12 | 0 | 0 | 0 | 0 | 0 | 0 | 0 | 0 | 0 | 0 |
| strongsort | 17 | 0 | 0 | 0 | 0 | 0 | 0 | 0 | 0 | 0 | 0 |
| boosttrack | 25 | 0.049 | 0.105 | 0.077 | 0.075 | 0.234 | 0.013 | 0.114 | 0.065 | 0.064 | 0.065 |
| imprassoc | 26 | 0.102 | 0.209 | 0.156 | 0.149 | 0.231 | 0.045 | 0.181 | 0.116 | 0.115 | 0.118 |
| botsort | 46 | 0.247 | 0.344 | 0.295 | 0.288 | 0.329 | 0.139 | 0.308 | 0.227 | 0.226 | 0.229 |
| bytetrack | 98 | 0.473 | 0.567 | 0.52 | 0.521 | 0.535 | 0.378 | 0.528 | 0.456 | 0.455 | 0.457 |
| ocsort | 98 | 0.505 | 0.601 | 0.553 | 0.557 | 0.573 | 0.423 | 0.565 | 0.497 | 0.495 | 0.498 |
| proposed | 434 | 0.508 | 0.553 | 0.53 | 0.531 | 0.497 | 0.326 | 0.492 | 0.409 | 0.427 | 0.397 |
Table 6.
Tracking results for three balls. The bold value indicates the best score for each metric.
Table 6.
Tracking results for three balls. The bold value indicates the best score for each metric.
| Method | Frame Rate (fps) | IoU | mAR | mAP | MOTA | IDF1 | HOTA | DetA | AssA |
|---|
| 1st | 2nd | 3rd | Average |
|---|
| deepocsort | 12 | 0 | 0 | 0 | 0 | 0 | 0 | 0 | 0 | 0 | 0 | 0 |
| strongsort | 17 | 0.129 | 0.001 | 0.042 | 0.059 | 0.057 | 0.316 | 0.026 | 0.054 | 0.041 | 0.054 | 0.032 |
| boosttrack | 25 | 0.335 | 0.158 | 0.156 | 0.215 | 0.212 | 0.33 | 0.079 | 0.163 | 0.135 | 0.17 | 0.109 |
| imprassoc | 26 | 0.408 | 0.285 | 0.319 | 0.33 | 0.3338 | 0.351 | 0.164 | 0.186 | 0.184 | 0.259 | 0.132 |
| botsort | 46 | 0.503 | 0.434 | 0.377 | 0.434 | 0.432 | 0.414 | 0.247 | 0.267 | 0.255 | 0.342 | 0.191 |
| bytetrack | 98 | 0.698 | 0.623 | 0.544 | 0.617 | 0.624 | 0.604 | 0.462 | 0.409 | 0.407 | 0.54 | 0.308 |
| ocsort | 98 | 0.695 | 0.599 | 0.6 | 0.63 | 0.639 | 0.658 | 0.497 | 0.453 | 0.439 | 0.567 | 0.341 |
| proposed | 243 | 0.668 | 0.596 | 0.538 | 0.597 | 0.604 | 0.51 | 0.312 | 0.462 | 0.399 | 0.455 | 0.352 |
Table 7.
Tracking results for four balls. The bold value indicates the best score for each metric.
Table 7.
Tracking results for four balls. The bold value indicates the best score for each metric.
| Method | Frame Rate (fps) | IoU | mAR | mAP | MOTA | IDF1 | HOTA | DetA | AssA |
|---|
| 1st | 2nd | 3rd | 4th | Average |
|---|
| deepocsort | 12 | 0.063 | 0.032 | 0.095 | 0.033 | 0.053 | 0.052 | 0.32 | 0.024 | 0.062 | 0.041 | 0.049 | 0.034 |
| strongsort | 17 | 0.088 | 0.004 | 0.168 | 0.142 | 0.094 | 0.09 | 0.214 | 0.022 | 0.071 | 0.056 | 0.075 | 0.043 |
| boosttrack | 25 | 0.231 | 0.188 | 0.304 | 0.112 | 0.205 | 0.2 | 0.316 | 0.072 | 0.074 | 0.082 | 0.16 | 0.043 |
| imprassoc | 26 | 0.323 | 0.361 | 0.426 | 0.184 | 0.321 | 0.315 | 0.338 | 0.129 | 0.104 | 0.12 | 0.238 | 0.061 |
| botsort | 46 | 0.401 | 0.441 | 0.565 | 0.304 | 0.422 | 0.421 | 0.444 | 0.239 | 0.233 | 0.224 | 0.341 | 0.148 |
| bytetrack | 98 | 0.586 | 0.625 | 0.717 | 0.503 | 0.604 | 0.61 | 0.575 | 0.402 | 0.278 | 0.302 | 0.503 | 0.183 |
| ocsort | 98 | 0.557 | 0.661 | 0.717 | 0.538 | 0.615 | 0.623 | 0.61 | 0.407 | 0.19 | 0.246 | 0.511 | 0.12 |
| proposed | 178 | 0.469 | 0.654 | 0.604 | 0.591 | 0.579 | 0.586 | 0.548 | 0.355 | 0.31 | 0.322 | 0.466 | 0.226 |
Table 8.
Summary of the five MOT experiments.
Table 8.
Summary of the five MOT experiments.
| Experiment | Frame Rate (fps) | Achievements | Challenges and Future Work |
|---|
| 2 Accelerated Balls (Section 4.3.1) | 470 | Robust to abrupt motion changes and partial occlusions, capable of accurately tracking fast-moving objects. | Requires high-frequency updates from deep learning-based detections for robust long-term tracking. |
| 2 Categories (Section 4.3.2) | 460 | Capable of handling multi-category objects. | Improve tracking of non-circular objects by accelerating deep learning-based detection and developing a fast, rotation-invariant detection method. |
| 2 Thrown Balls (Section 4.3.3) | 434 | Adaptable to changes in object scale and background. | Manage duplicate trackers while balancing the precision–recall trade-off, ensuring robust and high-frequency tracker updates. |
| 3 Balls (Section 4.3.4) | 243 | Capable of tracking more than two objects with higher association accuracy. | Address complete occlusion by implementing fine-grained tracking-based occlusion detection and expanding to a multi-camera system. |
| 4 Balls (Section 4.3.5) | 178 | Demonstrates the effectiveness of hybrid tracking in improving association performance. | Combine frame-level local tracking with trajectory-aware global scores to achieve long-term tracking. |
Table 9.
Tracking results for two balls. The bold value indicates the best score for each metric.
Table 9.
Tracking results for two balls. The bold value indicates the best score for each metric.
| Method | Frame Rate (fps) | IoU | mAR | mAP | MOTA | IDF1 | HOTA | DetA | AssA |
|---|
| 1st | 2nd | Average |
|---|
| 1 | 612 | 0.459 | 0.409 | 0.435 | 0.44 | 0.586 | 0.259 | 0.297 | 0.258 | 0.365 | 0.184 |
| 2 | 710 | 0.812 | 0.57 | 0.696 | 0.709 | 0.733 | 0.538 | 0.539 | 0.52 | 0.609 | 0.448 |
| 3 | 612 | 0.678 | 0.59 | 0.636 | 0.645 | 0.619 | 0.411 | 0.371 | 0.355 | 0.513 | 0.248 |
| 4 | 284 | 0.748 | 0.67 | 0.711 | 0.723 | 0.503 | 0.248 | 0.335 | 0.316 | 0.461 | 0.218 |
| 5 | 334 | 0.691 | 0.717 | 0.703 | 0.715 | 0.512 | 0.304 | 0.525 | 0.446 | 0.477 | 0.419 |
| 6 | 340 | 0.614 | 0.745 | 0.677 | 0.686 | 0.509 | 0.301 | 0.396 | 0.354 | 0.47 | 0.27 |
| 7 | 442 | 0.689 | 0.655 | 0.673 | 0.682 | 0.687 | 0.574 | 0.532 | 0.516 | 0.624 | 0.428 |
| 8 | 434 | 0.753 | 0.662 | 0.71 | 0.723 | 0.722 | 0.611 | 0.719 | 0.656 | 0.653 | 0.661 |
Table 10.
Effects of each proposed MOT technique on processing speed and tracking accuracy, recall, precision and association. The upward arrow indicates an improvement in the score, while the downward arrow indicates a deterioration.
Table 10.
Effects of each proposed MOT technique on processing speed and tracking accuracy, recall, precision and association. The upward arrow indicates an improvement in the score, while the downward arrow indicates a deterioration.
| Method | Processing Speed | Recall | Precision | Association |
|---|
| MOSSE + Template matching | - | ↑ | ↑ | ↑ |
| Kalman Filter | ↓ | ↑ | - | - |
| Check tracking scores | - | - | ↑ | ↑ |
| Dynamic search area size adjustment | ↑ | - | - | - |
| Delete duplicate trackers | ↑ | - | ↑ | ↑ |
| Skip updating trackers | - | - | - | ↑ |
Table 11.
Tracking results for two balls. The bold value indicates the best score for each metric.
Table 11.
Tracking results for two balls. The bold value indicates the best score for each metric.
| Method | Frame Rate (fps) | IoU | mAR | mAP | MOTA | IDF1 | HOTA | DetA | AssA |
|---|
| 1st | 2nd | Average |
|---|
| deepocsort | 12 | 0 | 0 | 0 | 0 | 0 | 0 | 0 | 0 | 0 | 0 |
| strongsort | 17 | 0.007 | 0.046 | 0.026 | 0.026 | 0.369 | 0.011 | 0.041 | 0.023 | 0.025 | 0.022 |
| boosttrack | 25 | 0.022 | 0.004 | 0.013 | 0.012 | 0.11 | 0.001 | 0.01 | 0.007 | 0.011 | 0.005 |
| imprassoc | 26 | 0.252 | 0.236 | 0.244 | 0.237 | 0.224 | 0.033 | 0.039 | 0.055 | 0.15 | 0.021 |
| botsort | 46 | 0.305 | 0.294 | 0.3 | 0.295 | 0.354 | 0.129 | 0.115 | 0.122 | 0.231 | 0.065 |
| bytetrack | 98 | 0.496 | 0.494 | 0.495 | 0.495 | 0.489 | 0.331 | 0.279 | 0.275 | 0.418 | 0.182 |
| ocsort | 98 | 0.569 | 0.523 | 0.547 | 0.551 | 0.555 | 0.374 | 0.324 | 0.315 | 0.465 | 0.214 |
| proposed | 434 | 0.753 | 0.662 | 0.71 | 0.723 | 0.722 | 0.611 | 0.719 | 0.656 | 0.653 | 0.661 |


