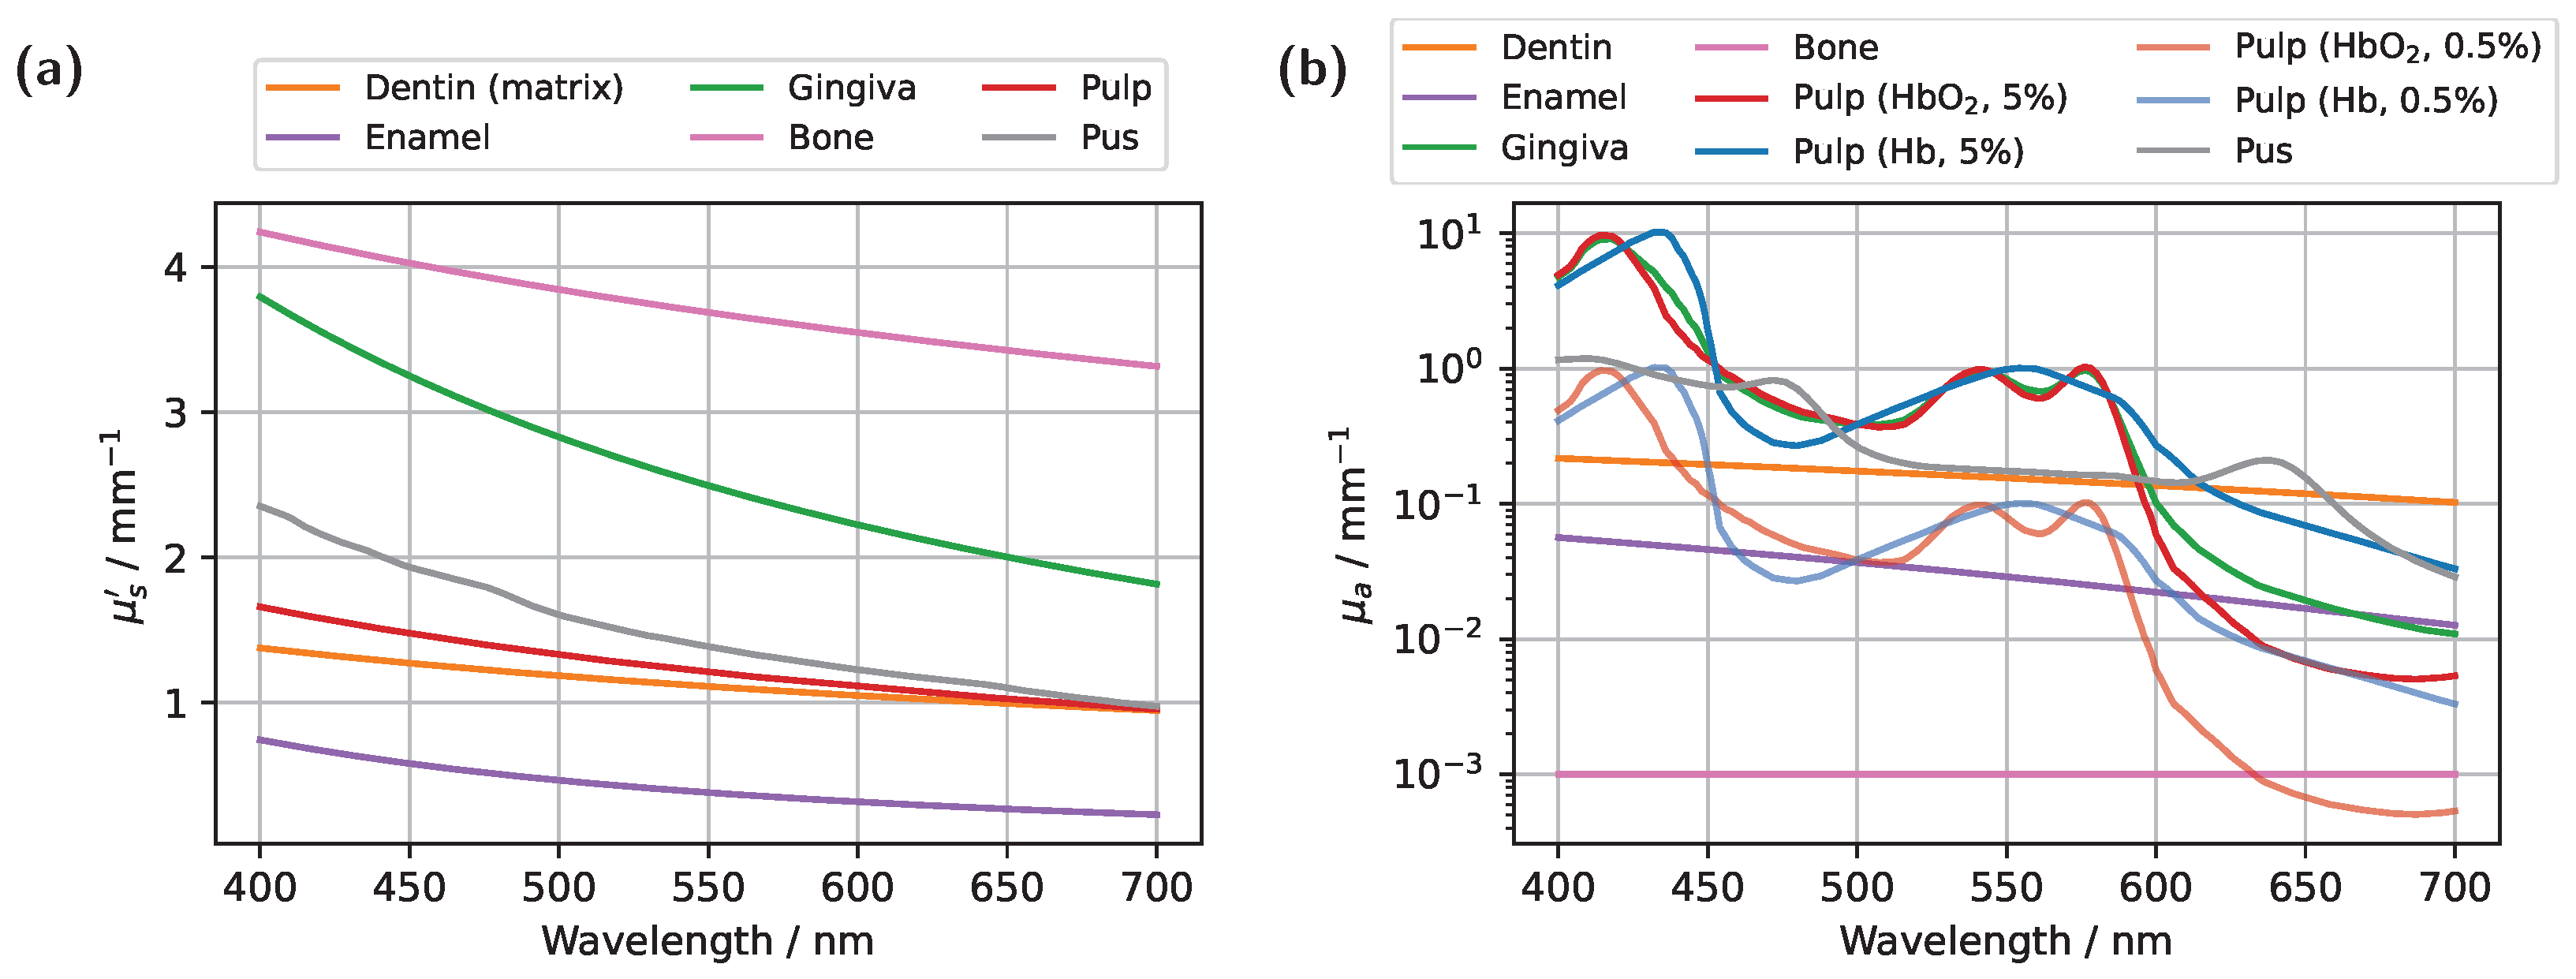
Blood absorption in the pulp provides information about the vascular status and, consequently, the vitality of the pulp. Ideally, in the case of a healthy pulp, approximated here by an oxygen saturation (SO
2) of 100%, the characteristic HbO
2 peaks at approximately 540 nm and 575 nm (see
Figure 2b) would be prominently reflected in the detected transmission signal. In contrast, in a non-vital scenario, modeled in the extreme case as either 0% oxygen saturation or entirely filling with pus, these characteristic HbO
2 peaks would be expected to disappear. This would provide a straightforward and objective approach for assessing pulp vitality. Beyond other features of the spectrally resolved transmission signal, such as the slope (first and second derivative), integrals under specific curve segments, and inflection points of the curves, this principle also formed the basis for classification in a recently proposed approach [
11]. However, in that case, no clinically acceptable level of diagnostic confidence was achieved. To address this, digital optical twins will be utilized to gain a deeper understanding of light propagation within the tooth under similar measurement conditions, thereby investigating the underlying causes of insufficient diagnostic accuracy. All subsequent simulations were performed on an NVIDIA A10 GPU, with the computation time for generating a complete transmission spectrum averaging approximately one hour for
photons.
3.1. Spectral Transmission of the Incisor Model
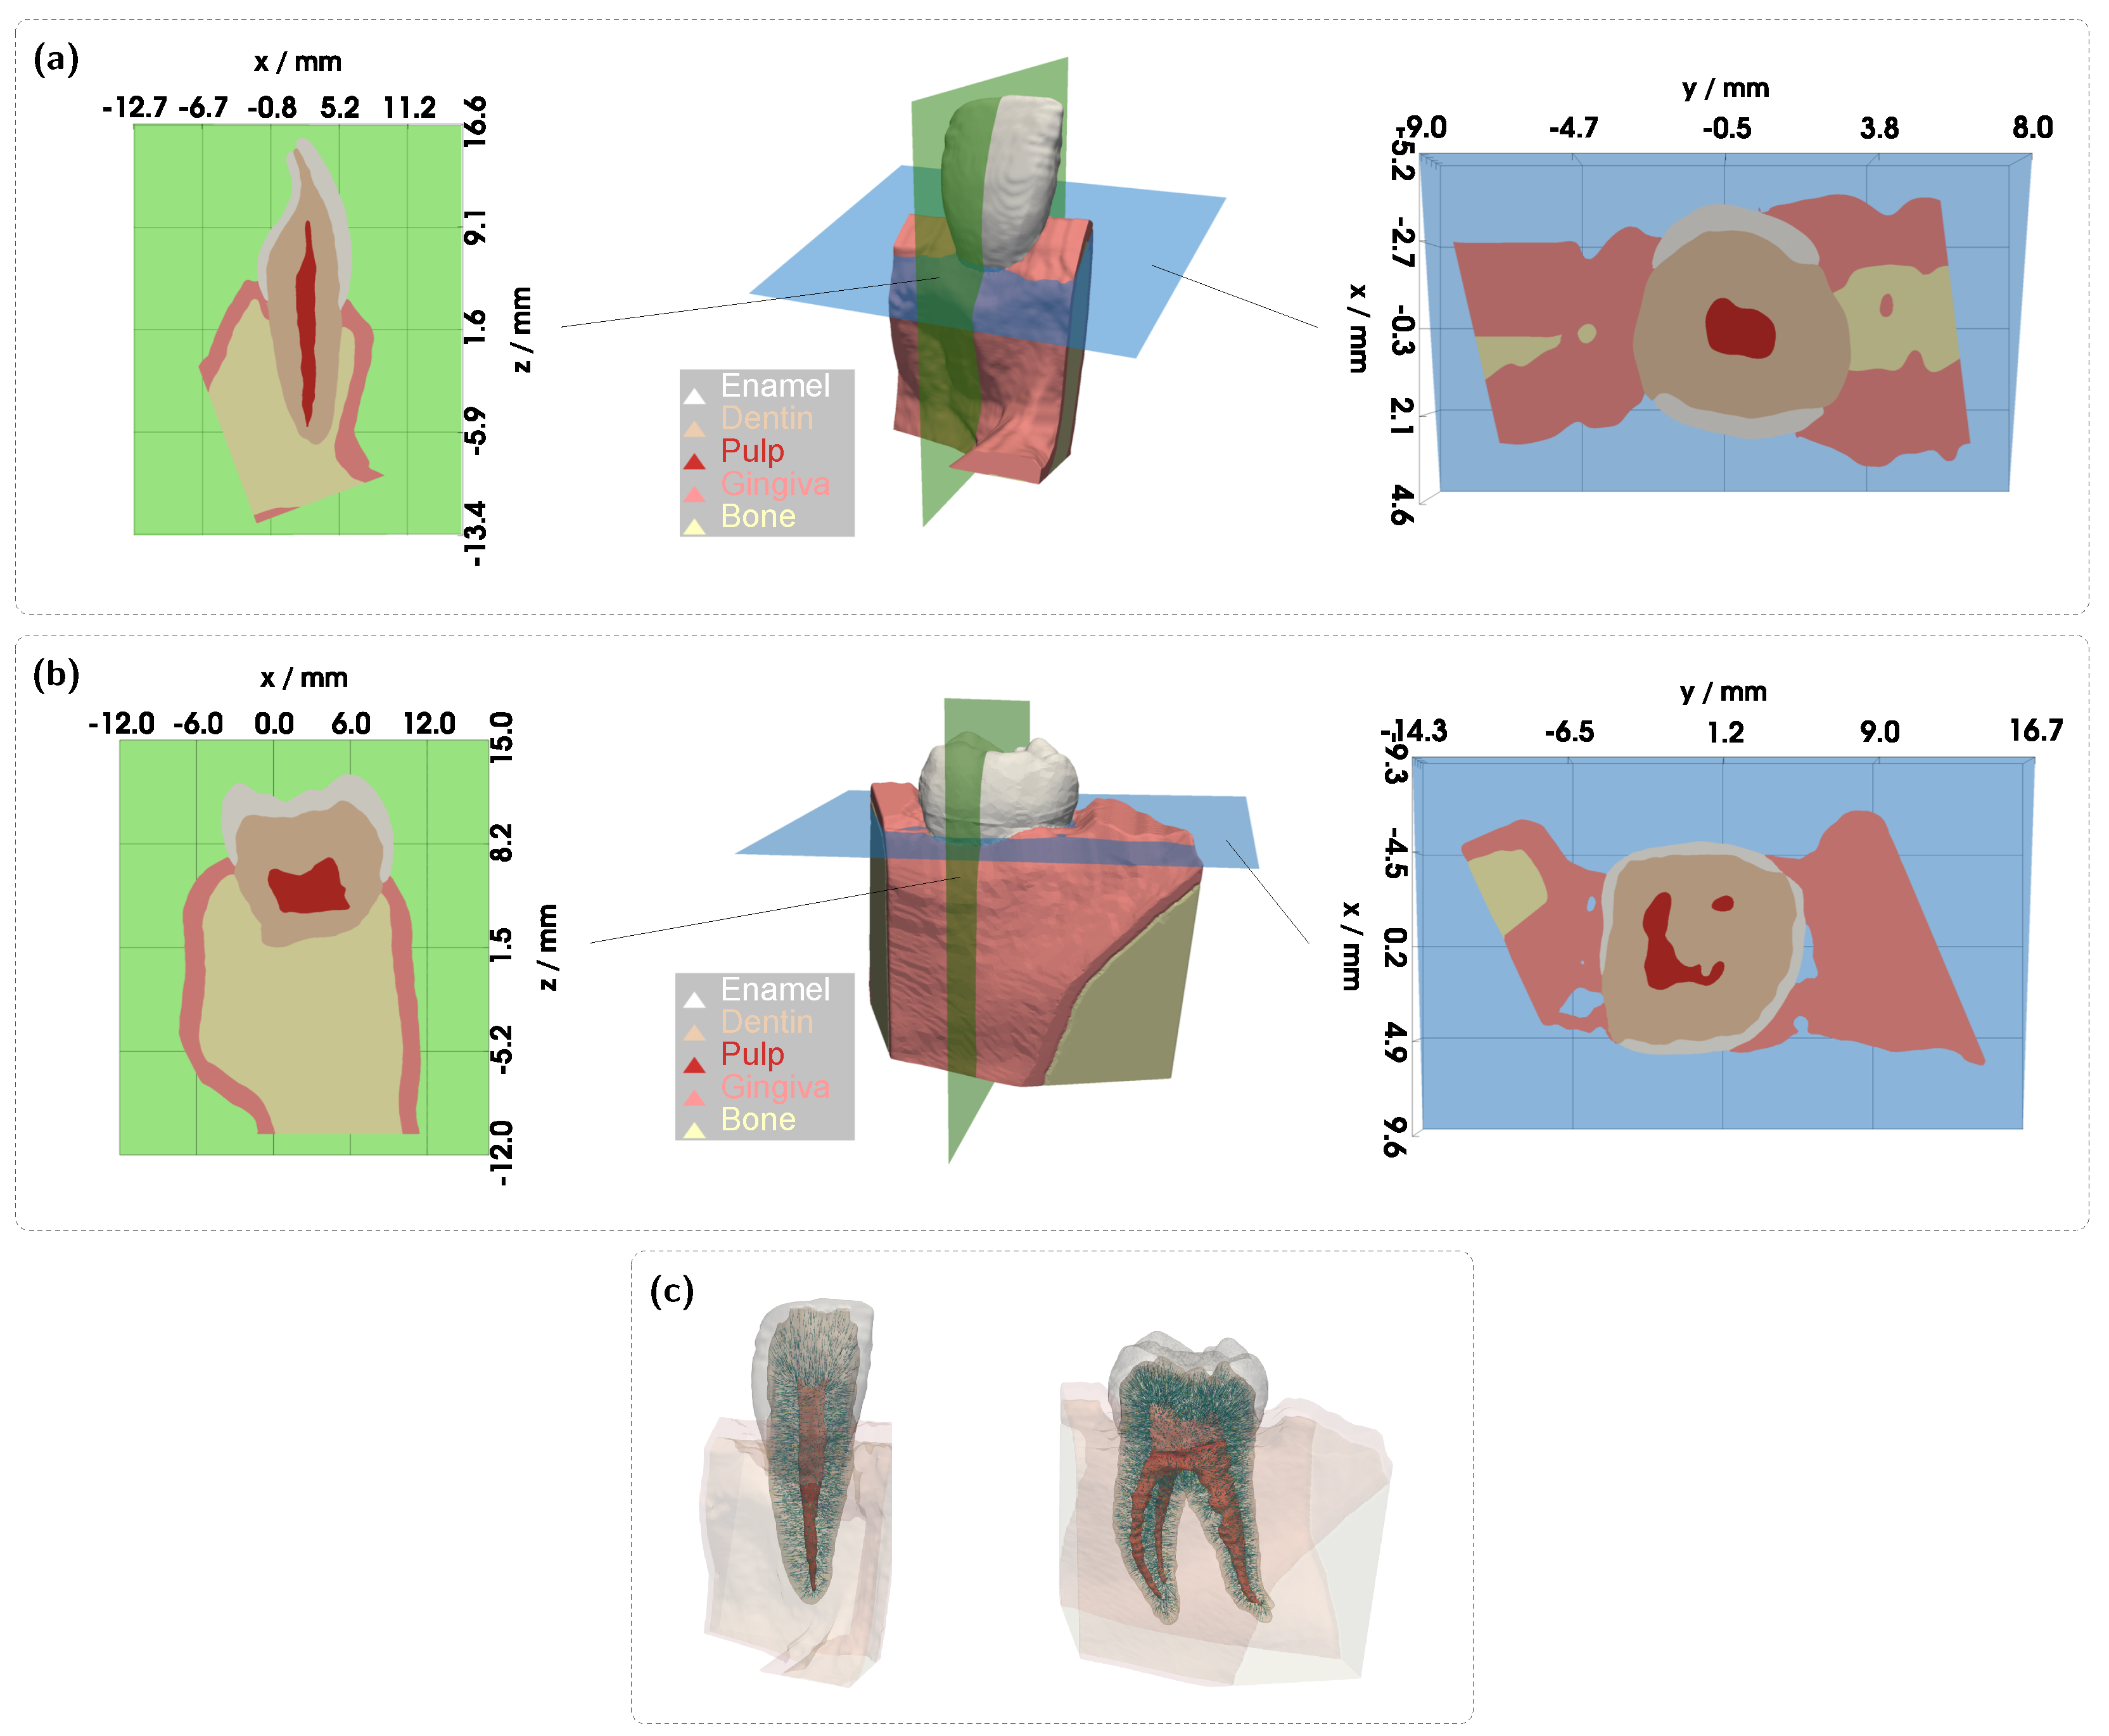
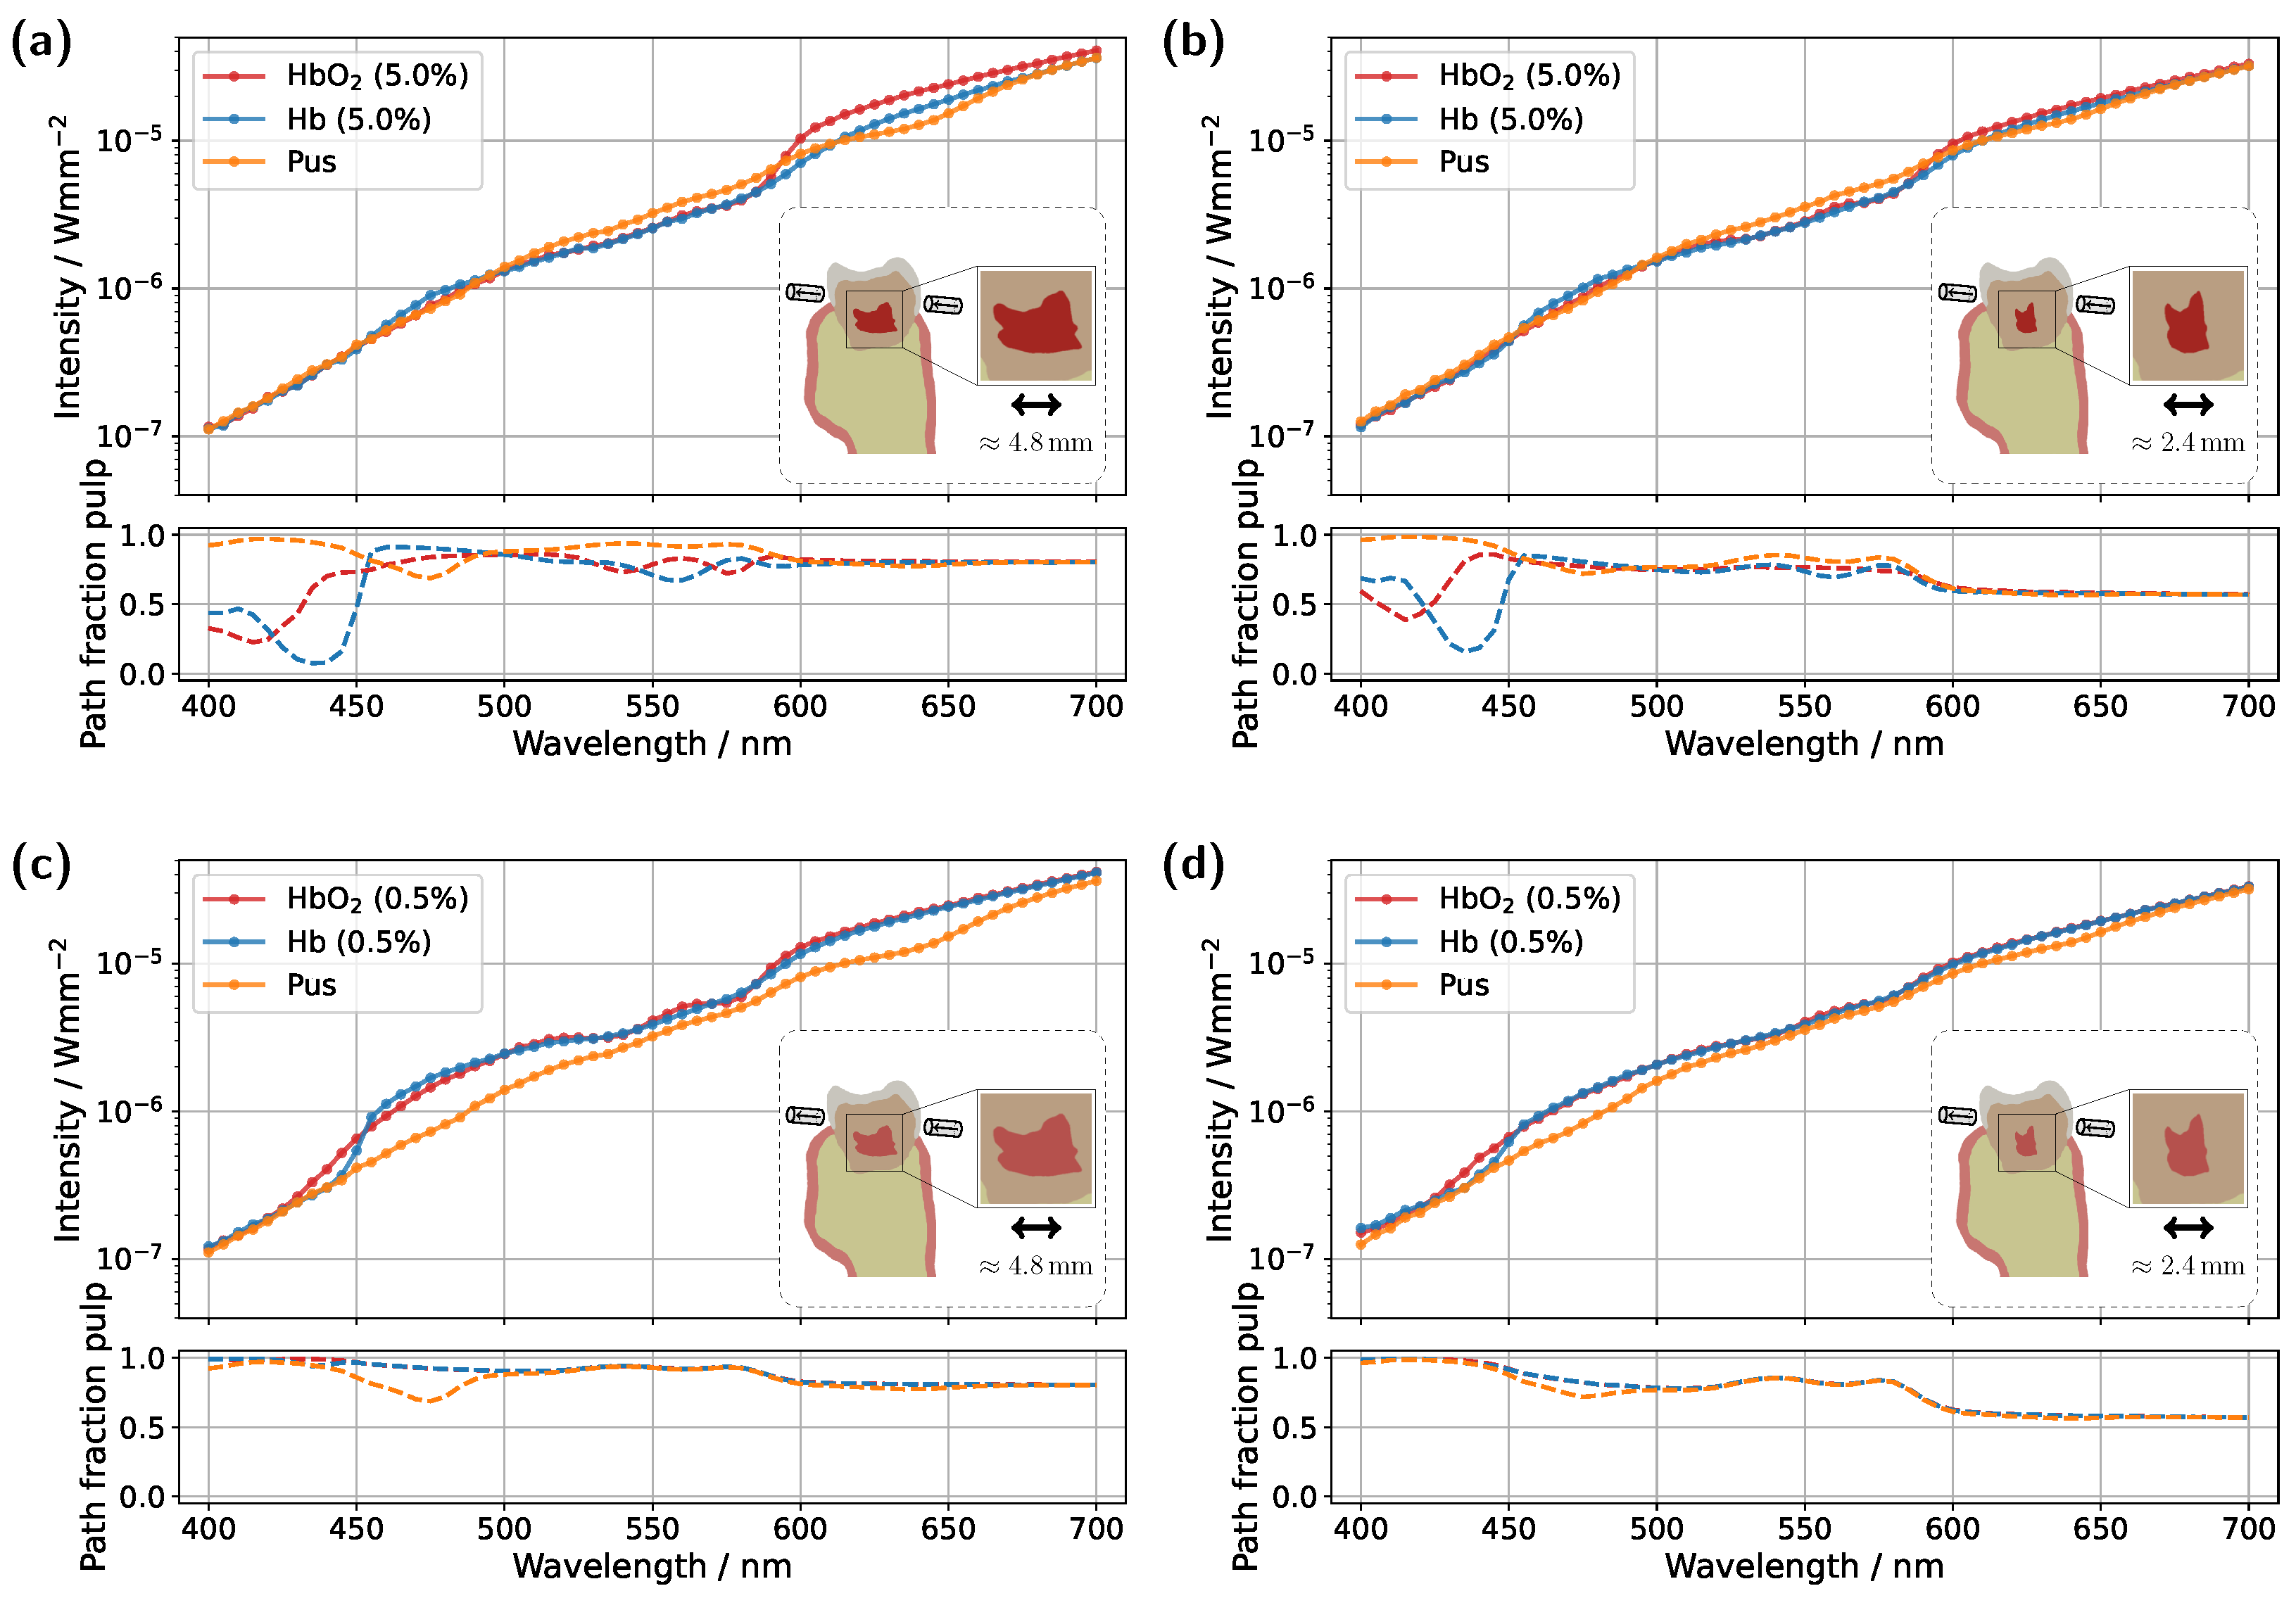
Starting with the incisor model, transmission was compared for a detector and source positioned directly above the gingiva across different pulp sizes and blood concentrations (see
Figure 3). The detector and source were aligned along an axis corresponding to the intersection of the two sectional planes indicated in
Figure 1a. In all cases, the signal was also analyzed for a scenario in which the pulp chamber is completely filled with pus. In the lower subplots of each figure, the proportion of detected photons that traveled through the pulp relative to the gingiva is shown as
, where
and
denote the cumulative path lengths traveled within the pulp and gingiva, respectively.
For the original model with a blood concentration of Hb/HbO
2 at 5.0% (see
Figure 3a), dips in the transmission spectrum are observed at the characteristic HbO
2 absorption peaks (540 nm and 575 nm) in the case of 100% oxygen saturation, as expected. These features disappear in the Hb case, i.e., SO
2 . Surprisingly, however, even in the scenario where the pulp is completely filled with pus, slight but noticeable HbO
2 absorption peaks remain visible, despite the assumption that no HbO
2 is present within the pulp. This provides the first indication of the underlying cause of the diagnostic ambiguities, which can be inferred from the subplot in
Figure 3a. In the wavelength range between 500 nm and 600 nm, the pulp path fraction decreases to approximately 70%, indicating that a significant portion of the detected photon paths traverse the gingiva. In the case of an Hb-filled pulp, due to the approximately equal blood concentration in both the gingiva and pulp, combined with the fact that the optical path length through the pulp is nearly twice as long as that through the gingiva, no features of HbO
2 absorption from the gingiva are recognizable. Conversely, for a pus-filled pulp, gingival HbO
2 absorption becomes distinctly visible, as blood absorption in the gingiva is significantly higher than that of the pus within the pulp. Additionally, the spectral profile of pus remains relatively constant in the region of the HbO
2 dips (see
Figure 2b), allowing the gingival HbO
2 absorption to emerge more prominently. Notably, the visibility of the gingival HbO
2 peaks increases with higher blood concentration and oxygen saturation in the gingiva and vice versa. As such, this effect may be influenced not only by biological variability but also by factors such as gingivitis [
34]. Furthermore, it can be generally observed that high absorption in the pulp, such as that caused by the HbO
2 and Hb peaks in the 400–450 nm range, directly corresponds to a reduction in the pulp path fraction, as reflected in the lower subplot of
Figure 3a. This effect can be understood by analyzing the internal light distribution within the tooth, as represented by the simulated fluence in
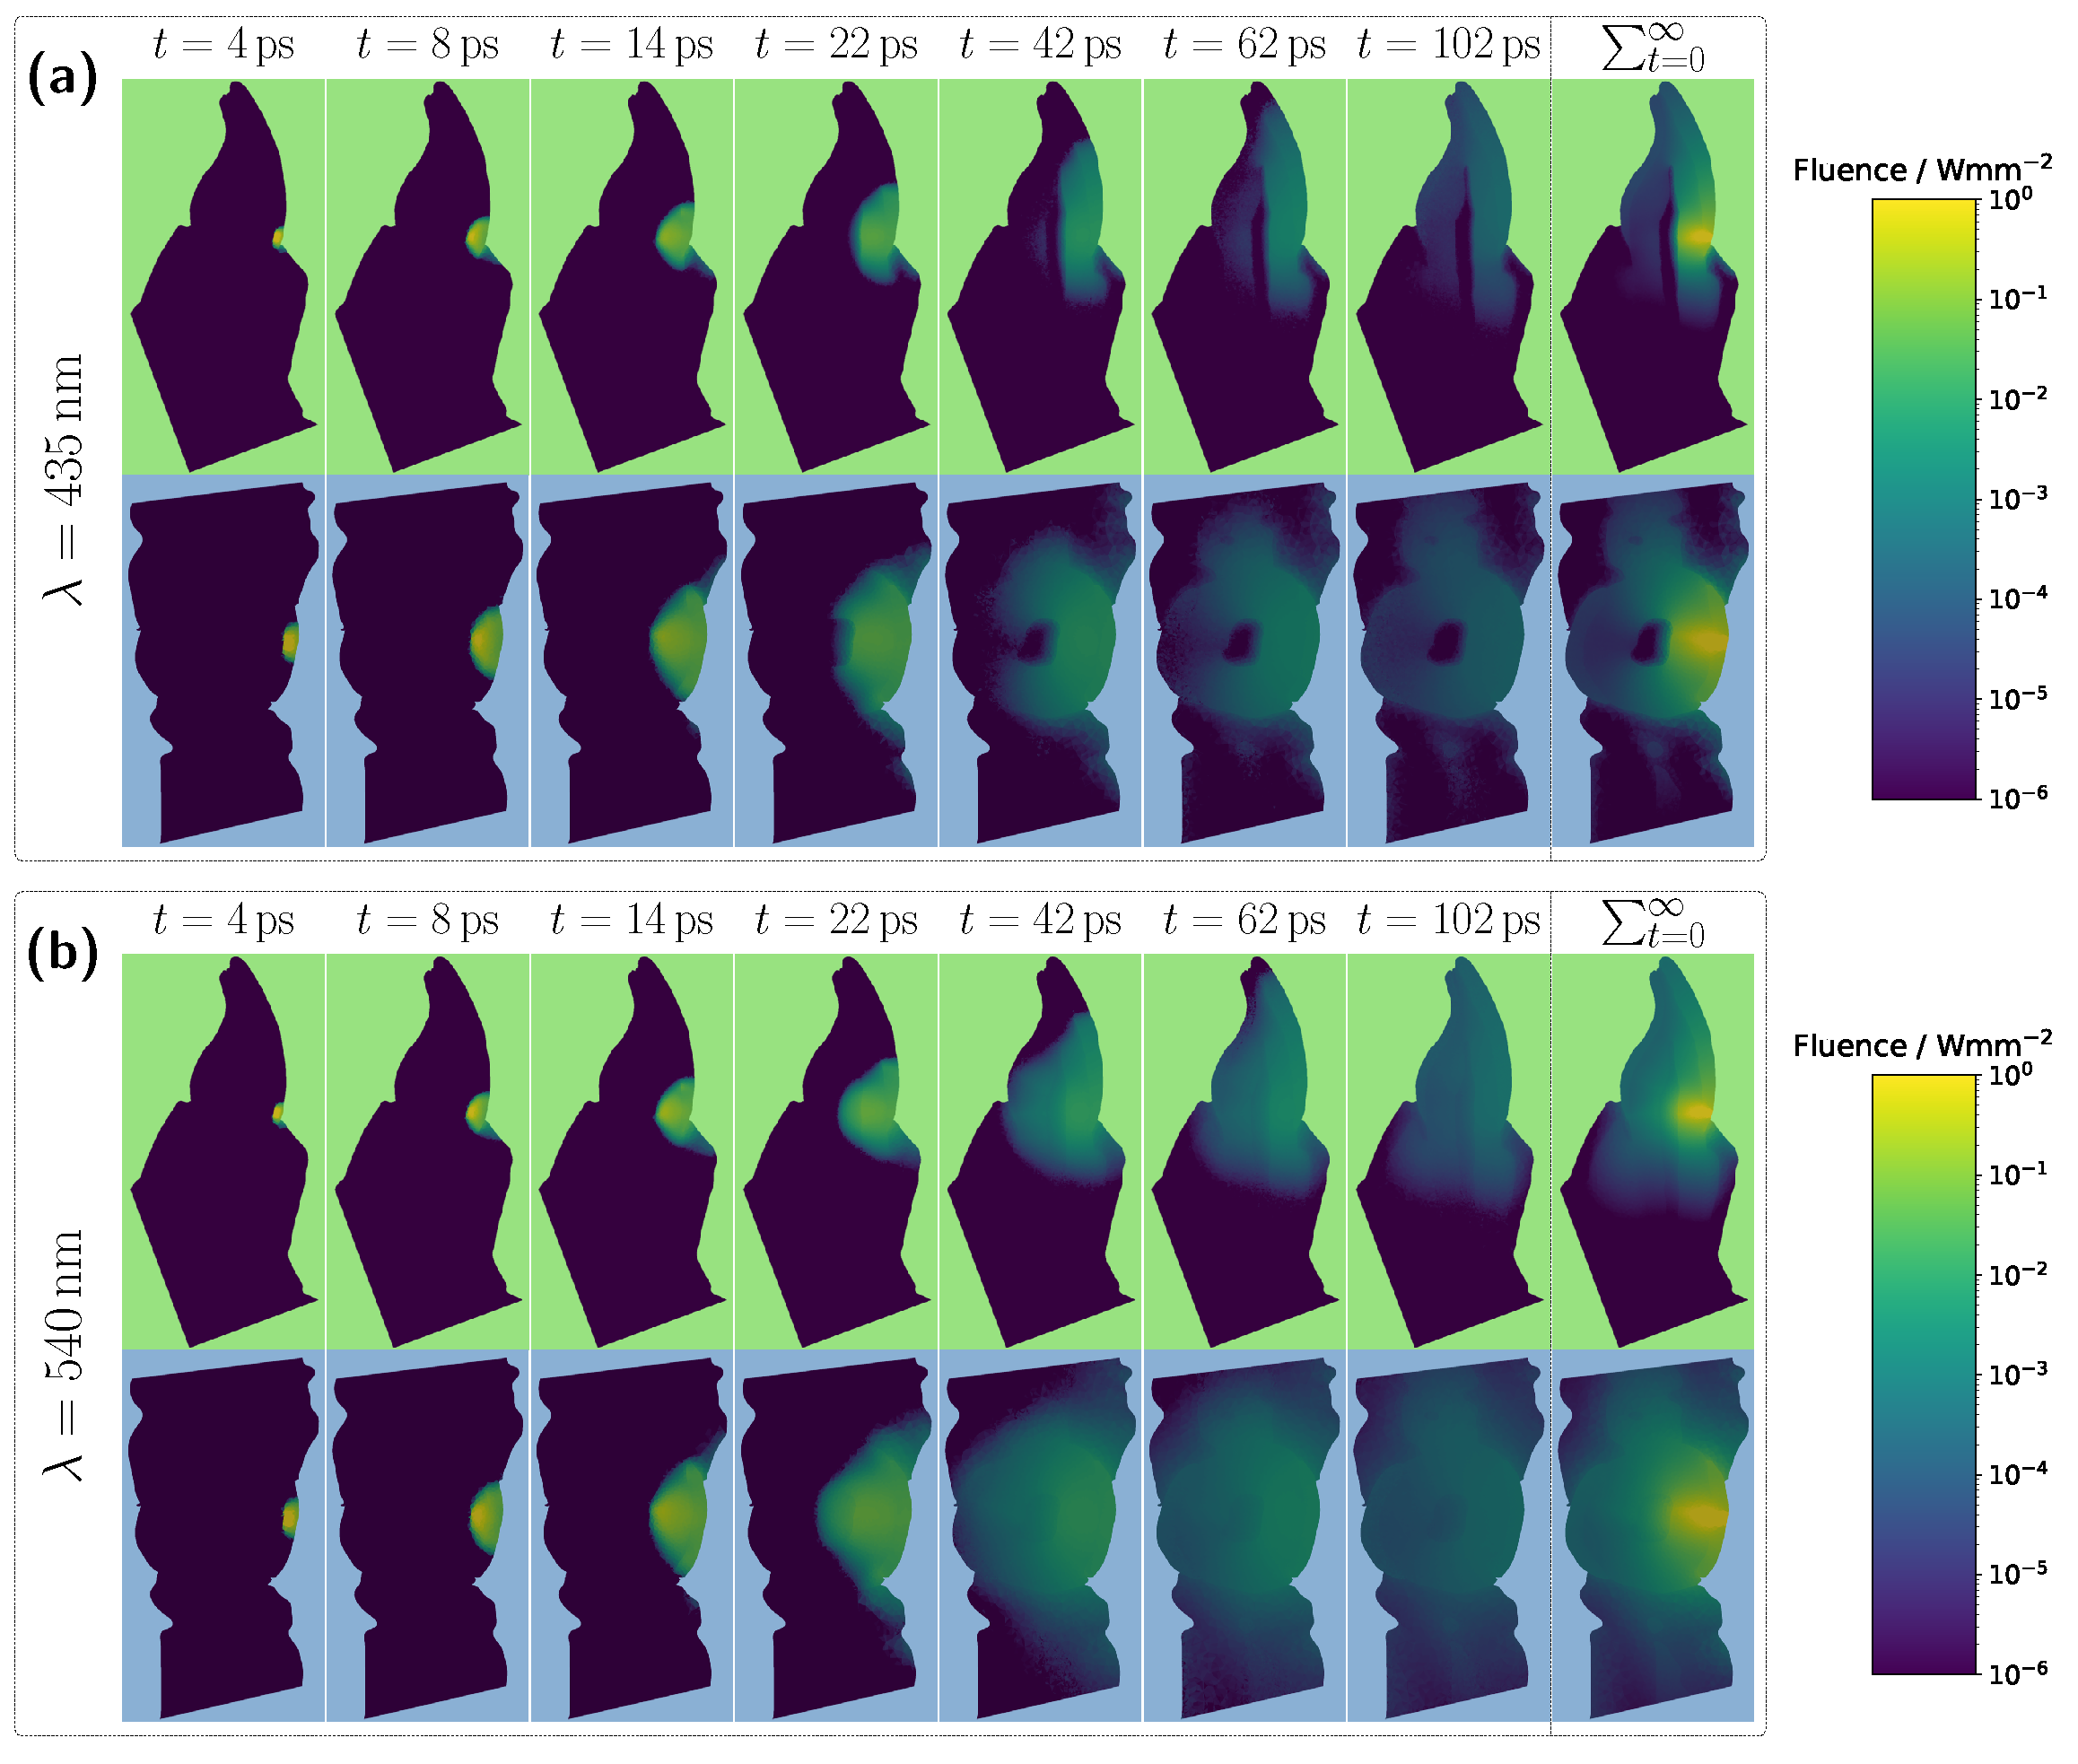
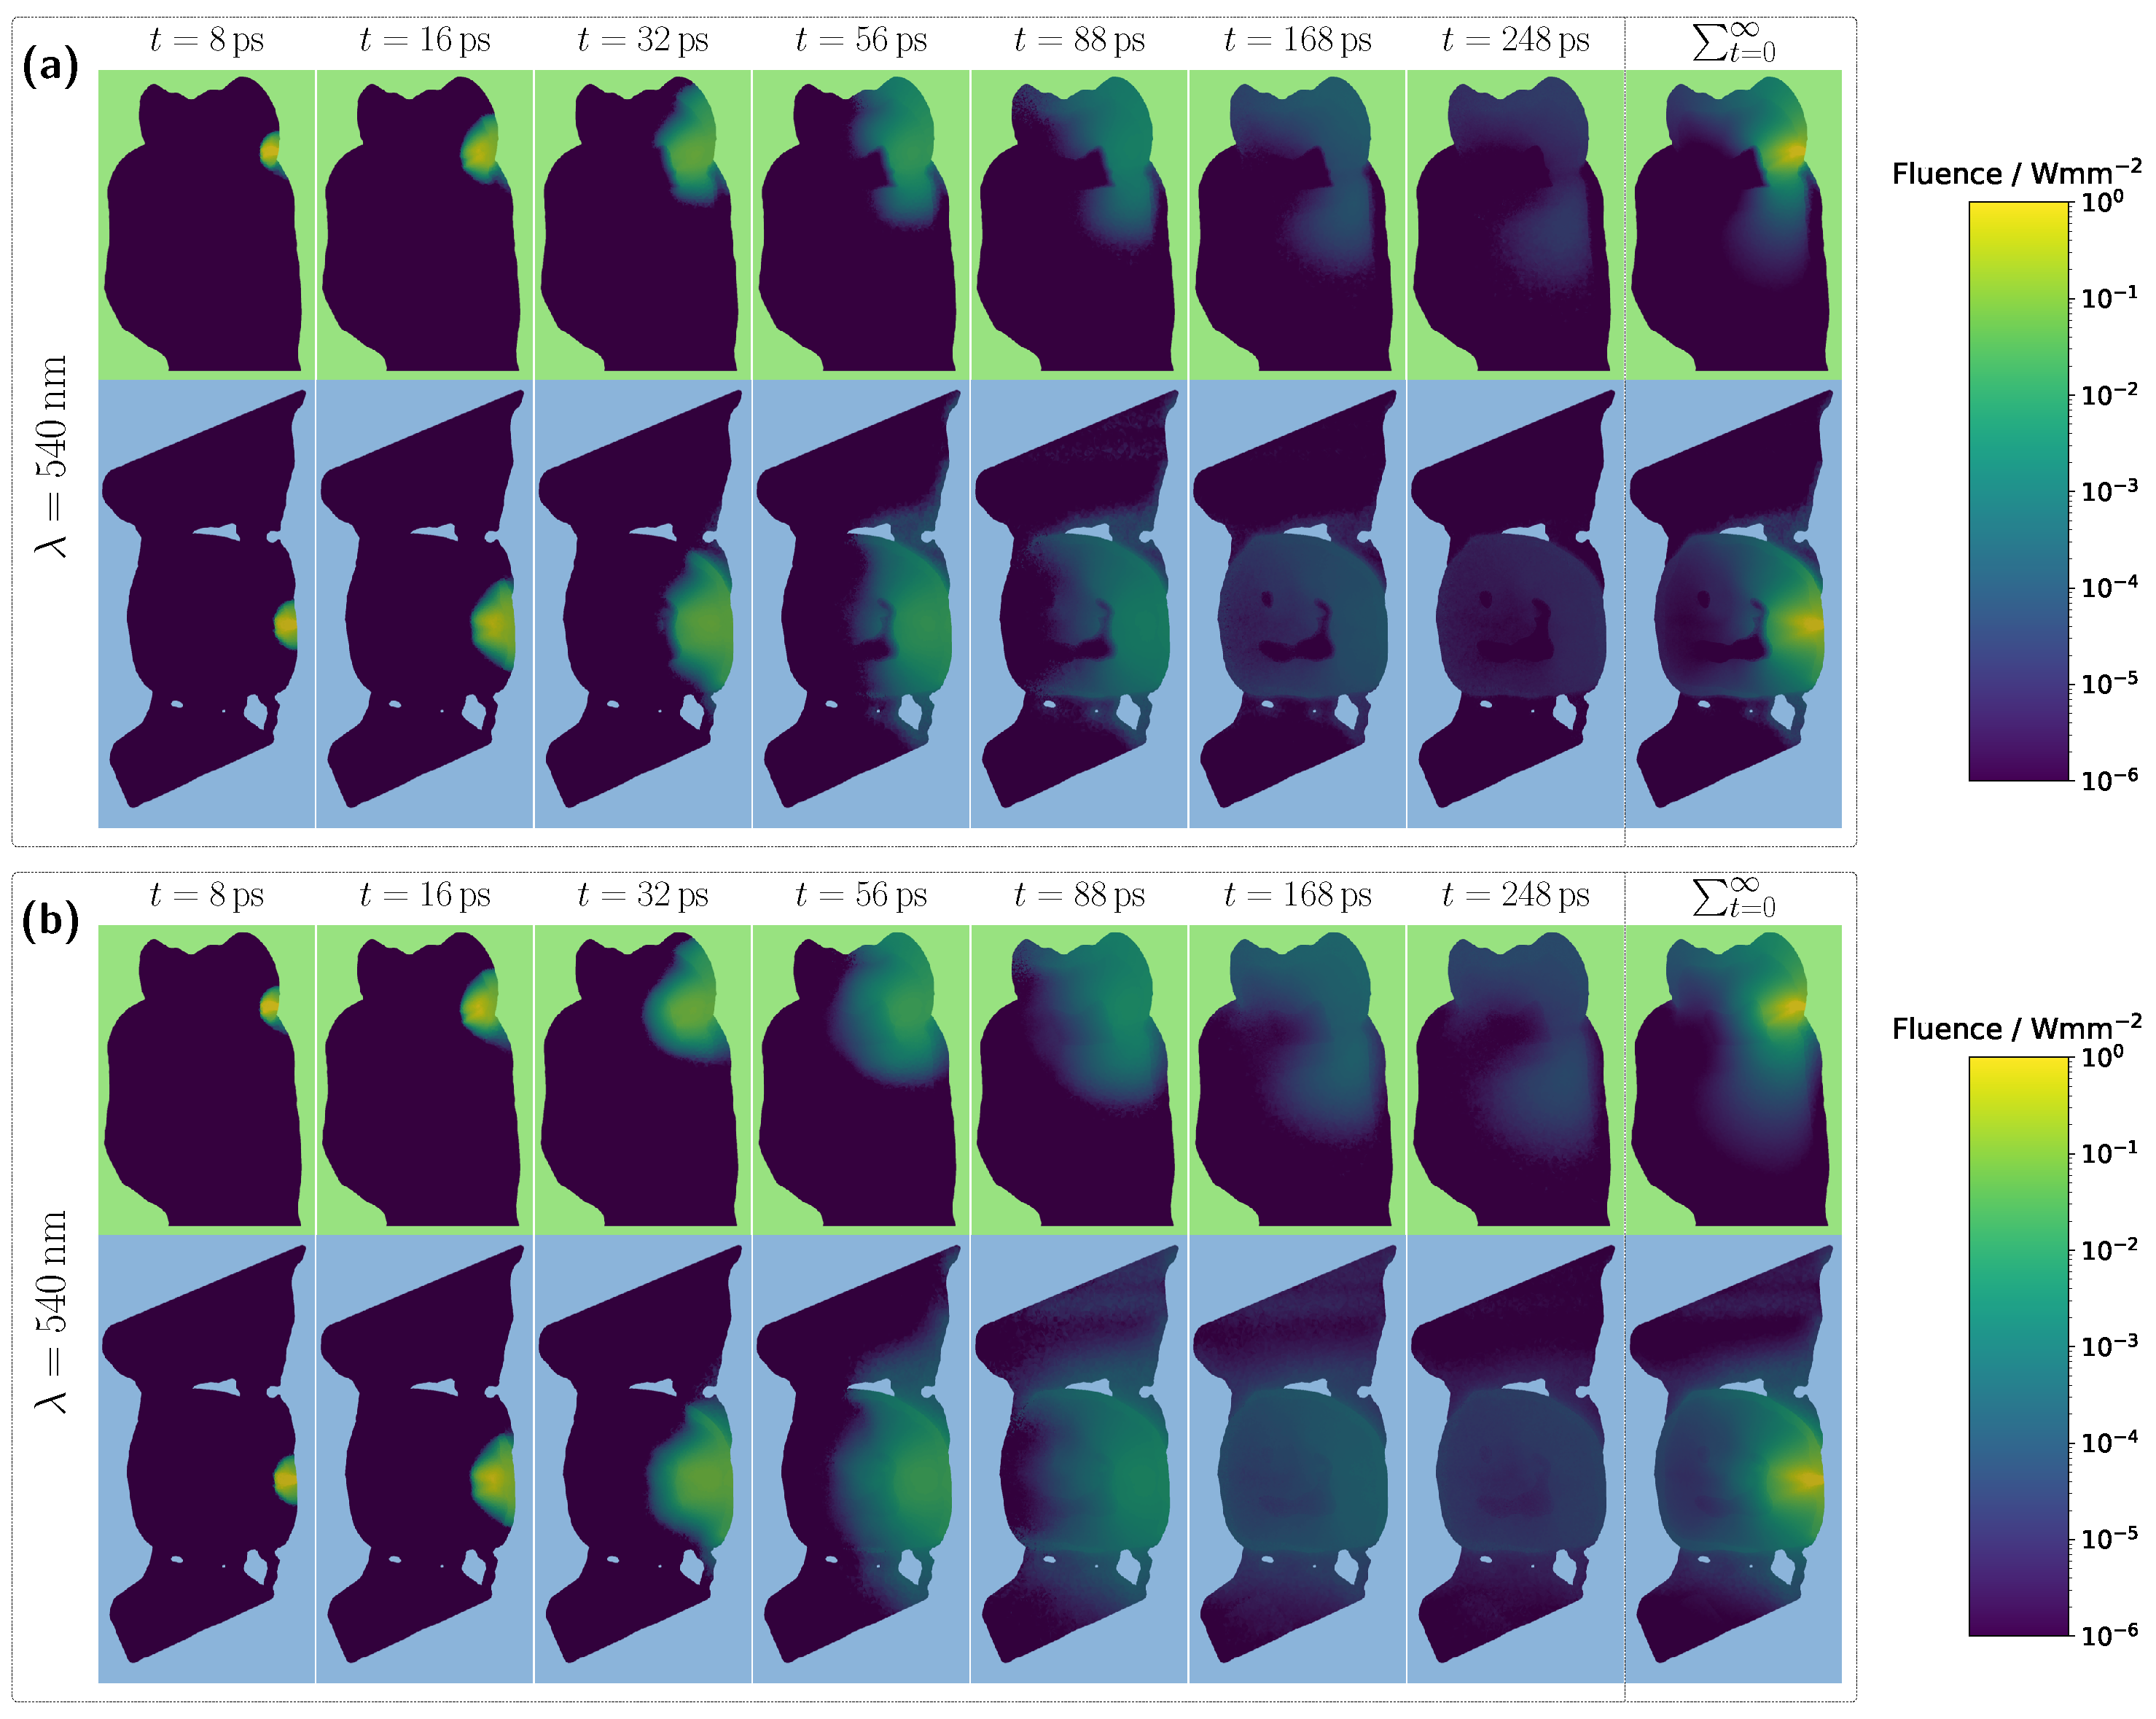
Figure 4.
Examining the time progression of the light distribution at a wavelength of 435 nm (see
Figure 4a), where the absorption maximum of the Hb-filled pulp occurs in the visible spectral range, reveals that the pulp largely obstructs photon paths propagating in the incident direction. As a result, incoming light can barely penetrate the pulp and is predominantly absorbed within it, forcing photons to propagate around the pulp before reaching the detector. Consequently, detected light is more likely to interact with peripheral tissues, such as the gingiva, before being recorded. This effect is also clearly visible in the steady-state fluence distribution, shown in the rightmost column of
Figure 4a. A different pattern emerges when analyzing the light distribution for an Hb-filled pulp at a higher wavelength of 540 nm (
Figure 4b), where attenuation is significantly lower in both the pulp and surrounding tooth tissue, as seen in
Figure 2. Although photons can now penetrate deeper into the surrounding tissue, the probability of reaching the detector decreases for these longer paths due to absorption and scattering. In contrast, photons traveling almost directly along the incident direction through the pulp are more likely to reach the detector, leading to an increased contribution of ‘direct’ photon paths and a higher pulp path fraction in the detected signal. Furthermore, regarding the pulp path fraction, it can be observed, particularly in the lower subplot of
Figure 3a from approximately 450 nm onward, that when attenuation within the pulp is sufficiently low, the ratio between
and
is primarily dictated by the optical properties of the gingiva. For instance, in the region of the oxyhemoglobin double absorption peaks, the pulp path fraction increases due to enhanced photon absorption within the gingiva. It is worth noting that, in this case, while an absolute decrease in
is also observed for an HbO
2-filled pulp, the corresponding decrease in
is markedly more pronounced. Another notable observation concerns the transmission curve for a pus-filled pulp. At approximately 475 nm and 640 nm, distinct absorption peaks corresponding to the measured pus spectrum, see
Figure 2b, are visible, distinguishing the transmission spectrum from the blood-filled cases through these additional spectral features.
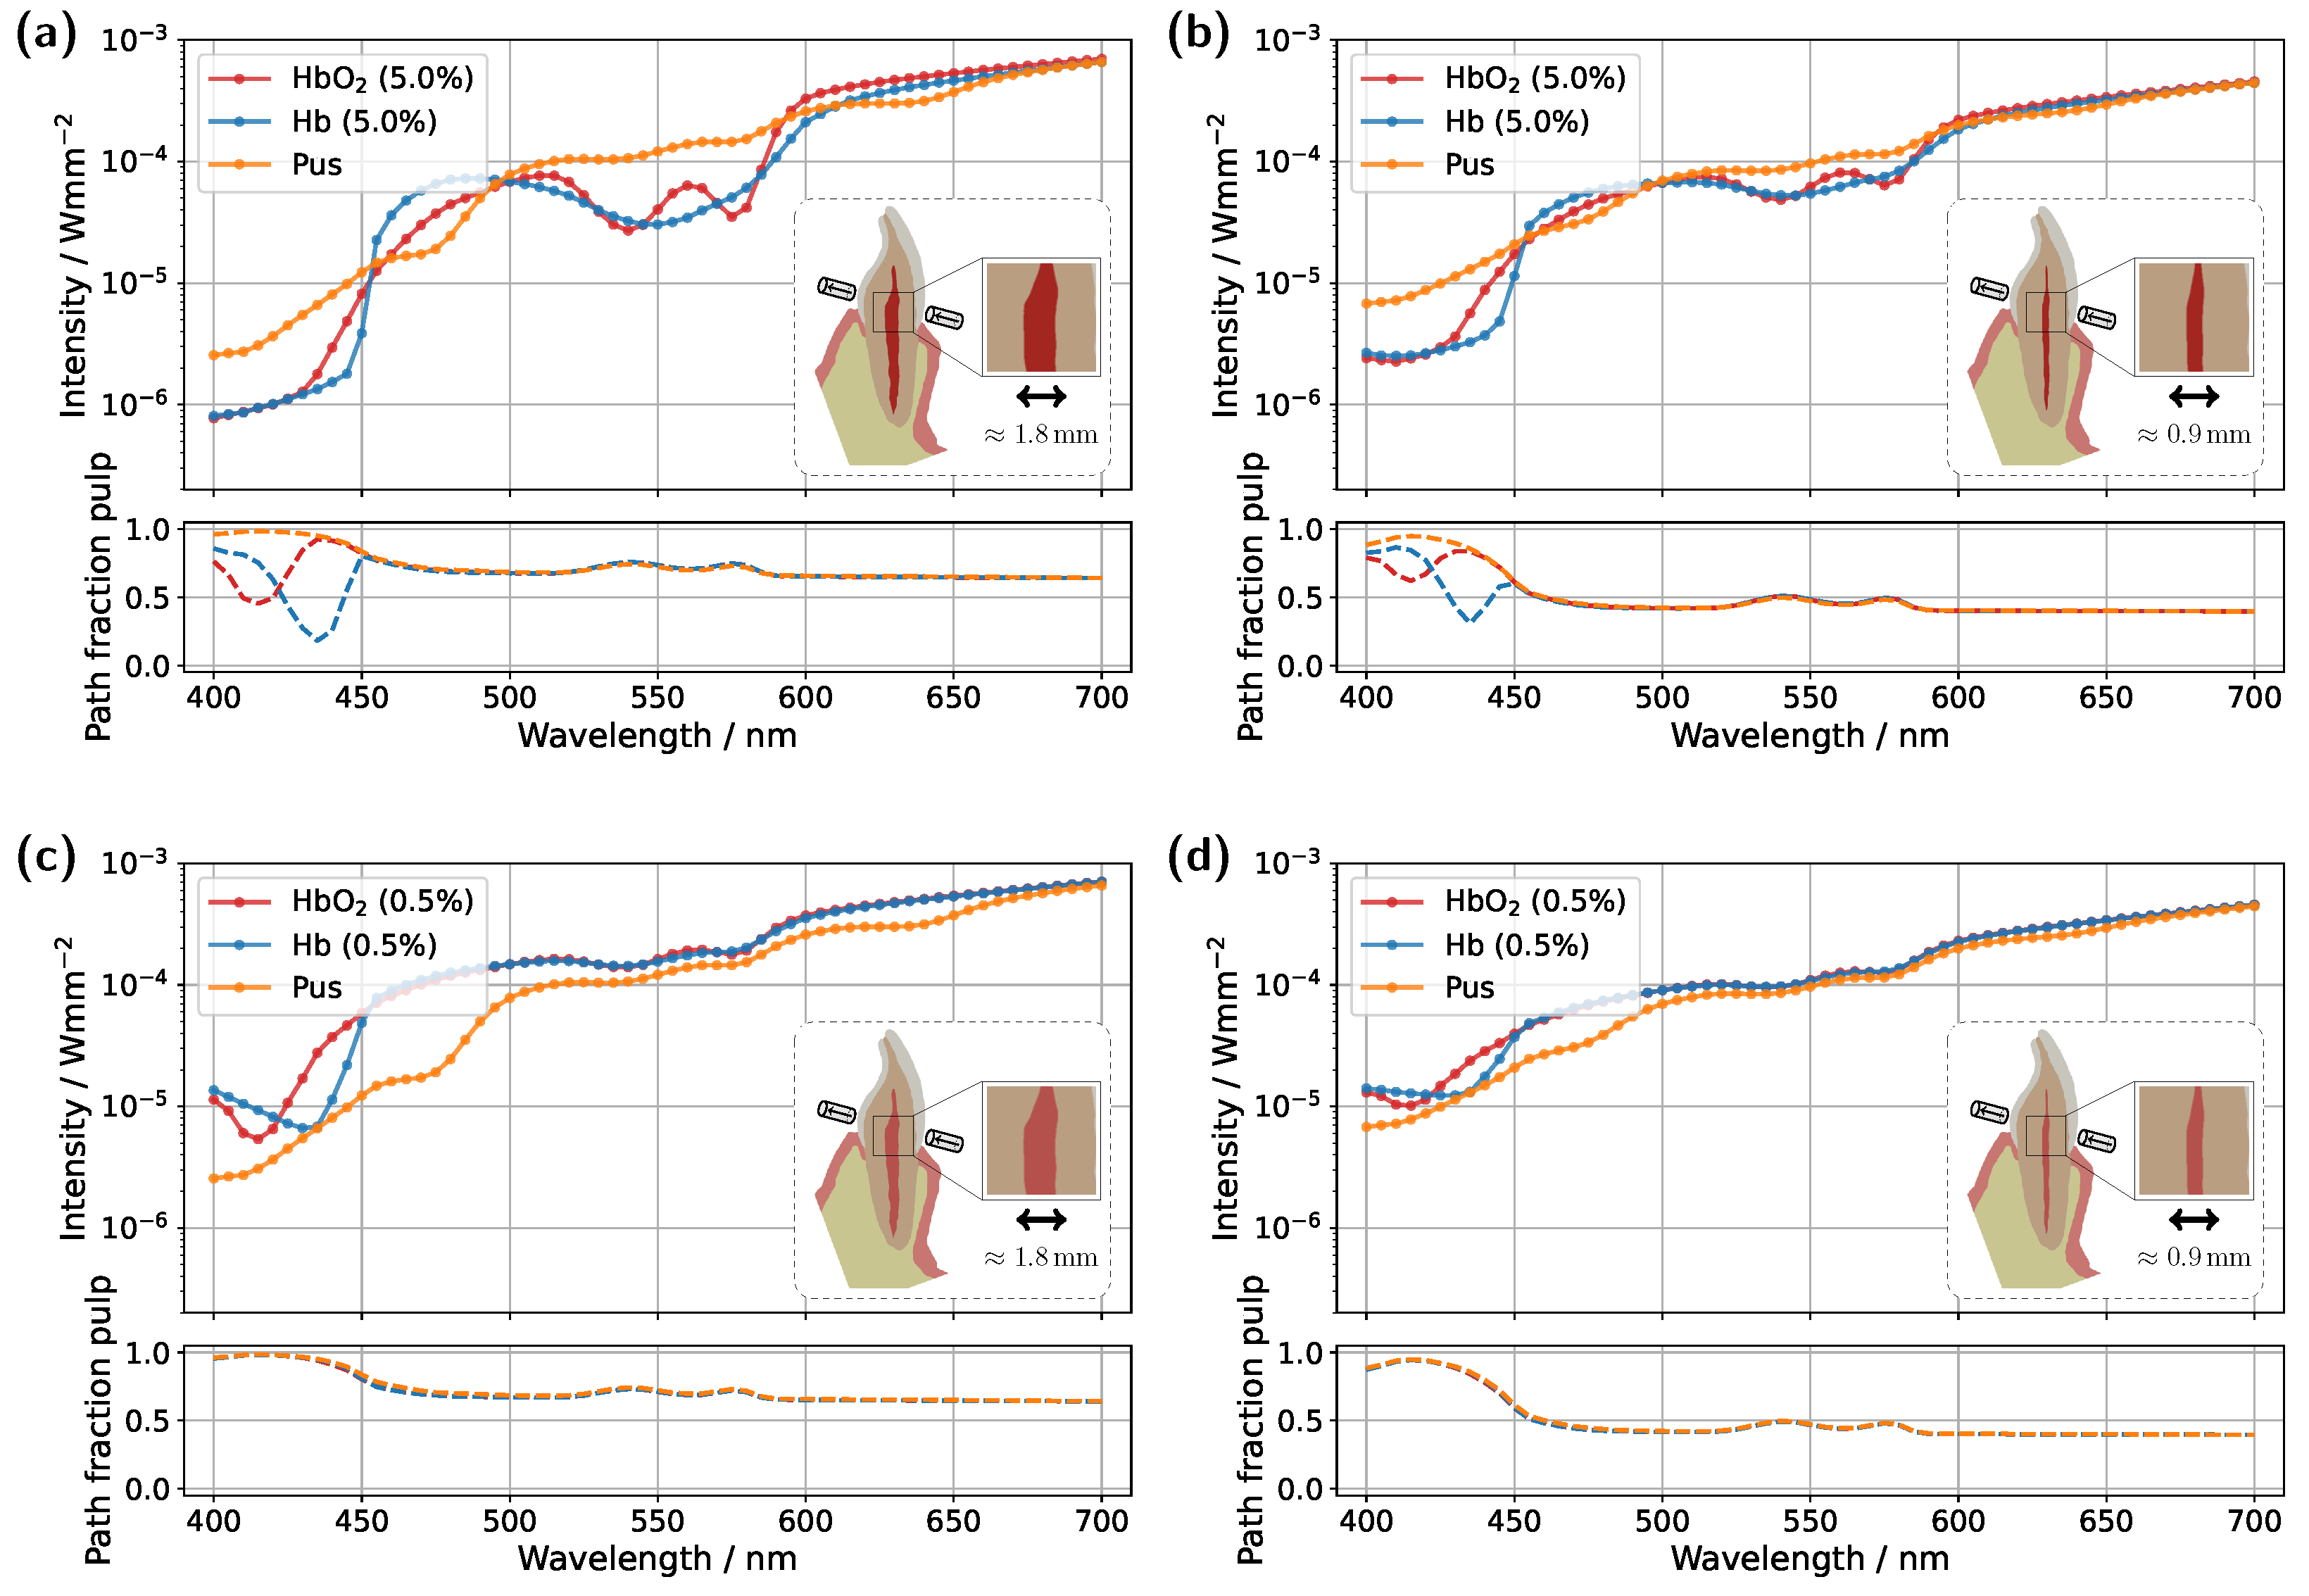
In the next step, the simulation model was adjusted to investigate the influence of a reduced blood concentration in the pulp on the transmission spectra (see
Figure 3c). To model a non-vital pulp [
37], the blood concentration for both Hb- and HbO
2-filled pulp was set to 0.5%. As before, the third pulp condition was modeled as completely pus-filled. While a fully pus-filled pulp represents an extreme clinical scenario, given that such a condition would likely be accompanied by severe symptoms such as intense pain or swelling [
38], this assumption is once again considered as a limiting case to better understand and illustrate the dynamics of the different model components. The reduction in absorption along the pulp due to the lower blood content leads to two key changes in the transmission spectra for oxygenated and deoxygenated blood-filled pulps. Firstly, the detected intensity in the transmission spectra for both of these cases is significantly higher in
Figure 3c compared to the previous setup in
Figure 3a, as less light is absorbed within the pulp. Secondly, distinct dips at approximately 540 nm and 575 nm now also appear in the transmission spectrum of the Hb case. From the lower subplot of
Figure 3c, it is evident that a significant portion of the detected light has traversed the gingiva. While the pulp path fraction remains similarly high compared to the previous case, seen in
Figure 3a, the absorption in the pulp is now approximately an order of magnitude smaller than in the gingiva, making the latter the dominant factor shaping the final signal. The strong influence of gingival absorption is further reinforced by the observation that, from approximately 450 nm onward, the transmission spectra for the HbO
2- and Hb-filled pulps almost completely overlap, indicating that the pulp composition has only a minor effect on the spectral shape. In contrast, for wavelengths below 450 nm, the absorption maxima of oxygenated and deoxygenated hemoglobin now become visible in the transmission spectrum, opposite to the trend seen in
Figure 3a. This is because the pulp no longer absorbs the majority of light in this spectral interval, whereas the gingiva does. The latter also explains why, in
Figure 3c, the pulp path fractions already align at wavelengths below 450 nm. Based on the previously analyzed simulations, it becomes evident that the spectral analysis of transmission signals carries inherent risks of misinterpretation. The present example demonstrates that peripheral tissues, such as the gingiva, can significantly influence the detected transmission spectrum. In particular, blood absorption in the gingiva can overlay spectral characteristics, creating the false impression that oxygenated blood is still present in the non-vital pulp and thereby leading to an incorrect diagnosis. The authors note that in various other optical diagnostic methods, it has already been suspected that the gingiva may contribute to inconsistent results [
8].
In addition to varying pulp composition and blood concentration, the pulp geometry was also adjusted in the simulations shown in
Figure 3b,d to account for a reduction in pulp cavity size due to pathological conditions or natural age-related changes [
39,
40]. Specifically, the radial dimensions of the pulp, more precisely the x- and y-dimensions, were scaled by a factor of 0.5. While this does not universally reflect anatomical reality, the height, i.e., the z-dimension, was left unchanged to ensure better comparability with the original model, as the primary objective was to investigate the effect of varying pulp thickness along the direction of illumination. Examining the simulation results for a blood concentration of 5.0% in the reduced pulp (see
Figure 3b), the same general trends and spectral features observed in the original model (
Figure 3a) can be identified, though with altered magnitudes. Once again, in the HbO
2 case, two distinct dips between 500 nm and 600 nm are observed, while these features disappear in the Hb case. However, due to the reduced pulp volume and consequently shorter photon paths through the pulp, the difference between the transmission spectra for different oxygen saturations is noticeably diminished. This is also reflected in the pulp path fraction, where
is now less than or equal to
for wavelengths above 450 nm. On the other hand, the reduced pulp volume results in smaller drops in the pulp path fraction in the 400–450 nm range for both HbO
2 and Hb cases, as ’direct’ detection paths are no longer as strongly blocked by the pulp. For the pus-filled pulp, the characteristic HbO
2 double dip caused by gingival absorption is again present, along with the two distinct absorption peaks of pus at approximately 475 nm and 640 nm, albeit with reduced prominence. For the lower blood concentration of 0.5% (see
Figure 3d), with a reduced pulp size, once more, similar effects are observed as in the corresponding original model in
Figure 3c. Again, the shrinkage of the pulp cavity leads to a pronounced convergence of the transmission spectra for SO
2 and SO
2 , with both spectra exhibiting lower intensity from approximately 450 nm onward compared to the original model. Although this may not seem intuitive at first glance, it can be explained by the concurrent increase in dentin volume as the pulp volume is reduced. Comparing the assumed dentin absorption with blood absorption (see
Figure 2b) reveals that dentin exhibits a higher absorption coefficient in this wavelength range, resulting in the observed intensity reduction. The same effect is also evident when comparing
Figure 3a and
Figure 3b; however, due to the higher blood concentration in the pulp, the intensity reduction occurs only beyond approximately 600 nm.
3.2. Spectral Transmission of the Molar Model
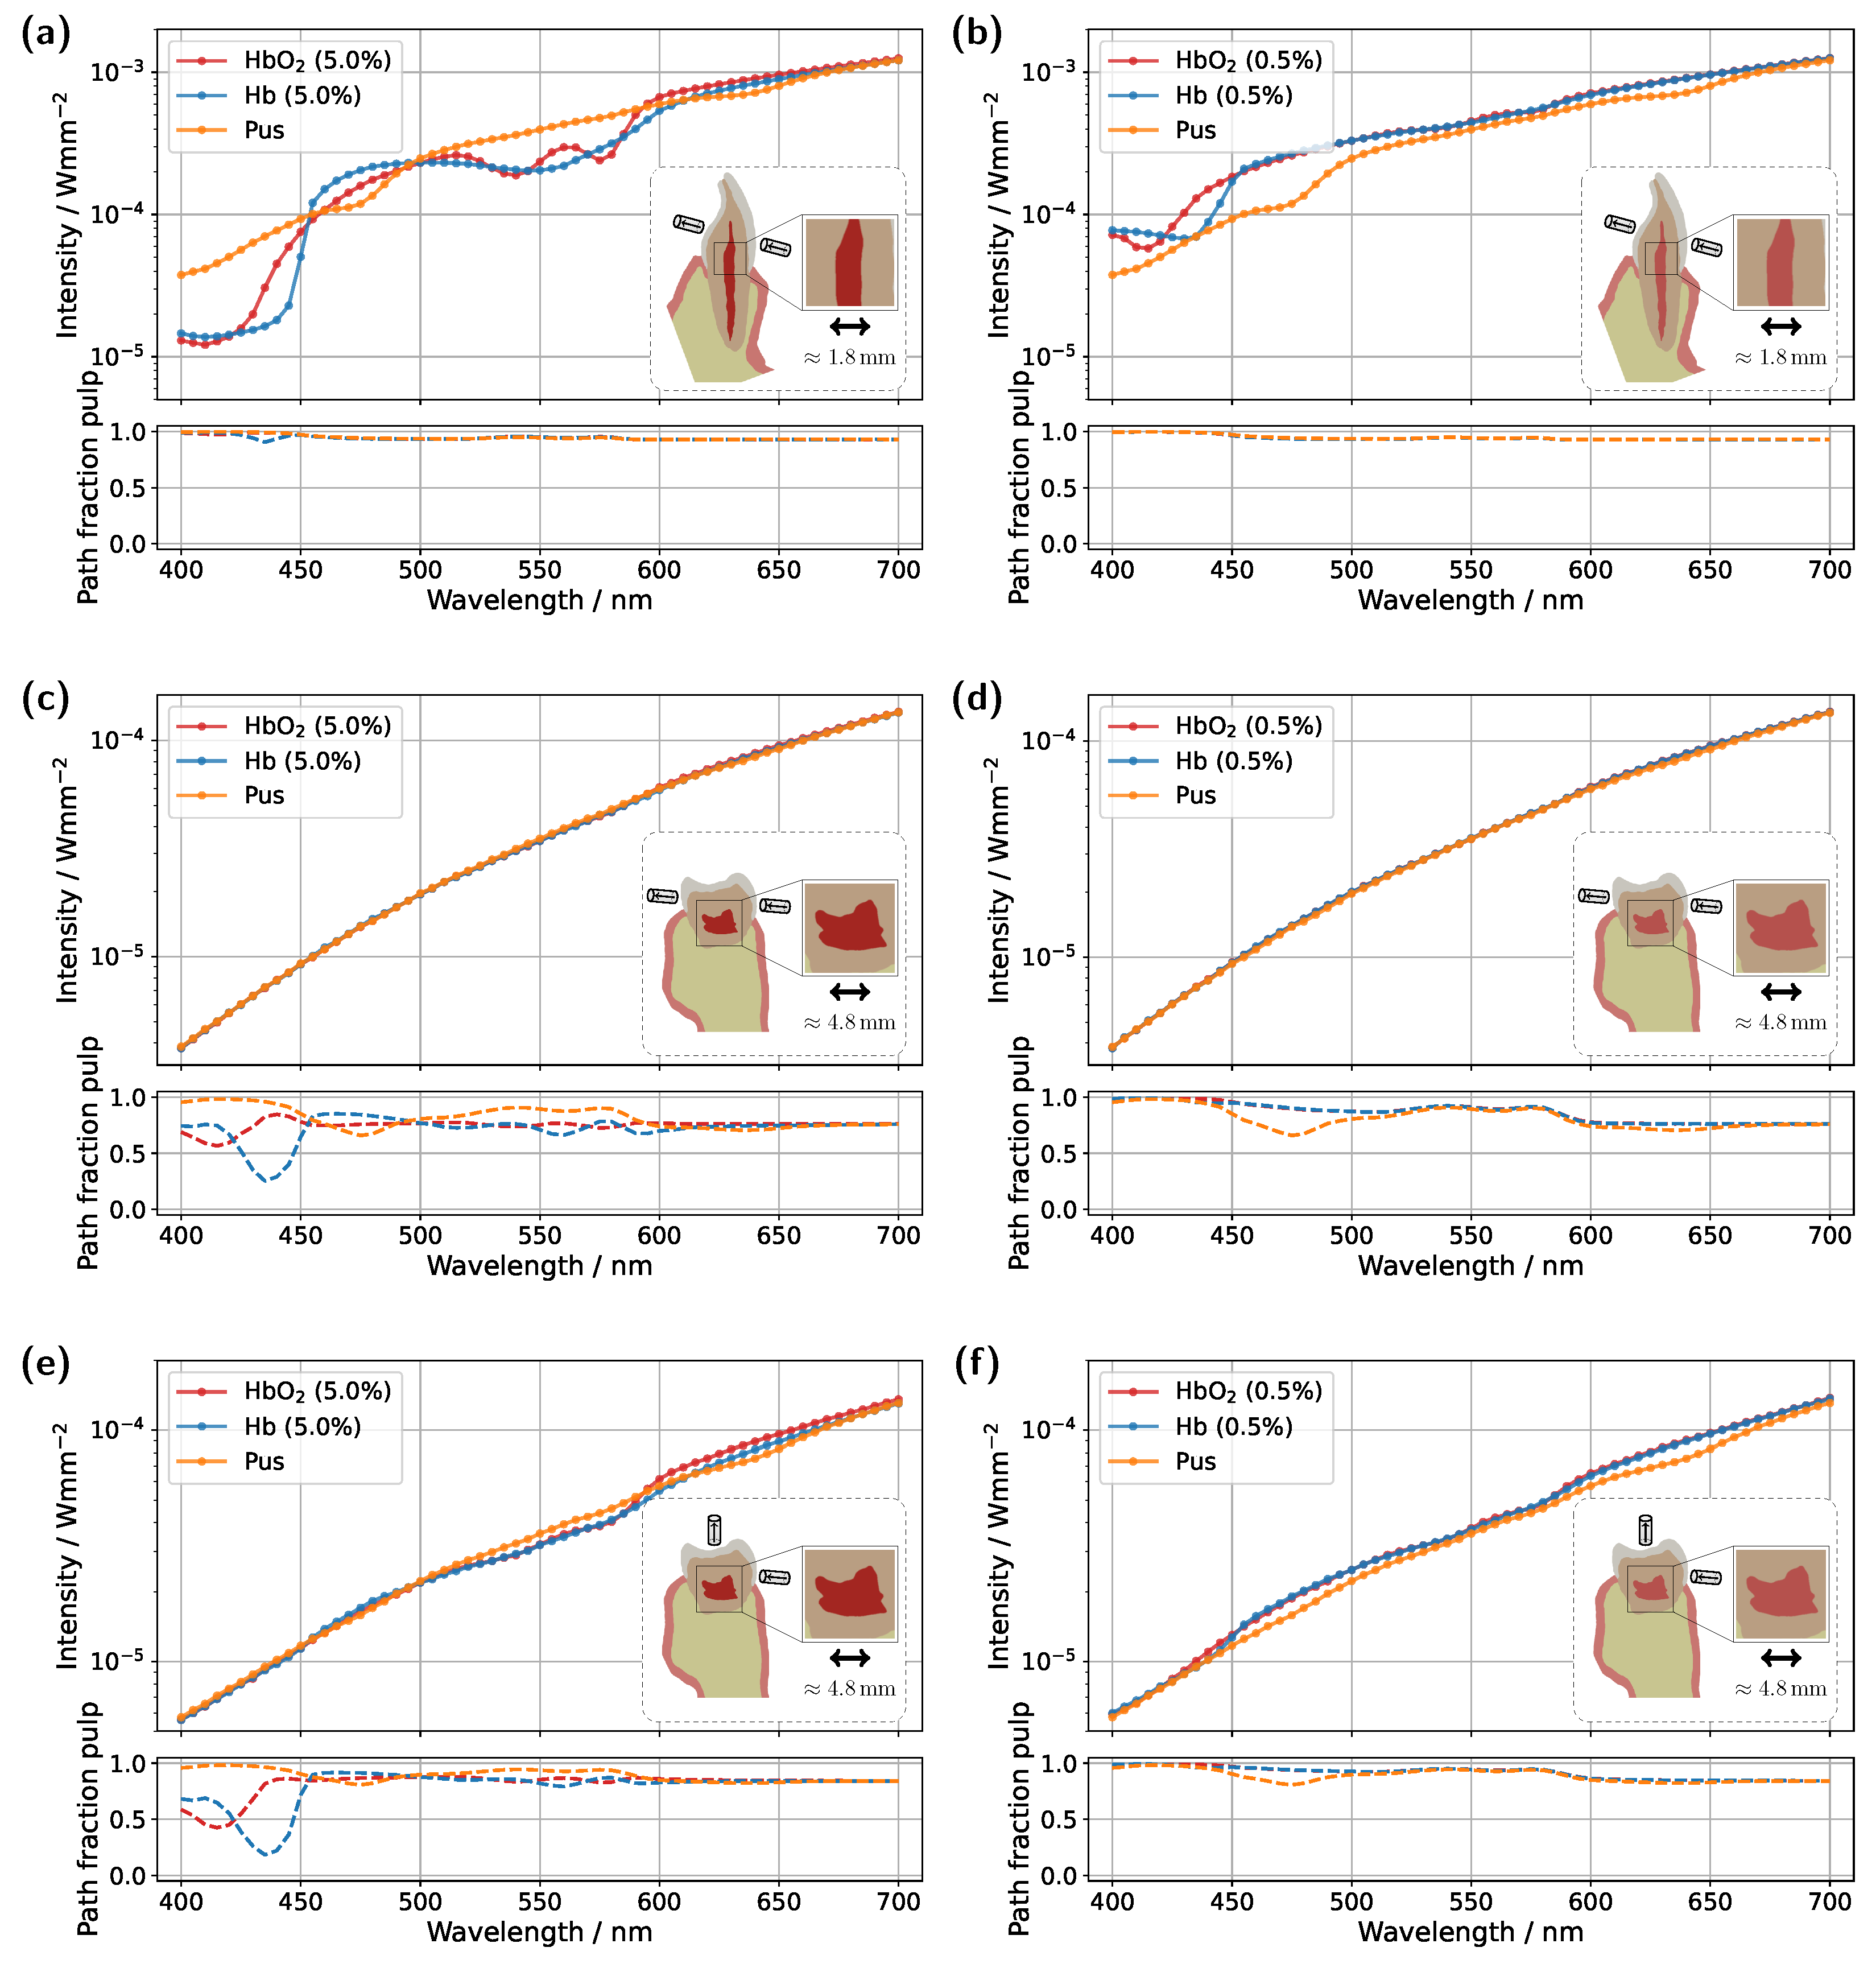
Analogous to the previously analyzed incisor model, the same simulation cases were then examined for a molar tooth (see
Figure 5). As before, light was introduced and detected along an axis corresponding to the intersection of the sectional planes shown in
Figure 1b, just above the gingiva. However, compared to the incisor model, the significantly larger dimensions of the molar result in a considerably longer optical path to the detector. In particular, the dentin and pulp tissue are substantially wider along the propagation direction, leading to expected differences in the transmission signal, primarily a reduction in intensity due to the increased optical attenuation. This expectation is confirmed in the simulation case with a 5.0% blood concentration (see
Figure 5a).
Overall, the detected signal is approximately an order of magnitude lower compared to the corresponding incisor spectrum in
Figure 3a. Another major difference concerns the shape of the transmission spectra for the different pulp fillings. In this case, the spectra for all three scenarios are much closer together, with only minimal traces of the characteristic HbO
2 double dips and significantly weaker spectral features of pus absorption, where only the peak at approximately 640 nm remains slightly visible. These observations can be attributed to the pulp geometry. Firstly, the cross-sectional area of the pulp is significantly larger than in the incisor model. Secondly, the axis of light propagation and detection passes only marginally through the pulp tissue, meaning that most of the detected light must first be scattered a lot of times within the dentin before reaching the pulp. Additionally, the larger pulp cross-section blocks light more effectively. The combination of these effects results in a reduced influence of pulp composition on the transmission signal, manifesting as spectral curve convergence and weakened spectral features. For longer wavelengths, where attenuation within the pulp decreases, larger spectral differences between the different pulp fillings become evident beyond approximately 590 nm. In particular, for differentiating between HbO
2- and Hb-filled pulp, the significantly different slopes of the spectra, attributable to their respective absorption profiles (see
Figure 2), allow for improved distinction. In terms of diagnostic application, for the molar model under consideration, reliable differentiation would likely only be feasible when including this spectral range beyond 590 nm. Examining the pulp path fraction in the subplot of
Figure 5a, absorption dips are once again observed for blood-filled pulps in the 400–450 nm range, though these are even more pronounced than in the incisor model due to the larger pulp dimensions. As previously shown, high absorption in this spectral range causes the pulp to block incident light almost entirely, resulting in most detected photons having taken longer paths through the gingiva rather than the pulp. This effect is further confirmed in the internal light distribution, see
Figure 6a.
For an assumed Hb-filled pulp at 435 nm, incident light cannot pass directly through the pulp and must instead propagate around the pulp cavity before reaching the detector. Conversely, at a higher wavelength of 540 nm (see
Figure 6b), a larger proportion of light can take a more direct path to the detector, resulting in an increased pulp path fraction. Regarding the pulp path fraction, a key distinction between the molar and incisor models becomes evident. In the incisor model, from approximately 450 nm onward, all cases exhibited nearly identical path fractions, with spectral features primarily influenced by gingival HbO
2 absorption. In contrast, for the molar, the larger pulp cavity leads to distinctly different spectral curves for each simulated case, with the absorption characteristics of the respective pulp filling determining the final signal shape. Furthermore, for blood-filled pulps (see
Figure 5a), similar pulp path fractions are reached beyond 450 nm, as in the incisor model, aside from variations caused by pulp absorption. This suggests that although larger pulp volumes generally lead to longer photon paths through the pulp, the resulting increase in path length is counterbalanced by greater attenuation along these extended trajectories.
Moving on to the model with a blood concentration of 0.5% (see
Figure 5c), it becomes evident that in the spectral range between 500 nm and 600 nm, the spectral characteristics of the blood-filled cases become more pronounced, while the path fractions converge across most of the visible wavelength range. Additionally, the overall detected intensity increases. These three effects can be attributed to the reduced optical attenuation along the pulp. The incident light paths can now pass through the pulp more freely, experiencing less attenuation, resulting in a smaller contribution from photons that have traversed the gingiva. This is also reflected in the overall increase in the pulp path fraction across the spectral range. Nevertheless, the fact that the transmission spectra of both blood-filled cases nearly overlap suggests that the gingiva could still significantly influence the signal shape. This does not contradict the previous findings, as the HbO
2/Hb absorption in the pulp is now approximately an order of magnitude lower than the gingival oxyhemoglobin absorption. Consequently, even in this case, the influence of the gingiva could lead to a misinterpretation in diagnosis.
In the modified model with a blood concentration of 5.0% and a reduced pulp size (
Figure 5b), where the radial dimensions in the x- and y-directions were scaled by a factor of 0.5, analogous to the incisor model, similar signal characteristics and features as in the original model (
Figure 5a) are observed, albeit with altered magnitudes. The most significant difference arises in the spectral range beyond approximately 590 nm. Due to the smaller pulp size and its consequently diminished influence on the transmission spectrum, the previously observed differences between the various pulp fillings are further reduced, making potential diagnostic differentiation even more challenging. Additionally, a lower signal intensity is observed compared to the original model. This effect can be explained analogously to the previously analyzed incisor model. The reduction in pulp size is accompanied by an increase in dentin volume. Given the assumed optical properties, the increased dentin volume leads to a further decrease in signal intensity, as dentin absorption becomes more dominant in this spectral range. Furthermore, in the pulp path fraction, the minima of both blood-filled cases below 450 nm and the pus-filled case at approximately 475 nm are reduced. Additionally, across the remaining wavelength range, the curves further converge and exhibit an overall decrease in magnitude. Both effects can again be attributed to the reduced influence of the pulp due to its smaller volume. A similar trend is also observed in the model with a blood concentration of 0.5% and a reduced pulp size (see
Figure 5d), but in this case, the effects become apparent already at shorter wavelengths. This is due to the lower blood concentration, which reduces blood absorption, causing the transmission characteristics to shift accordingly.
Overall, the results presented in
Figure 5 suggest that, when aiming to sensitively detect (blood) absorption differences within the pulp, the optimal spectral region depends on the absolute level of pulp absorption. In cases of high absolute pulp absorption, as shown in
Figure 5a, the most suitable region is where blood absorption is relatively low, but the difference between oxy- and deoxyhemoglobin is large, such as around 600 nm or 470 nm. Conversely, in cases of low absolute pulp absorption, as in
Figure 5d, the most informative region lies where blood absorption is high and the spectral differences between oxy- and deoxyhemoglobin are also significant, for example, around 435 nm. This means that the ‘optical absorption thickness’, i.e., the product of the absorption coefficient and the mean path length through the pulp, should, as a general rule of thumb, lie approximately around a value of 1, such that a change in absorption results in a significant change in transmission.
3.3. Strategies for Minimizing Gingival Contributions
Having demonstrated that a naive approach to using transmission spectra for assessing pulp vitality can easily lead to misinterpretations, two strategies will now be explored to potentially make this methodology less susceptible to errors. Specifically, the focus will be on whether the influence of gingival HbO
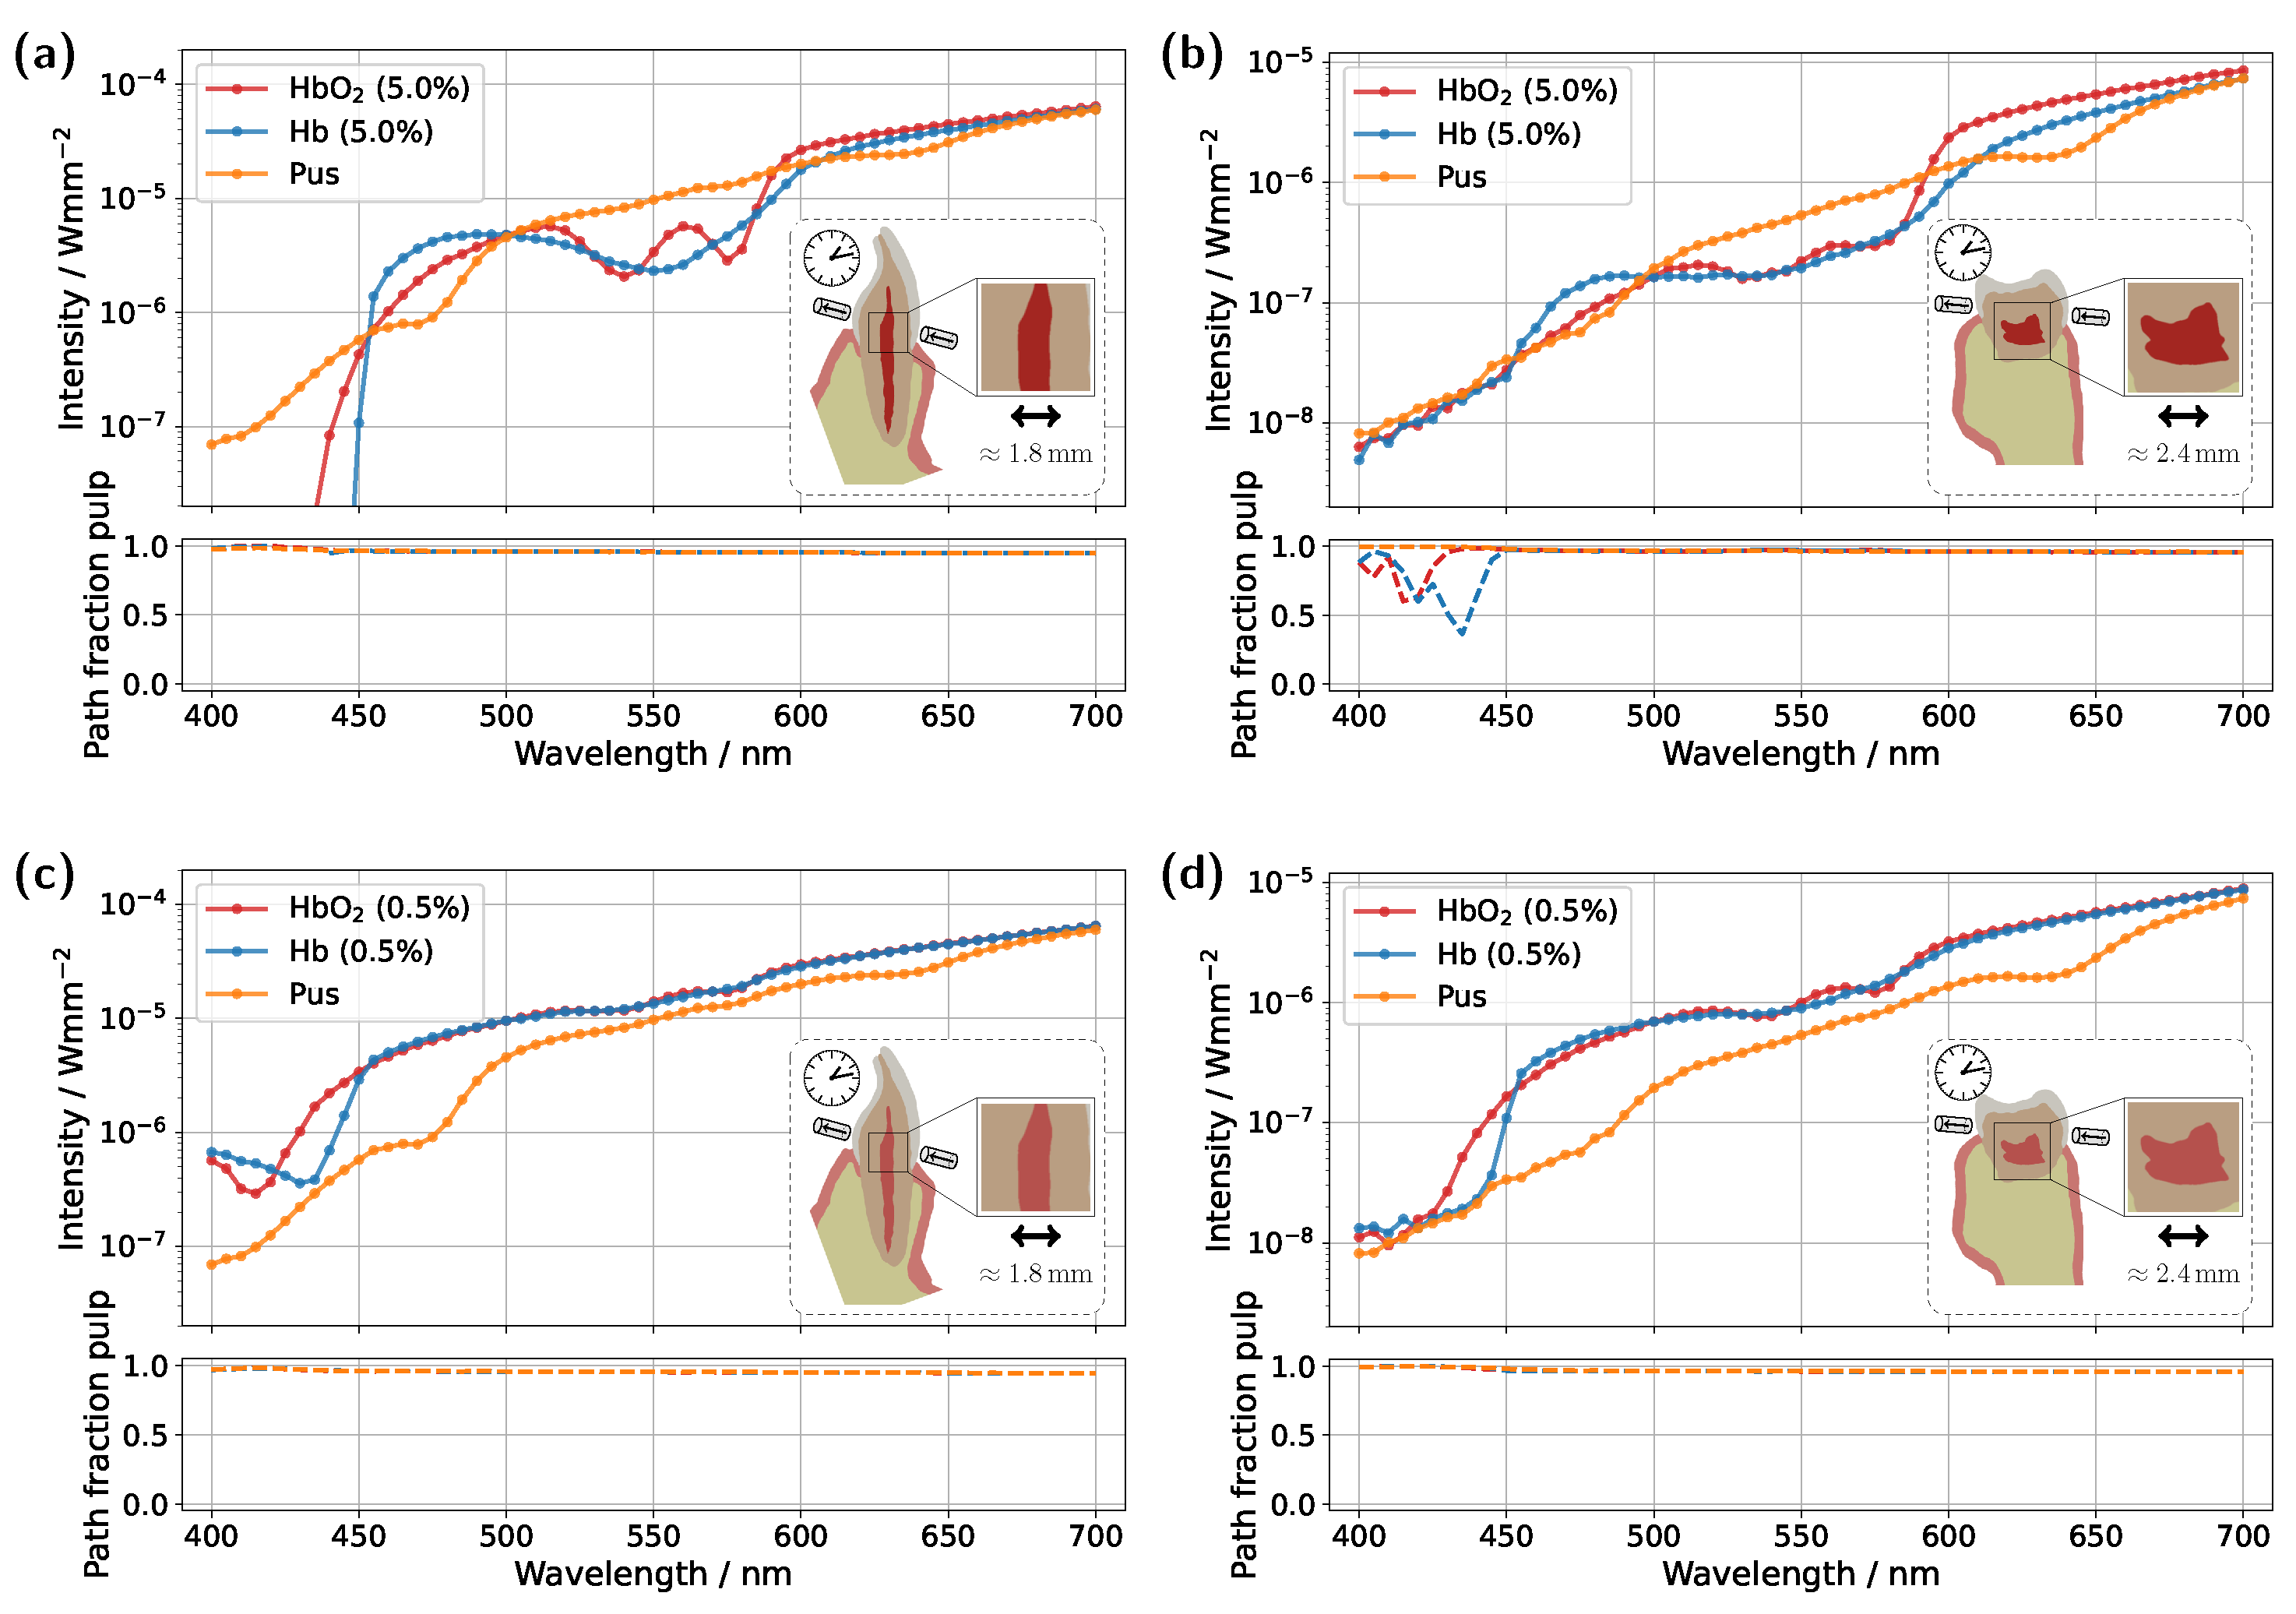
2 absorption can be partially or even completely suppressed. As a first intuitive approach, the position of the illumination and detection axes was adjusted, see
Figure 7, with the detector and source placed approximately 2 mm above the gingival margin. This adjustment was made in the hope that the increased distance would result in reduced contributions from the gingiva.
For the incisor model with a blood concentration of 5.0%, the intended effect is clearly reflected in the pulp path fraction (see subplot in
Figure 7a), which now exceeds 0.9 across almost the entire spectral range. Compared to the original illumination and detector position (
Figure 3a), a significantly smaller portion of the detected photon paths now traverses the gingiva, as expected. This is also evident in the transmission spectra, where the characteristic double dip caused by gingival oxyhemoglobin absorption is no longer present in the pus case. At a blood concentration of 0.5% (see
Figure 7b), the double dip between 500 nm and 600 nm is also no longer observed in either the Hb or pus case, although it was clearly present in the original setup (
Figure 3c). Furthermore, the spectra of the different pulp fillings are now even more closely aligned, as the influence of the pulp decreases further due to its significantly narrower cross-section, now more than half its original width, along the illumination axis. Nevertheless, due to the favorable optical absorption thickness, a pronounced difference between the two blood-filled cases is observed around 435 nm. In the case of the molar model with a blood concentration of 5.0%, the adjustment of the illumination and detection axes unfortunately did not produce the desired effect (
Figure 7c). Here, the transmission spectra for the different pulp fillings are nearly identical, indicating that the pulp has little to no influence on the recorded signal. This becomes understandable when examining the 3D geometry in
Figure 1c. The shifted axis causes direct photon paths to bypass the pulp tissue entirely, passing instead between the pulp horns. Unsurprisingly, the same outcome is observed at a blood concentration of 0.5%, making it evident that, under this configuration, a diagnostically meaningful classification of pulp vitality would not be feasible. Therefore, an additional setup was examined for the molar model (see
Figure 7e,f), in which the light source was positioned as in the original arrangement (
Figure 5), while the detector was placed nearly orthogonally to the illumination axis on the occlusal surface. At a blood concentration of 5.0% (
Figure 7e), a distinguishable difference between the various pulp fillings is once again apparent, and the pulp path fraction is significantly increased compared to the original setup in
Figure 5a. This indicates that the gingival contribution was effectively reduced using this configuration. A similar effect is observed at a blood concentration of 0.5%, although in this case, due to the lower blood absorption in the pulp, the spectra lie closer together. The only drawback of this measurement geometry is that, in contrast to the incisor model, it does not allow for a straightforward differentiation between the two blood concentrations based on the prominence of the oxyhemoglobin double dip. However, utilizing wavelengths of around 435 nm and 590 nm may offer a viable solution, due to the optimal optical absorption thickness in these regions. Furthermore, pus should be clearly detectable in both
Figure 7e and
Figure 7f. The authors further note that an additional measurement geometry was investigated for the molar, in which the illumination and detection axes, intended as an improvement over the setup in
Figure 7c,d, were directed toward the left pulp horns (see
Figure 1c). In this case, however, due to the proximity to the lateral gingival tissue and the stronger optical attenuation along the pulp, increased contributions from the gingiva were observed, with a mean path fraction of approximately 0.6. Apart from that, such precise positioning of the illumination and detection axis would require an additional imaging modality.
As a second approach, the application of a time-gated detector was investigated. In this method, detection occurs within a defined time window to primarily register direct photon paths that have predominantly interacted with the pulp. Theoretically, this approach filters out longer photon paths, which have a higher probability of interacting with the gingiva, thereby reducing their influence on the detected signal. Considering statistical limitations, a tolerance was introduced in the integration time. This ensures that not only the very first detected photons are recorded but also those arriving approximately 15
(incisor) and 60
(molar) later.
Figure 8 presents the time-gated transmission spectra for the original incisor and molar models at blood concentrations of 5.0% and 0.5%, respectively. As before, pulp fillings with oxyhemoglobin, deoxyhemoglobin, and pus were examined.
Starting with the incisor model at a blood concentration of 5.0% (see
Figure 8a), the characteristic HbO
2 double dip between 500 nm and 600 nm is once again clearly visible, while in the Hb case, it disappears, and the transmission spectrum follows the spectral characteristics of deoxyhemoglobin absorption. In the pus case, the HbO
2 double dip that was still visible in the steady-state simulation (
Figure 3a), due to gingival absorption, is now suppressed by time-gating. However, it remains faintly detectable, as the chosen tolerance in time-gating still allows minor contributions from the more strongly absorbing gingiva. This is confirmed by the pulp path fraction of approximately 0.95. Examining the same incisor geometry with a reduced blood concentration of 0.5% (see
Figure 8c), the associated decrease in pulp absorption again leads to a convergence of the HbO
2 and Hb spectra. However, compared to
Figure 3c, no distinctly pronounced oxyhemoglobin double dip is observed in the Hb case, even though both curves, HbO
2 and Hb, exhibit a similar spectral shape. As previously seen in the pus case, it is likely that the curves are still slightly influenced by the much higher gingival absorption. To further reduce this effect, a combination with the previous approach, positioning the detector further from the gingiva margin, could be beneficial. It is also worth noting that fine-tuning of the time-gating could theoretically reduce the gingival influence to an arbitrary degree. Turning to the molar model with a blood concentration of 5.0% (see
Figure 8b), a substantial improvement in the differentiation of the different pulp fillings is observed compared to the steady-state simulation in
Figure 5a. Within the spectral range between 500 nm and 600 nm, the HbO
2 double dip is now more pronounced, while, as expected, it is absent in the Hb case. Across the remaining wavelength range, larger differences between the various transmission spectra are evident, which could potentially improve diagnostic differentiation. For a blood concentration of 0.5% (see
Figure 8d), a noticeable improvement compared to
Figure 5c is also observed. Once again, time-gating enhances the prominence of the HbO
2 double dips, and the differences between the curves are more pronounced throughout the spectrum, leading to improved differentiation between the different pulp fillings. In particular, the blood-filled cases again show pronounced differences around 435 nm, attributable to the small amount of blood present in the pulp. Additionally, in the pus case, the absorption characteristics become more distinct in both
Figure 8b and
Figure 8d. The absorption peaks at approximately 475 nm and 640 nm are now clearly visible in the transmission spectrum.


