


Segmentation of Low-Light Optical Coherence Tomography Angiography Images under the Constraints of Vascular Network Topology
 ,
,  , , , ,
  and
and
Abstract
1. Introduction
- We design the PrIS-TS module as part of BiSTIM. Deep topological structure supervision information and information interaction between different branches are utilized to enhance the topological structure information in the segmentation process to obtain the segmentation results.
- A subpath structure constraint (STA) module is developed to provide deep supervision signals to enhance the prior information in the segmentation structure.
- To mitigate imaging artifacts such as shadows and improve the clarity of OCTA images acquired under low-light conditions and various high-speed CMOS sensors, we introduce a bioluminescence-based technique.
- We collected 614 OCTA images from RVO and HCRVO. Experimental evaluation on two OCTA retinal vessel segmentation datasets, RVOS and OCTA-500, demonstrates the effectiveness of the proposed BiSTIM.
2. Related Works
2.1. Segmentation Methods in OCTA
2.2. Direction Segmentation Low-Light Scenes
3. Method
| Algorithm 1 Algorithm for OCTA image segmentation |
|
3.1. Proteomic-Inspired Topological Segmentation (PrIS-TS) Module
3.1.1. Directional Proteomic Pathway Sequencer
3.1.2. Genomic Signal Feature Interpreter
3.2. Bio-Luminescence Adaptation for Artifact Mitigation (BLAAM)
3.2.1. Luminescent Distribution Integration Module
3.2.2. Auto-Regulatory Calibrated Interface
4. Experiments and Results
4.1. Dataset and Metrics
- RVOS: This dataset includes 454 training images and 160 test images, with a mix of 140 HCRVO and 167 RVO images. The images were captured using high-speed CMOS to record the light-intensity signals reflected and scattered back by tissues at different depths. The inclusion of low-light condition images in RVOS makes it a valuable dataset for testing the robustness of our model in challenging imaging scenarios.
- OCTA-500: All 200 subjects (No. 10301-No. 10500) with SVP scans from the OCTA-500 dataset [30] were included in our experiments. The data were collected using a commercial 70 kHz SD-OCT (RTVue-XR, Optovue, Fremont, CA, USA). We used the maximum projection map between the internal limiting membrane (ILM) and the outer plexiform layer (OPL) because it was used for vessel delineations. We followed the same training, validation, and testing split as in [30] (No. 10301-10440 for training; No. 10441-10450 for validation; and No. 10451-10500 for testing).
- Recall, specificity, IoU, and Dice: ;
- Area under the ROC curve: AUC;
- Accuracy: ;
- Kappa score: ;
- False discovery rate: ;
- G-mean score: ;
- Dice coefficient: .
4.2. Implementation Details
4.3. Performance Comparison and Analysis
4.4. Ablation Studies
4.4.1. Effectiveness of STA Module
4.4.2. Effectiveness of BLAAM Module
5. Conclusions
Author Contributions
Funding
Institutional Review Board Statement
Informed Consent Statement
Data Availability Statement
Acknowledgments
Conflicts of Interest
Abbreviations
| OCTA | Optical coherence tomography angiography |
| BVO | Branch vein occlusion |
| SCP | Superficial capillary plexus |
| DCP | Deep capillary plexus |
| RVO | Retinal vein occlusion |
| HCRVO | Hemicentral retinal vein occlusion |
References
- Akil, H.; Huang, A.S.; Francis, B.A.; Sadda, S.R.; Chopra, V. Retinal vessel density from optical coherence tomography angiography to differentiate early glaucoma, pre-perimetric glaucoma and normal eyes. PLoS ONE 2017, 12, e0170476. [Google Scholar] [CrossRef]
- Zhao, Y.; Zheng, Y.; Liu, Y.; Yang, J.; Zhao, Y.; Chen, D.; Wang, Y. Intensity and compactness enabled saliency estimation for leakage detection in diabetic and malarial retinopathy. IEEE Trans. Med. Imaging 2016, 36, 51–63. [Google Scholar] [CrossRef]
- Carnevali, A.; Mastropasqua, R.; Gatti, V.; Vaccaro, S.; Mancini, A.; D’aloisio, R.; Lupidi, M.; Cerquaglia, A.; Sacconi, R.; Borrelli, E.; et al. Optical coherence tomography angiography in intermediate and late age-related macular degeneration: Review of current technical aspects and applications. Appl. Sci. 2020, 10, 8865. [Google Scholar] [CrossRef]
- López-Cuenca, I.; Salobrar-García, E.; Gil-Salgado, I.; Sánchez-Puebla, L.; Elvira-Hurtado, L.; Fernández-Albarral, J.A.; Ramírez-Toraño, F.; Barabash, A.; de Frutos-Lucas, J.; Salazar, J.J.; et al. Characterization of Retinal Drusen in Subjects at High Genetic Risk of Developing Sporadic Alzheimer’s Disease: An Exploratory Analysis. J. Pers. Med. 2022, 12, 847. [Google Scholar] [CrossRef]
- Li, Y.; Wang, X.; Zhang, Y.; Zhang, P.; He, C.; Li, R.; Wang, L.; Zhang, H.; Zhang, Y. Retinal microvascular impairment in Parkinson’s disease with cognitive dysfunction. Park. Relat. Disord. 2022, 98, 27–31. [Google Scholar] [CrossRef]
- López-Cuenca, I.; Salobrar-García, E.; Elvira-Hurtado, L.; Fernández-Albarral, J.; Sánchez-Puebla, L.; Salazar, J.; Ramírez, J.; Ramírez, A.; de Hoz, R. The Value of OCT and OCTA as Potential Biomarkers for Preclinical Alzheimer’s Disease: A Review Study. Life 2021, 11, 712. [Google Scholar] [CrossRef] [PubMed]
- Chalkias, E.; Chalkias, I.-N.; Bakirtzis, C.; Messinis, L.; Nasios, G.; Ioannidis, P.; Pirounides, D. Differentiating Degenerative from Vascular Dementia with the Help of Optical Coherence Tomography Angiography Biomarkers. Healthcare 2022, 10, 539. [Google Scholar] [PubMed]
- Asanad, S.; Mohammed, I.S.K.; Sadun, A.; Saeedi, O. OCTA in neurodegenerative optic neuropathies: Emerging biomarkers at the eye–brain interface. Ther. Adv. Ophthalmol. 2020, 12, 2515841420950508. [Google Scholar] [CrossRef] [PubMed]
- López-Cuenca, I.; Salobrar-García, E.; Sánchez-Puebla, L.; Espejel, E.; García del Arco, L.; Rojas, P.; Elvira-Hurtado, L.; Fernández-Albarral, J.; Ramírez-Toraño, F.; Barabash, A.; et al. Retinal Vascular Study Using OCTA in Subjects at High Genetic Risk of Developing Alzheimer’s Disease and Cardiovascular Risk Factors. J. Clin. Med. 2022, 11, 3248. [Google Scholar] [CrossRef] [PubMed]
- Prentašic, P.; Heisler, M.; Mammo, Z.; Lee, S.; Merkur, A.; Navajas, E.; Beg, M.F.; Šarunic, M.; Loncaric, S. Segmentation of the foveal microvasculature using deep learning networks. J. Biomed. Opt. 2016, 21, 075008. [Google Scholar] [CrossRef] [PubMed]
- Ronneberger, O.; Fischer, P.; Brox, T. U-Net: Convolutional Networks for Biomedical Image Segmentation. In Proceedings of the International Conference on Medical Image Computing and Computer-Assisted Intervention, Munich, Germany, 5–9 October 2015; pp. 234–241. [Google Scholar]
- Mou, L.; Zhao, Y.; Fu, H.; Liu, Y.; Cheng, J.; Zheng, Y.; Su, P.; Yang, J.; Chen, L.; Frangi, A.F.; et al. CS2-Net: Deep learning segmentation of curvilinear structures in medical imaging. Med. Image Anal. 2021, 67, 101874. [Google Scholar] [CrossRef]
- Mou, L.; Zhao, Y.; Chen, L.; Cheng, J.; Gu, Z.; Hao, H.; Qi, H.; Zheng, Y.; Frangi, A.; Liu, J. CS-Net: Channel and spatial attention network for curvilinear structure segmentation. In Proceedings of the International Conference on Medical Image Computing and Computer-Assisted Intervention, Shenzhen, China, 13–17 October 2019; pp. 721–730. [Google Scholar]
- Li, M.; Chen, Y.; Ji, Z.; Xie, K.; Yuan, S.; Chen, Q.; Li, S. Image projection network: 3D to 2D image segmentation in OCTA images. IEEE Trans. Med. Imag. 2020, 39, 3343–3354. [Google Scholar] [CrossRef]
- Hu, D.; Cui, C.; Li, H.; Larson, K.E.; Tao, Y.K.; Oguz, I. Life: A generalizable autodidactic pipeline for 3D OCT-A vessel segmentation. In Proceedings of the International Conference on Medical Image Computing and Computer-Assisted Intervention, Strasbourg, France, 27 September–1 October 2021; Springer: Cham, Switzerland, 2021; pp. 514–524. [Google Scholar]
- Yu, S.; Xie, J.; Hao, J.; Zheng, Y.; Zhang, J.; Hu, Y.; Liu, J.; Zhao, Y. 3D vessel reconstruction in OCT-angiography via depth map estimation. In Proceedings of the 2021 IEEE 18th International Symposium on Biomedical Imaging (ISBI), Nice, France, 13–16 April 2021; pp. 1609–1613. [Google Scholar]
- Giarratano, Y.; Bianchi, E.; Gray, C.; Morris, A.; MacGillivray, T.; Dhillon, B.; Bernabeu, M.O. Automated segmentation of optical coherence tomography angiography images: Benchmark data and clinically relevant metrics. Transl. Vis. Sci. Technol. 2020, 9, 5. [Google Scholar] [CrossRef]
- Ma, Y.; Hao, H.; Xie, J.; Fu, H.; Zhang, J.; Yang, J.; Wang, Z.; Liu, J.; Zheng, Y.; Zhao, Y. Rose: A retinal oct-angiography vessel segmentation dataset and new model. IEEE Trans. Med. Imag. 2020, 40, 928–939. [Google Scholar] [CrossRef]
- Lee, Y.-C.; Yeung, L. Svs-net: A novel semantic segmentation network in optical coherence tomography angiography images. arXiv 2021, arXiv:2104.07083. [Google Scholar]
- Chen, W.; Wang, W.; Yang, W.; Liu, J. Deep retinex decomposition for low-light enhancement. In Proceedings of the British Machine Vision Conference, Newcastle, UK, 3–6 September 2018; pp. 1–12. [Google Scholar]
- Zhang, Y.; Guo, X.; Ma, J.; Liu, W.; Zhang, J. Beyond brightening low-light images. Int. J. Comput. Vis. 2021, 129, 1013–1037. [Google Scholar] [CrossRef]
- Wang, R.; Zhang, Q.; Fu, C.W.; Shen, X.; Zheng, W.S.; Jia, J. Underexposed photo enhancement using deep illumination estimation. In Proceedings of the IEEE Conference on Computer Vision and Pattern Recognition, Long Beach, CA, USA, 16–20 June 2019; pp. 6849–6857. [Google Scholar]
- Yang, W.; Wang, S.; Fang, Y.; Wang, Y.; Liu, J. From fidelity to perceptual quality: A semi-supervised approach for low-light image enhancement. In Proceedings of the IEEE Conference on Computer Vision and Pattern Recognition, Seattle, WA, USA, 13–19 June 2020; pp. 3063–3072. [Google Scholar]
- Jiang, Y.; Gong, X.; Liu, D.; Cheng, Y.; Fang, C.; Shen, X.; Yang, J.; Zhou, P.; Wang, Z. Enlightengan: Deep light enhancement without paired supervision. IEEE Trans. Image Process. 2021, 30, 2340–2349. [Google Scholar] [CrossRef]
- Zhang, Y.; Di, X.; Zhang, B.; Wang, C. Self-supervised image enhancement network: Training with low light images only. arXiv 2020, arXiv:2002.11300. [Google Scholar]
- Guo, C.; Li, C.; Guo, J.; Loy, C.C.; Hou, J.; Kwong, S.; Cong, R. Zero-reference deep curve estimation for low-light image enhancement. In Proceedings of the IEEE/CVF Conference on Computer Vision and Pattern Recognition (CVPR), Virtual, 14–19 June 2020; pp. 1780–1789. [Google Scholar]
- Liu, R.; Ma, L.; Zhang, J.; Fan, X.; Luo, Z. Retinex-inspired unrolling with cooperative prior architecture search for low-light image enhancement. In Proceedings of the IEEE Conference on Computer Vision and Pattern Recognition, Virtual, 19–25 June 2021; pp. 10561–10570. [Google Scholar]
- Guo, X.; Li, Y.; Ling, H. Lime: Low-light image enhancement via illumination map estimation. IEEE Trans. Image Process. 2017, 26, 982–993. [Google Scholar] [CrossRef] [PubMed]
- Huang, X.; Li, Z.; Lou, L.; Dan, R.; Chen, L.; Zeng, G.; Jia, G.; Chen, X.; Jin, Q.; Ye, J.; et al. GOMPS: Global Attention-Based Ophthalmic Image Measurement and Postoperative Appearance Prediction System. Expert Syst. Appl. 2023, 232, 120812. [Google Scholar] [CrossRef]
- Li, M.; Huang, K.; Xu, Q.; Yang, J.; Zhang, Y.; Ji, Z.; Xie, K.; Yuan, S.; Liu, Q.; Chen, Q. OCTA-500: A Retinal Dataset for Optical Coherence Tomography Angiography Study. arXiv 2020, arXiv:2012.07261. [Google Scholar] [CrossRef]
- Alom, M.Z.; Yakopcic, C.; Hasan, M.; Taha, T.M.; Asari, V.K. Recurrent Residual U-Net for Medical Image Segmentation. J. Med. Imaging 2019, 6, 014006. [Google Scholar] [CrossRef] [PubMed]
- Schlemper, J.; Oktay, O.; Schaap, M.; Heinrich, M.; Kainz, B.; Glocker, B.; Rueckert, D. Attention Gated Networks: Learning to Leverage Salient Regions in Medical Images. Med. Image Anal. 2019, 53, 197–207. [Google Scholar] [CrossRef]
- Woo, S.; Park, J.; Lee, J.-Y.; Kweon, I.S. CBAM: Convolutional Block Attention Module. In Proceedings of the European Conference on Computer Vision, Munich, Germany, 8–14 September 2018; pp. 3–19. [Google Scholar]
- Wang, X.; Yang, S.; Tang, M.; Wei, Y.; Han, X.; He, L.; Zhang, J. SK-Unet: An Improved U-net Model with Selective Kernel for the Segmentation of Multi-sequence Cardiac MR. In Proceedings of the International Workshop on Statistical Atlases and Computational Models of the Heart, Shenzhen, China, 13 October 2019; Springer: Cham, Switzerland, 2020; pp. 246–253. [Google Scholar]
- Badrinarayanan, V.; Kendall, A.; Cipolla, R. SegNet: A Deep Convolutional Encoder-Decoder Architecture for Image Segmentation. IEEE Trans. Pattern Anal. Mach. Intell. 2017, 39, 2481–2495. [Google Scholar] [CrossRef] [PubMed]
- Paszke, A.; Chaurasia, A.; Kim, S.; Culurciello, E. ENet: A Deep Neural Network Architecture for Real-Time Semantic Segmentation. arXiv 2016, arXiv:1606.02147. [Google Scholar]
- Zhao, H.; Shi, J.; Qi, X.; Wang, X.; Jia, J. Pyramid Scene Parsing Network. In Proceedings of the IEEE Conference on Computer Vision and Pattern Recognition, Honolulu, HI, USA, 22–25 July 2017; pp. 2881–2890. [Google Scholar]
- Chen, L.-C.; Zhu, Y.; Papandreou, G.; Schroff, F.; Adam, H. Encoder-Decoder with Atrous Separable Convolution for Semantic Image Segmentation. In Proceedings of the European Conference on Computer Vision, Munich, Germany, 8–14 September 2018; pp. 801–818. [Google Scholar]
- Peng, C.; Zhang, X.; Yu, G.; Luo, G.; Sun, J. Large Kernel Matters–Improve Semantic Segmentation by Global Convolutional Network. In Proceedings of the IEEE Conference on Computer Vision and Pattern Recognition, Honolulu, HI, USA, 22–25 July 2017; pp. 4353–4361. [Google Scholar]
- Zhou, Z.; Siddiquee, M.M.R.; Tajbakhsh, N.; Liang, J. UNet++: A Nested U-Net Architecture for Medical Image Segmentation. In Proceedings of the International Workshop on Deep Learning in Medical Image Analysis and Multimodal Learning for Clinical Decision Support, Granada, Spain, 20 September 2018. [Google Scholar]
- Huang, H.; Lin, L.; Tong, R.; Hu, H.; Zhang, Q.; Iwamoto, Y.; Han, X.; Chen, Y.-W.; Wu, J. UNet 3+: A Full-Scale Connected UNet for Medical Image Segmentation. In Proceedings of the ICASSP 2020—2020 IEEE International Conference on Acoustics, Speech and Signal Processing (ICASSP), Barcelona, Spain, 4–8 May 2020; pp. 1055–1059. [Google Scholar]
- Xiao, L.; Liu, B.; Zhang, H.; Gu, J.; Fu, T.; Asseng, S.; Liu, L.; Tang, L.; Cao, W.; Zhu, Y. Modeling the response of winter wheat phenology to low temperature stress at elongation and booting stages. Agric. For. Meteorol. 2021, 303, 108376. [Google Scholar] [CrossRef]
- Wang, L.; Shi, Y.; Liu, M.; Zhang, A.; Hong, Y.-L.; Li, R.; Gao, Q.; Chen, M.; Ren, W.; Cheng, H.-M.; et al. Intercalated architecture of MA2Z4 family layered van der Waals materials with emerging topological, magnetic and superconducting properties. Nat. Commun. 2021, 12, 2361. [Google Scholar] [CrossRef]
- Zuo, Q.; Chen, S.; Wang, Z. R2AU-Net: Attention Recurrent Residual Convolutional Neural Network for Multimodal Medical Image Segmentation. Secur. Commun. Netw. 2021, 2021, 6625688. [Google Scholar] [CrossRef]
- Dai, Y.; Gieseke, F.; Oehmcke, S.; Wu, Y.; Barnard, K. Attentional Feature Fusion. In Proceedings of the IEEE Winter Conference on Applications of Computer Vision, WACV 2021, Waikoloa, HI, USA, 3–8 January 2021. [Google Scholar]


| OCTA-3M | RVOS | |
|---|---|---|
| Number | 200 | 614 |
| Resolution | ||
| Image type | SVC | SVC, DVC |
| Annotation | pixel level | pixel level |
| Disease type | - | RVO, HCRVO |
| Module | Pathway Sequencer | STA Module | Feature Interpreter | Decoder | BLAAM Module |
| Time (µs) | 0.3576 | 0.9537 | 0.4174 | 0.4768 | 0.7153 |
| Model | Recall | Specificity | Accuracy | IoU | Dice | Kappa | GMEAN |
|---|---|---|---|---|---|---|---|
| U-Net [11] | 0.75383 | 0.99016 | 0.87466 | 0.74629 | 0.85293 | 0.74474 | 0.86294 |
| U-Net + AG [44] | 0.77178 | 0.98480 | 0.88394 | 0.75916 | 0.86178 | 0.76168 | 0.87097 |
| SegNet [35] | 0.81311 | 0.80561 | 0.80959 | 0.56305 | 0.72010 | 0.57808 | 0.80728 |
| R2U-Net [31] | 0.70778 | 0.90013 | 0.80622 | 0.62920 | 0.77141 | 0.60290 | 0.79595 |
| DeepLabv3+ [38] | 0.66382 | 0.84648 | 0.76596 | 0.56371 | 0.71964 | 0.51783 | 0.74807 |
| PSPNet [37] | 0.48245 | 0.83922 | 0.58582 | 0.42958 | 0.59870 | 0.20680 | 0.63495 |
| ENet [36] | 0.79958 | 0.88435 | 0.85193 | 0.67881 | 0.80759 | 0.68453 | 0.84009 |
| GCN [39] | 0.66387 | 0.79017 | 0.74454 | 0.50129 | 0.66640 | 0.45591 | 0.72311 |
| UNet3+ [41] | 0.89195 | 0.90247 | 0.90022 | 0.76309 | 0.86497 | 0.78515 | 0.89590 |
| IPN+ [43] | 0.89606 | 0.89936 | 0.89969 | 0.76105 | 0.86364 | 0.78370 | 0.89644 |
| UNet++ [40] | 0.77575 | 0.98719 | 0.8874 | 0.76483 | 0.86476 | 0.76878 | 0.87392 |
| Frago [42] | 0.87397 | 0.92738 | 0.90814 | 0.78399 | 0.87819 | 0.80362 | 0.89866 |
| BiSTIM | 0.86386 | 0.94036 | 0.91118 | 0.79581 | 0.88580 | 0.81138 | 0.91074 |
| Model | Recall | Specificity | Accuracy | IoU | Dice |
|---|---|---|---|---|---|
| U-Net | 0.74875 | 0.99026 | 0.87390 | 0.74125 | 0.84943 |
| U-Net + AG | 0.76458 | 0.98594 | 0.88210 | 0.75286 | 0.85742 |
| Unet++ | 0.88648 | 0.91008 | 0.90374 | 0.76794 | 0.86794 |
| Frago | 0.76900 | 0.98774 | 0.88600 | 0.75857 | 0.86046 |
| BiSTIM | 0.86097 | 0.94443 | 0.91317 | 0.79707 | 0.88650 |
| Fusion Method | Recall | Specificity | Accuracy | IoU | Dice |
|---|---|---|---|---|---|
| Cat | 0.77179 | 0.88067 | 0.83769 | 0.66154 | 0.79517 |
| AFF [45] | 0.82319 | 0.95276 | 0.89857 | 0.77399 | 0.87077 |
| STA | 0.86386 | 0.94036 | 0.91118 | 0.79581 | 0.88580 |
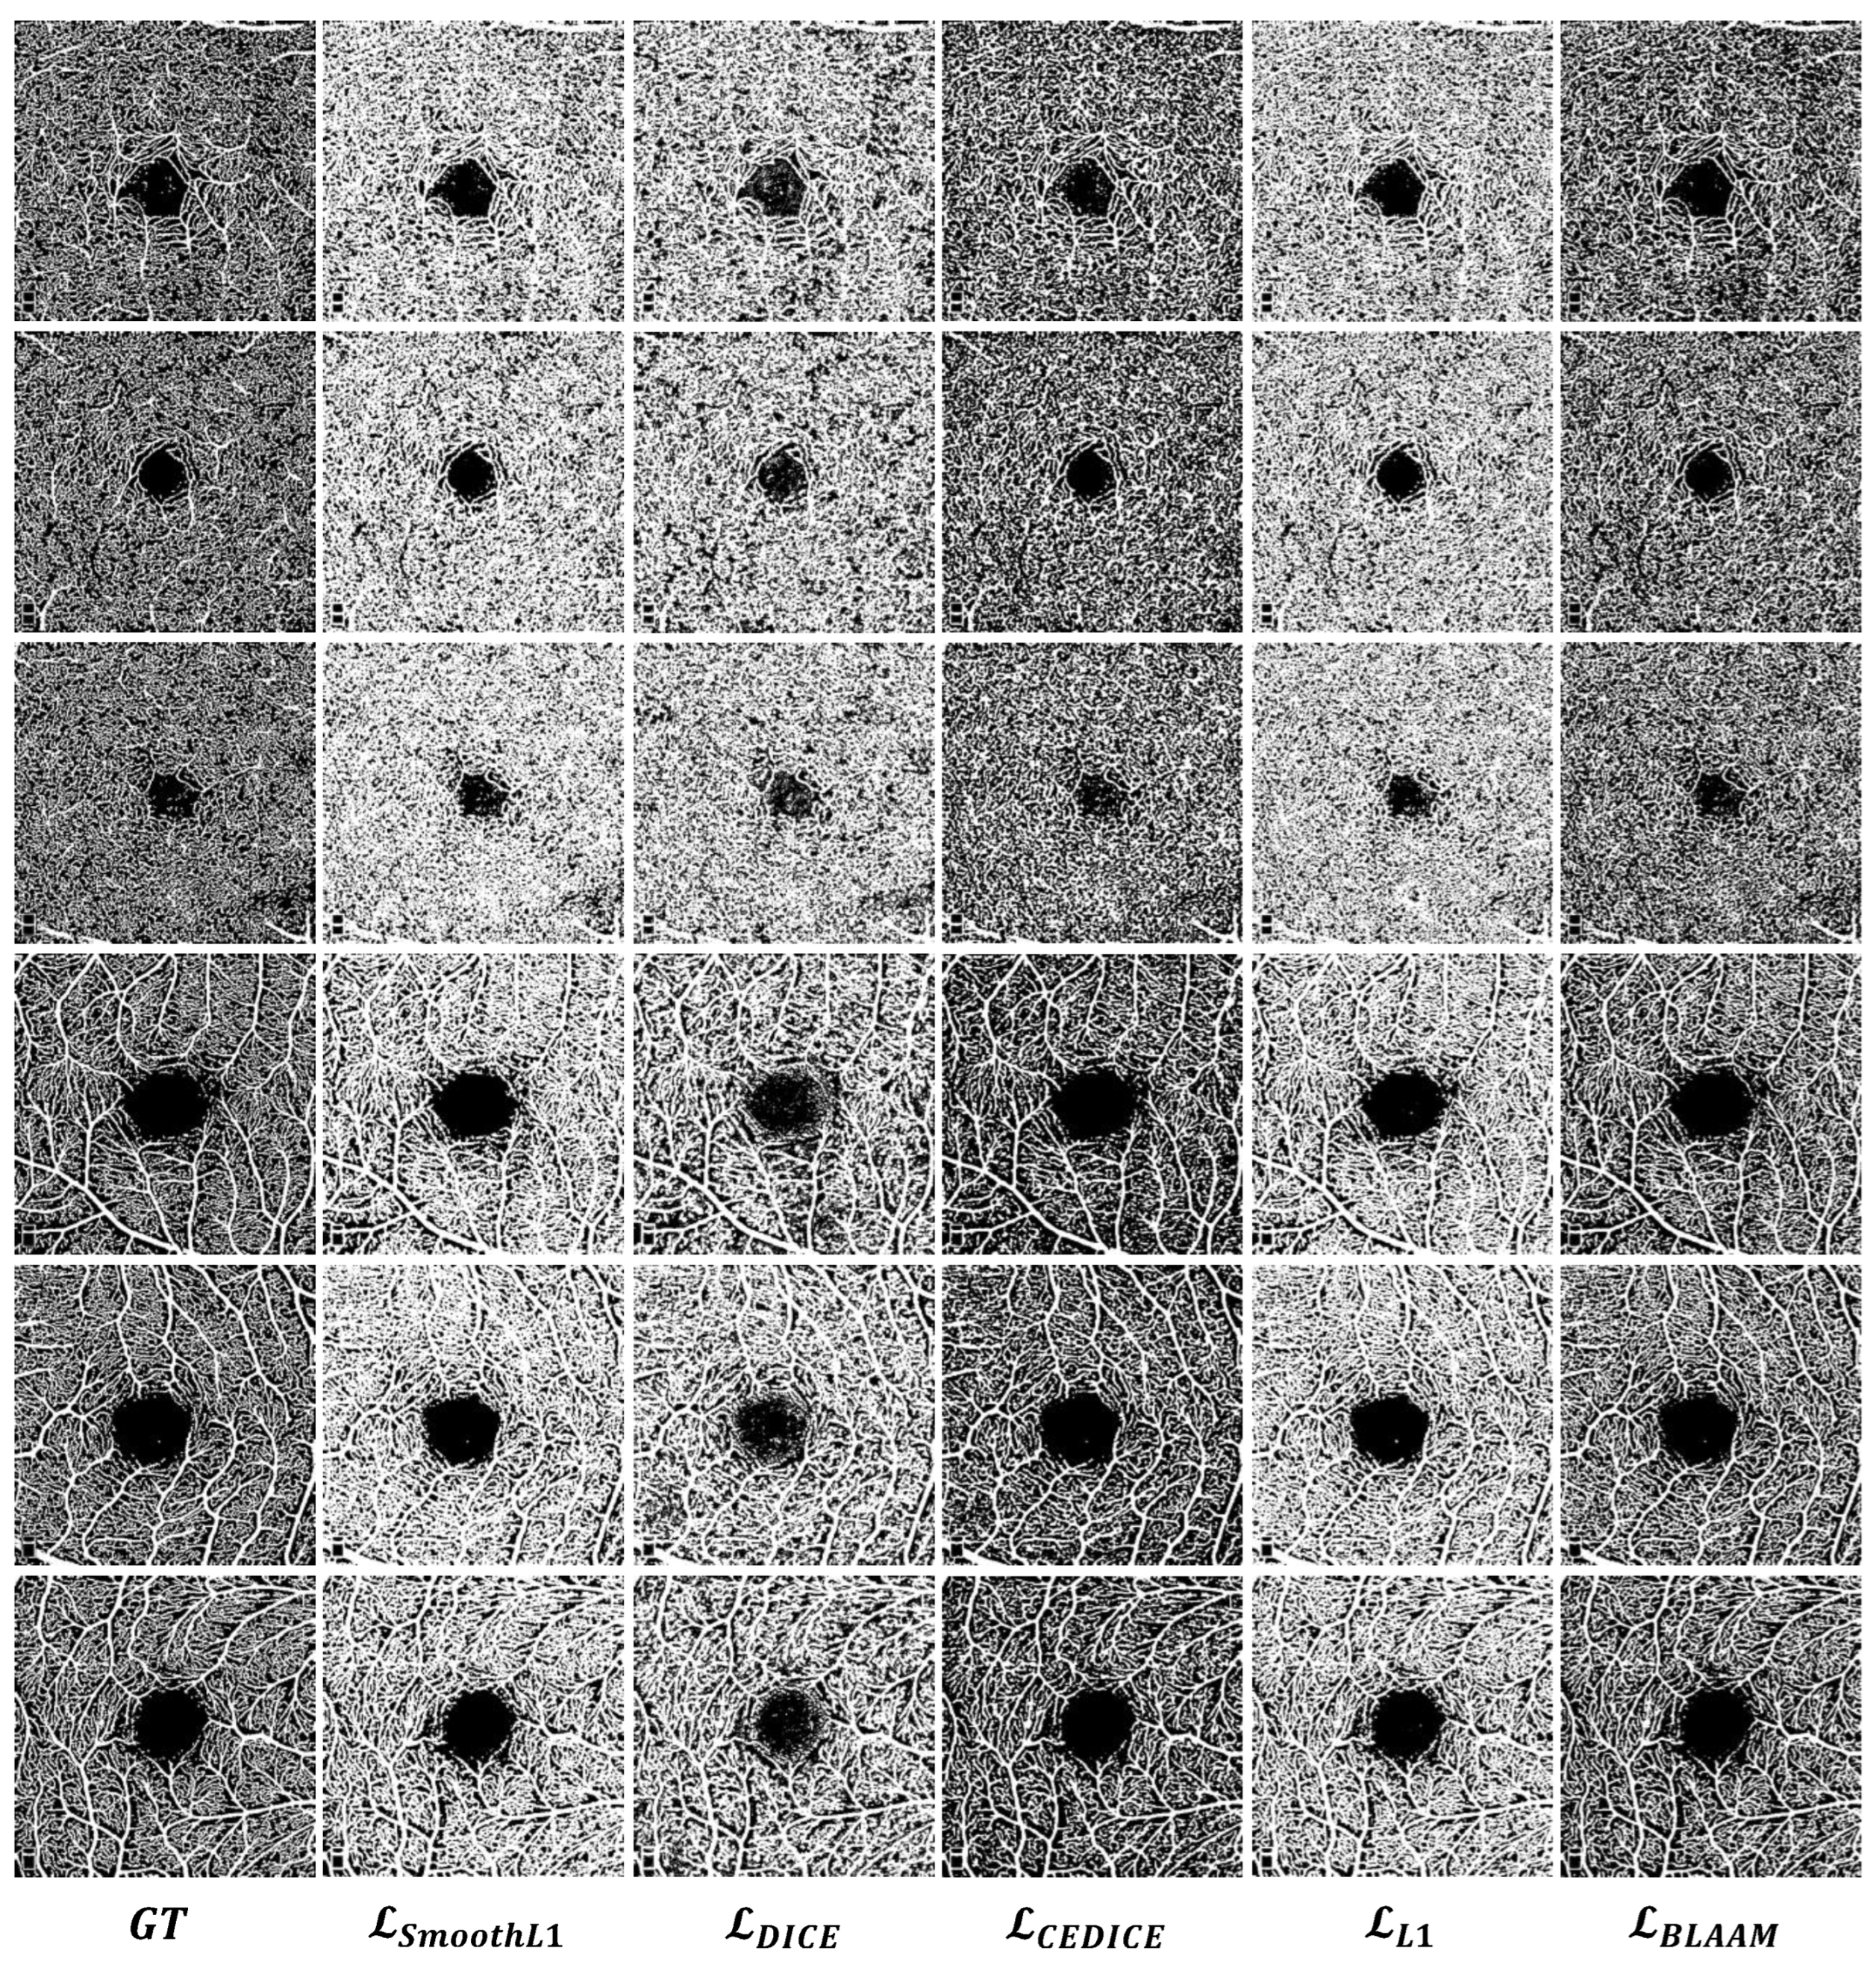
| Loss | Recall | Specificity | Accuracy | IoU | Dice |
|---|---|---|---|---|---|
| 0.44308 | 0.99987 | 0.50747 | 0.44307 | 0.61177 | |
| 0.72692 | 0.92355 | 0.82637 | 0.66887 | 0.80044 | |
| 0.84813 | 0.92515 | 0.89541 | 0.76264 | 0.86457 | |
| 0.75383 | 0.99016 | 0.87466 | 0.74629 | 0.85293 | |
| 0.86386 | 0.94036 | 0.91118 | 0.79581 | 0.88580 |
Disclaimer/Publisher’s Note: The statements, opinions and data contained in all publications are solely those of the individual author(s) and contributor(s) and not of MDPI and/or the editor(s). MDPI and/or the editor(s) disclaim responsibility for any injury to people or property resulting from any ideas, methods, instructions or products referred to in the content. |
© 2024 by the authors. Licensee MDPI, Basel, Switzerland. This article is an open access article distributed under the terms and conditions of the Creative Commons Attribution (CC BY) license (https://creativecommons.org/licenses/by/4.0/).
Share and Cite
Li, Z.; Huang, G.; Zou, B.; Chen, W.; Zhang, T.; Xu, Z.; Cai, K.; Wang, T.; Sun, Y.; Wang, Y.; et al. Segmentation of Low-Light Optical Coherence Tomography Angiography Images under the Constraints of Vascular Network Topology. Sensors 2024, 24, 774. https://doi.org/10.3390/s24030774
Li Z, Huang G, Zou B, Chen W, Zhang T, Xu Z, Cai K, Wang T, Sun Y, Wang Y, et al. Segmentation of Low-Light Optical Coherence Tomography Angiography Images under the Constraints of Vascular Network Topology. Sensors. 2024; 24(3):774. https://doi.org/10.3390/s24030774
Chicago/Turabian StyleLi, Zhi, Gaopeng Huang, Binfeng Zou, Wenhao Chen, Tianyun Zhang, Zhaoyang Xu, Kunyan Cai, Tingyu Wang, Yaoqi Sun, Yaqi Wang, and et al. 2024. "Segmentation of Low-Light Optical Coherence Tomography Angiography Images under the Constraints of Vascular Network Topology" Sensors 24, no. 3: 774. https://doi.org/10.3390/s24030774
APA StyleLi, Z., Huang, G., Zou, B., Chen, W., Zhang, T., Xu, Z., Cai, K., Wang, T., Sun, Y., Wang, Y., Jin, K., & Huang, X. (2024). Segmentation of Low-Light Optical Coherence Tomography Angiography Images under the Constraints of Vascular Network Topology. Sensors, 24(3), 774. https://doi.org/10.3390/s24030774