
Light-Emitting Diode Array with Optical Linear Detector Enables High-Throughput Differential Single-Cell Dielectrophoretic Analysis

 , ,
, ,  and
and
Abstract
1. Introduction
Predictions of Dielectric Changes in Cells Due to Disease States or Environmental Stress
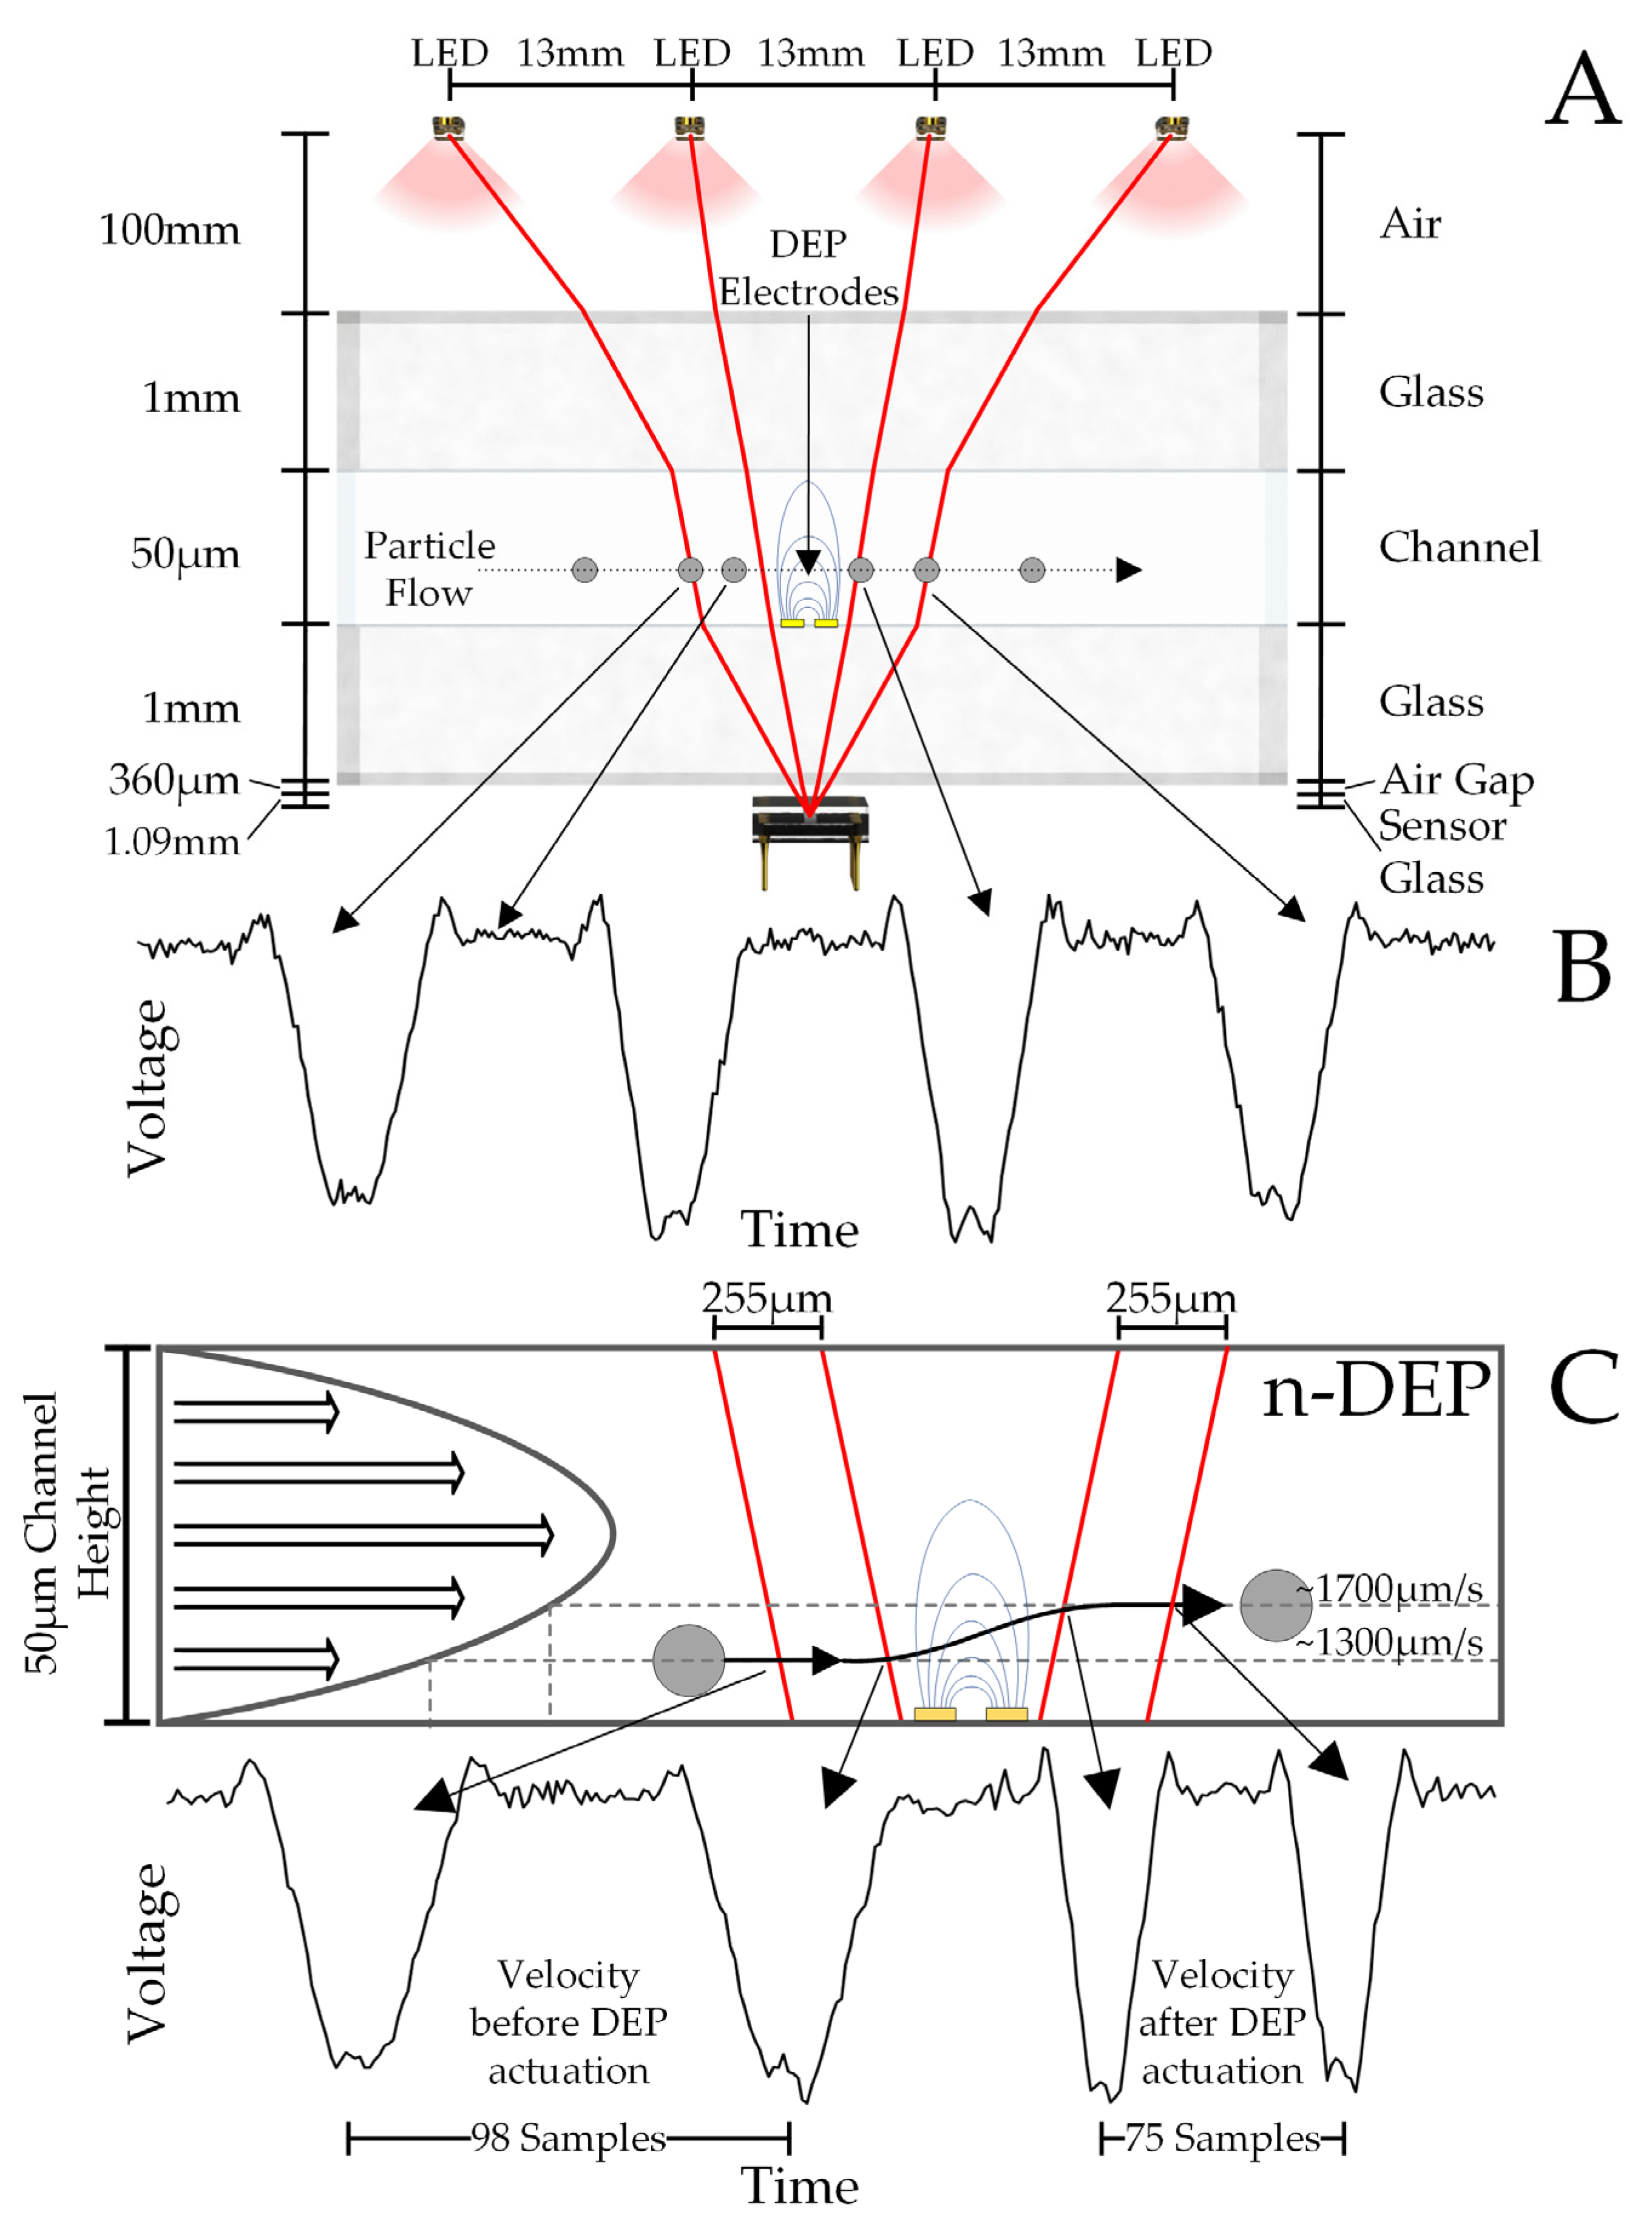
2. Materials and Methods
Cell Preparation
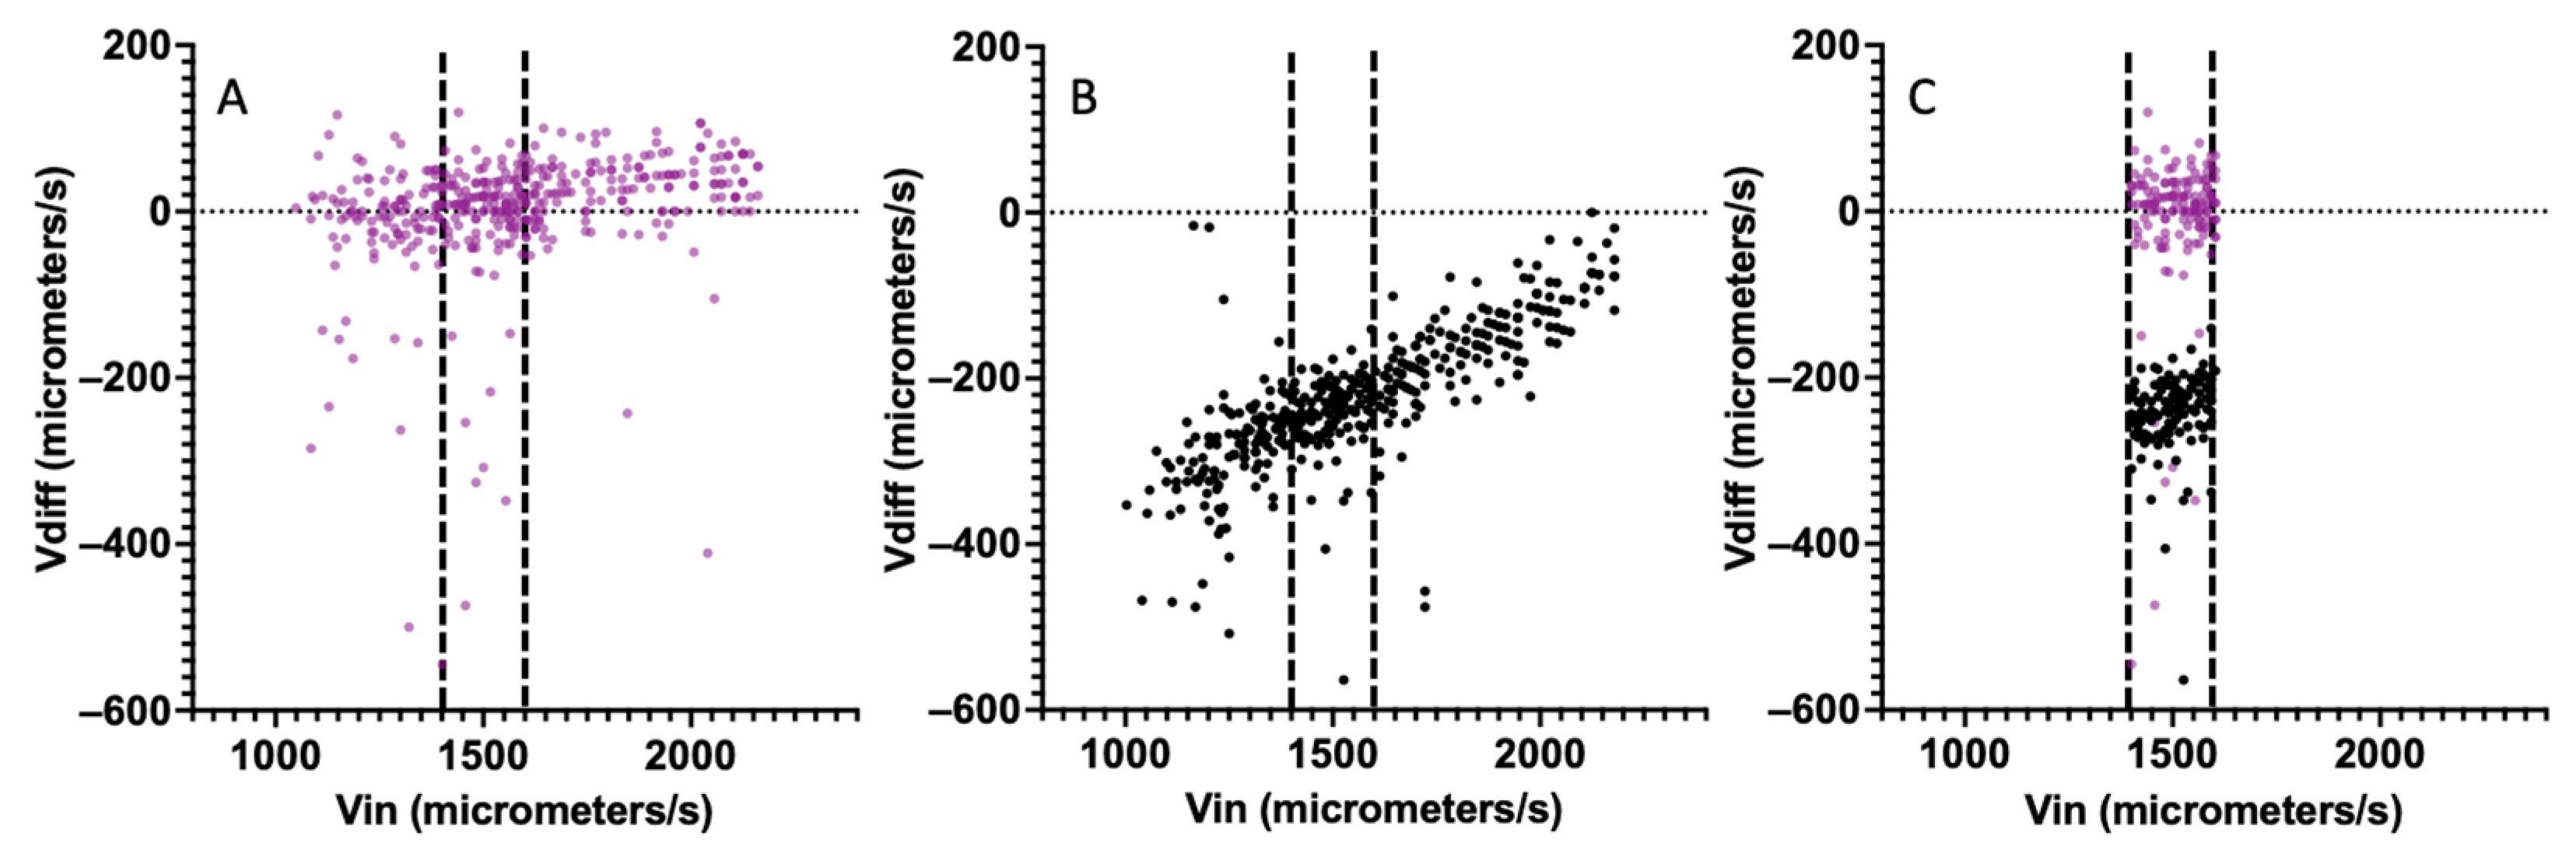
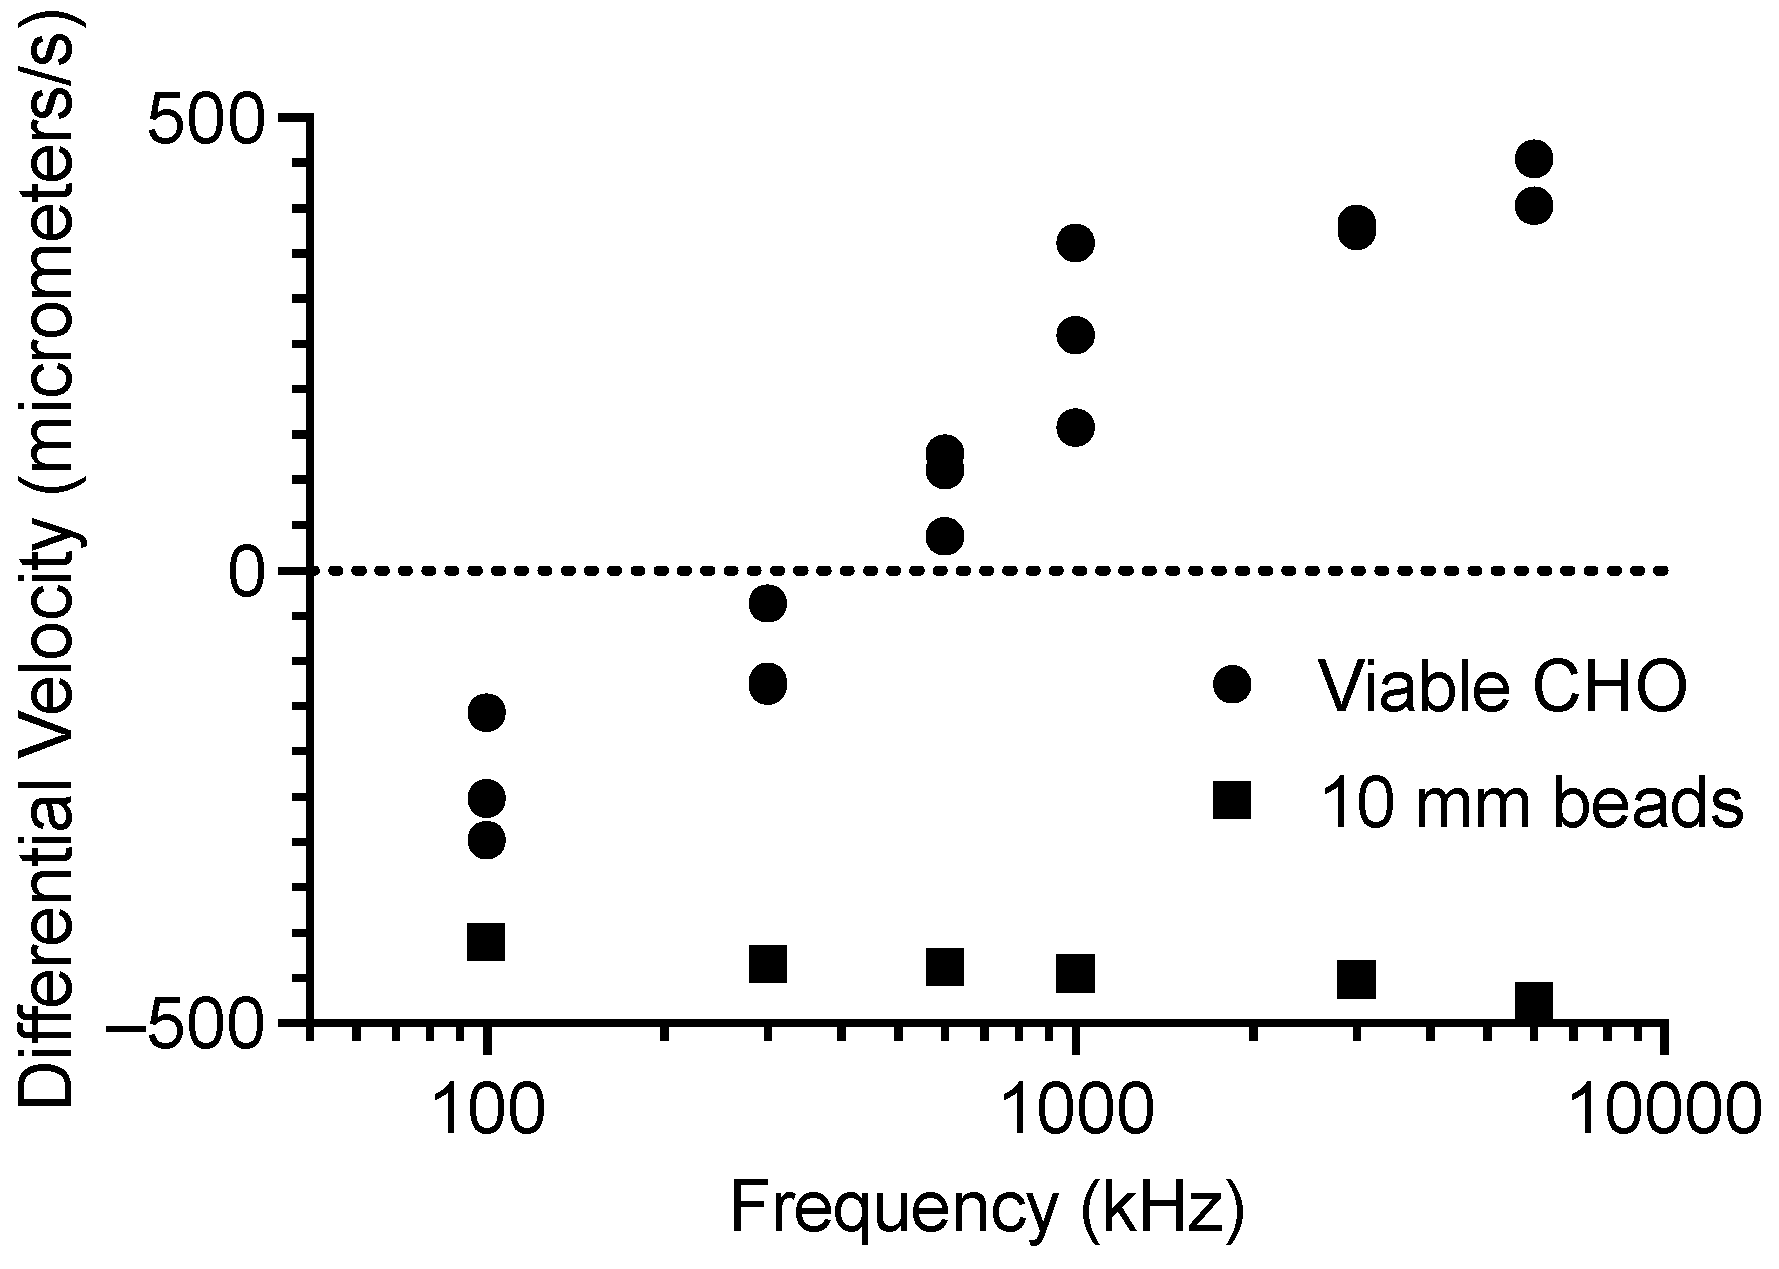
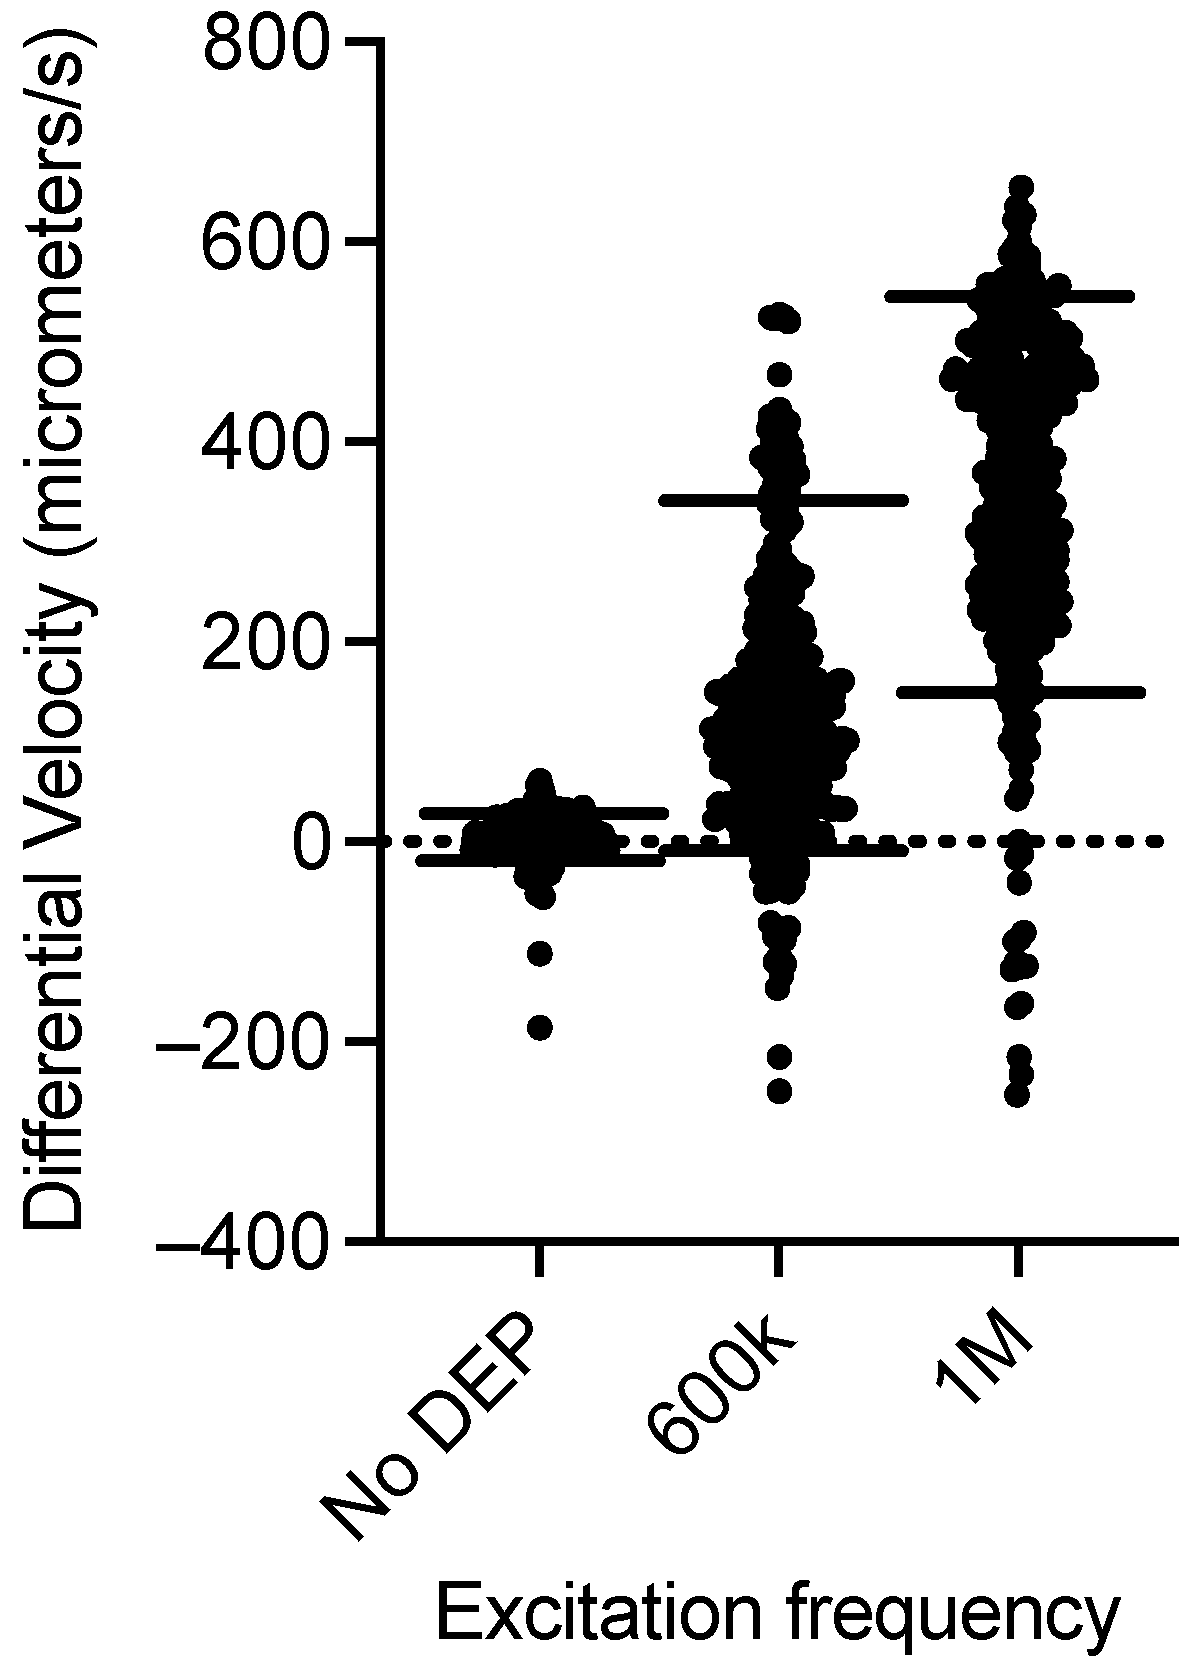
3. Results
CHO Single-Cell Dielectrophoretic Analysis
4. Discussion
5. Conclusions
Author Contributions
Funding
Institutional Review Board Statement
Informed Consent Statement
Data Availability Statement
Conflicts of Interest
References
- Elitas, M.; Yildizhan, Y.; Islam, M.; Martinez-Duarte, R.; Ozkazanc, D. Dielectrophoretic characterization and separation of monocytes and macrophages using 3D carbon-electrodes. Electrophoresis 2019, 40, 315–321. [Google Scholar] [CrossRef] [PubMed]
- Liu, J.; Qiang, Y.; Du, E. Dielectric spectroscopy of red blood cells in sickle cell disease. Electrophoresis 2021, 42, 667–675. [Google Scholar] [CrossRef]
- Di Trapani, M.; Manaresi, N.; Medoro, G. DEPArrayTM system: An automatic image-based sorter for isolation of pure circulating tumor cells. Cytom. Part A 2018, 93, 1260–1266. [Google Scholar] [CrossRef]
- O’Shannessy, D.J.; Davis, D.W.; Anderes, K.; Somers, E.B. Isolation of Circulating Tumor Cells from Multiple Epithelial Cancers with ApoStream® for Detecting (or Monitoring) the Expression of Folate Receptor Alpha. Biomark. Insights 2016, 11, 7–18. [Google Scholar] [CrossRef]
- Coley, H.M.; Labeed, F.H.; Thomas, H.; Hughes, M.P. Biophysical characterization of MDR breast cancer cell lines reveals the cytoplasm is critical in determining drug sensitivity. Biochim. Biophys. Acta Gen. Subj. 2007, 1770, 601–608. [Google Scholar] [CrossRef]
- Broche, L.M.; Bhadal, N.; Lewis, M.P.; Porter, S.; Hughes, M.P.; Labeed, F.H. Early detection of oral cancer—Is dielectrophoresis the answer? Oral Oncol. 2007, 43, 199–203. [Google Scholar] [CrossRef]
- Çağlayan, Z.; Demircan Yalçın, Y.; Külah, H. Examination of the dielectrophoretic spectra of MCF7 breast cancer cells and leukocytes. Electrophoresis 2020, 41, 345–352. [Google Scholar] [CrossRef]
- Douglas, T.A.; Cemazar, J.; Balani, N.; Sweeney, D.C.; Schmelz, E.M.; Davalos, R.V. A feasibility study for enrichment of highly aggressive cancer subpopulations by their biophysical properties via dielectrophoresis enhanced with synergistic fluid flow. Electrophoresis 2017, 38, 1507–1514. [Google Scholar] [CrossRef]
- Abd Rahman, N.; Ibrahim, F.; Yafouz, B. Dielectrophoresis for Biomedical Sciences Applications: A Review. Sensors 2017, 17, 449. [Google Scholar] [CrossRef]
- Bulfoni, M.; Gerratana, L.; Del Ben, F.; Marzinotto, S.; Sorrentino, M.; Turetta, M.; Scoles, G.; Toffoletto, B.; Isola, M.; Beltrami, C.A.; et al. In patients with metastatic breast cancer the identification of circulating tumor cells in epithelial-to-mesenchymal transition is associated with a poor prognosis. Breast Cancer Res. 2016, 18, 30. [Google Scholar] [CrossRef]
- Adams, T.N.G.; Turner, P.A.; Janorkar, A.V.; Zhao, F.; Minerick, A.R. Characterizing the dielectric properties of human mesenchymal stem cells and the effects of charged elastin-like polypeptide copolymer treatment. Biomicrofluidics 2014, 8, 054109. [Google Scholar] [CrossRef] [PubMed]
- Flanagan, L.A.; Lu, J.; Wang, L.; Marchenko, S.A.; Jeon, N.L.; Lee, A.P.; Monuki, E.S. Unique dielectric properties distinguish stem cells and their differentiated progeny. Stem Cells 2008, 26, 656–665. [Google Scholar] [CrossRef] [PubMed]
- Song, H.; Rosano, J.M.; Wang, Y.; Garson, C.J.; Prabhakarpandian, B.; Pant, K.; Klarmann, G.J.; Perantoni, A.; Alvarez, L.M.; Lai, E. Continuous-flow sorting of stem cells and differentiation products based on dielectrophoresis. Lab A Chip 2015, 15, 1320–1328. [Google Scholar] [CrossRef]
- Stephens, M.; Talary, M.; Pethig, R.; Burnett, A.; Mills, K. The dielectrophoresis enrichment of CD34(+) cells from peripheral blood stem cell harvests. Bone Marrow Transplant. 1996, 18, 777–782. [Google Scholar]
- Yoshioka, J.; Ohsugi, Y.; Yoshitomi, T.; Yasukawa, T.; Sasaki, N.; Yoshimoto, K. Label-Free Rapid Separation and Enrichment of Bone Marrow-Derived Mesenchymal Stem Cells from a Heterogeneous Cell Mixture Using a Dielectrophoresis Device. Sensors 2018, 18, 3007. [Google Scholar] [CrossRef]
- Mulhall, H.J.; Cardnell, A.; Hoettges, K.F.; Labeed, F.H.; Hughes, M.P. Apoptosis progression studied using parallel dielectrophoresis electrophysiological analysis and flow cytometry. Integr. Biol. 2015, 7, 1396–1401. [Google Scholar] [CrossRef]
- Henslee, E.A.; Torcal Serrano, R.M.; Labeed, F.H.; Jabr, R.I.; Fry, C.H.; Hughes, M.P.; Hoettges, K.F. Accurate quantification of apoptosis progression and toxicity using a dielectrophoretic approach. Analyst 2016, 141, 6408–6415. [Google Scholar] [CrossRef]
- Salimi, E.; Braasch, K.; Fazelkhah, A.; Afshar, S.; Saboktakin Rizi, B.; Mohammad, K.; Butler, M.; Bridges, G.E.; Thomson, D.J. Single cell dielectrophoresis study of apoptosis progression induced by controlled starvation. Bioelectrochemistry 2018, 124, 73–79. [Google Scholar] [CrossRef]
- Labeed, F.H.; Coley, H.M.; Hughes, M.P. Differences in the biophysical properties of membrane and cytoplasm of apoptotic cells revealed using dielectrophoresis. Biochim. Biophys. Acta Gen. Subj. 2006, 1760, 922–929. [Google Scholar] [CrossRef]
- Braasch, K.; Nikolic-Jaric, M.; Cabel, T.; Salimi, E.; Bridges, G.E.; Thomson, D.J.; Butler, M. The changing dielectric properties of CHO cells can be used to determine early apoptotic events in a bioprocess. Biotechnol. Bioeng. 2013, 110, 2902–2914. [Google Scholar] [CrossRef]
- Chin, S.; Hughes, M.P.; Coley, H.M.; Labeed, F.H. Rapid assessment of early biophysical changes in K562 cells during apoptosis determined using dielectrophoresis. Int. J. Nanomed. 2006, 1, 333–337. [Google Scholar]
- Nikolic-Jaric, M.; Cabel, T.; Salimi, E.; Bhide, A.; Braasch, K.; Butler, M.; Bridges, G.E.; Thomson, D.J. Differential electronic detector to monitor apoptosis using dielectrophoresis-induced translation of flowing cells (dielectrophoresis cytometry). Biomicrofluidics 2013, 7, 024101. [Google Scholar] [CrossRef] [PubMed]
- Afshar, S.; Salimi, E.; Fazelkhah, A.; Braasch, K.; Mishra, N.; Butler, M.; Thomson, D.J.; Bridges, G.E. Progression of change in membrane capacitance and cytoplasm conductivity of cells during controlled starvation using dual-frequency DEP cytometry. Anal. Chim. Acta 2019, 1059, 59–67. [Google Scholar] [CrossRef] [PubMed]
- Fazelkhah, A.; Afshar, S.; Braasch, K.; Butler, M.; Salimi, E.; Bridges, G.; Thomson, D. Cytoplasmic conductivity as a marker for bioprocess monitoring: Study of Chinese hamster ovary cells under nutrient deprivation and reintroduction. Biotechnol. Bioeng. 2019, 116, 2896–2905. [Google Scholar] [CrossRef]
- Fazelkhah, A.; Braasch, K.; Afshar, S.; Salimi, E.; Butler, M.; Bridges, G.; Thomson, D. Quantitative Model for Ion Transport and Cytoplasm Conductivity of Chinese Hamster Ovary Cells. Sci. Rep. 2018, 8, 17818. [Google Scholar] [CrossRef]
- Valero, A.; Braschler, T.; Renaud, P. A unified approach to dielectric single cell analysis: Impedance and dielectrophoretic force spectroscopy. Lab A Chip 2010, 10, 2216. [Google Scholar] [CrossRef]
- Cheung, K.C.; Di Berardino, M.; Schade-Kampmann, G.; Hebeisen, M.; Pierzchalski, A.; Bocsi, J.; Mittag, A.; Tárnok, A. Microfluidic impedance-based flow cytometry. Cytom. Part A 2010, 77, 648–666. [Google Scholar] [CrossRef]
- Crowell, L.; Yakisich, J.; Aufderheide, B.; Adams, T. Electrical Impedance Spectroscopy for Monitoring Chemoresistance of Cancer Cells. Micromachines 2020, 11, 832. [Google Scholar] [CrossRef]
- Han, S.-I.; Joo, Y.-D.; Han, K.-H. An electrorotation technique for measuring the dielectric properties of cells with simultaneous use of negative quadrupolar dielectrophoresis and electrorotation. Analyst 2013, 138, 1529. [Google Scholar] [CrossRef]
- Yang, J.; Huang, Y.; Wang, X.; Wang, X.-B.; Becker, F.F.; Gascoyne, P.R.C. Dielectric Properties of Human Leukocyte Subpopulations Determined by Electrorotation as a Cell Separation Criterion. Biophys. J. 1999, 76, 3307–3314. [Google Scholar] [CrossRef]
- Li, Y.; Huang, C.; Han, S.-I.; Han, A. Measurement of dielectric properties of cells at single-cell resolution using electrorotation. Biomed. Microdevices 2022, 24, 23. [Google Scholar] [CrossRef] [PubMed]
- Markx, G.H.; Davey, C.L. The dielectric properties of biological cells at radiofrequencies: Applications in biotechnology. Enzym. Microb. Technol. 1999, 25, 161–171. [Google Scholar] [CrossRef]
- Brehm-Stecher, B.F.; Johnson, E.A. Single-Cell Microbiology: Tools, Technologies, and Applications. Microbiol. Mol. Biol. Rev. 2004, 68, 538–559. [Google Scholar] [CrossRef] [PubMed]
- Pethig, R. Dielectrophoresis: Status of the theory, technology, and applications. Biomicrofluidics 2010, 4, 022811. [Google Scholar] [CrossRef]
- Sun, T.; Morgan, H. Single-cell microfluidic impedance cytometry: A review. Microfluid. Nanofluid. 2010, 8, 423–443. [Google Scholar] [CrossRef]
- Salimi, E.; Braasch, K.; Butler, M.; Thomson, D.J.; Bridges, G.E. Dielectric model for Chinese hamster ovary cells obtained by dielectrophoresis cytometry. Biomicrofluidics 2016, 10, 014111. [Google Scholar] [CrossRef]
- Afshar, S.; Fazelkhah, A.; Braasch, K.; Salimi, E.; Butler, M.; Thomson, D.J.; Bridges, G.E. Full Beta-Dispersion Region Dielectric Spectra and Dielectric Models of Viable and Non-Viable CHO Cells. IEEE J. Electromagn. RF Microw. Med. 2021, 5, 70–77. [Google Scholar] [CrossRef]
- Mohammad, K.; Buchanan, D.A.; Braasch, K.; Butler, M.; Thomson, D.J. CMOS single cell dielectrophoresis cytometer. Sens. Actuators B Chem. 2017, 249, 246–255. [Google Scholar] [CrossRef]
- Nakabayashi, R.; Eguchi, M. Evaluation of Isomotive Insulator-Based Dielectrophoretic Device by Measuring the Particle Velocity. Sensors 2022, 22, 1533. [Google Scholar] [CrossRef]
- Wang, X.-B.; Yang, J.; Huang, Y.; Vykoukal, J.; Becker, F.F.; Gascoyne, P.R.C. Cell Separation by Dielectrophoretic Field-flow-fractionation. Anal. Chem. 2000, 72, 832–839. [Google Scholar] [CrossRef]
- Das, C.M.; Becker, F.; Vernon, S.; Noshari, J.; Joyce, C.; Gascoyne, P.R.C. Dielectrophoretic Segregation of Different Human Cell Types on Microscope Slides. Anal. Chem. 2005, 77, 2708–2719. [Google Scholar] [CrossRef] [PubMed]
- Suehiro, J.; Pethig, R. The dielectrophoretic movement and positioning of a biological cell using a three-dimensional grid electrode system. J. Phys. D Appl. Phys. 1998, 31, 3298–3305. [Google Scholar] [CrossRef]
- Wang, X.-B.; Huang, Y.; Gascoyne, P.R.C.; Becker, F.F. Dielectrophoretic Manipulation of Particles. IEEE Trans. Ind. Appl. 1997, 33, 660–669. [Google Scholar] [CrossRef]
- Tivig, I.; Moisescu, M.G.; Savopol, T. OpenDEP: An Open-Source Platform for Dielectrophoresis Spectra Acquisition and Analysis. ACS Omega 2023, 8, 38715–38722. [Google Scholar] [CrossRef]
- Hoettges, K.F.; Henslee, E.A.; Serrano, R.M.T.; Jabr, R.I.; Abdallat, R.G.; Beale, A.D.; Waheed, A.; Camelliti, P.; Fry, C.H.; van der Veen, D.R.; et al. Ten-Second Electrophysiology: Evaluation of the 3DEP Platform for high-speed, high-accuracy cell analysis. Sci. Rep. 2019, 9, 19153. [Google Scholar] [CrossRef]
- Fazelkhah, A.; Afshar, S.; Durham, N.; Butler, M.; Salimi, E.; Bridges, G.; Thomson, D. Parallel single-cell optical transit dielectrophoresis cytometer. Electrophoresis 2020, 41, 720–728. [Google Scholar] [CrossRef]
- Asami, K.; Yonezawa, T. Dielectric behavior of wild-type yeast and vacuole-deficient mutant over a frequency range of 10 kHz to 10 GHz. Biophys. J. 1996, 71, 2192–2200. [Google Scholar] [CrossRef]
- Cottet, J.; Fabregue, O.; Berger, C.; Buret, F.; Renaud, P.; Frenea-Robin, M. MyDEP: A New Computational Tool for Dielectric Modeling of Particles and Cells. Biophys. J. 2019, 116, 12–18. [Google Scholar] [CrossRef]
- Zhang, Z.; Zheng, T.; Zhu, R. Characterization of single-cell biophysical properties and cell type classification using dielectrophoresis model reduction method. Sens. Actuators B Chem. 2020, 304, 127326. [Google Scholar] [CrossRef]
- Mulhall, H.J.; Labeed, F.H.; Kazmi, B.; Costea, D.E.; Hughes, M.P.; Lewis, M.P. Cancer, pre-cancer and normal oral cells distinguished by dielectrophoresis. Anal. Bioanal. Chem. 2011, 401, 2455–2463. [Google Scholar] [CrossRef]
- Zhao, Y.; Jiang, M.; Chen, D.; Zhao, X.; Xue, C.; Hao, R.; Yue, W.; Wang, J.; Chen, J. Single-Cell Electrical Phenotyping Enabling the Classification of Mouse Tumor Samples. Sci. Rep. 2016, 6, 19487. [Google Scholar] [CrossRef] [PubMed]
- Trainito, C.I.; Sweeney, D.C.; Čemažar, J.; Schmelz, E.M.; Français, O.; Le Pioufle, B.; Davalos, R.V. Characterization of sequentially-staged cancer cells using electrorotation. PLoS ONE 2019, 14, e0222289. [Google Scholar] [CrossRef] [PubMed]
- Kawai, S.; Suzuki, M.; Arimoto, S.; Korenaga, T.; Yasukawa, T. Determination of membrane capacitance and cytoplasm conductivity by simultaneous electrorotation. Analyst 2020, 145, 4188–4195. [Google Scholar] [CrossRef]
- Huang, L.; Zhao, P.; Wang, W. 3D cell electrorotation and imaging for measuring multiple cellular biophysical properties. Lab A Chip 2018, 18, 2359–2368. [Google Scholar] [CrossRef] [PubMed]
- Chen, S.; Zhang, S.; Zhu, R. Computer-Vision-Based Dielectrophoresis Mobility Tracking for Characterization of Single-Cell Biophysical Properties. Anal. Chem. 2022, 94, 14331–14339. [Google Scholar] [CrossRef]
- Labeed, F.H.; Coley, H.M.; Thomas, H.; Hughes, M.P. Assessment of Multidrug Resistance Reversal Using Dielectrophoresis and Flow Cytometry. Biophys. J. 2003, 85, 2028–2034. [Google Scholar] [CrossRef]
- Opel, C.F.; Li, J.; Amanullah, A. Quantitative modeling of viable cell density, cell size, intracellular conductivity, and membrane capacitance in batch and fed-batch CHO processes using dielectric spectroscopy. Biotechnol. Prog. 2010, 26, 1187–1199. [Google Scholar] [CrossRef]
- Saboktakin Rizi, B.; Braasch, K.; Salimi, E.; Butler, M.; Bridges, G.E.; Thomson, D.J. Monitoring the dielectric response of single cells following mitochondrial adenosine triphosphate synthase inhibition by oligomycin using a dielectrophoretic cytometer. Biomicrofluidics 2014, 8, 064114. [Google Scholar] [CrossRef]
- Duncan, L.; Shelmerdine, H.; Hughes, M.P.; Coley, H.M.; Hübner, Y.; Labeed, F.H. Dielectrophoretic analysis of changes in cytoplasmic ion levels due to ion channel blocker action reveals underlying differences between drug-sensitive and multidrug-resistant leukaemic cells. Phys. Med. Biol. 2008, 53, N1–N7. [Google Scholar] [CrossRef]
- Roy, M.; Jin, G.; Pan, J.-H.; Seo, D.; Hwang, Y.; Oh, S.; Lee, M.; Kim, Y.J.; Seo, S. Staining-free cell viability measurement technique using lens-free shadow imaging platform. Sens. Actuators B Chem. 2016, 224, 577–583. [Google Scholar] [CrossRef]
- Roy, M.; Jin, G.; Seo, D.; Nam, M.-H.; Seo, S. A simple and low-cost device performing blood cell counting based on lens-free shadow imaging technique. Sens. Actuators B Chem. 2014, 201, 321–328. [Google Scholar] [CrossRef]
- Wang, X.-B.; Vykoukal, J.; Becker, F.F.; Gascoyne, P.R.C. Separation of Polystyrene Microbeads Using Dielectrophoretic/Gravitational Field-Flow-Fractionation. Biophys. J. 1998, 74, 2689–2701. [Google Scholar] [CrossRef] [PubMed]
- Huang, Y.; Wang, X.B.; Becker, F.F.; Gascoyne, P.R. Introducing dielectrophoresis as a new force field for field-flow fractionation. Biophys. J. 1997, 73, 1118–1129. [Google Scholar] [CrossRef] [PubMed]
- Stephen Williams, P.; Lee, S.; Calvin Giddings, J. Characterization of hydrodynamic lift forces by field-flow fractionation. inertial and near-wall lift forces. Chem. Eng. Commun. 1994, 130, 143–166. [Google Scholar] [CrossRef]
- Ganatos, P.; Weinbaum, S.; Pfeffer, R. A strong interaction theory for the creeping motion of a sphere between plane parallel boundaries. Part 1. Perpendicular motion. J. Fluid Mech. 1980, 99, 739–753. [Google Scholar] [CrossRef]
- Nikolic-Jaric, M.; Ferrier, G.A.; Thomson, D.J.; Bridges, G.E.; Freeman, M.R. Dielectric response of particles in flowing media: The effect of shear-induced rotation on the variation in particle polarizability. Phys. Rev. E Stat. Nonlinear Soft Matter Phys. 2011, 84, 011922. [Google Scholar] [CrossRef]
- Su, H.-W.; Prieto, J.L.; Voldman, J. Rapid dielectrophoretic characterization of single cells using the dielectrophoretic spring. Lab A Chip 2013, 13, 4109–4117. [Google Scholar] [CrossRef]


| Cell Line | Normal | Altered | Medium Conductivity (S/m) | Frequency (MHz) | Condition |
|---|---|---|---|---|---|
| Jurkat | 0.87 | 0.47 | 0.01 | 15 | Apoptotic [17] |
| Jurkat | 0.79 | 0.24 | 0.01 | 15 | Anti-cancer drug-treated (DOX-treated) [13] |
| MCF-7 cell line (human breast) | 0.58 | 0.31 | 0.0025 | 15 | Multidrug resistance derivatives [6] |
| Chinese hamster ovary | 0.32 | −0.2 | 0.17 | 6 | Apoptotic [19,25] |
| Chinese hamster ovary | −0.35 | −0.37 | 1.7 | 6 | Stationary phase of fed-batch culture [58] |
| Chinese hamster ovary | −0.008 | −0.1 | 0.42 | 6 | Inhibition of mitochondria ATP production [59] |
| Chinese hamster ovary | −0.008 | −0.07 | 0.42 | 6 | Inhibition of ATPase pumps [59] |
| Human chronic myelogenous leukemia (K562) | 0.79 | 0.9 | 0.0025 | 10 | Multidrug-resistant leukemic cells (K562AR) [60] |
| Multidrug-resistant leukemic (K562AR) | 0.9 | 0.77 | 0.0025 | 10 | Cl− channel blocked with NPPB [60] |
| Multidrug-resistant leukemic (K562AR) | 0.9 | 0.85 | 0.0025 | 10 | K+ channel blocked with quinine [60] |
| Human chronic myelogeneous leukemic (K562) | 0.79 | 0.22 | 0.005 | 10 | Apoptotic [20] |
Disclaimer/Publisher’s Note: The statements, opinions and data contained in all publications are solely those of the individual author(s) and contributor(s) and not of MDPI and/or the editor(s). MDPI and/or the editor(s) disclaim responsibility for any injury to people or property resulting from any ideas, methods, instructions or products referred to in the content. |
© 2024 by the authors. Licensee MDPI, Basel, Switzerland. This article is an open access article distributed under the terms and conditions of the Creative Commons Attribution (CC BY) license (https://creativecommons.org/licenses/by/4.0/).
Share and Cite
Kovacs, E.; Arzang, B.; Salimi, E.; Butler, M.; Bridges, G.E.; Thomson, D.J. Light-Emitting Diode Array with Optical Linear Detector Enables High-Throughput Differential Single-Cell Dielectrophoretic Analysis. Sensors 2024, 24, 8071. https://doi.org/10.3390/s24248071
Kovacs E, Arzang B, Salimi E, Butler M, Bridges GE, Thomson DJ. Light-Emitting Diode Array with Optical Linear Detector Enables High-Throughput Differential Single-Cell Dielectrophoretic Analysis. Sensors. 2024; 24(24):8071. https://doi.org/10.3390/s24248071
Chicago/Turabian StyleKovacs, Emerich, Behnam Arzang, Elham Salimi, Michael Butler, Greg E. Bridges, and Douglas J. Thomson. 2024. "Light-Emitting Diode Array with Optical Linear Detector Enables High-Throughput Differential Single-Cell Dielectrophoretic Analysis" Sensors 24, no. 24: 8071. https://doi.org/10.3390/s24248071
APA StyleKovacs, E., Arzang, B., Salimi, E., Butler, M., Bridges, G. E., & Thomson, D. J. (2024). Light-Emitting Diode Array with Optical Linear Detector Enables High-Throughput Differential Single-Cell Dielectrophoretic Analysis. Sensors, 24(24), 8071. https://doi.org/10.3390/s24248071