
Language-Guided Semantic Clustering for Remote Sensing Change Detection


Abstract
1. Introduction
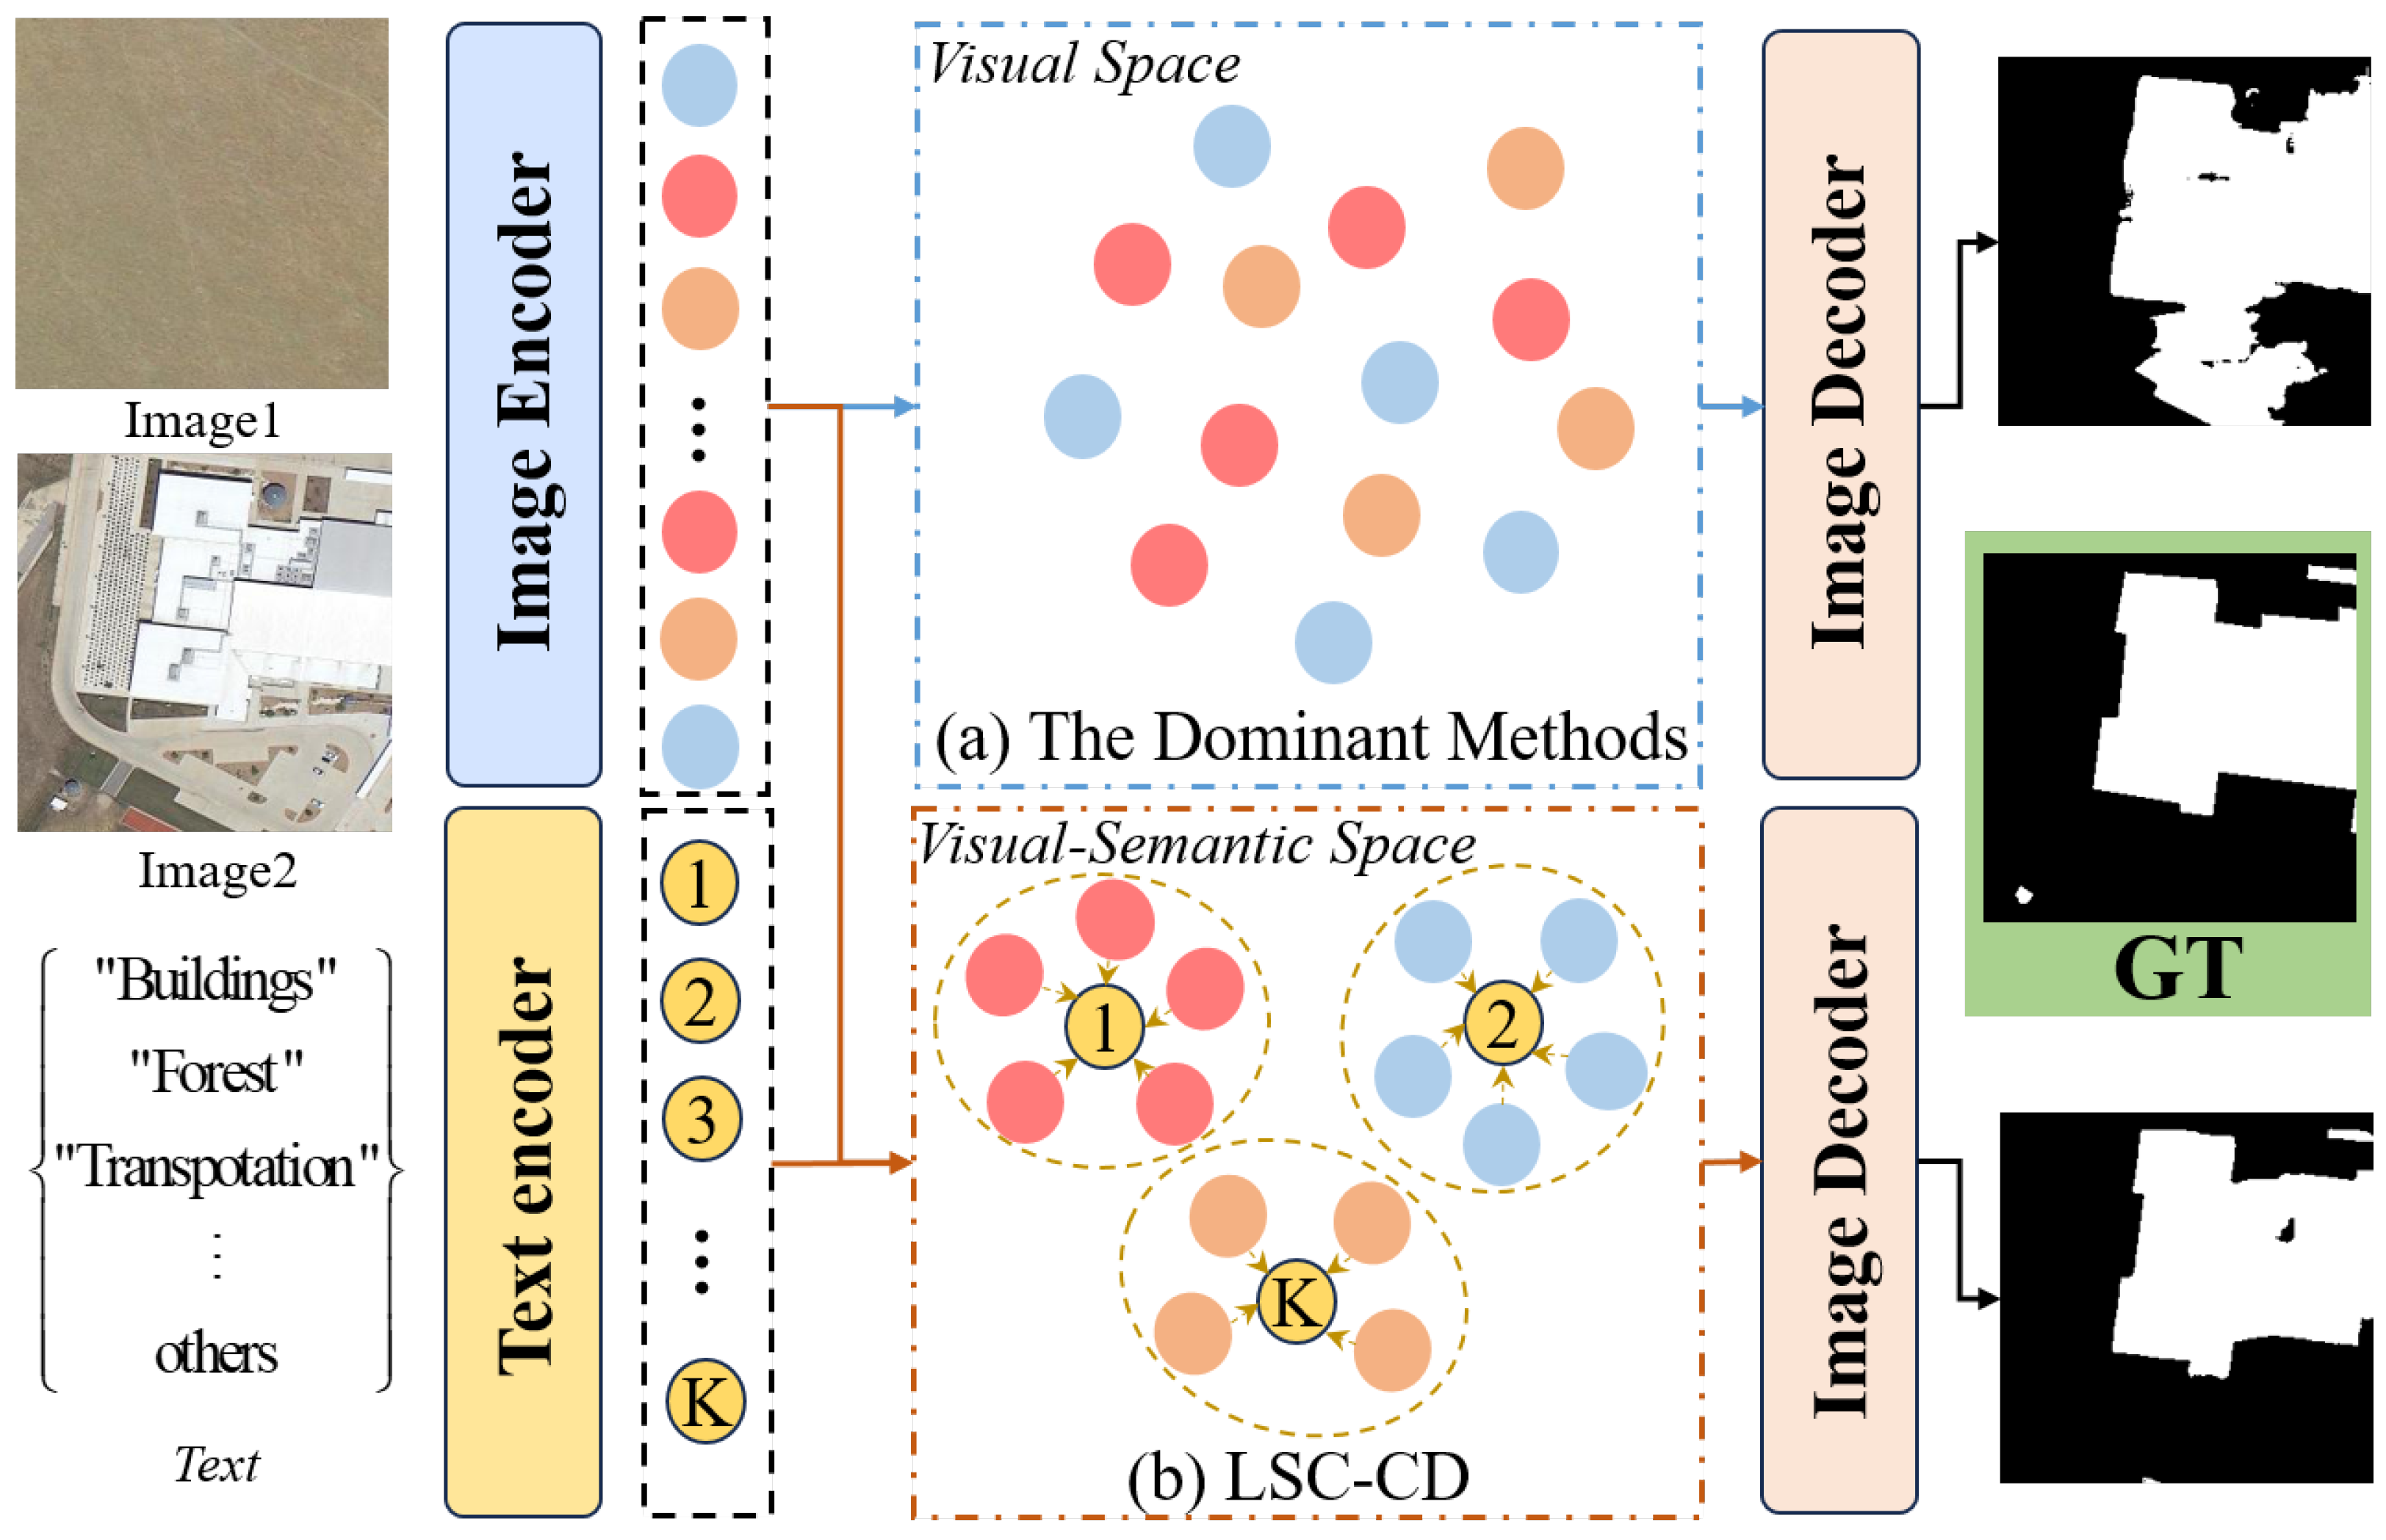
- We propose a language-guided semantic clustering framework for RSCD that achieves strong semantic modeling capabilities by introducing the CLIP.
- We design an SCM that modulates change embeddings from a semantic-guided perspective using semantic clustering.
- We develop a CAM to fine-tune the CLIP text encoder, aligning its encoded semantic embeddings to the change region embeddings.
2. Related Work
2.1. Semantic Segmentation
2.2. Remote Sensing Change Detection
3. Methods
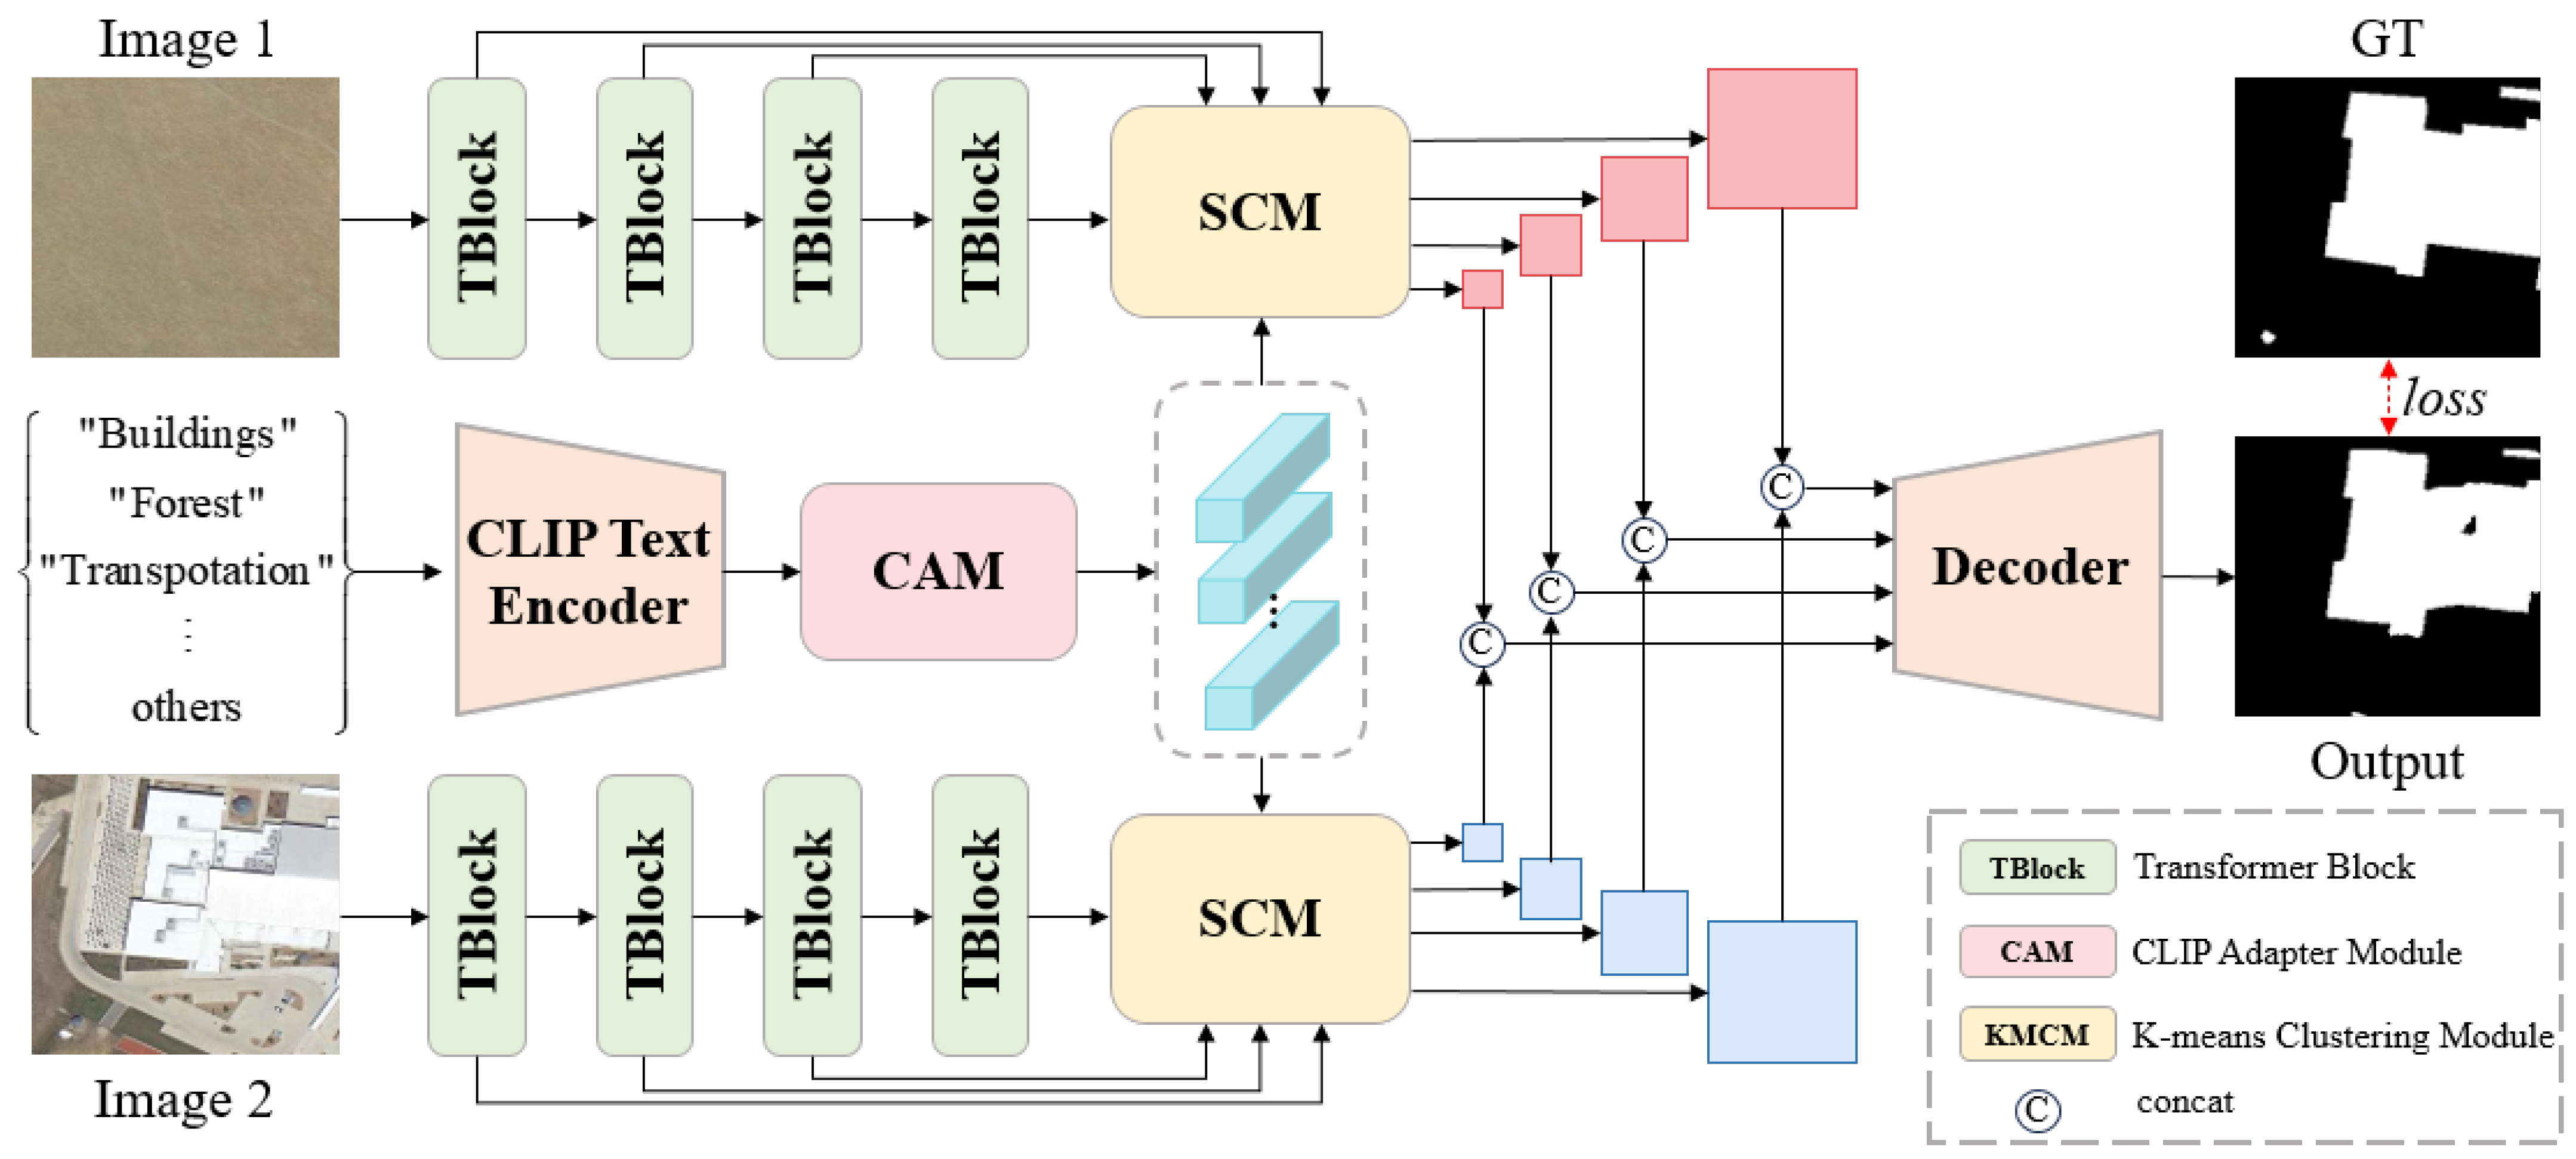
3.1. Overview
3.2. CLIP-Adapter Module (CAM)
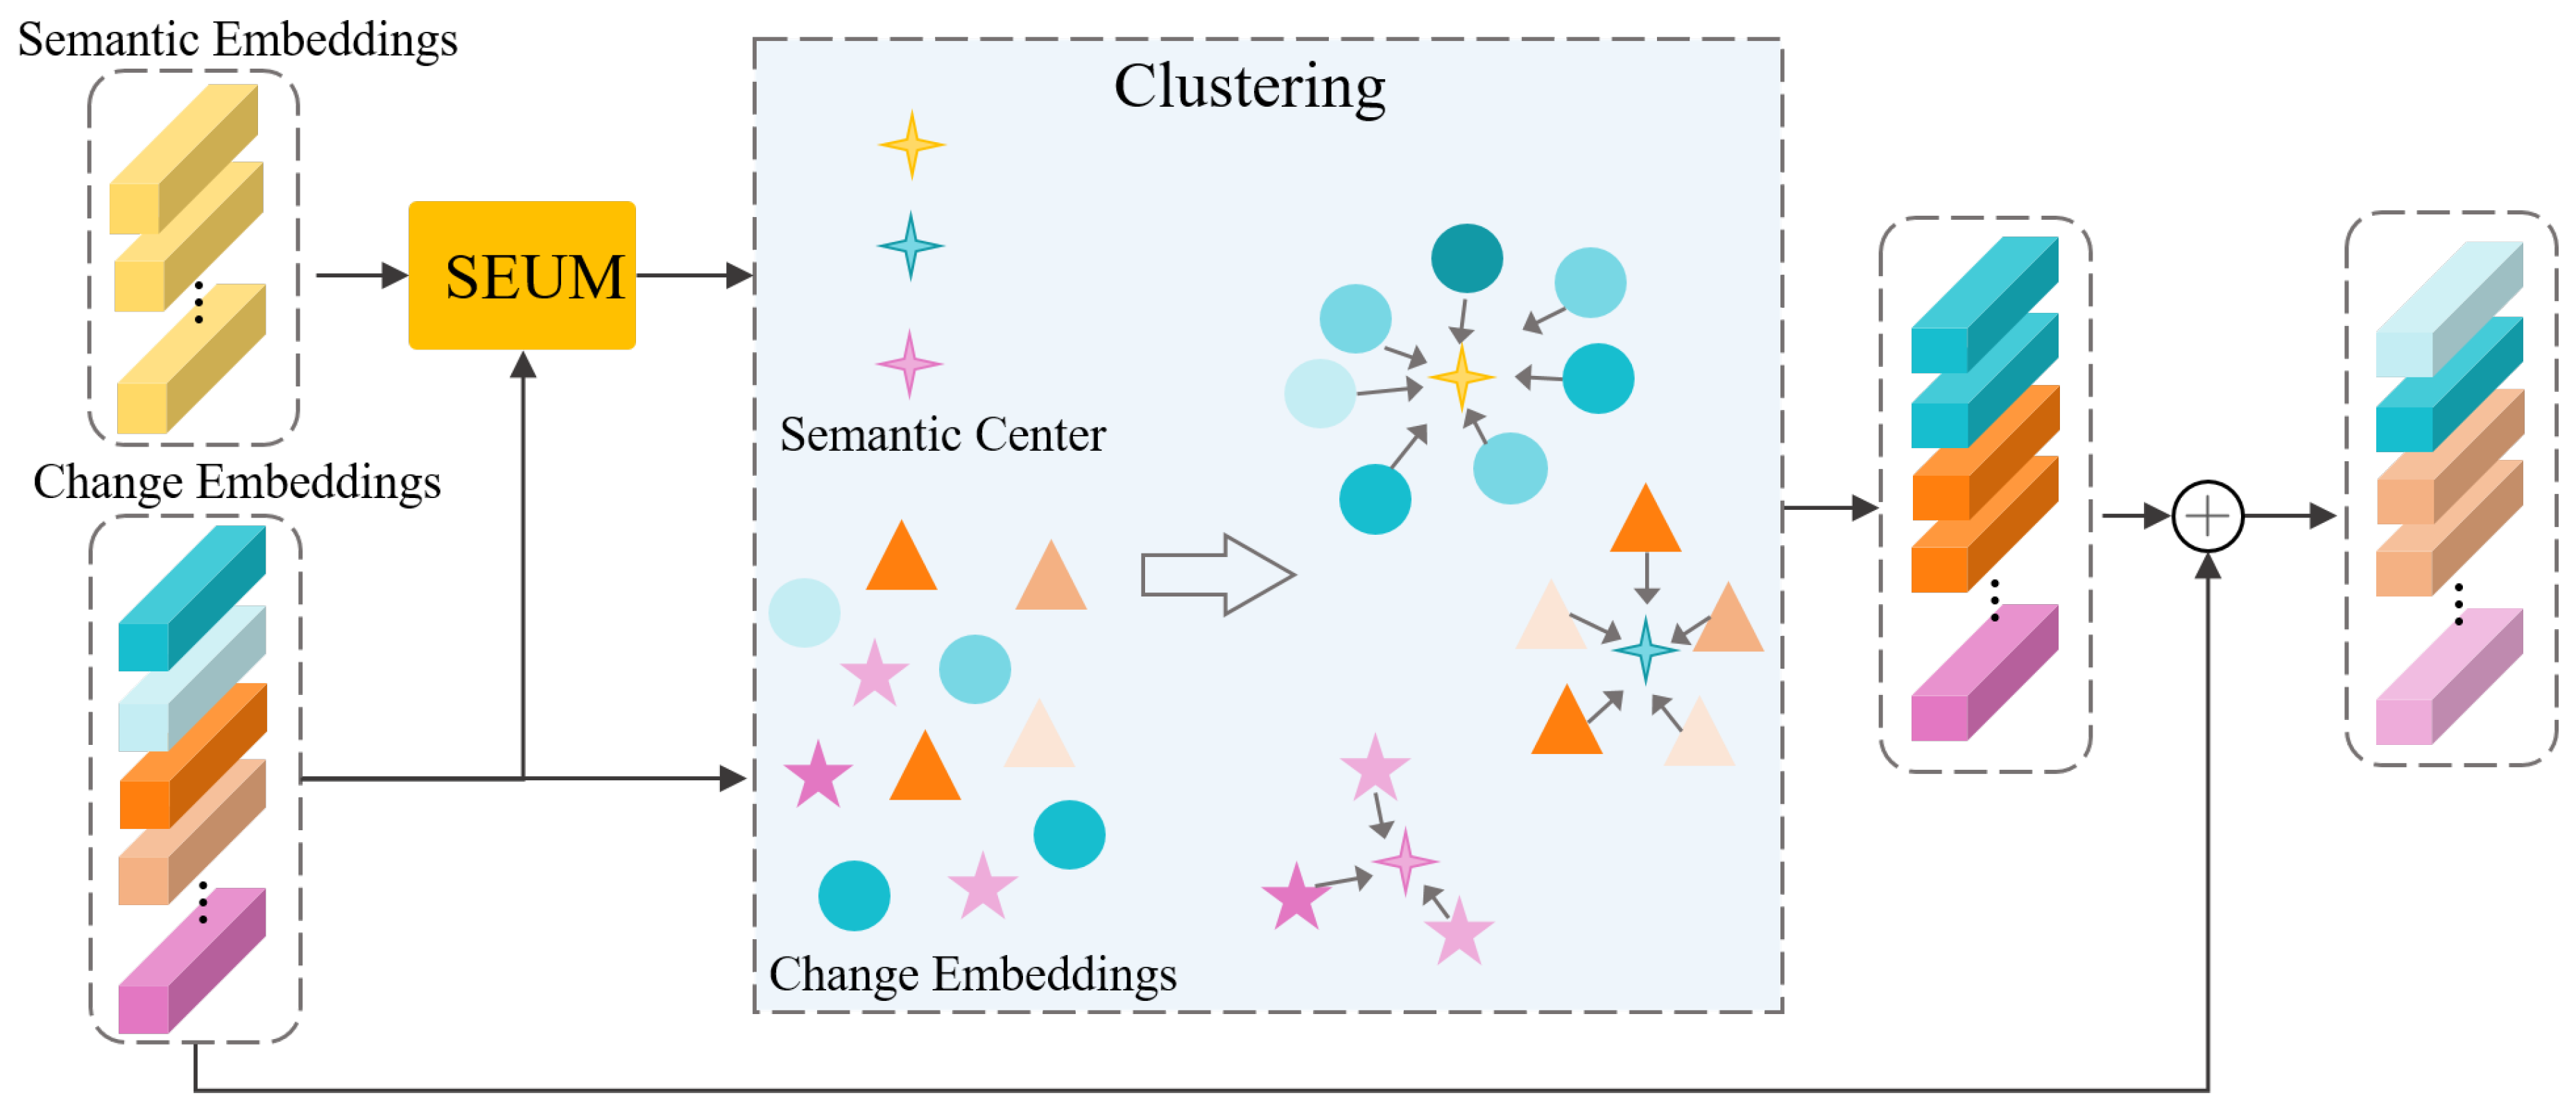
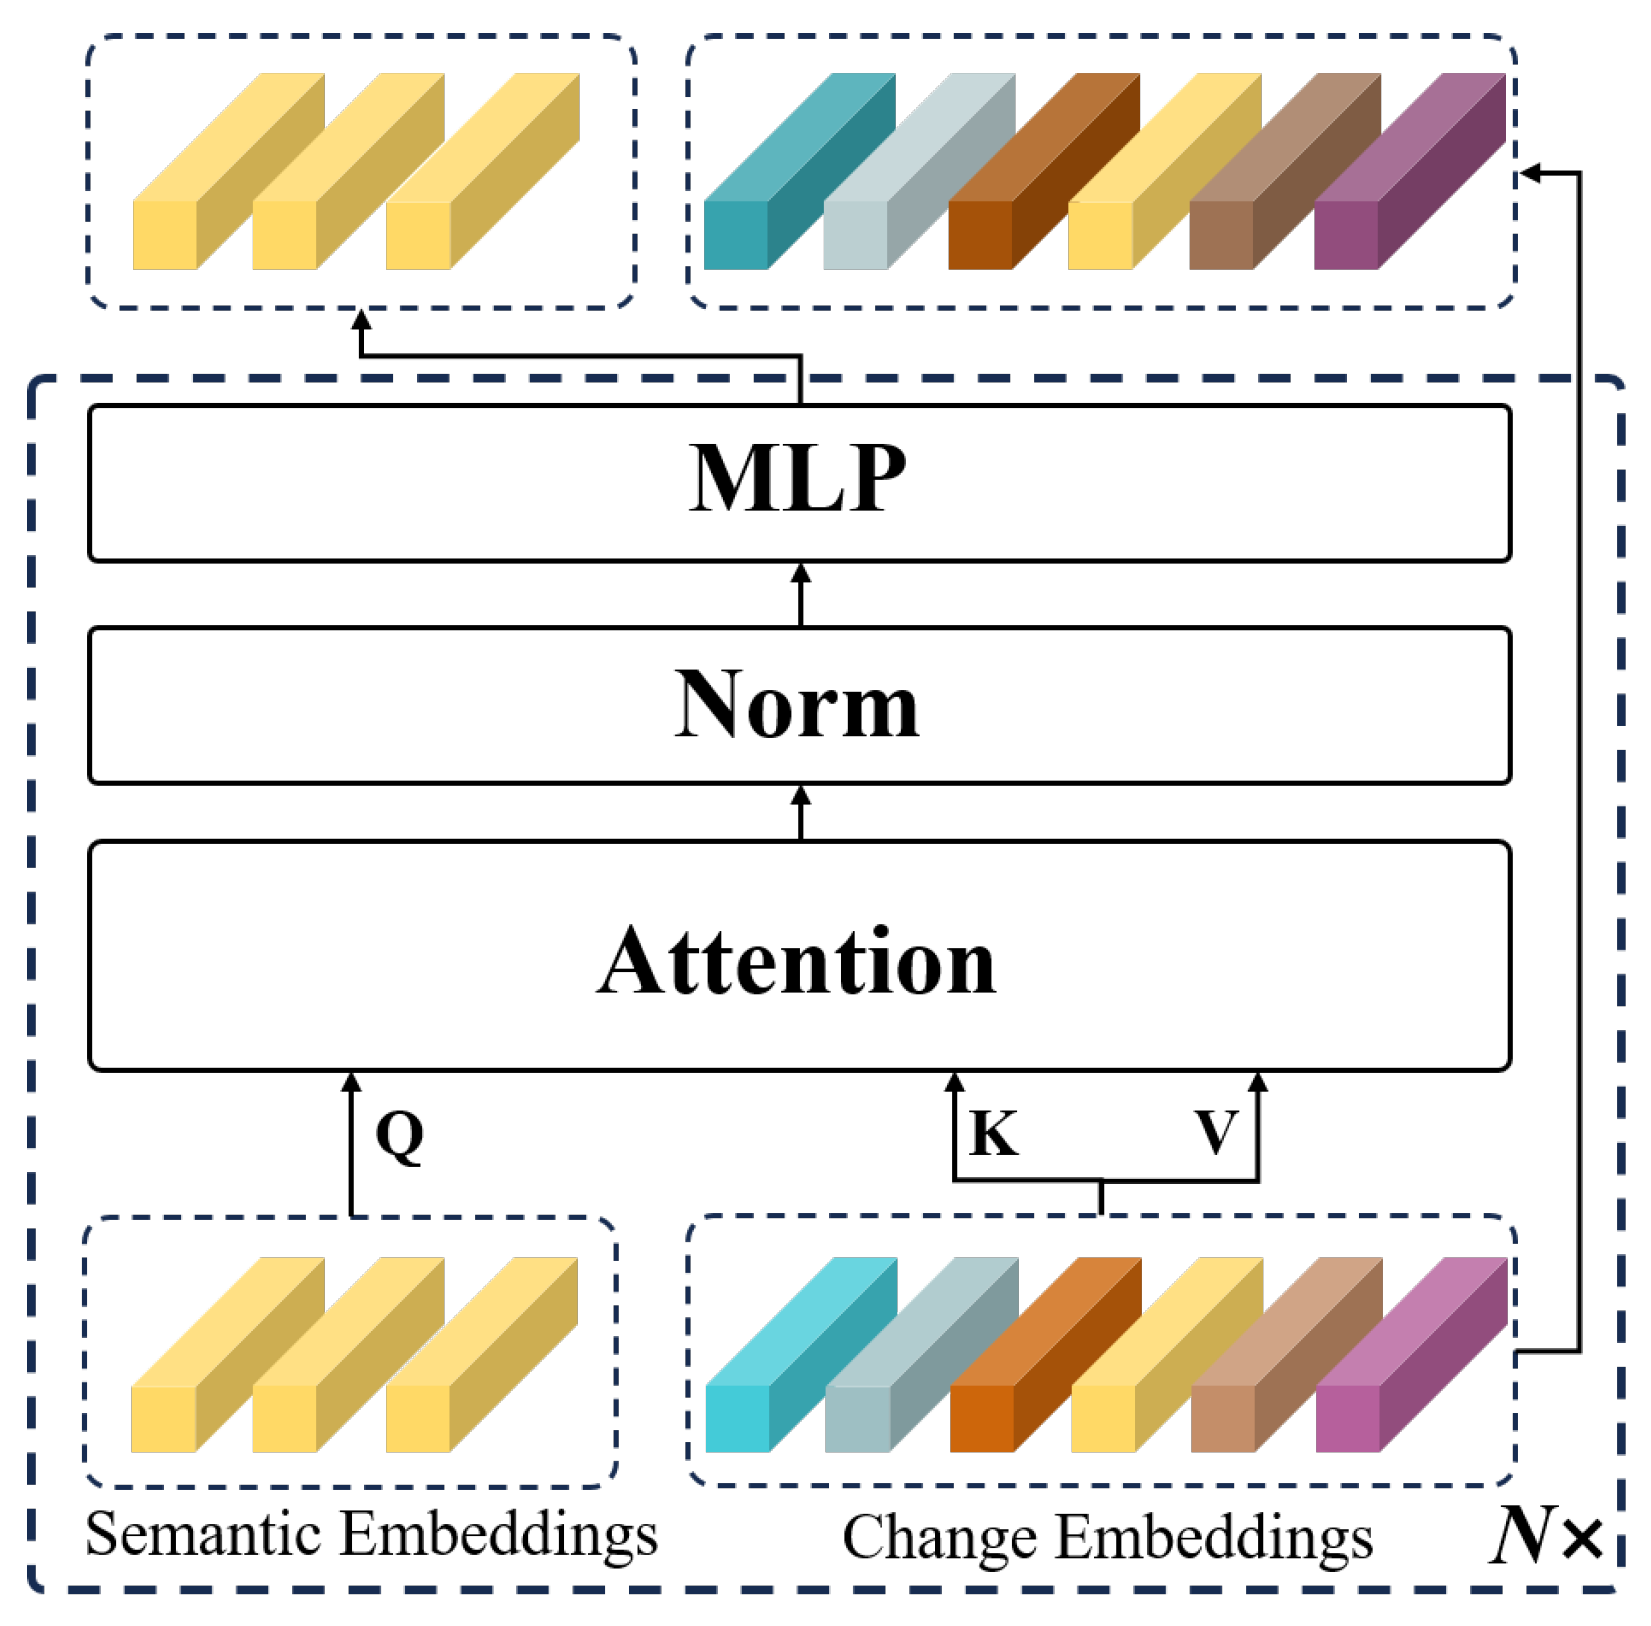
3.3. Semantic Clustering Module (SCM)
3.4. Loss Funcation
4. Experiments
4.1. Datasets
- LEVIR-CD. The LEVIR-CD is a large-scale remote sensing dataset for building change detection models, released by Beihang University in 2020. It consists of 637 pairs of very-high-resolution Google Earth images with a resolution of 1024 × 1024 pixels, where each pixel represents 0.2 m. The dataset primarily focuses on building changes, including building growth and demolition, with change areas labeled as 1 and unchanged areas labeled as 0, without semantic labels. It contains many irrelevant changes due to seasonal variations. The buildings in LEVIR-CD range from villas, small garages, and high-rise apartments to large warehouses, with a total of 31,333 changed buildings. Following [36], we split the original data into 256 × 256 patches without overlap, resulting in 10,192 images, of which 7120 are used for training, 2048 for testing, and 1024 for validation.
- WHU-CD. The WHU-CD is another building change detection dataset for remote sensing, similar to LEVIR-CD. It contains two aerial images with a resolution of 32,507 × 15,354 pixels, where each pixel represents 0.3 m. Like LEVIR-CD, it does not provide additional semantic labels. This dataset has been widely used as a benchmark for change detection studies. However, due to the large resolution of the image pairs, they need to be divided into smaller patches for model input, and there is no standard method for this splitting. To ensure a fair comparison, we followed [37] for splitting the dataset. Specifically, we divided the original images into 256 × 256 pixel patches, resulting in 7620 image pairs. Of these, 6096 pairs are used for training, 762 pairs for testing, and 762 pairs for validation.
- SYSU-CD. The SYSU-CD contains 20,000 pairs of high-resolution images, each with 256 × 256 pixels, collected in Hong Kong between 2007 and 2014, where each pixel represents 0.5 m. Unlike LEVIR-CD and WHU-CD, SYSU-CD includes a variety of changes, including newly built urban buildings, suburban expansion, groundwork before construction, vegetation changes, road expansion, and sea construction. Change areas are labeled as 1 and unchanged areas as 0, without semantic labels. The dataset consists of 12,000 pairs for training, 4000 pairs for testing, and 4000 pairs for validation.
4.2. Evaluation Metrics
4.3. Implementation Details
4.4. Quantitative Comparison
4.5. Qualitative Comparison
4.6. Ablation Studies
5. Conclusions
Author Contributions
Funding
Institutional Review Board Statement
Informed Consent Statement
Data Availability Statement
Acknowledgments
Conflicts of Interest
References
- Qin, D.; Zhou, X.; Zhou, W.; Huang, G.; Ren, Y.; Horan, B.; He, J.; Kito, N. MSIM: A change detection framework for damage assessment in natural disasters. Expert Syst. Appl. 2018, 97, 372–383. [Google Scholar] [CrossRef]
- Michel, U.; Thunig, H.; Ehlers, M.; Reinartz, P. Rapid change detection algorithm for disaster management. ISPRS Ann. Photogramm. Remote Sens. Spat. Inf. Sci. 2012, 1, 107–111. [Google Scholar] [CrossRef]
- Zheng, Z.; Zhong, Y.; Wang, J.; Ma, A.; Zhang, L. Building damage assessment for rapid disaster response with a deep object-based semantic change detection framework: From natural disasters to man-made disasters. Remote Sens. Environ. 2021, 265, 112636. [Google Scholar] [CrossRef]
- Bolorinos, J.; Ajami, N.K.; Rajagopal, R. Consumption change detection for urban planning: Monitoring and segmenting water customers during drought. Water Resour. Res. 2020, 56, e2019WR025812. [Google Scholar] [CrossRef]
- Du, P.; Liu, S.; Gamba, P.; Tan, K.; Xia, J. Fusion of difference images for change detection over urban areas. IEEE J. Sel. Top. Appl. Earth Obs. Remote Sens. 2012, 5, 1076–1086. [Google Scholar] [CrossRef]
- Liu, X.; Lathrop, R., Jr. Urban change detection based on an artificial neural network. Int. J. Remote Sens. 2002, 23, 2513–2518. [Google Scholar] [CrossRef]
- Tarimo, B.; Mtalo, E.; Liwa, E. Land use change detection and impact assessment on an agricultural area. J. Sustain. Dev. 2013, 6, 55. [Google Scholar] [CrossRef]
- Prishchepov, A.V.; Radeloff, V.C.; Dubinin, M.; Alcantara, C. The effect of Landsat ETM/ETM+ image acquisition dates on the detection of agricultural land abandonment in Eastern Europe. Remote Sens. Environ. 2012, 126, 195–209. [Google Scholar] [CrossRef]
- Malinverni, E.S.; Rinaldi, M.; Ruggieri, S. Agricultural crop change detection by means of hybrid classification and high resolution images. EARSeL EProc. 2012, 11, 132. [Google Scholar]
- Bruzzone, L.; Prieto, D.F. Automatic analysis of the difference image for unsupervised change detection. IEEE Trans. Geosci. Remote Sens. 2000, 38, 1171–1182. [Google Scholar] [CrossRef]
- Luppino, L.T.; Bianchi, F.M.; Moser, G.; Anfinsen, S.N. Unsupervised image regression for heterogeneous change detection. arXiv 2019, arXiv:1909.05948. [Google Scholar] [CrossRef]
- Ayhan, B.; Kwan, C.; Zhou, J. A new nonlinear change detection approach based on band ratioing. In Proceedings of the Algorithms and Technologies for Multispectral, Hyperspectral, and Ultraspectral Imagery XXIV, Orlando, FL, USA, 17–19 April 2018; SPIE: Bellingham, WA, USA, 2018; Volume 10644, pp. 300–309. [Google Scholar]
- Chen, J.; Gong, P.; He, C.; Pu, R.; Shi, P. Land-use/land-cover change detection using improved change-vector analysis. Photogramm. Eng. Remote Sens. 2003, 69, 369–379. [Google Scholar] [CrossRef]
- Deng, J.; Wang, K.; Deng, Y.; Qi, G. PCA-based land-use change detection and analysis using multitemporal and multisensor satellite data. Int. J. Remote Sens. 2008, 29, 4823–4838. [Google Scholar] [CrossRef]
- Nielsen, A.A. The regularized iteratively reweighted MAD method for change detection in multi-and hyperspectral data. IEEE Trans. Image Process. 2007, 16, 463–478. [Google Scholar] [CrossRef] [PubMed]
- Hashim, F.; Dibs, H.; Jaber, H.S. Adopting gram-schmidt and brovey methods for estimating land use and land cover using remote sensing and satellite images. Nat. Environ. Pollut. Technol. 2022, 21, 867–881. [Google Scholar] [CrossRef]
- Han, T.; Wulder, M.A.; White, J.C.; Coops, N.C.; Alvarez, M.; Butson, C. An efficient protocol to process Landsat images for change detection with tasselled cap transformation. IEEE Geosci. Remote Sens. Lett. 2007, 4, 147–151. [Google Scholar] [CrossRef]
- Daudt, R.C.; Le Saux, B.; Boulch, A. Fully convolutional siamese networks for change detection. In Proceedings of the 2018 25th IEEE international conference on image processing (ICIP), Athens, Greece, 7–10 October 2018; IEEE: Piscataway, NJ, USA, 2018; pp. 4063–4067. [Google Scholar]
- Wang, Q.; Zhang, X.; Chen, G.; Dai, F.; Gong, Y.; Zhu, K. Change detection based on Faster R-CNN for high-resolution remote sensing images. Remote Sens. Lett. 2018, 9, 923–932. [Google Scholar] [CrossRef]
- El Amin, A.M.; Liu, Q.; Wang, Y. Convolutional neural network features based change detection in satellite images. In Proceedings of the First International Workshop on Pattern Recognition, Tokyo, Japan, 11–13 May 2016; SPIE: Bellingham, WA, USA, 2016; Volume 10011, pp. 181–186. [Google Scholar]
- Liu, T.; Li, Y.; Xu, L. Dual-channel convolutional neural network for change detection of multitemporal SAR images. In Proceedings of the 2016 International Conference on Orange Technologies (ICOT), Melbourne, Australia, 17–20 December 2016; IEEE: Piscataway, NJ, USA, 2016; pp. 60–63. [Google Scholar]
- Yin, M.; Chen, Z.; Zhang, C. A CNN-Transformer Network Combining CBAM for Change Detection in High-Resolution Remote Sensing Images. Remote Sens. 2023, 15, 2406. [Google Scholar] [CrossRef]
- Chen, H.; Shi, Z. A spatial-temporal attention-based method and a new dataset for remote sensing image change detection. Remote Sens. 2020, 12, 1662. [Google Scholar] [CrossRef]
- Zhang, C.; Yue, P.; Tapete, D.; Jiang, L.; Shangguan, B.; Huang, L.; Liu, G. A deeply supervised image fusion network for change detection in high resolution bi-temporal remote sensing images. ISPRS J. Photogramm. Remote Sens. 2020, 166, 183–200. [Google Scholar] [CrossRef]
- Fang, S.; Li, K.; Shao, J.; Li, Z. SNUNet-CD: A densely connected Siamese network for change detection of VHR images. IEEE Geosci. Remote Sens. Lett. 2021, 19, 1–5. [Google Scholar] [CrossRef]
- Feng, Y.; Jiang, J.; Xu, H.; Zheng, J. Change detection on remote sensing images using dual-branch multilevel intertemporal network. IEEE Trans. Geosci. Remote Sens. 2023, 61, 1–15. [Google Scholar] [CrossRef]
- LeCun, Y.; Boser, B.; Denker, J.S.; Henderson, D.; Howard, R.E.; Hubbard, W.; Jackel, L.D. Backpropagation applied to handwritten zip code recognition. Neural Comput. 1989, 1, 541–551. [Google Scholar] [CrossRef]
- Chen, H.; Qi, Z.; Shi, Z. Remote sensing image change detection with transformers. IEEE Trans. Geosci. Remote Sens. 2021, 60, 1–14. [Google Scholar] [CrossRef]
- Feng, Y.; Xu, H.; Jiang, J.; Liu, H.; Zheng, J. ICIF-Net: Intra-scale cross-interaction and inter-scale feature fusion network for bitemporal remote sensing images change detection. IEEE Trans. Geosci. Remote Sens. 2022, 60, 1–13. [Google Scholar] [CrossRef]
- Li, Q.; Zhong, R.; Du, X.; Du, Y. TransUNetCD: A hybrid transformer network for change detection in optical remote-sensing images. IEEE Trans. Geosci. Remote Sens. 2022, 60, 1–19. [Google Scholar] [CrossRef]
- Yuan, J.; Wang, L.; Cheng, S. STransUNet: A siamese TransUNet-based remote sensing image change detection network. IEEE J. Sel. Top. Appl. Earth Obs. Remote Sens. 2022, 15, 9241–9253. [Google Scholar] [CrossRef]
- Xu, X.; Yang, Z.; Li, J. AMCA: Attention-guided multiscale context aggregation network for remote sensing image change detection. IEEE Trans. Geosci. Remote Sens. 2023, 61, 1–19. [Google Scholar] [CrossRef]
- Zhang, C.; Wang, L.; Cheng, S.; Li, Y. SwinSUNet: Pure transformer network for remote sensing image change detection. IEEE Trans. Geosci. Remote Sens. 2022, 60, 1–13. [Google Scholar] [CrossRef]
- Yu, W.; Zhuo, L.; Li, J. GCFormer: Global Context-aware Transformer for Remote Sensing Image Change Detection. IEEE Trans. Geosci. Remote Sens. 2024, 62, 1–12. [Google Scholar] [CrossRef]
- Vaswani, A. Attention Is All You Need. In Advances in Neural Information Processing Systems; Curran Associates Inc.: New York, NY, USA, 2017. [Google Scholar]
- Bandara, W.G.C.; Patel, V.M. A transformer-based siamese network for change detection. In Proceedings of the IGARSS 2022–2022 IEEE International Geoscience and Remote Sensing Symposium, Kuala Lumpur, Malaysia, 17–22 July 2022; IEEE: Piscataway, NJ, USA, 2022; pp. 207–210. [Google Scholar]
- Wen, Y.; Ma, X.; Zhang, X.; Pun, M.O. GCD-DDPM: A generative change detection model based on difference-feature guided DDPM. IEEE Trans. Geosci. Remote Sens. 2024, 1, 1–17. [Google Scholar] [CrossRef]
- Radford, A.; Kim, J.W.; Hallacy, C.; Ramesh, A.; Goh, G.; Agarwal, S.; Sastry, G.; Askell, A.; Mishkin, P.; Clark, J.; et al. Learning transferable visual models from natural language supervision. In Proceedings of the International Conference on Machine Learning, PMLR, Online, 18–24 July 2021; pp. 8748–8763. [Google Scholar]
- Gu, T.; Yang, K.; An, X.; Feng, Z.; Liu, D.; Cai, W.; Deng, J. RWKV-CLIP: A Robust Vision-Language Representation Learner. arXiv 2024, arXiv:2406.06973. [Google Scholar]
- Lan, M.; Chen, C.; Ke, Y.; Wang, X.; Feng, L.; Zhang, W. Clearclip: Decomposing clip representations for dense vision-language inference. arXiv 2024, arXiv:2407.12442. [Google Scholar]
- Huang, R.; Pan, X.; Zheng, H.; Jiang, H.; Xie, Z.; Wu, C.; Song, S.; Huang, G. Joint representation learning for text and 3d point cloud. Pattern Recognit. 2024, 147, 110086. [Google Scholar] [CrossRef]
- Lin, J.; Gong, S. Gridclip: One-stage object detection by grid-level clip representation learning. arXiv 2023, arXiv:2303.09252. [Google Scholar]
- Chen, R.; Liu, Y.; Kong, L.; Zhu, X.; Ma, Y.; Li, Y.; Hou, Y.; Qiao, Y.; Wang, W. Clip2scene: Towards label-efficient 3d scene understanding by clip. In Proceedings of the IEEE/CVF Conference on Computer Vision and Pattern Recognition, Vancouver, BC, Canada, 17 –24 June 2023; pp. 7020–7030. [Google Scholar]
- Xie, E.; Wang, W.; Yu, Z.; Anandkumar, A.; Alvarez, J.M.; Luo, P. SegFormer: Simple and efficient design for semantic segmentation with transformers. Adv. Neural Inf. Process. Syst. 2021, 34, 12077–12090. [Google Scholar]
- Ji, S.; Wei, S.; Lu, M. Fully convolutional networks for multisource building extraction from an open aerial and satellite imagery data set. IEEE Trans. Geosci. Remote Sens. 2018, 57, 574–586. [Google Scholar] [CrossRef]
- Shi, Q.; Liu, M.; Li, S.; Liu, X.; Wang, F.; Zhang, L. A deeply supervised attention metric-based network and an open aerial image dataset for remote sensing change detection. IEEE Trans. Geosci. Remote Sens. 2021, 60, 1–16. [Google Scholar] [CrossRef]
- Long, J.; Shelhamer, E.; Darrell, T. Fully convolutional networks for semantic segmentation. In Proceedings of the IEEE Conference on Computer Vision and Pattern Recognition, Boston, MA, USA, 7–12 June 2015; pp. 3431–3440. [Google Scholar]
- Sugirtha, T.; Sridevi, M. Semantic segmentation using modified u-net for autonomous driving. In Proceedings of the 2022 IEEE International IOT, Electronics and Mechatronics Conference (IEMTRONICS), Toronto, ON, Canada, 1–4 June 2022; IEEE: Piscataway, NJ, USA, 2022; pp. 1–7. [Google Scholar]
- Seong, S.; Choi, J. Semantic segmentation of urban buildings using a high-resolution network (HRNet) with channel and spatial attention gates. Remote Sens. 2021, 13, 3087. [Google Scholar] [CrossRef]
- Zhuang, J.; Yang, J.; Gu, L.; Dvornek, N. Shelfnet for fast semantic segmentation. In Proceedings of the IEEE/CVF International Conference on Computer Vision Workshops, Seoul, Republic of Korea, 27–28 October 2019; pp. 847–856. [Google Scholar]
- Simonyan, K.; Zisserman, A. Very deep convolutional networks for large-scale image recognition. arXiv 2014, arXiv:1409.1556. [Google Scholar]
- He, K.; Zhang, X.; Ren, S.; Sun, J. Deep residual learning for image recognition. In Proceedings of the IEEE Conference on Computer Vision and Pattern Recognition, Las Vegas, NV, USA, 27–30 June 2016; pp. 770–778. [Google Scholar]
- Wang, J.; Sun, K.; Cheng, T.; Jiang, B.; Deng, C.; Zhao, Y.; Liu, D.; Mu, Y.; Tan, M.; Wang, X.; et al. Deep high-resolution representation learning for visual recognition. IEEE Trans. Pattern Anal. Mach. Intell. 2020, 43, 3349–3364. [Google Scholar] [CrossRef] [PubMed]
- Zheng, S.; Lu, J.; Zhao, H.; Zhu, X.; Luo, Z.; Wang, Y.; Fu, Y.; Feng, J.; Xiang, T.; Torr, P.H.; et al. Rethinking semantic segmentation from a sequence-to-sequence perspective with transformers. In Proceedings of the IEEE/CVF Conference on Computer Vision and Pattern Recognition, Virtual, 19–25 June 2021; pp. 6881–6890. [Google Scholar]
- Strudel, R.; Garcia, R.; Laptev, I.; Schmid, C. Segmenter: Transformer for semantic segmentation. In Proceedings of the IEEE/CVF International Conference on Computer Vision, Virtual, 11–17 October 2021; pp. 7262–7272. [Google Scholar]
- Chu, X.; Tian, Z.; Wang, Y.; Zhang, B.; Ren, H.; Wei, X.; Xia, H.; Shen, C. Twins: Revisiting the design of spatial attention in vision transformers. Adv. Neural Inf. Process. Syst. 2021, 34, 9355–9366. [Google Scholar]
- Dosovitskiy, A. An image is worth 16x16 words: Transformers for image recognition at scale. arXiv 2020, arXiv:2010.11929. [Google Scholar]
- Chen, L.C.; Papandreou, G.; Kokkinos, I.; Murphy, K.; Yuille, A.L. Deeplab: Semantic image segmentation with deep convolutional nets, atrous convolution, and fully connected crfs. IEEE Trans. Pattern Anal. Mach. Intell. 2017, 40, 834–848. [Google Scholar] [CrossRef]
- Chen, L.C. Rethinking atrous convolution for semantic image segmentation. arXiv 2017, arXiv:1706.05587. [Google Scholar]
- Chen, L.C.; Zhu, Y.; Papandreou, G.; Schroff, F.; Adam, H. Encoder-decoder with atrous separable convolution for semantic image segmentation. In Proceedings of the European Conference on Computer Vision (ECCV), Munich, Germany, 8–14 September 2018; pp. 801–818. [Google Scholar]
- Yuan, Y.; Chen, X.; Wang, J. Object-contextual representations for semantic segmentation. In Proceedings of the Computer Vision–ECCV 2020: 16th European Conference, Glasgow, UK, 23–28 August 2020; Proceedings, Part VI 16. Springer: Berlin/Heidelberg, Germany, 2020; pp. 173–190. [Google Scholar]
- Zhang, H.; Zhang, H.; Wang, C.; Xie, J. Co-occurrent features in semantic segmentation. In Proceedings of the IEEE/CVF Conference on Computer Vision and Pattern Recognition, Long Beach, CA, USA, 15–20 June 2019; pp. 548–557. [Google Scholar]
- Huang, Z.; Wang, X.; Wang, J.; Liu, W.; Wang, J. Weakly-supervised semantic segmentation network with deep seeded region growing. In Proceedings of the IEEE Conference on Computer Vision and Pattern Recognition, Salt Lake City, UT, USA, 18–22 June 2018; pp. 7014–7023. [Google Scholar]
- Kirillov, A.; Girshick, R.; He, K.; Dollár, P. Panoptic feature pyramid networks. In Proceedings of the IEEE/CVF Conference on Computer Vision and Pattern Recognition, Long Beach, CA, USA, 15–20 June 2019; pp. 6399–6408. [Google Scholar]
- Xiao, T.; Liu, Y.; Zhou, B.; Jiang, Y.; Sun, J. Unified perceptual parsing for scene understanding. In Proceedings of the European Conference on Computer Vision (ECCV), Munich, Germany, 8–14 September 2018; pp. 418–434. [Google Scholar]
- Zhou, Z.; Lei, Y.; Zhang, B.; Liu, L.; Liu, Y. Zegclip: Towards adapting clip for zero-shot semantic segmentation. In Proceedings of the IEEE/CVF Conference on Computer Vision and Pattern Recognition, Vancouver, BC, Canada, 18–22 June 2023; pp. 11175–11185. [Google Scholar]
- He, W.; Jamonnak, S.; Gou, L.; Ren, L. Clip-s4: Language-guided self-supervised semantic segmentation. In Proceedings of the IEEE/CVF Conference on Computer Vision and Pattern Recognition, Vancouver, BC, Canada, 18–22 June 2023; pp. 11207–11216. [Google Scholar]
- Ma, X.; Wu, Q.; Zhao, X.; Zhang, X.; Pun, M.O.; Huang, B. Sam-assisted remote sensing imagery semantic segmentation with object and boundary constraints. IEEE Trans. Geosci. Remote Sens. 2024, 62, 1–16. [Google Scholar] [CrossRef]
- Deng, J.; Dong, W.; Socher, R.; Li, L.J.; Li, K.; Fei-Fei, L. Imagenet: A large-scale hierarchical image database. In Proceedings of the 2009 IEEE Conference on Computer Vision and Pattern Recognition, Miami, FL, USA, 20–25 June 2009; IEEE: Piscataway, NJ, USA, 2009; pp. 248–255. [Google Scholar]
- Parelius, E.J. A review of deep-learning methods for change detection in multispectral remote sensing images. Remote Sens. 2023, 15, 2092. [Google Scholar] [CrossRef]
- Ronneberger, O.; Fischer, P.; Brox, T. U-net: Convolutional networks for biomedical image segmentation. In Proceedings of the Medical Image Computing and Computer-Assisted Intervention–MICCAI 2015: 18th International Conference, Munich, Germany, 5–9 October 2015; proceedings, part III 18. Springer: Berlin/Heidelberg, Germany, 2015; pp. 234–241. [Google Scholar]
- LeCun, Y.; Bengio, Y.; Hinton, G. Deep learning. Nature 2015, 521, 436–444. [Google Scholar] [CrossRef]
- Glorot, X.; Bordes, A.; Bengio, Y. Deep sparse rectifier neural networks. In Proceedings of the Fourteenth International Conference on Artificial Intelligence and Statistics. JMLR Workshop and Conference Proceedings, Fort Lauderdale, FL, USA, 11–13 April 2011; pp. 315–323. [Google Scholar]
- Zhu, J.; Liao, S.; Yi, D.; Lei, Z.; Li, S.Z. Multi-label cnn based pedestrian attribute learning for soft biometrics. In Proceedings of the 2015 International Conference on Biometrics (ICB), Phuket, Thailand, 19–22 May 2015; IEEE: Piscataway, NJ, USA, 2015; pp. 535–540. [Google Scholar]
- Kingma, D.P. Adam: A method for stochastic optimization. arXiv 2014, arXiv:1412.6980. [Google Scholar]
- Dong, S.; Wang, L.; Du, B.; Meng, X. ChangeCLIP: Remote sensing change detection with multimodal vision-language representation learning. ISPRS J. Photogramm. Remote Sens. 2024, 208, 53–69. [Google Scholar] [CrossRef]


| Category | Subcategory |
|---|---|
| Buildings | Residential buildings, Commercial buildings, Factory buildings, |
| Church, Building | |
| Forest | Tree, Forest Regrowth, Riparian Forest, Planted Forest, |
| Evergreen Trees, Deciduous Trees, Sparse Forest, Dense Forest | |
| Transportation | Truck, Cars, Ship, Trains, Airplane |
| Surface water | Lake, Sea, River, Reservoir, Wetlands, Canal |
| Roadway | Bridge, Freeway, Harbor, Runway, Railway, Road, Highway. |
| Sports | Basketball Court, Ground Track Field, Stadium, Tennis Court, Golf Course |
| Others | Container, Island, Snow Land, Pond, Fertile Land, Beach, |
| Square, Parking Lot, Park |
| Method | Year | Structure | P ↑ | R ↑ | F1 ↑ | IoU ↑ | OA ↑ |
|---|---|---|---|---|---|---|---|
| FC-EF [18] | 2018 | CNN | 86.37 | 83.54 | 82.35 | 71.80 | 96.97 |
| FC-Siam-Di [18] | 2018 | CNN | 89.53 | 83.31 | 86.31 | 75.92 | 98.67 |
| FC-Siam-Conc [18] | 2018 | CNN | 91.99 | 76.77 | 83.69 | 71.96 | 98.49 |
| STANet [23] | 2020 | CNN+Attention | 83.81 | 91.00 | 87.26 | 77.40 | 98.66 |
| IFNet [24] | 2020 | CNN | 83.77 | 80.32 | 82.29 | 70.97 | 98.61 |
| SNUNet-CD [25] | 2021 | CNN + Attention | 89.18 | 87.17 | 88.16 | 78.83 | 98.82 |
| BIT [28] | 2021 | CNN + Transformer | 89.24 | 89.37 | 89.31 | 80.68 | 98.62 |
| TransUNetCD [30] | 2022 | CNN + Transformer | 92.43 | 89.82 | 91.11 | 83.67 | - |
| ChangeFormer [36] | 2022 | Transformer | 92.05 | 88.80 | 90.40 | 82.48 | 99.04 |
| StransUNet [31] | 2022 | CNN + Transformer | 92.30 | 90.55 | 91.41 | 84.19 | 99.13 |
| ICIF-Net [29] | 2023 | CNN + Transformer | 87.79 | 80.88 | 83.65 | 71.89 | 98.73 |
| AMCA [32] | 2023 | CNN + Transformer | 91.82 | 90.67 | 91.48 | 83.39 | 98.73 |
| DMINet [26] | 2023 | CNN | 92.52 | 89.94 | 90.71 | 82.99 | 99.07 |
| GCD-DDPM [37] | 2024 | CNN | 90.68 | 91.24 | 90.96 | 83.56 | 99.14 |
| GCFormer [34] | 2024 | CNN + Transformer | 89.34 | 92.50 | 90.83 | 83.21 | 99.08 |
| LSC-CD | - | Transformer | 93.31 | 90.69 | 92.01 | 85.15 | 99.19 |
| Method | Year | Structure | P ↑ | R ↑ | F1 ↑ | IoU ↑ | OA ↑ |
|---|---|---|---|---|---|---|---|
| FC-EF [18] | 2018 | CNN | 83.50 | 86.33 | 84.89 | 73.74 | 98.87 |
| FC-Siam-Di [18] | 2018 | CNN | 90.86 | 84.69 | 87.67 | 78.04 | 99.13 |
| FC-Siam-Conc [18] | 2018 | CNN | 84.02 | 87.72 | 85.83 | 75.18 | 98.94 |
| STANet [23] | 2020 | CNN+Attention | 79.37 | 85.50 | 82.32 | 69.95 | 98.52 |
| IFNet [24] | 2020 | CNN | 96.91 | 73.19 | 83.40 | 71.52 | 98.83 |
| SNUNet-CD [25] | 2021 | CNN + Attention | 85.60 | 81.49 | 83.50 | 71.67 | 98.71 |
| BIT [28] | 2021 | CNN + Transformer | 82.04 | 89.74 | 85.71 | 75.00 | 98.62 |
| TransUNetCD [30] | 2022 | CNN + Transformer | 93.59 | 89.60 | 91.60 | 84.42 | - |
| ChangeFormer [36] | 2022 | Transformer | 91.83 | 88.02 | 89.88 | 81.63 | 99.12 |
| StransUNet [31] | 2022 | CNN + Transformer | 93.21 | 90.15 | 91.65 | 84.59 | 99.29 |
| ICIF-Net [29] | 2023 | CNN + Transformer | 90.79 | 87.58 | 89.16 | 80.43 | 99.01 |
| AMCA [32] | 2023 | CNN + Transformer | 91.37 | 81.90 | 86.38 | 75.13 | 95.97 |
| DMINet [26] | 2023 | CNN | 93.84 | 86.25 | 88.69 | 79.68 | 98.97 |
| GCD-DDPM [37] | 2024 | CNN | 92.79 | 92.26 | 92.54 | 86.52 | 99.39 |
| GCFormer [34] | 2024 | CNN | 91.81 | 90.15 | 90.97 | 83.43 | 99.29 |
| LSC-CD | - | Transformer | 96.32 | 93.18 | 94.75 | 89.98 | 99.59 |
| Method | Year | Structure | P ↑ | R ↑ | F1 ↑ | IoU ↑ | OA ↑ |
|---|---|---|---|---|---|---|---|
| FC-EF [18] | 2018 | CNN | 76.47 | 75.17 | 75.81 | 61.04 | 88.69 |
| FC-Siam-Di [18] | 2018 | CNN | 76.28 | 75.30 | 75.79 | 61.01 | 88.65 |
| FC-Siam-Conc [18] | 2018 | CNN | 73.67 | 76.75 | 75.18 | 60.23 | 88.05 |
| IFNet [24] | 2020 | CNN | 82.44 | 72.38 | 76.38 | 61.85 | - |
| SNUNet-CD [25] | 2021 | CNN + Attention | 83.58 | 75.87 | 79.54 | 66.02 | 90.79 |
| BIT [28] | 2021 | CNN + Transformer | 81.42 | 77.90 | 78.32 | 64.37 | 90.26 |
| TransUNetCD [30] | 2022 | CNN + Transformer | 82.59 | 77.73 | 80.09 | 66.79 | 90.88 |
| ChangeFormer [36] | 2022 | Transformer | 81.70 | 72.38 | 76.76 | 62.29 | 76.76 |
| ICIF-Net [29] | 2023 | CNN + Transformer | 83.37 | 78.51 | 80.74 | 68.12 | 91.24 |
| LSC-CD | - | Transformer | 88.64 | 75.06 | 81.29 | 68.47 | 91.85 |
| Method | P ↑ | R ↑ | F1 ↑ | IoU ↑ | OA ↑ |
|---|---|---|---|---|---|
| baseline | 92.05 | 88.80 | 90.40 | 82.48 | 99.04 |
| baseline + CLIP | 91.78 | 89.92 | 90.84 | 83.22 | 99.08 |
| baseline + CLIP + CAM | 91.36 | 90.80 | 91.08 | 83.62 | 99.09 |
| baseline + CLIP + CAM + SCM | 93.44 | 90.08 | 91.69 | 84.66 | 99.16 |
| baseline + CLIP + CAM + SCM + SEUM | 93.31 | 90.69 | 92.01 | 85.15 | 99.19 |
| Method | Year | P ↑ | R ↑ | F1 ↑ | IoU ↑ | OA ↑ |
|---|---|---|---|---|---|---|
| ChangeCLIP(ViT-B/16) | 2024 | 93.68 | 89.04 | 91.30 | 83.99 | 99.14 |
| LSC-CD(ViT-B/16) | 2024 | 93.31 | 90.69 | 92.01 | 85.15 | 99.19 |
Disclaimer/Publisher’s Note: The statements, opinions and data contained in all publications are solely those of the individual author(s) and contributor(s) and not of MDPI and/or the editor(s). MDPI and/or the editor(s) disclaim responsibility for any injury to people or property resulting from any ideas, methods, instructions or products referred to in the content. |
© 2024 by the authors. Licensee MDPI, Basel, Switzerland. This article is an open access article distributed under the terms and conditions of the Creative Commons Attribution (CC BY) license (https://creativecommons.org/licenses/by/4.0/).
Share and Cite
Hu, S.; Bian, Y.; Chen, B.; Song, H.; Zhang, K. Language-Guided Semantic Clustering for Remote Sensing Change Detection. Sensors 2024, 24, 7887. https://doi.org/10.3390/s24247887
Hu S, Bian Y, Chen B, Song H, Zhang K. Language-Guided Semantic Clustering for Remote Sensing Change Detection. Sensors. 2024; 24(24):7887. https://doi.org/10.3390/s24247887
Chicago/Turabian StyleHu, Shenglong, Yiting Bian, Bin Chen, Huihui Song, and Kaihua Zhang. 2024. "Language-Guided Semantic Clustering for Remote Sensing Change Detection" Sensors 24, no. 24: 7887. https://doi.org/10.3390/s24247887
APA StyleHu, S., Bian, Y., Chen, B., Song, H., & Zhang, K. (2024). Language-Guided Semantic Clustering for Remote Sensing Change Detection. Sensors, 24(24), 7887. https://doi.org/10.3390/s24247887