
Intelligent Transducer for Temperature Measurement with Two-Wire or Three-Wire Platinum RTD

 ,
,  , , and
Abstract
1. Introduction
2. The Concept of an Intelligent Temperature Transducer
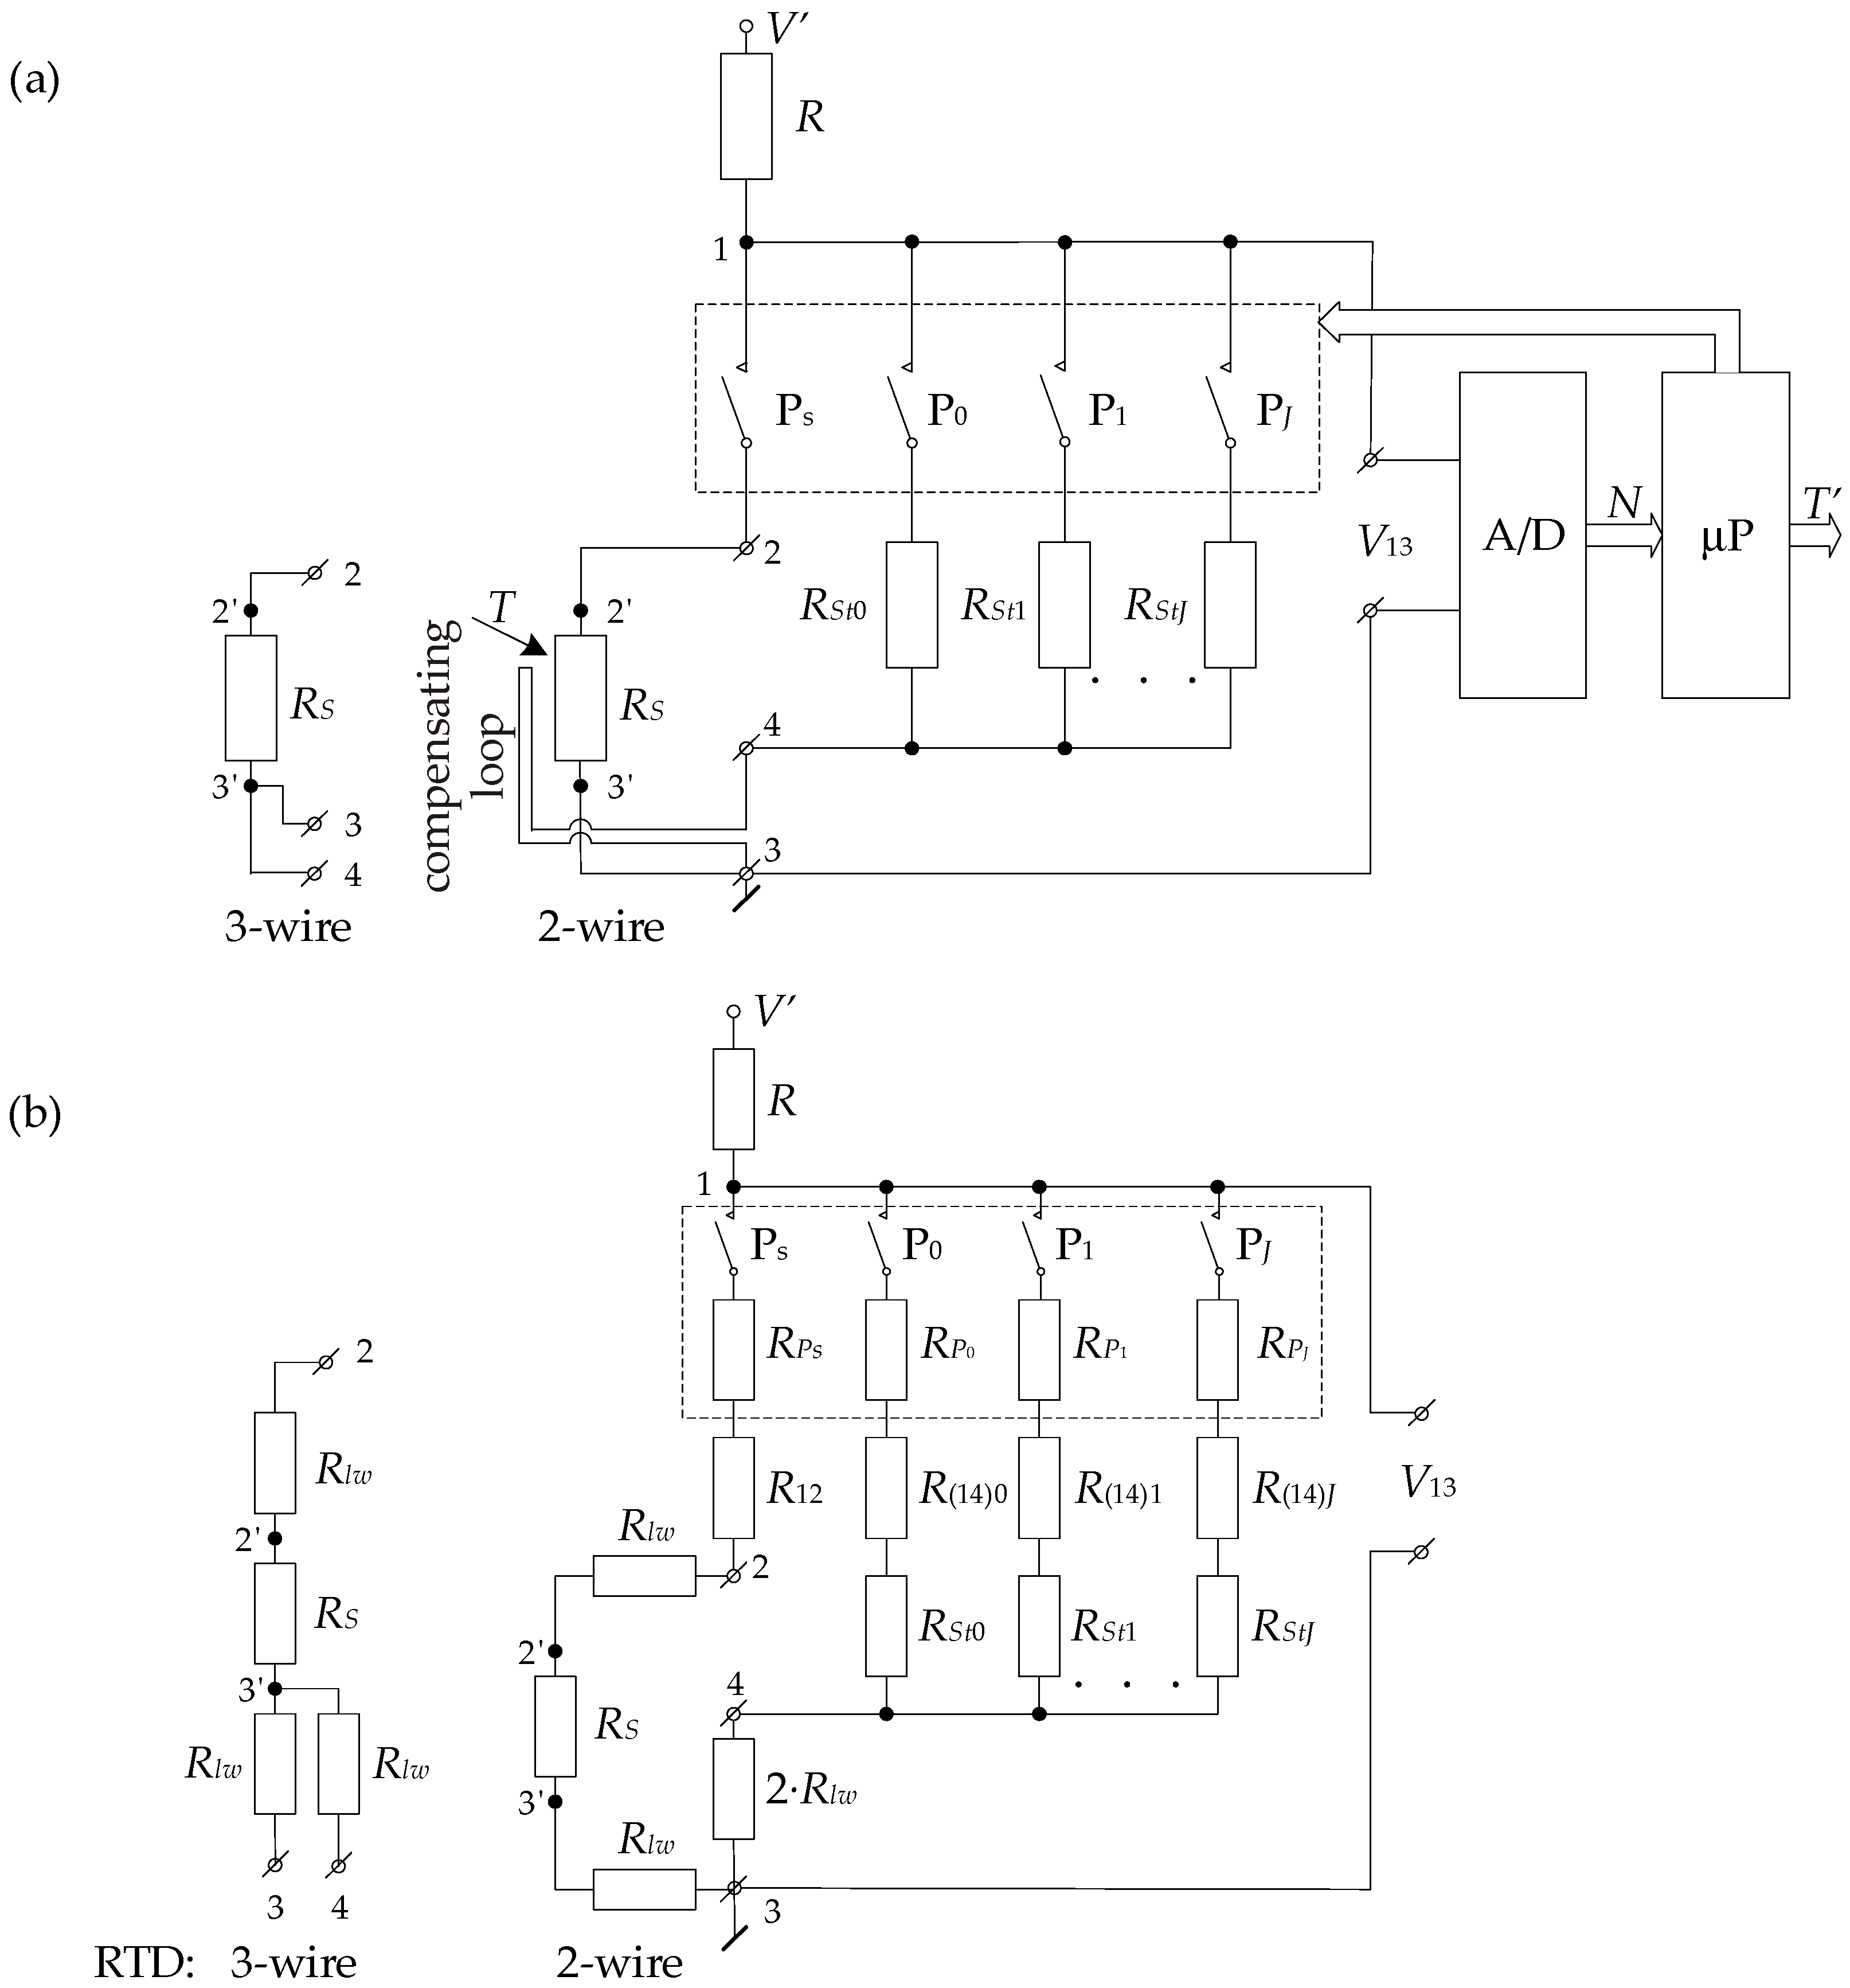
2.1. Circuit Diagram and General Principle of Operation of the ITT
- A circuit for processing the RTD resistance RS into voltage V13_S, consisting of a PS switch, which is powered from the voltage source V′ through a resistor R: The value of the V13_S voltage is determined by the formula
- An auto-calibration circuit, powered by a voltage source V′ through a resistor R, containing standard resistors (from RSt0 to RStJ): These resistors are switched on accordingly by switches (P0…PJ). The number of standard resistors and their resistance values depend on the adopted degree (J) of the polynomial describing the processing characteristics of the entire measurement circuit (Figure 1), as discussed further in this section. A compensation loop is included in series with the standard resistor RStj (j = 0…J) between points 3 and 4, whose task is to compensate the sum of the connection line resistance between points 2–2′ and 3–3′ (resistance of the RTD sensor wires) [28]. The V13_Stj voltage value is determined by the equation
- The other ITT circuits are as follows:
- An analog-to-digital (A/D) converter that converts V13 analog voltages to a digital representation;
- A microprocessor (μP) that properly controls the operation of the RS/V13_S and auto-calibration circuits and calculates the value of the measured temperature (T′).
- The adopted number of standard resistors and their values, accuracy (tolerances), and temperature coefficients (TCRs);
- Condition (4) is satisfied;
- The resolution and nonlinearity of the A/D converter and distortion in the form of noise [29] occurring in the ITT.
2.2. ITT Properties
2.2.1. Effectiveness of Minimizing the Influence of Linearity, Zero, Gain, and Power Supply Errors on Temperature Measurement Results
- The temperature measurement range was 0–200 °C.
- RTD (Pt1000) resistance was determined by the formula [4]
- In the simulation process, the temperature values T were set with an increment of 0.1 °C.
- In the circuits RS/V13_S and RS/V13_Stj, a resistor R with a nominal value equal to R = 7060 Ω and TCRR = 200 ppm/°C was used.
- The nominal supply voltage of the basic part of the measuring circuit was V′ = 5 V.
- The ambient temperature (Ta) of the standard resistors (Ta(RStj)) and the rest of the ITT circuit under nominal conditions was 25 °C.
- Condition (4) was satisfied.
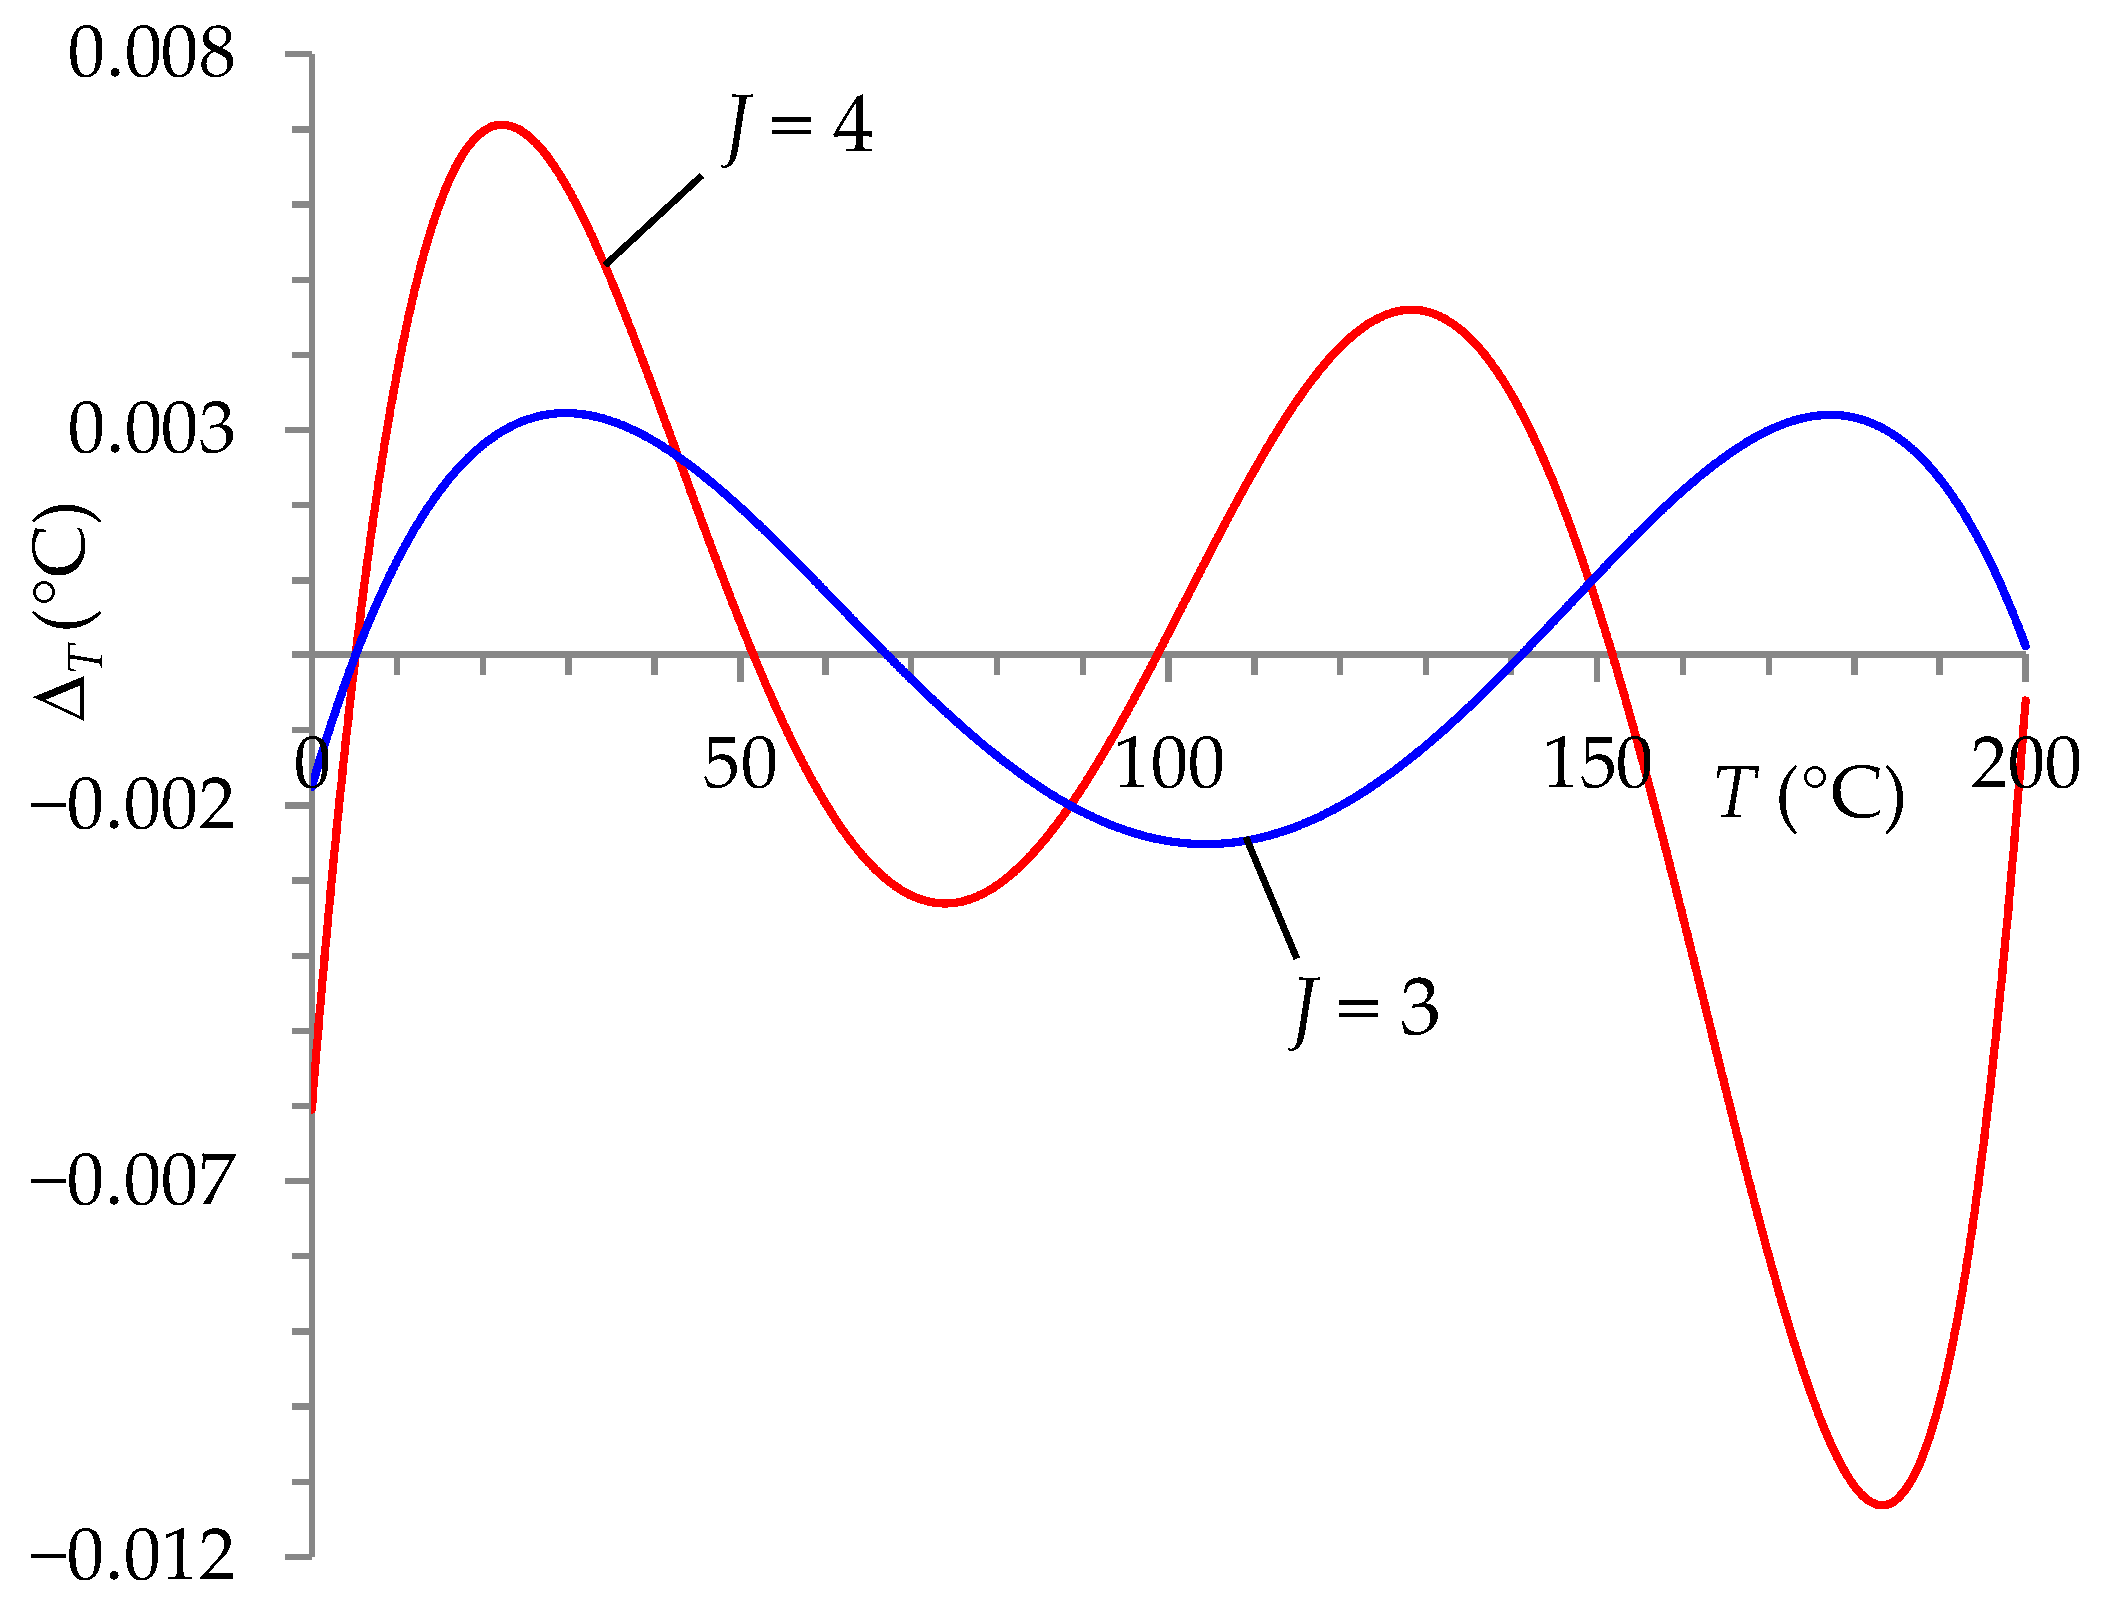
- ΔT ∈ (−0.11, 0.097) °C for J = 2,
- ΔT ∈ (−0.0026, 0.0033) °C for J = 3,
- ΔT ∈ (−0.00013, 0.000093) °C for J = 4.
- A polynomial of degree J = 3 was chosen for further research. For this polynomial, the error values of the presented ITT were smaller than those obtained for the transducer described in [13] (Figure 2) for J = 4 (ΔT ∈ (−0.011, 0.007) °C). Adopting such a solution (J = 3) allowed simplifying the auto-calibration circuit in the ITT, easier implementation of the auto-calibration procedure in μP, and shortening the running time of the procedure.
- RSt0 = 1020 Ω→TSt0 = 5.121 °C;
- RSt1 = 1260 Ω→TSt1 = 67.192 °C;
- RSt2 = 1540 Ω→TSt2 = 141.110 °C;
- RSt3 = 1760 Ω→TSt3 = 200.392 °C.
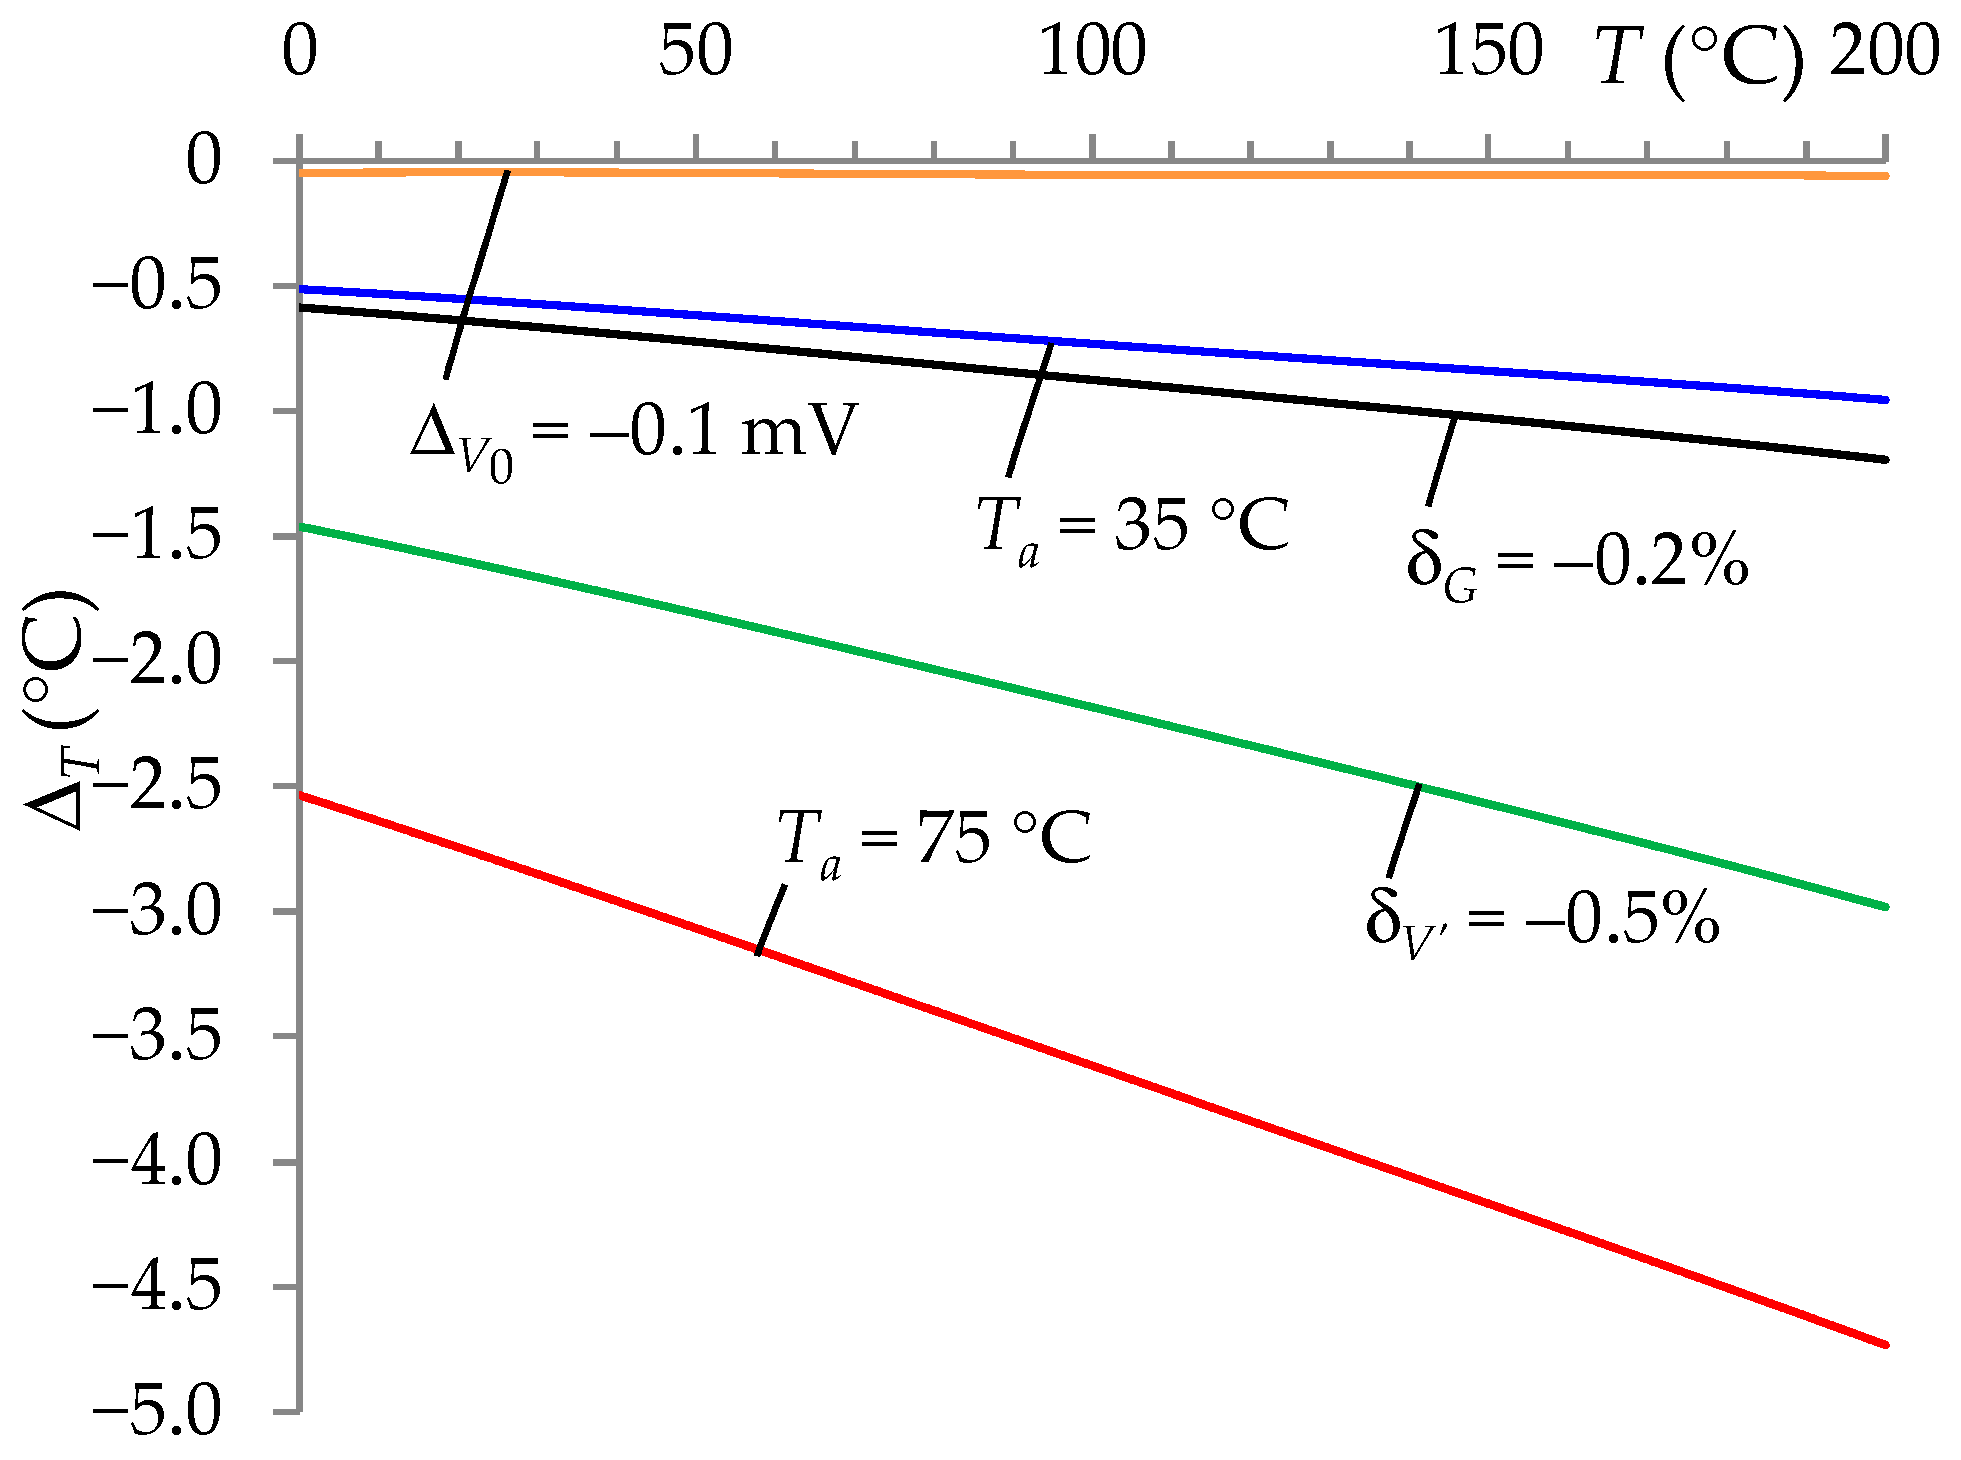
- For example, see the following cases:
- If ambient temperature (Ta) was changed from the nominal value of 25 °C to 35 °C affecting the resistor R with the value TCRR = 200 ppm/°C, then the maximum error of ΔT in the range 0–200 °C was −0.96 °C for Ta = 35 °C and −4.8 °C for Ta = 75 °C.
- If the RS/V13_S and RStj/V13_Stj circuits’ supply voltage (V′) was changed by −0.5% concerning the nominal value, then the maximum error of ΔT was −3.0 °C.
- If the offset voltage (V0) was changed from 0 mV to −0.1 mV, then the maximum error of ΔT was −0.061 °C.
- If the gain error was changed from 0 to –0.2%, then the maximum error of ΔT was −1.2 °C.
- Zero and gain errors came from the A/D converter.
- The voltage V′ by –0.5%;
- The A/D converter offset voltage (U0) from 0 mV to –0.1 mV;
- The A/D converter gain error from 0 to –0.2%.
- The results of the influence of changes in Ta, V′, V0, and gain on the ΔT error, presented for all analyzed cases, proved that the auto-calibration procedure worked very well. Obtaining such a high efficiency of the auto-calibration procedure required ensuring that its execution time was short enough so that changes in environmental conditions had a negligible impact on the elements of the measurement track.
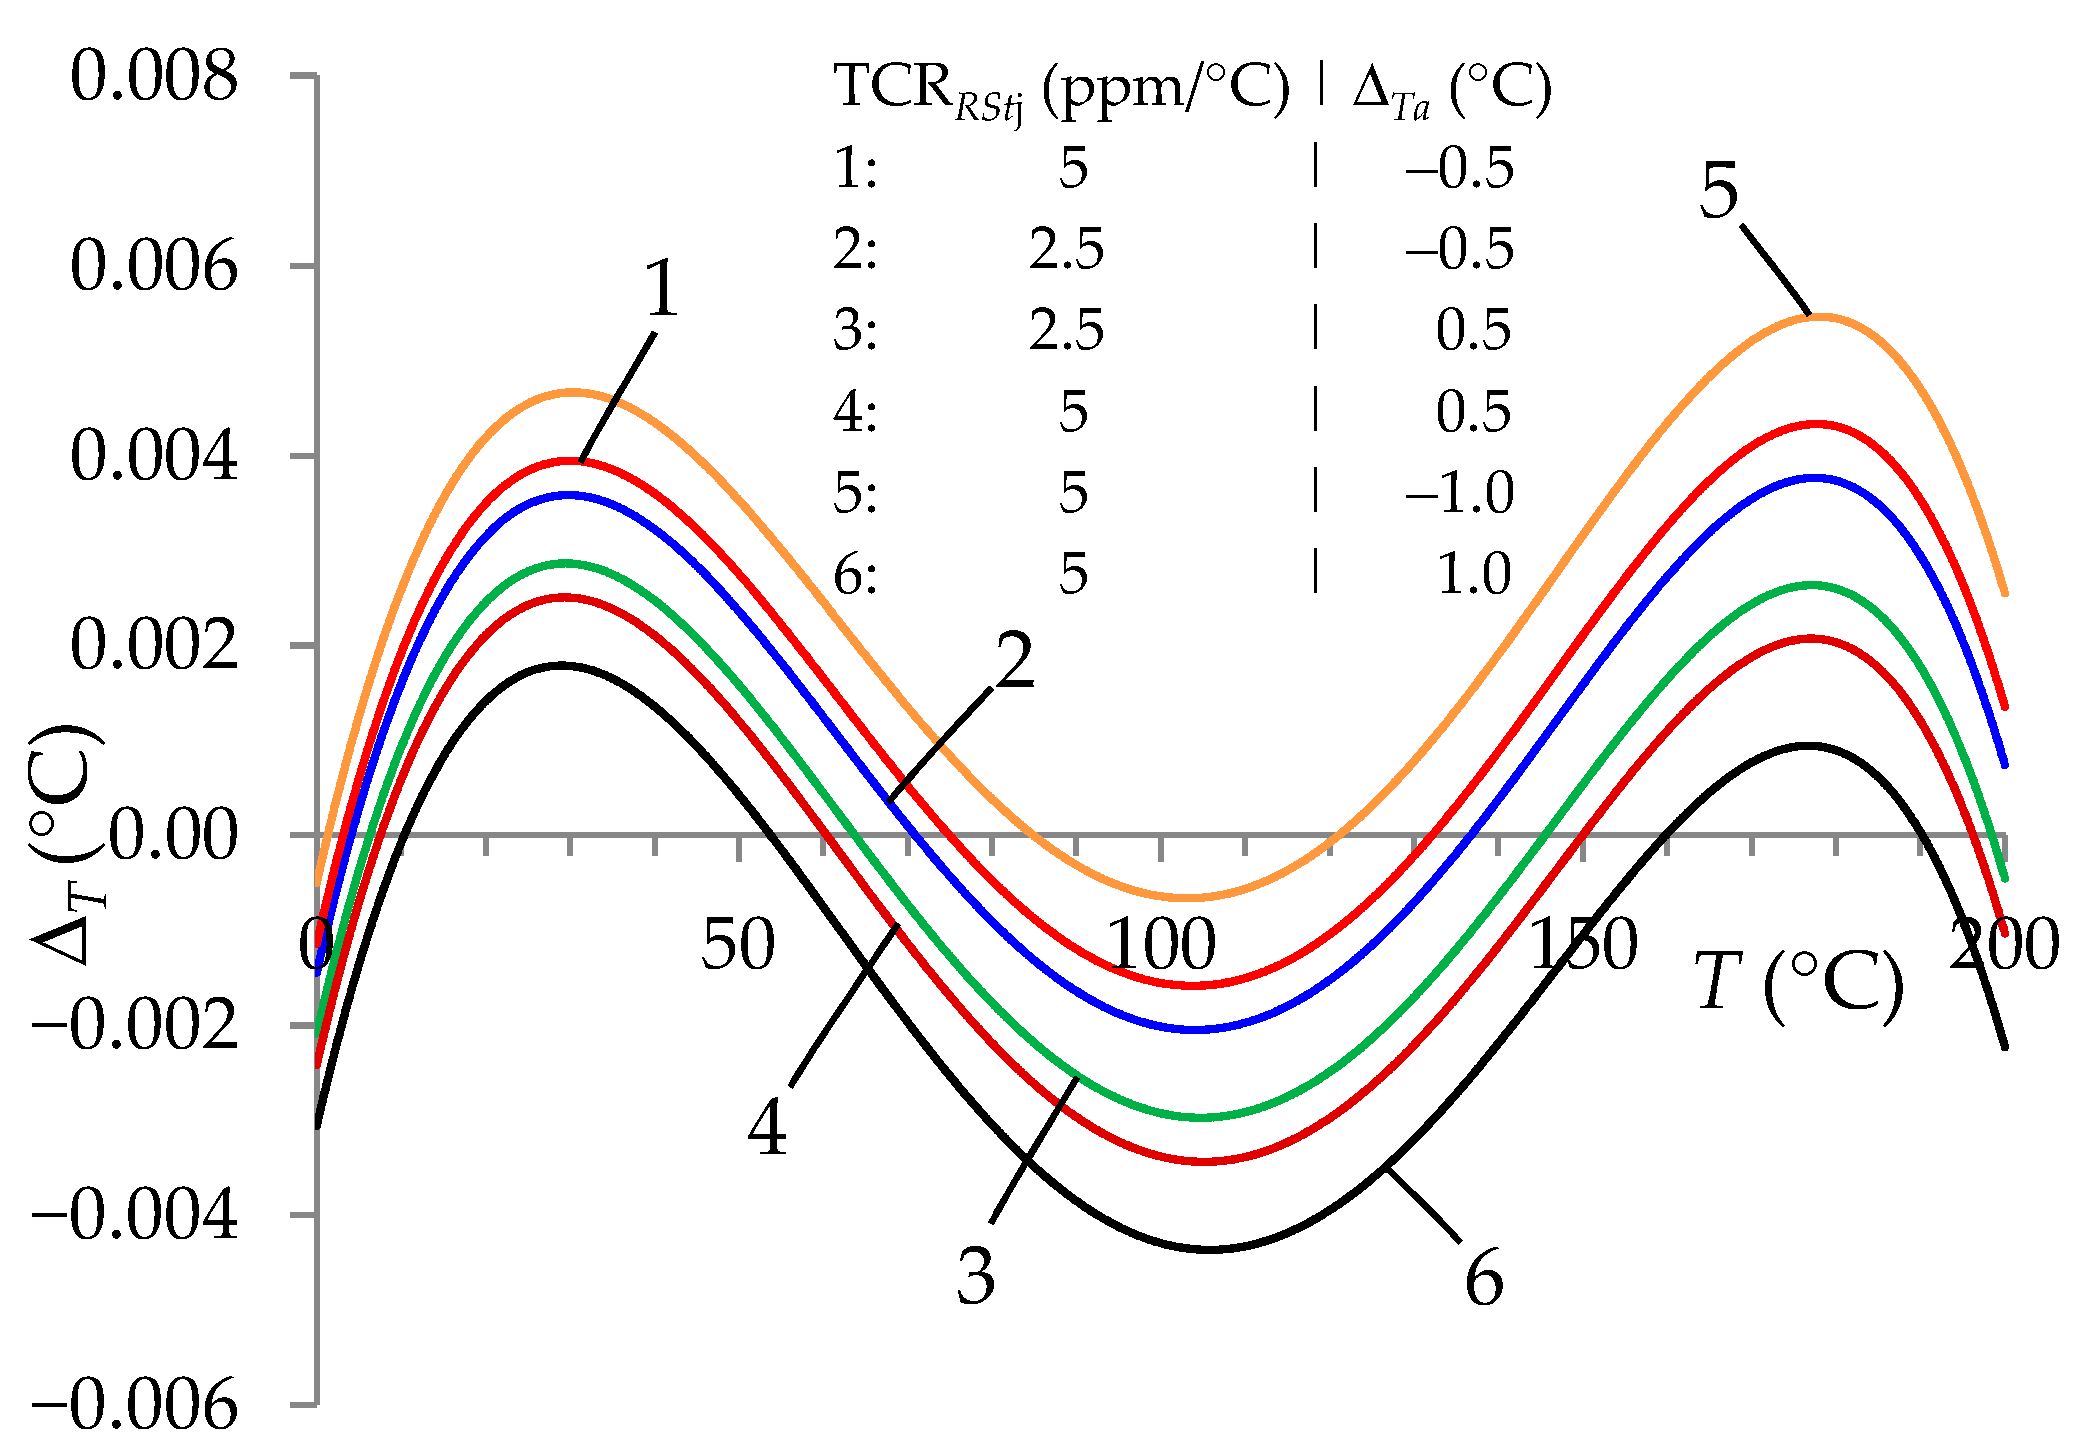
2.2.2. The Influence of Measurement Channel Components on the Accuracy of Temperature Measurement
- The choice of lower TCRRStj values and higher accuracy of measurement of the ambient temperature of the standard resistors (Ta) only slightly changed the accuracy of T measurement. These were changes at the level of ten thousandths of °C.
3. Realization of the Concept of an Intelligent Temperature Transducer
3.1. Materials
- Four 50 cm long copper wires: Two of them were used to lead RS to the measurement system (ITT), and the other two connected in series constituted a compensation loop (2Rlw).
- A printed circuit board containing the RS/V13_S circuit and auto-calibration circuit (RS/V13_Stj), as follows:
- −
- The RS/V13_S circuit and auto-calibration circuit (RS/V13_Stj) were made of a resistor R = 7060 Ω with a tolerance of 1% and standard resistors (from RSt0 do RSt3) type RWE 0207 with a coefficient TCRRStj = 5 ppm/°C. The accuracy of the resistor R did not influence the measurement results T in the ITT. However, the accuracy of the standard resistors was important. For this reason, the values of the standard resistors were measured in a four-wire configuration with an Agilent 3458A multimeter with a limit error of δRStj = ±0.002% (for a two-year calibration cycle). The following results were obtained: 1020.070 Ω, 1259.797 Ω, 1539.392 Ω, and 1759.317 Ω.
- −
- The RS/V13_S circuit and auto-calibration circuit (RS/V13_Stj) contained reed switches (DIP05–1A72–12A [44]), which, unlike semiconductor switches, were characterized by low on-state resistance and relatively small scatter of their resistances.
- −
- The resistances Rl_S and Rl_Stj (including the resistances of the reed switches, sensor wire, compensation loop, and other component connections of the RS/V13_S circuit and auto-calibration circuit), measured with a Thomson bridge, were each 0.12 Ω, and the scatter between these values (Δl_Stj,S) did not exceed 0.01 Ω.
- An Inmel SQ10 calibrator powering the RS/V13_S circuit and the auto-calibration circuit with a voltage of V′ = 5 V with a measured short-time instability of δV′ = ±10 ppm.
- An Agilent 3458A multimeter for measuring the V13 voltage with a measurement base error of ΔV13 = δ1V13 + Δ1 = 14∙10−6 V13 + 0.3 µV on a measuring range of ±1 V. It performed the tasks of an A/D converter (Figure 1). The digital voltmeter was made of many elements. In the measurement path, it contained a filter, an amplifier and an A/D converter. The complex construction of the voltmeter meant that its base error did not only result from the resolution of the A/D converter used. In the T measurement, the influence of the first component of the base error (δ1), which was of a constant nature, was minimized as a result of the auto-calibration procedure. The second component (Δ1), which was of a random nature, was more important. If this value were to be compared with the quantization error of the A/D converter used alone, it would correspond to a converter resolution of between 22 and 23 bits for the 0–1 V range. Additional errors of the voltmeter given by the manufacturer were as follows: the RMS noise was 0.02 ppm of range, the gain error was 0.01 ppm of reading, and nonlinearity was 0.3 ppm of reading and 0.1 ppm of range. These errors had a negligible effect on the accuracy of the T measurement at the level of 0.01 °C (see Section 2.2).
- A personal computer (PC) that performed the auto-calibration procedure, including the ability to calculate the temperature based on the results of voltage measurements obtained with the 3458A multimeter.
- The ambient temperature of the standard resistors and the remaining part of the circuit (Ta) during the measurements was 23 °C and did not exceed the error ΔTa = ±1 °C.
3.2. Results of Simulation and Experimental Studies
4. Conclusions
- Four standard resistors (RStj) with an accuracy of ±0.002% and TCRRStj = 5 ppm/°C along with a sensor measuring the ambient temperature with an error of no more than ±1 °C;
- A connection circuit in which the line resistances fulfill the condition Rl_S = Rl_Stj with an error of no more than ±0.01 Ω;
- A circuit for converting analog voltage V13 to a digital form with a total error (resulting from noise, quantization, and nonlinearity) no greater than 6 ppm.
- It should be mentioned that the use of standard resistors with an accuracy of ±0.002% in the ITT does not require the purchase of expensive resistors with a tolerance of ±0.002%. As presented in the work, these may be resistors with a much smaller tolerance, the resistances of which should be measured with an accuracy of ±0.002%. The 3458A multimeter used for this purpose makes it possible to obtain this accuracy during its two-year calibration cycle. More frequent calibration allows for even higher accuracies, e.g., ±0.00125% for 1 year.
Author Contributions
Funding
Institutional Review Board Statement
Informed Consent Statement
Data Availability Statement
Conflicts of Interest
Appendix A

| Type of Test | Parameters | New ITT | Previous ITT |
|---|---|---|---|
| ΔT_max or UT_max (°C) | |||
| Tests under nominal conditions | T = 0…200 °C | 0.0033 * | 0.011 * |
| Tests for changed ambient temperature | Ta = 75 °C; TCRRStj = 5 ppm/°C; ΔTa(RStj) = 1 °C; T = 0…200 °C | 0.0055 * | 0.014 * |
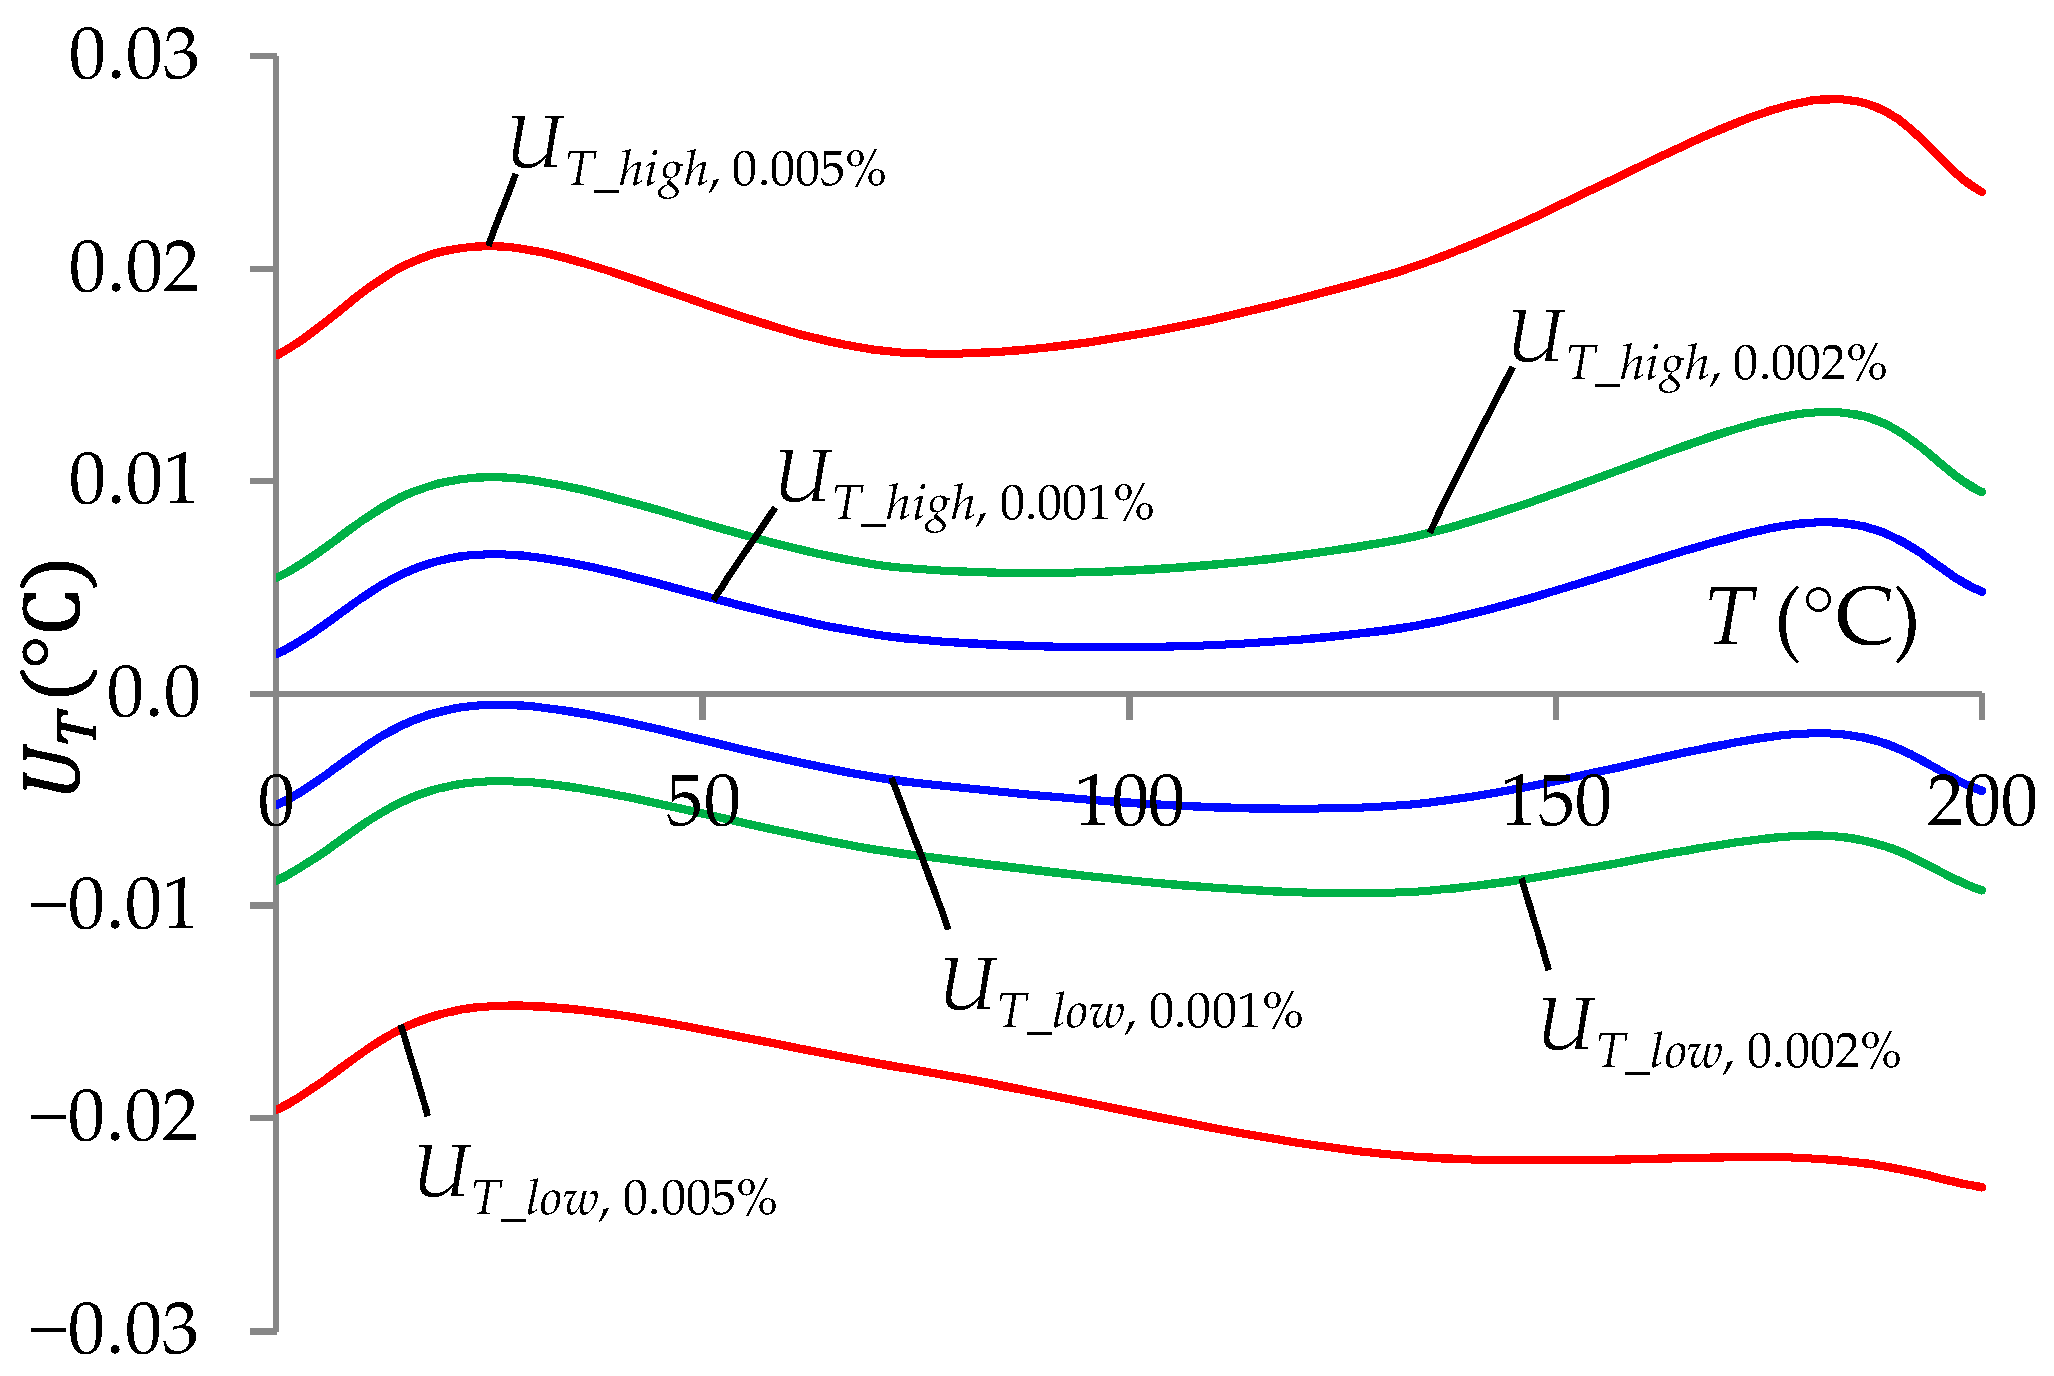
| Analysis of the influence of tolerances on standard resistors | δRStj = 0.002%; T = 0…200 °C | 0.014 ** | 0.026 ** |
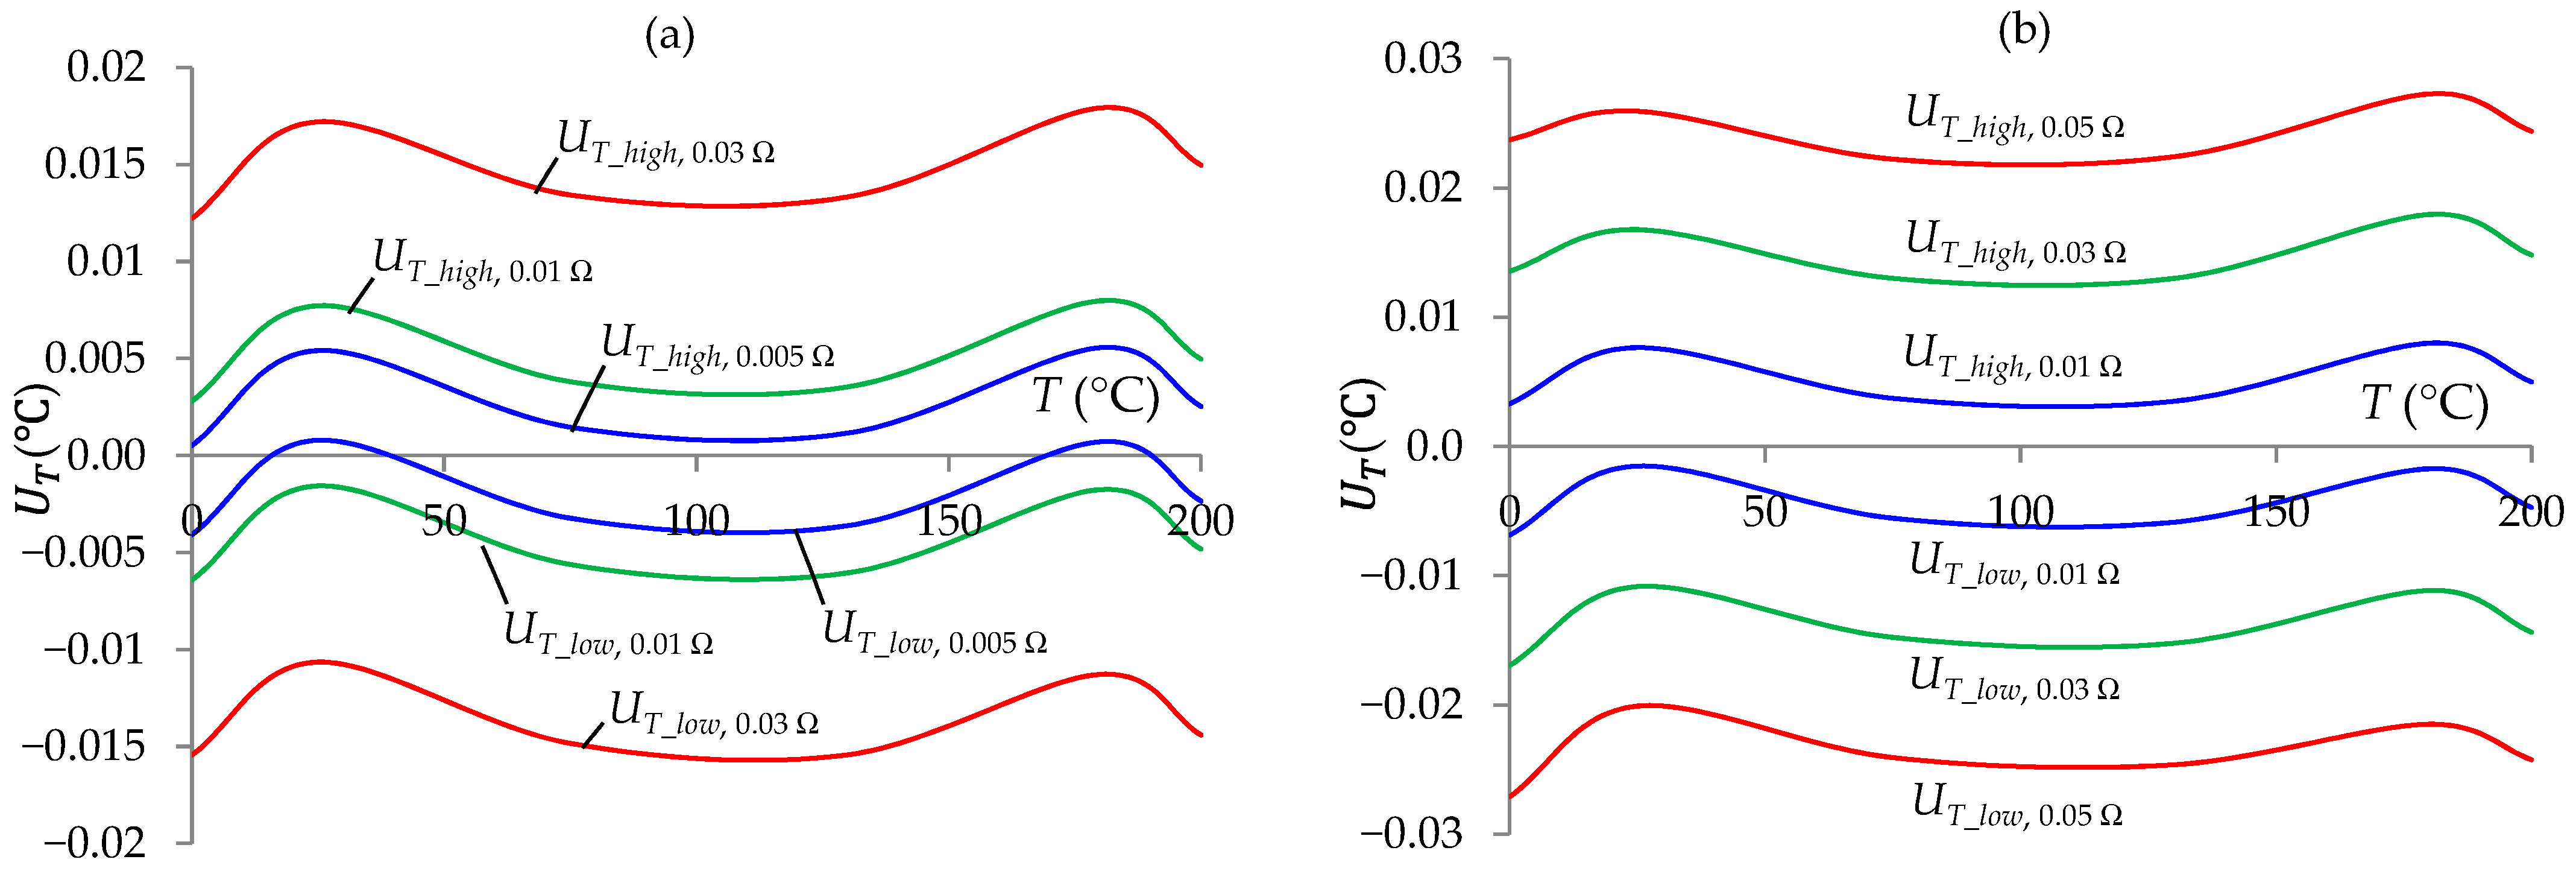
| Analysis of the influence of the resistance of the connecting circuit | Δl_Stj,S = 0.01 Ω; T = 0…200 °C | 0.0080 ** | 0.017 ** |
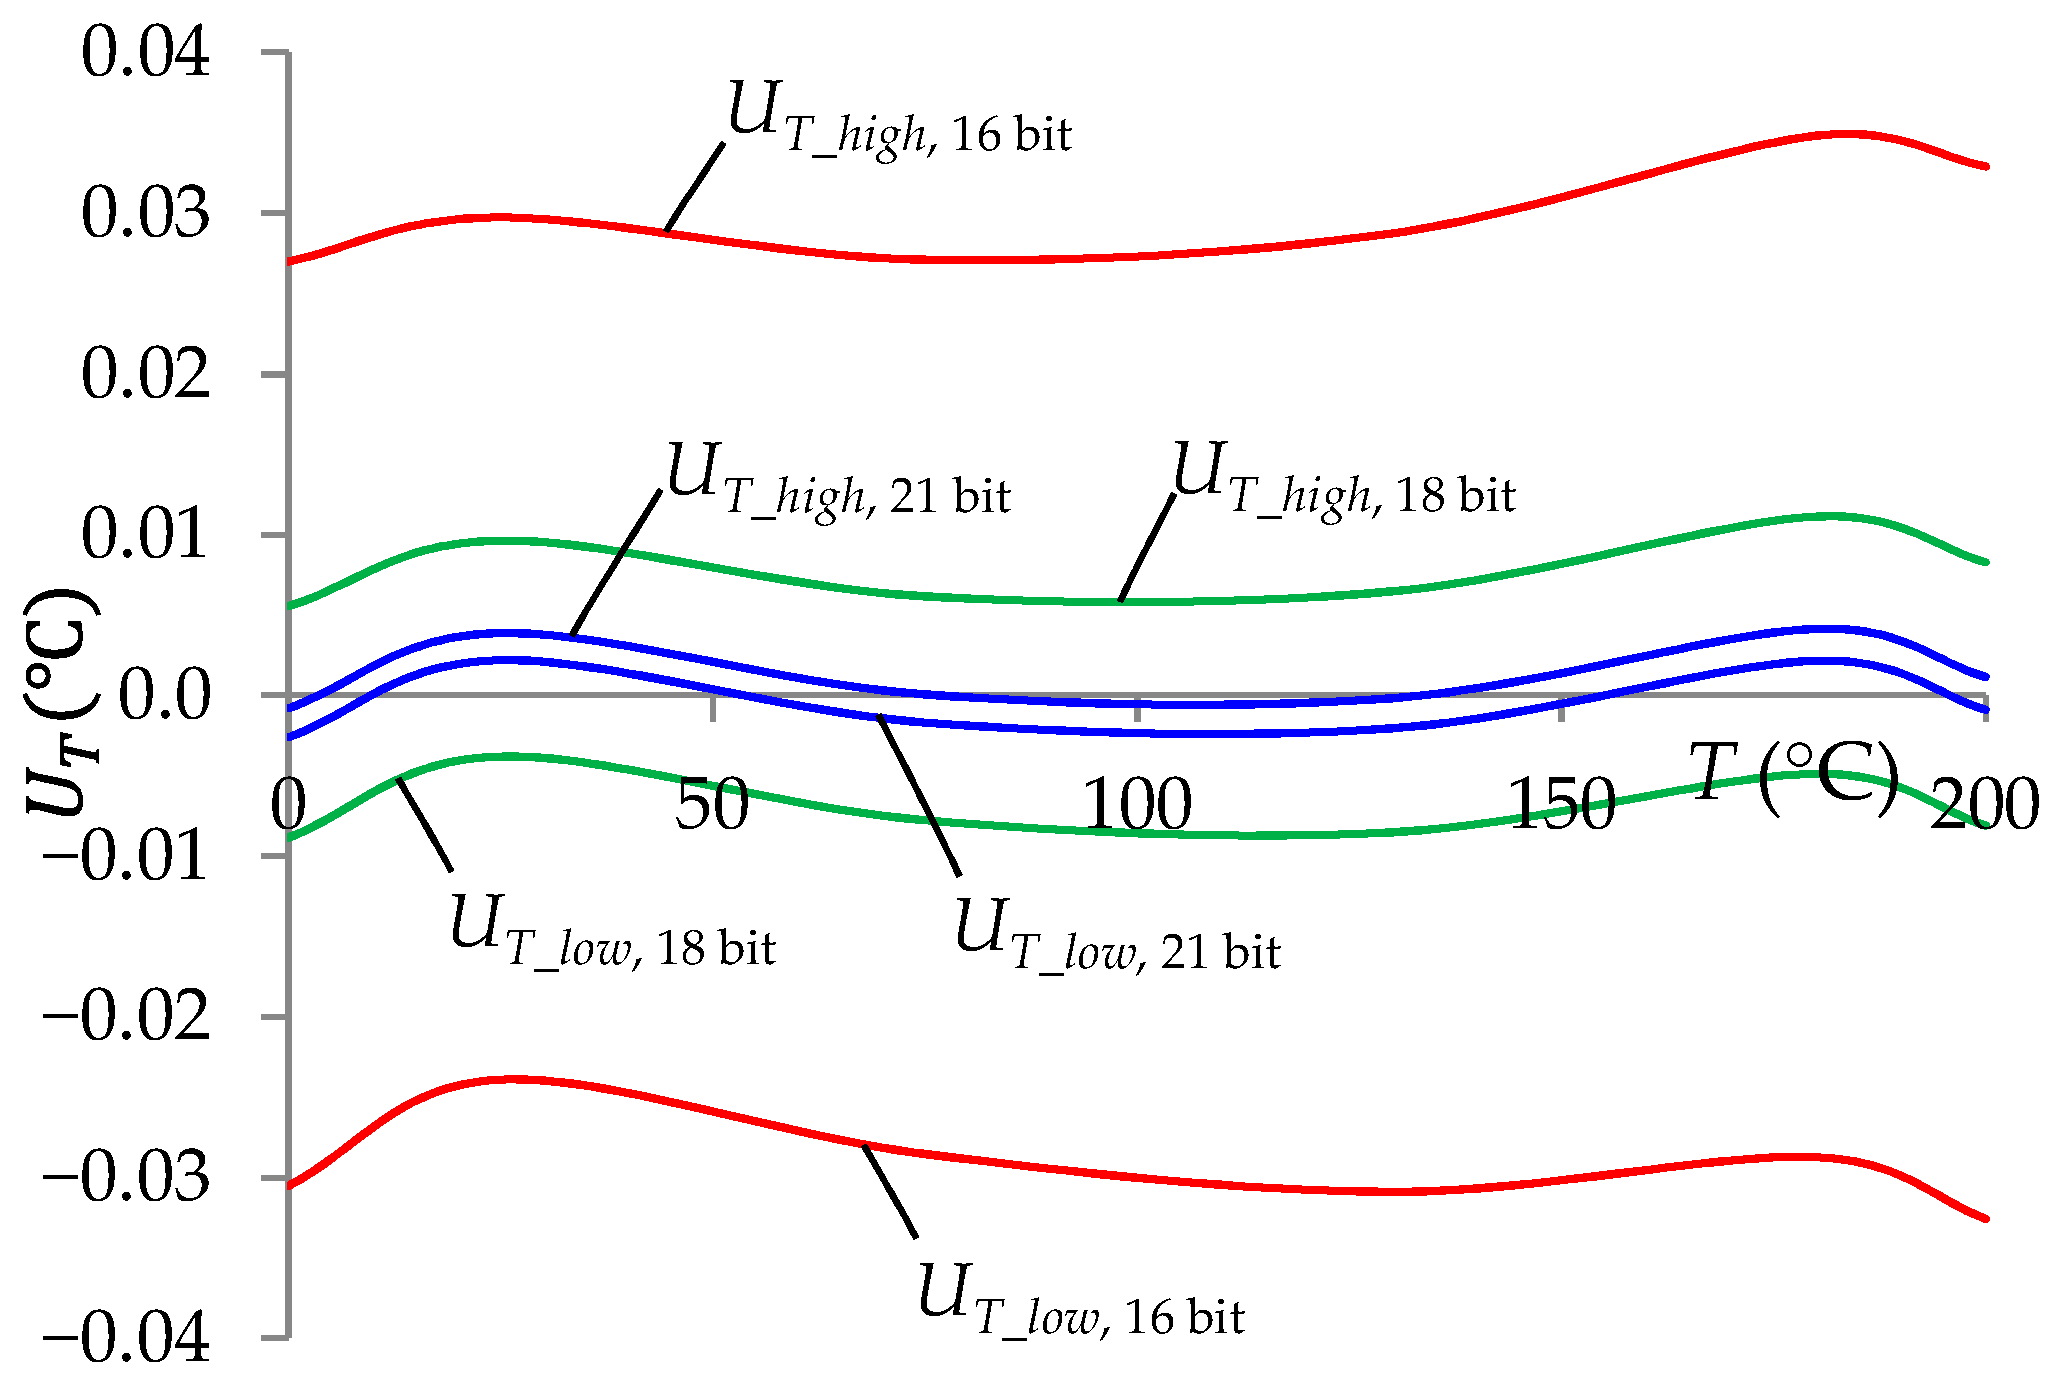
| Analysis of the influence of A/D converter resolution | B = 18 bit; T = 0…200 °C | 0.012 ** | 0.027 ** |
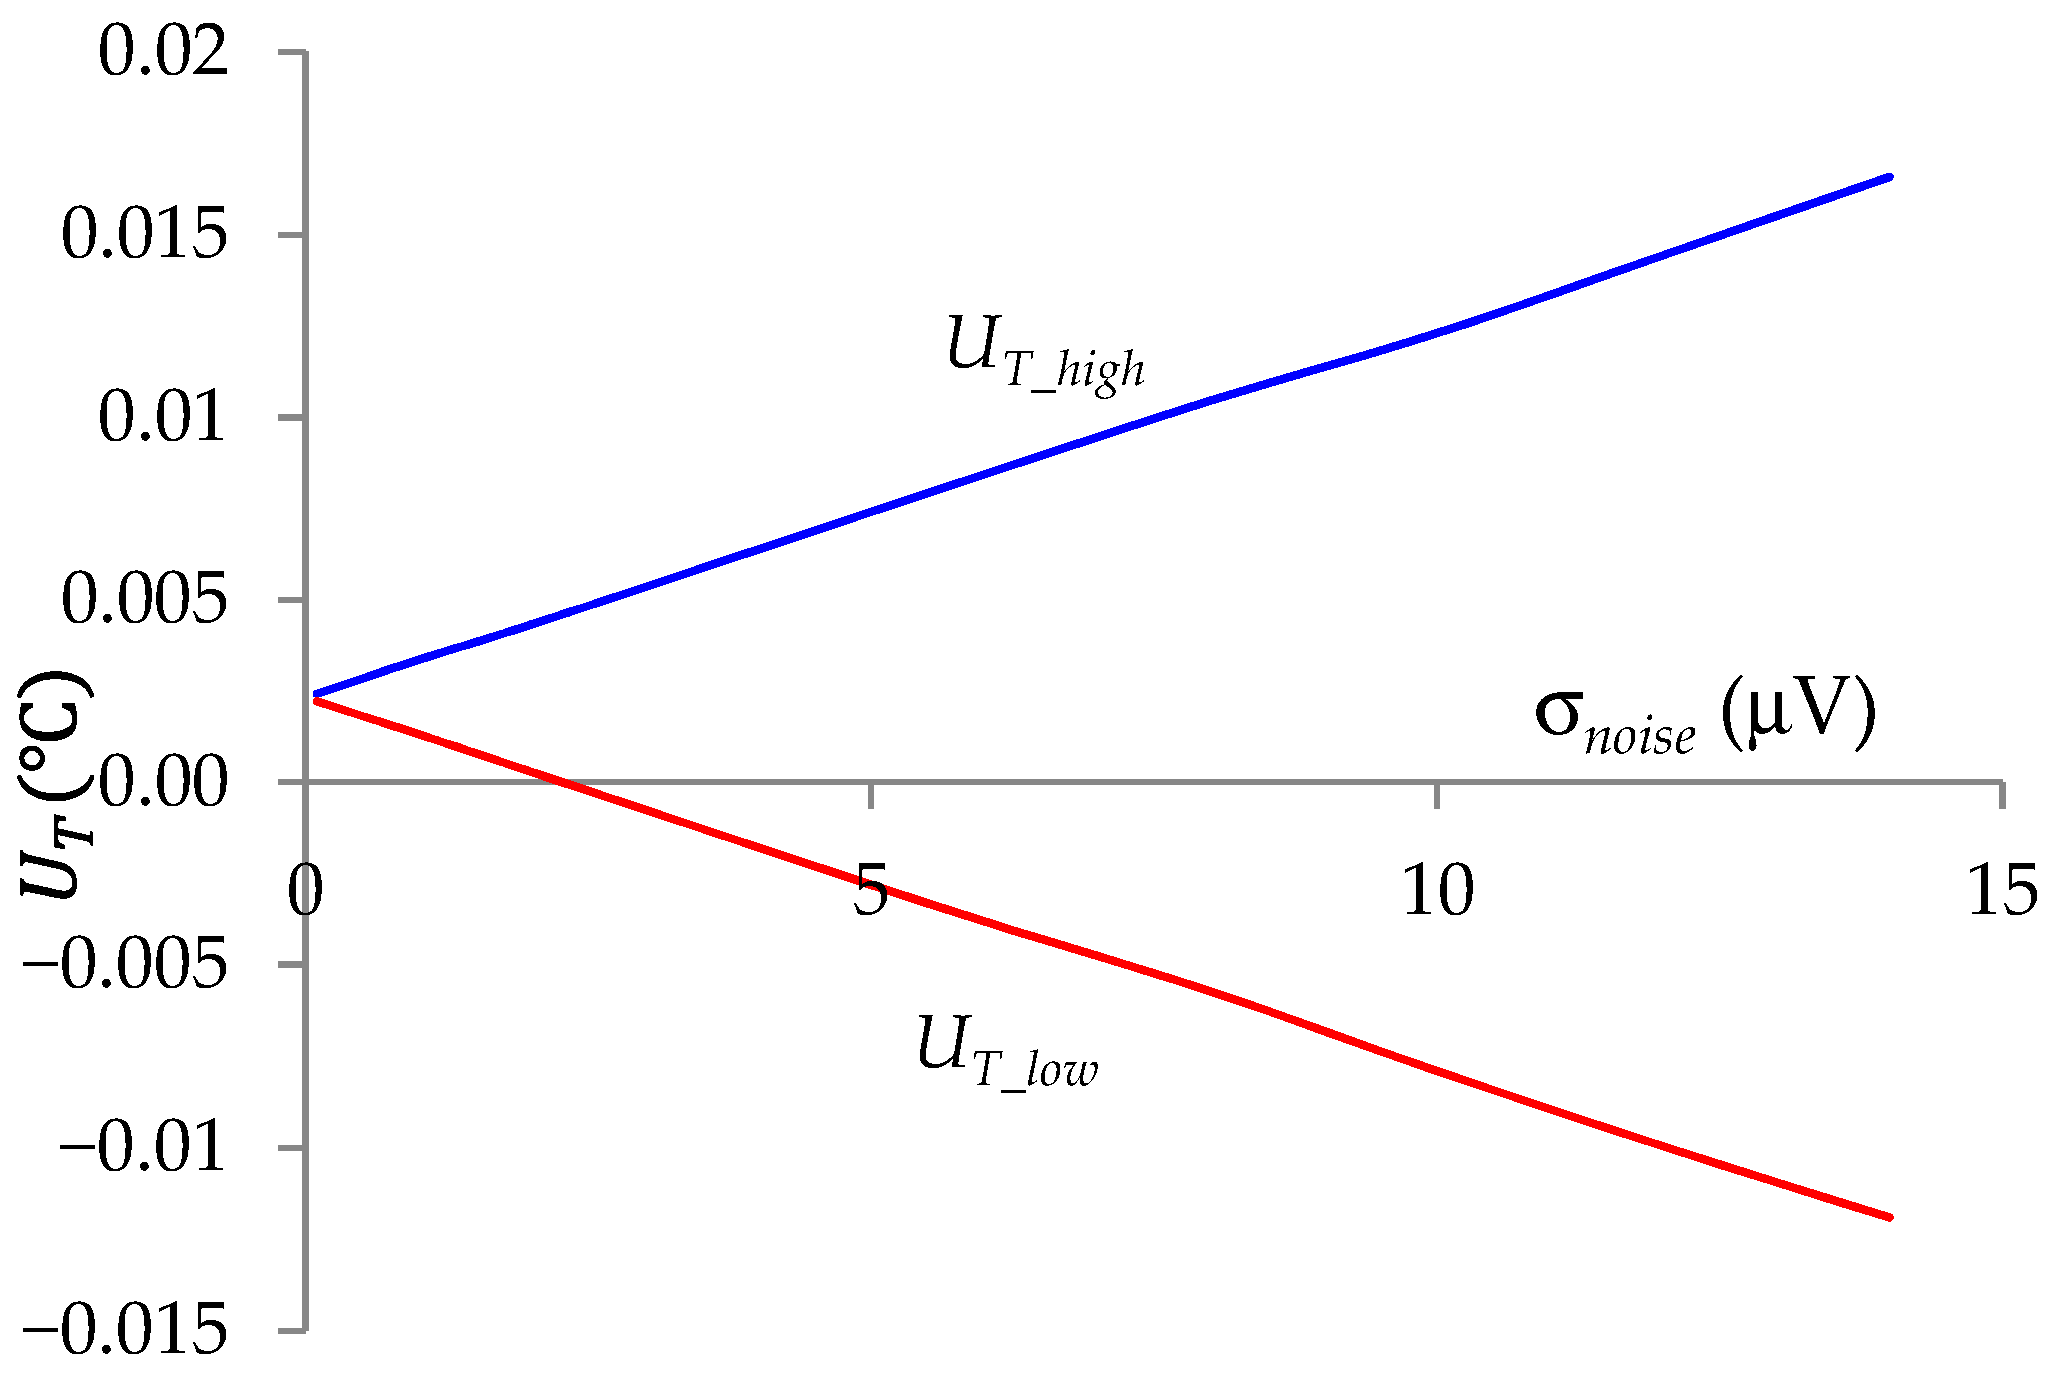
| Noise impact analysis | σnoise = 14 µV; T = 0…200 °C | 0.017 ** | 0.067 ** |
| Comprehensive simulation test | TCRRStj = 5 ppm/°C; ΔTa = 1 °C; δRStj = 0.002%; Ta = 23 °C; ΔV13 = 14∙10–6 V13 + 0.3 µV; T = 0…200 °C; ΔT_set = 0.01 °C | 0.020 ** | 0.029 ** |
| Comprehensive experimental test | 0.016 ** | 0.021 ** | |
| Comprehensive experimental tests without taking into account ΔT_set | 0.0091 ** | 0.013 ** | |
References
- Ungureanu, M.; Medan, N.; Ungureanu, N.S.; Pop, N.; Nadolny, K. Tribological aspects concerning the study of overhead crane brakes. Materials 2022, 15, 6549. [Google Scholar] [CrossRef] [PubMed]
- Perec, A.; Trieb, F.; Pude, F. Some investigations into 1000 MPa pure waterjet cutting. In Advances in Water Jetting; Klichová, D., Sitek, L., Hloch, S., Valentinčič, J., Eds.; Lecture Notes in Mechanical Engineering; Springer International Publishing: Cham, Switzerland, 2021; pp. 155–163. [Google Scholar]
- Kapłonek, W.; Nadolny, K.; Rokosz, K.; Marciano, J.; Mia, M.; Pimenov, D.Y.; Kulik, O.; Gupta, M.K. Internal cylindrical grinding process of INCONEL® Alloy 600 using grinding wheels with Sol–Gel alumina and a synthetic organosilicon polymer-based impregnate. Micromachines 2020, 11, 115. [Google Scholar] [CrossRef] [PubMed]
- IEC Standard 60751; Industrial Platinum Resistance Thermometers and Platinum Temperature Sensors. IEC: Geneva, Switzerland, 2022.
- Hertel, M.A. Development of a Novel MEMS Thermal Sensor Array for Pebble Bed HTGRs. Ph.D. Thesis, Oregon State University, Corvallis, OR, USA, 2020; pp. 1–293. [Google Scholar]
- D’Aleo, F.P.; Stalder, R.; Prasser, H.-M. Design and development of resistive temperature detector arrays on aluminium substrates. Measurements in mixing experiments. Flow. Meas. Instrum. 2015, 45, 176–187. [Google Scholar] [CrossRef]
- Kang, L.; Shi, Y.; Zhang, J.; Huang, C.; Zhang, N.; He, Y.; Li, W.; Wang, C.; Wu, X.; Zhou, X. A flexible resistive temperature detector (RTD) based on in-situ growth of patterned Ag film on polyimide without lithography. Microelectron. Eng. 2019, 216, 111052. [Google Scholar] [CrossRef]
- Fumeaux, N.; Kossairi, M.; Bourely, J.; Briand, D. Printed ecoresorbable temperature sensors for environmental monitoring. Micro Nano Eng. 2023, 20, 100218. [Google Scholar] [CrossRef]
- Siddique, A.; Khan, S.A.; Subhani, H. Design and analysis of PLC based industrial control circuit. Pak. J. Agric. Sci. 2023, 2, 72–82. [Google Scholar]
- Nagarajan, P.R.; George, B.; Kumar, V.J. Improved single-element resistive sensor-to-microcontroller interface. IEEE Trans. Instrum. Meas. 2017, 66, 2736–2744. [Google Scholar] [CrossRef]
- Wen, C.; Yao, S.; Wei, M. Research on the compliance judgment of indication error of calibration result of platinum resistance air temperature sensor. In Proceedings of the 15th IEEE International Conference on Electronic Measurement and Instruments. (ICEMI), Nanjing, China, 29–31 October 2021; pp. 401–406. [Google Scholar]
- Babaie, B.; Masoumi, N. An analytical approach for extraction of the temperature bias-error of RTD sensors for smart home. In Proceedings of the 28th Iranian Conference Electrical Engineering (ICEE), Tabriz, Iran, 4–6 August 2020. [Google Scholar]
- Miczulski, W.; Krajewski, M.; Sienkowski, S. A new autocalibration procedure in intelligent temperature transducer. IEEE Trans. Instrum. Meas. 2019, 68, 895–902. [Google Scholar] [CrossRef]
- Sarkar, S. Platinum RTD sensor based multi-channel high-precision temperature measurement circuit for temperature range −100 °C to +100 °C using single quartic function. Cogent Eng. 2018, 5, 1–15. [Google Scholar] [CrossRef]
- Rodriguez, J.; McCarthy, M. How to select and design the best RTD temperature sensing circuit. Analog. Dialogue 2021, 56, 1–10. [Google Scholar]
- Piechowski, L.; Muc, A.; Iwaszkiewicz, J. The precise temperature measurement circuit with compensation of measuring cable influence. Energies 2021, 14, 8214. [Google Scholar] [CrossRef]
- Chauhan, J.; Neelakantan, U. An experimental approach for precise temperature measurement using platinum RTD PT1000. In Proceedings of the International Conference Electrical, Electronics Optimization Techniques (ICEEOT), Chennai, India, 3–5 March 2016; pp. 3213–3215. [Google Scholar]
- Guo, L.; Xu, N. Can a high precision RTD temperature measurement circuit (±0.15 °C) be designed without the need for calibration? Analog. Dialogue 2023, 57, 1–9. [Google Scholar]
- Reverter, F. A front-end circuit for two-wire connected resistive sensors with a wire-resistance compensation. Sensors 2023, 23, 8228. [Google Scholar] [CrossRef]
- Hidalgo-López, J.A.; Castellanos-Ramos, J. Two proposals to simplify resistive sensor readout based on Resistance-to-Time-to-Digital conversion. Measurement 2023, 213, 112728. [Google Scholar] [CrossRef]
- Oballe-Peinado, Ó.; Vidal-Verdú, F.; Sánchez-Durán, J.A.; Castellanos-Ramos, J.; Hidalgo-López, J.A. Smart capture modules for direct sensor-to-FPGA interfaces. Sensors 2015, 15, 31762–31780. [Google Scholar] [CrossRef] [PubMed]
- Ambrosetti, R.; Matteoli, E.; Ricci, D. Note: A versatile, stable, high-resolution readout system for RTD and thermistor sensors. Rev. Sci. Instrum. 2012, 83, 096101. [Google Scholar] [CrossRef]
- Tomczyk, K.; Ostrowska, K. Procedure for the extended calibration of temperature sensors. Measurement 2022, 196, 111239. [Google Scholar] [CrossRef]
- Liu, C.; Zhao, C.; Wang, Y.; Wang, H. Machine-learning-based calibration of temperature sensors. Sensors 2023, 23, 7347. [Google Scholar] [CrossRef]
- Radetić, R.; Pavlov-Kagadejev, M.; Milivojević, N. The analog linearization of Pt100 working characteristic. Serbian J. Electr. Eng. 2015, 12, 345–357. [Google Scholar] [CrossRef]
- Santhosh, K.V.; Roy, B.K. An adaptive calibration circuit for RTD using optimized ANN. 7. In Proceedings of the International Conference Intelligent Systems and Control (ISCO), Coimbatore, India, 4–5 January 2013; pp. 49–54. [Google Scholar]
- Mathew, T.; Elangovan, K.; Sreekantan, A.C. Accurate interface schemes for resistance thermometers with lead resistance compensation. IEEE Trans. Instrum. Meas. 2023, 72, 1–4. [Google Scholar] [CrossRef]
- Criteria for Temperature Sensor Selection of T/C and RTD Sensor Types. The Basics of Temperature Measurement Using RTDs; White Paper 8500–917–A11E000, Part 2/3; Acromag, Inc.: Wixom, MI, USA, 2011; pp. 1–22.
- Andrews, R.; Wells, C. 3–Wire RTD Measurement Circuit Reference Design, −200 °C to 850 °C. TI Designs—Precision; Texas Instruments: Dallas, TX, USA, 2013; pp. 1–38. [Google Scholar]
- Nandhini, C.; Jagadeeswari, M. Measurement of temperature using RTD and software signal conditioning using LabVIEW. Int. J. Emer. Tech. Comp. Sci. Electron. 2016, 20, 326–330. [Google Scholar]
- Reverter, F. Two proposals of a simple analog conditioning circuit for remote resistive sensors with a three-wire connection. Sensors 2024, 24, 422. [Google Scholar] [CrossRef] [PubMed]
- Saad, P.S.M.; Halim, N.A.H.A.; Zulkefle, H.; Ahmad, N.; Sivaraju, S.S. Precision temperature measurement and error analysis for three-wire PT100 resistance temperature detector (RTD) using LTSpice. J. Adv. Res. Fluid Mech. Therm. Sci. 2024, 118, 148–159. [Google Scholar]
- Rerkratn, A.; Prombut, S.; Kamsri, T.; Riewruja, V.; Petchmaneelumka, W. A procedure for precise determination and compensation of lead-wire resistance of a two-wire resistance temperature detector. Sensors 2022, 22, 4176. [Google Scholar] [CrossRef] [PubMed]
- Li, W.; Xiong, S.; Zhou, X. Lead-wire-resistance compensation technique using a single Zener diode for two-wire resistance temperature detectors (RTDs). Sensors 2020, 20, 2742. [Google Scholar] [CrossRef]
- AN-1559 Practical RTD Interface Solutions (Rev. B); Application report, SNOA481B; Texas Instruments: Dallas, TX, USA, 2013; pp. 1–11.
- Wu, J. A Basic Guide to RTD Measurements; Application note; Texas Instruments: Dallas, TX, USA, 2023. [Google Scholar]
- Ding, J.; Yang, S.; Ye, S. A fast-multi-channel sub-millikelvin precision resistance thermometer readout based on the round-robin structure. Meas. Sci. Rev. 2018, 18, 138–146. [Google Scholar] [CrossRef]
- Miczulski, W. Method for Measuring Nonelectric Quantities with Bridged Resistive Sensor. Polish Patent 229,338, 31 July 2018. [Google Scholar]
- GÜNTHER. Technical Information on Thermocouples: Self-Heating Error. Available online: https://www.guenther.eu/en/technical-information/resistance-thermometers/10-self-heating-error?Edition=en (accessed on 8 November 2024).
- Microchip Technology Inc. MCP3550/1/3 Data Sheet. Available online: https://ww1.microchip.com/downloads/en/DeviceDoc/20001950F.pdf (accessed on 8 November 2024).
- Analog Devices. AD7766 Data Sheet. Available online: https://www.analog.com/media/en/technical-documentation/data-sheets/ad7766.pdf (accessed on 8 November 2024).
- Joint Committee for Guides in Metrology. Evaluation of Measurement Data. Supplement 1 to the “Guide to the Expression of Uncertainty in Measurement”—Propagation of Distributions Using a Monte Carlo Method (JCGM 101:2008). Available online: https://www.bipm.org/en/committees/jc/jcgm/publications (accessed on 8 November 2024).
- Krajewski, M. Constructing an uncertainty budget for voltage RMS measurement with a sampling voltmeter. Metrologia 2018, 55, 95–105. [Google Scholar] [CrossRef]
- Meder Electronic. DIP05-1A72-12A Data Sheet. Available online: https://www.tme.eu/Document/8d4adcadcf9651e9acaae3691e55e1c9/Relay_DIP_Series_E.pdf (accessed on 8 November 2024).
- Joint Committee for Guides in Metrology. Evaluation of Measurement Data—Guide to the Expression of Uncertainty in Measurement (JCGM 100:2008). Available online: https://www.bipm.org/en/committees/jc/jcgm/publications (accessed on 8 November 2024).


| Tset (°C) | ΔT (°C) (Simulation) | ΔT_meas (°C) (Measurement) |
|---|---|---|
| 0 | 0.0028 | −0.00066 |
| 25 | 0.0032 | 0.0056 |
| 75 | −0.00087 | 0.0035 |
| 130 | −0.0012 | 0.0014 |
| 180 | 0.0032 | 0.0048 |
| 200 | 0.000057 | 0.0042 |
Disclaimer/Publisher’s Note: The statements, opinions and data contained in all publications are solely those of the individual author(s) and contributor(s) and not of MDPI and/or the editor(s). MDPI and/or the editor(s) disclaim responsibility for any injury to people or property resulting from any ideas, methods, instructions or products referred to in the content. |
© 2024 by the authors. Licensee MDPI, Basel, Switzerland. This article is an open access article distributed under the terms and conditions of the Creative Commons Attribution (CC BY) license (https://creativecommons.org/licenses/by/4.0/).
Share and Cite
Miczulski, W.; Krajewski, M.; Sienkowski, S.; Kawecka, E.; Perec, A. Intelligent Transducer for Temperature Measurement with Two-Wire or Three-Wire Platinum RTD. Sensors 2024, 24, 7689. https://doi.org/10.3390/s24237689
Miczulski W, Krajewski M, Sienkowski S, Kawecka E, Perec A. Intelligent Transducer for Temperature Measurement with Two-Wire or Three-Wire Platinum RTD. Sensors. 2024; 24(23):7689. https://doi.org/10.3390/s24237689
Chicago/Turabian StyleMiczulski, Wiesław, Mariusz Krajewski, Sergiusz Sienkowski, Elżbieta Kawecka, and Andrzej Perec. 2024. "Intelligent Transducer for Temperature Measurement with Two-Wire or Three-Wire Platinum RTD" Sensors 24, no. 23: 7689. https://doi.org/10.3390/s24237689
APA StyleMiczulski, W., Krajewski, M., Sienkowski, S., Kawecka, E., & Perec, A. (2024). Intelligent Transducer for Temperature Measurement with Two-Wire or Three-Wire Platinum RTD. Sensors, 24(23), 7689. https://doi.org/10.3390/s24237689