Abstract
Given the challenges associated with the low accuracy, complexity of the equipment, and poor interference resistance observed in current wireless multipath channel measurements, this study introduces a novel algorithm called KFSC-WRELAX. This algorithm integrates techniques involving pseudorandom noise (PN) sequences, Kalman filtering (KF), sliding correlation, and weighted Fourier transform combined with the RELAXation (WRELAX) algorithm. An m-sequence is employed as the probing sequence for channel detection. The effectiveness of the KFSC-WRELAX algorithm is demonstrated through both simulation experiments and corridor testing, showing that it can accurately determine the delays in various paths with robust performance at a signal-to-noise ratio (SNR) of −5 dB or higher.
1. Introduction
Satellite communication and navigation are technologies that utilize satellites to relay information and provide global positioning and navigation services [1]. Satellite communication enables global telephony, broadcasting, internet access, and military communications, while satellite navigation systems such as GPS and BeiDou offer global positioning and navigation services, which are extensively used in transportation, aviation, military, and resource exploration. Consequently, satellites have become primary targets in electronic warfare on modern battlefields [2]. To maintain communication and navigation capabilities, an auxiliary terminal positioning system is required that can ensure command centers are informed of unit positions even when satellite communication and navigation fail, thereby enhancing strategic deployment capabilities. Thus, it is necessary to select suitable auxiliary positioning technologies based on environmental conditions and precision requirements.
Currently, auxiliary positioning technologies primarily include Wi-Fi positioning, geomagnetic positioning, inertial navigation, and feature information matching [3,4]. Wi-Fi positioning [5], which determines location based on nearby Wi-Fi signal strength, suffers from severe signal interference and network discontinuity: geomagnetic positioning [6,7] uses the Earth’s magnetic field but is susceptible to electromagnetic interference; visual positioning [8] uses cameras and computer vision to determine terminal location through image recognition and matching, but environmental changes significantly affect its accuracy; and inertial navigation systems estimate device movement and directional changes using accelerometers and gyroscopes but typically accumulate drift over time, preventing their standalone use [9]. Compared to these technologies, a more stable feature fingerprint is required for real-time positioning. Channel characteristics, as relatively stable feature information, can serve as fingerprint information for confirming positions. Among various channel characteristics, multipath delay information is more robust than channel gain due to power variations between transmitters and receivers, making it more suitable for fingerprint-based positioning.
Presently, there are various delay estimation algorithms. Reference [10] described a method using the FZC (Frank–Zadoff–Chu) sequence combined with sliding correlation on a software radio platform, which struggled with a low signal-to-noise ratio and simultaneous measurements by multiple devices. The MODE-WRELAX algorithm proposed in Reference [11] did not handle noise effectively, resulting in significant estimation errors at low SNRs. Reference [12] also employed a wavelet thresholding method for denoising received signals and proposed the GSCC-WRELAX method for mountainous environments, which had a low delay resolution and was unsuitable for complex urban settings. Reference [13] used machine learning for channel measurements, which was impractical for portable measurements. This paper addresses these issues by using an m-sequence as the probing sequence, suitable for simultaneous measurements by multiple devices, thus enhancing measurement efficiency; it combines Kalman filtering with sliding correlation to improve SNR, ensuring system accuracy at low SNR, and employs the WRELAX algorithm to extract multipath parameters from the correlated signals. Simulation results demonstrate that the estimated average error can be reduced to below 1 ns at a SNR of −5 dB.
2. System Architecture
Wireless channel multipath delay measurement primarily aims to determine a channel’s multipath delays. In wireless communications, the signals reaching the receiver are superpositions of signals that have traveled different paths using various time delays. These superposed signals exhibit a time delay spread in the time domain relative to the original signal. Wireless channel multipath delay measurement is intended to measure the delays of the superposed signals along each path, that is, the channel’s delay distribution [14]. The workflow of the wireless channel multipath delay measurement system architecture is shown in Figure 1:
Figure 1.
The measurement simulation system structure mainly consists of three parts: signal transmission processing, wireless channel, and signal reception decomposition.
In Figure 1, PC1 (transmitter data processing and control device) oversamples the measurement sequence and processes it through a shaping filter to form a baseband measurement signal. This baseband measurement signal undergoes zero-IF processing and is directly transmitted as an RF signal by the radio transmitter. After traversing the wireless channel, the RF signal forms multipath signals, which are received and stored by the radio receiver. PC2 (receiver control and data processing device) employs Kalman filtering and sliding correlation methods to denoise the received signal and ultimately uses the WRELAX method to solve and analyze the correlated signal, thereby extracting the multipath delay information of the channel.
3. Probe Signal Generation
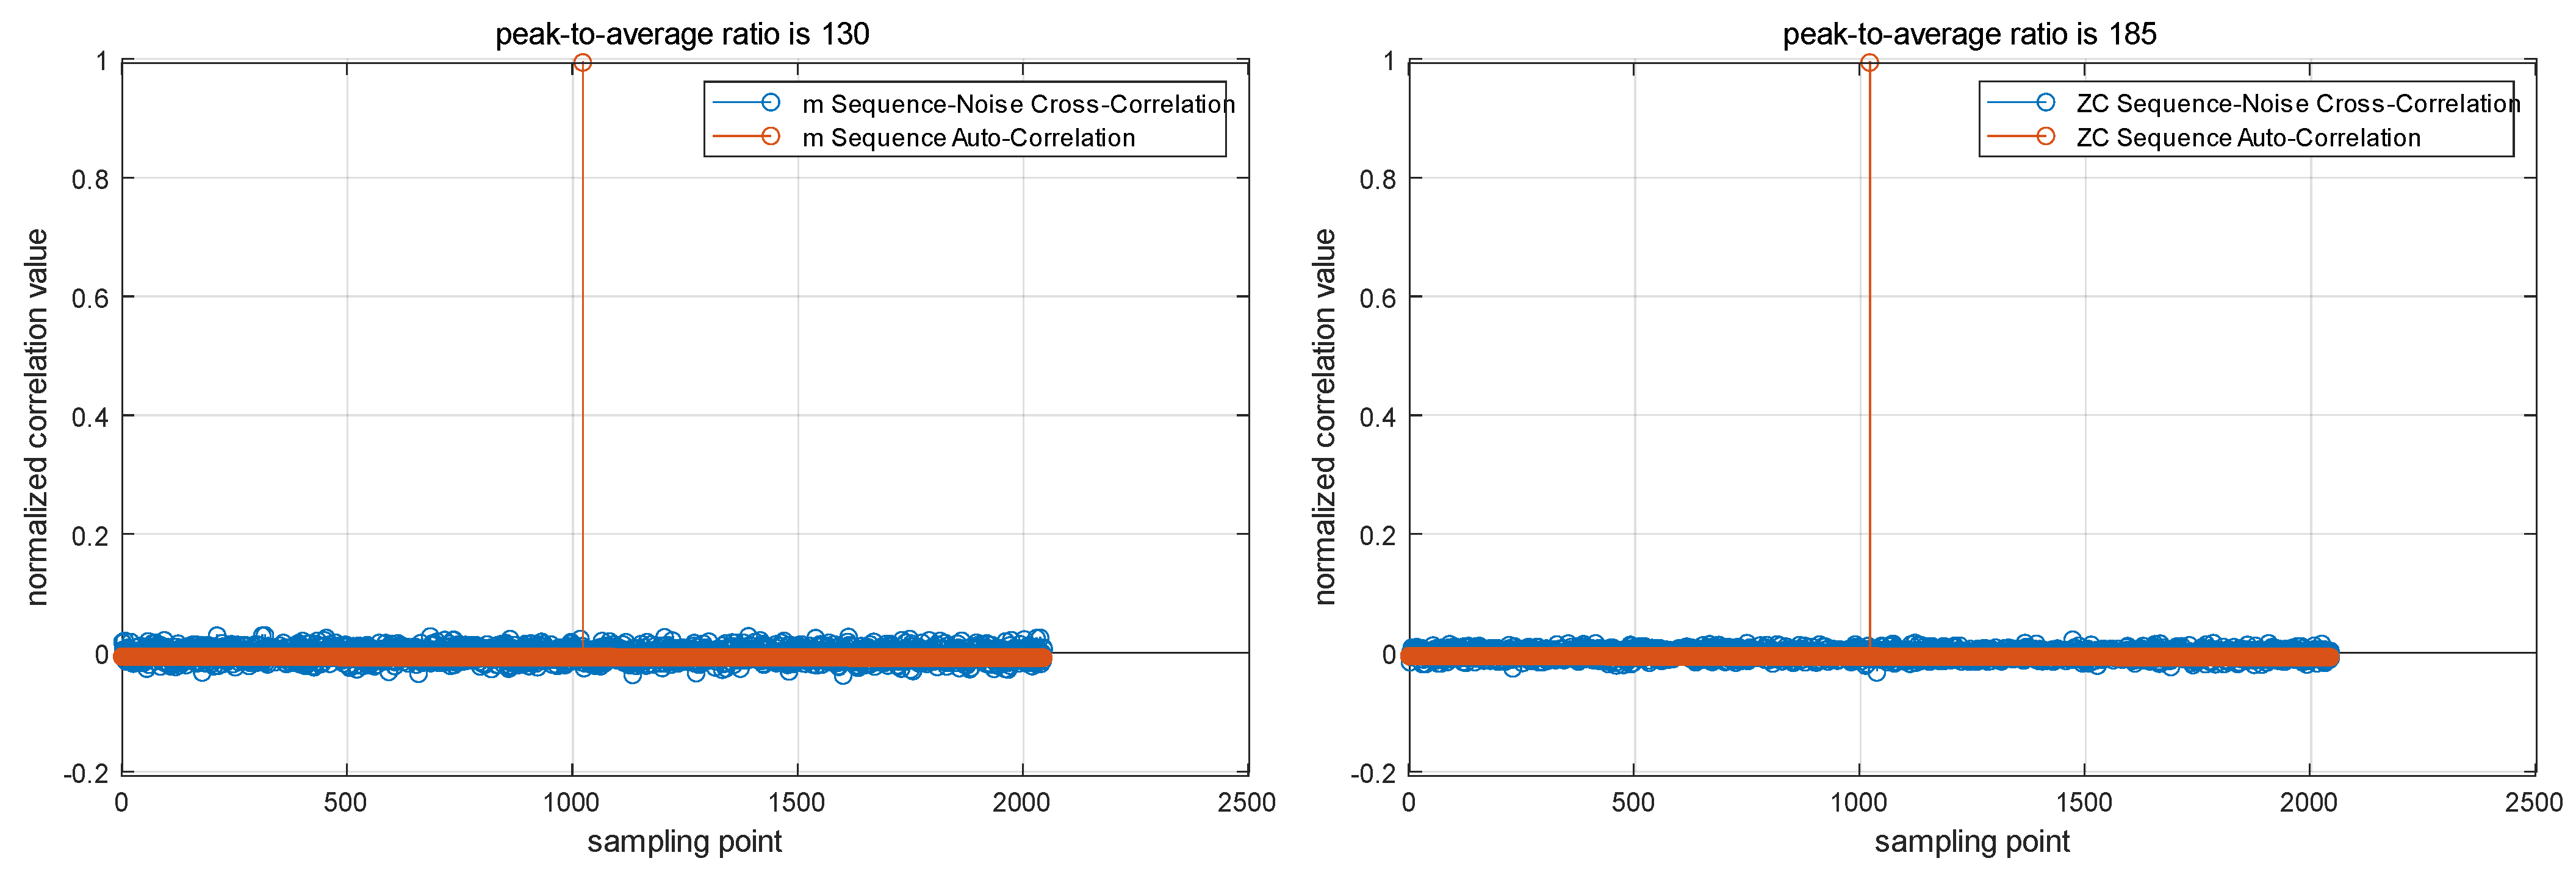
3.1. Pseudorandom Noise Sequence Selection
When measuring channels, the first step is to select an appropriate source signal. PN sequences, known for their excellent autocorrelation properties, are commonly used for channel measurements. PN sequences can be divided into binary and non-binary sequences. A typical binary sequence is the m-sequence [15], generated by a Linear Feedback Shift Register (LFSR). Non-binary PN sequences often use the Zadoff–Chu (ZC) [16,17] sequence, which is generated by Equation (1):
In Equation (1), represents the number of symbols in the sequence, Z and are coprime, and k is any integer.
To compare the noise resistance of two types of sequences, their Peak-to-Average Power Ratio (PAPR) is compared under additive white Gaussian noise with a SNR of 10 dB, as shown in Figure 2.
Figure 2.
In the measurement simulation system structure diagram, under the same signal-to-noise ratio, performing autocorrelation on both the m-sequence and the ZC-sequence and comparing their peak-to-average ratios allows for a direct observation of their noise resistance performance.
Figure 2 displays the PAPR of both sequences under identical conditions. Although the PAPR of the ZC sequence is higher than that of the m-sequence, the difference is marginal. In addition, the ZC sequence has only one code type within the same sequence length, it cannot be used for simultaneous multi-device measurements, and its generation is complex. In contrast, the m-sequence is simple to generate and can produce multiple sequences of the same length with different initial states, making it suitable for multi-device measurements at the same time. Therefore, this paper selects the m-sequence as the source signal.
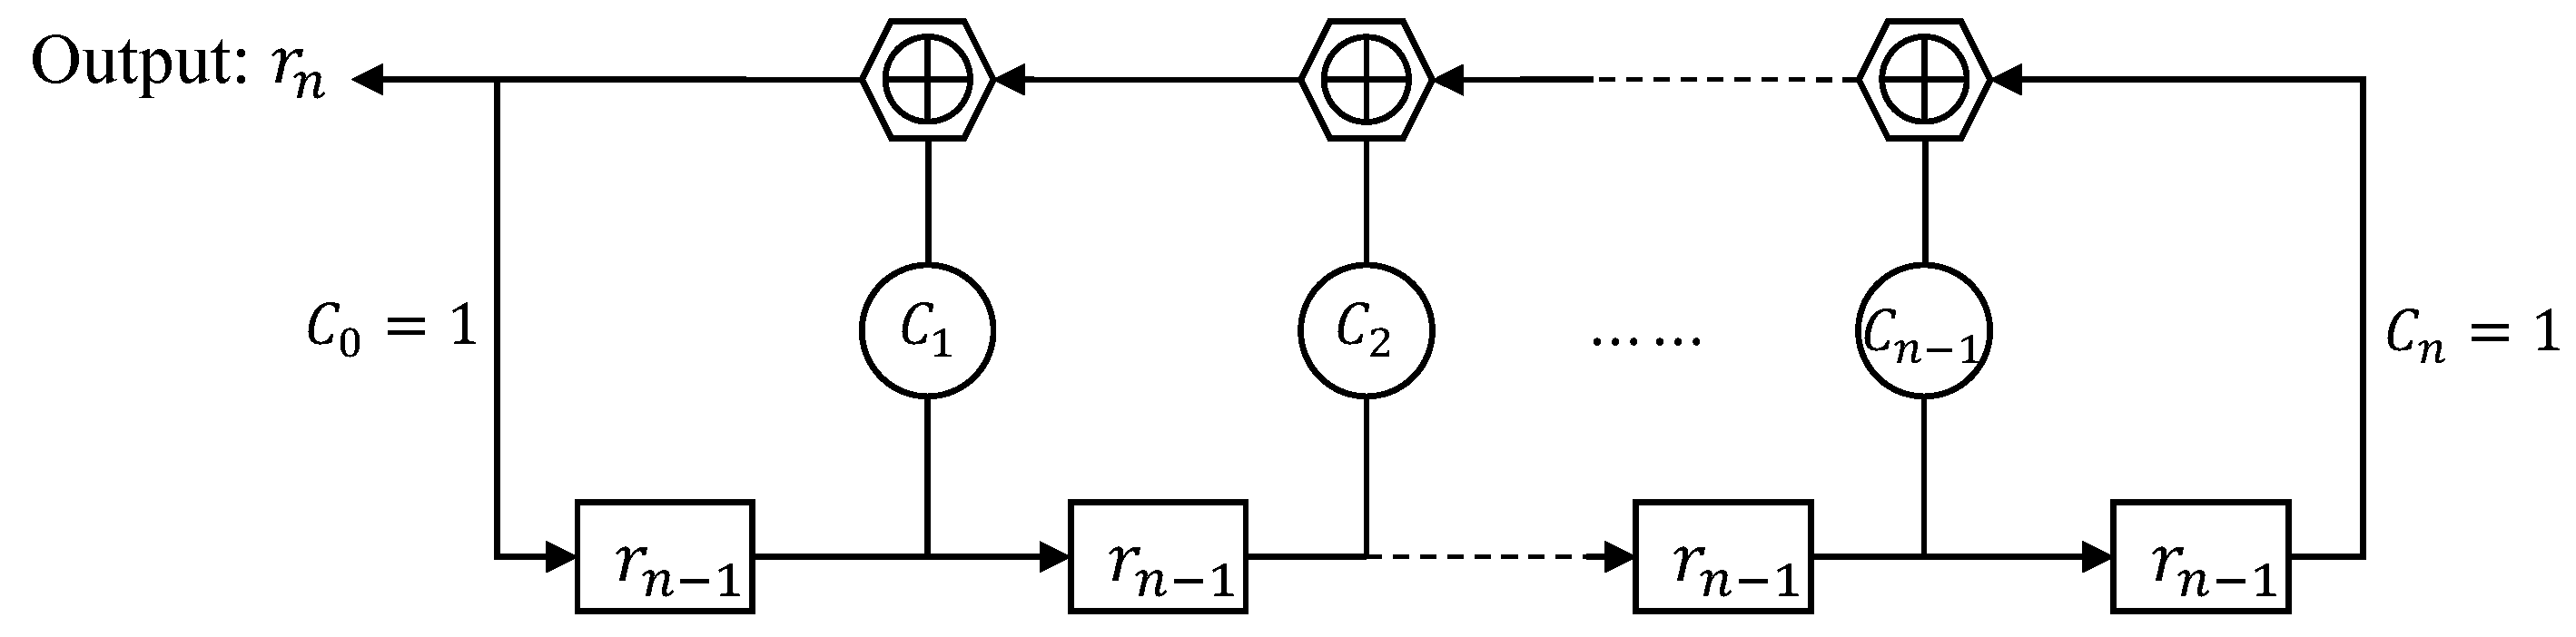
3.2. Linear Feedback Shift Register Generates M-Sequence
The m-sequence generated by an n-stage LFSR has a length of . It is obtained by multiplying the value of each bit in the shift register using feedback coefficients, summing them, and then performing modulo-2 arithmetic. The schematic diagram of the linear feedback shift register is shown in Figure 3:
Figure 3.
Linear feedback shift register generates m-sequence.
Based on Figure 3, the relationship between the values in the register and the output sequence values can be expressed by Equations (2) and (3):
Equation (2) is the feedback logic function of the shift register, where represents the output value of the sequence after the i-th shift. To realize the autocorrelation properties of the shift register, the binary sequence output needs to be converted into a bipolar sequence of values using Equation (3), thereby generating the m-sequence , where represents the length of the m-sequence.
3.3. Oversampling and Shaping Filtering
The m-sequence that has been generated is oversampled by a factor of M to obtain the corresponding oversampled sequence. However, due to the limited bandwidth of radio equipment for transmitting signals, the signal, after oversampling and thereby having an excessively large bandwidth, cannot be transmitted directly via RF. It is necessary to process the oversampled signal through a shaping filter [18].
In Equation (4), N represents the product of the m-sequence length and the oversampling rate M, which is the length of the signal after oversampling. The symbol denotes the rounding operation. The bipolar m-sequence generated in Equation (3), after processing through Equation (5), yields the oversampled sequence . To form the baseband detection signal, a root-raised cosine filter is used to filter the oversampled signal. The filter specifications include a roll-off factor of 0.25, a filter order of 128, a scaled passband using a Hamming window, a sampling frequency () of 110 MHz, and a cutoff frequency () of 20 MHz. This sequence, after being processed by a root-raised cosine filter, becomes the baseband signal for radio transmission.
4. Signal Reception Processing
4.1. Multipath Signal Reception
After being received through RF, the received signal is demodulated by the radio receiving equipment and converted into discrete data through an ADC to be processed by a PC. Thus, in the received wireless signal sequence , the kth symbol is shown in Equations (6) and (7):
In Equation (6), represents the th symbol in the transmitted wireless signal sequence, represents the channel attenuation factor corresponding to the ith path, represents the delay of the ith path, is the upsampling rate, represents the number of points of the delay in the discrete domain, and is the aliased noise in the received signal, originating from white noise in free space or other interference signals.
4.2. Kalman Filtering and Sliding Correlation
For a set of received signals, the down-converted signals are affected not only by multipath superimposed signals but also by the noise described in Equation (6). The Kalman filter [19,20], as an efficient recursive filter, estimates the true state measurement value based on the values of each measurement at different times, combined with the results of the previous state and the current state measurement value, and has a good real-time performance and noise reduction effect. In time delay estimation algorithms, the SNR and real-time performance have a significant impact on the accuracy of time delay estimation. Therefore, one-dimensional Kalman filtering is used to denoise the received aliased signals.
In the time domain, groups of wireless signal sequences are received, and then one-dimensional Kalman filtering is applied to N symbols in groups, which can be implemented using Algorithm 1.
| Algorithm 1 Implementation of Kalman Filtering |
|
The filtering process of the Kalman filter is divided into two parts: the time measurement equation and the state update equation. The input parameters for Algorithm 1 of the Kalman filter are the multiple sets of received signals, where the number of signal sets is equivalent to and the signal length is equivalent to N. In the above algorithm, D represents the filtering dimension of the Kalman filter; k represents the group time of the symbol; is the state transition matrix; represents the estimated covariance; is the error between the state transition matrix and the actual process, which needs to be adjusted according to the actual situation; and is the measurement noise covariance, which can be obtained from observations.
The time measurement equation is implemented in lines 12 and 13, which provide the prior state estimate and the prior estimate covariance at time k, respectively. The state update equation is reflected in lines 15, 16, and 18, where the prior estimates are combined with new measurement variables to construct the improved posterior estimate. After the filtering process is completed, the output of the last updated state result is , which results in the filtered output signal .
The sliding correlation method is used to measure multipath delays in channels due to its low computational complexity, which provides good real-time capabilities [21,22]. During the channel measurement process, it can display in real time the effects of multiple paths captured within the same time window. The data, after being filtered, are processed using a sliding correlation:
In this context, represents the nth symbol of the baseband probe signal sequence , is the th symbol after Kalman filtering, is the kth cross-correlation result within the sliding window N, and is the kth autocorrelation result within the sliding window N. So, is obtained by summing the point-by-point products of and . The calculation method of is the same as that of .
4.3. Channel Parameter Extraction Using the WRELAX Algorithm
The WRELAX algorithm is a method of parameter estimation that minimizes a nonlinear least squares cost function [23]. It can decompose multidimensional parameter estimation problems into several one-dimensional estimation issues. The estimation of the overall superimposed signal delays can be accomplished through a series of weighted Fourier transforms and iterative calculations.
In Equation (10), and represent the Fourier transform forms of the sliding correlation results and , respectively. Before applying the WRELAX algorithm, preparations need to be made:
and are the correlation matrix containing multipath information and the original autocorrelation matrix, respectively. Then, the existing delay parameters are extracted from the matrices in the form of delay intervals set in Equation (13).
Based on the aforementioned preparatory formulas, in Equation (10) can be expressed as follows:
In Equation (15), is represented as the 2-norm of a matrix. Therefore, the extraction of estimated parameters can be transformed into minimizing :
Then, derive the corresponding parameters :
With the aforementioned preparations, the solution process for the superimposed signals can be summarized as follows:
- Similarly, when the number of multipath components is L;
Additionally, in actual channel measurements, since the number of multipath components in the measurement channel cannot be predetermined, WRELAX can also acquire the number of delay characteristics needed for matched positioning based on the amplitude sizes.
5. Simulation Analysis
To verify the performance of the algorithm proposed in this paper, the following simulation experiment was designed: the linear feedback shift register of the m-sequence has an order of ; the number of symbols is ; the PN chip is ns; the sampling rate is MHz; the sampling interval is ns; the noise type is additive Gaussian noise; the baseband signal bandwidth is set to 20 MHz; and the RF frequency is 1.5 GHz. These parameters were employed to analyze the method’s performance under various conditions.
5.1. The Denoising Performance of the Kalman Filter
A set of channel noises ranging from −30 dB to 30 dB was established, and then the SNR of the received signal and the filtered signal was calculated. The results are shown in Table 1.
Table 1.
SNR before and after kalman filtering.
Table 1 displays the relationship between the SNR of received signals before and after Kalman filtering. It can be observed that although the noise reduction effectiveness decreases as the set SNR of the signal increases, overall, the Kalman filtering method still manages to maintain an improvement of over 6 dB.
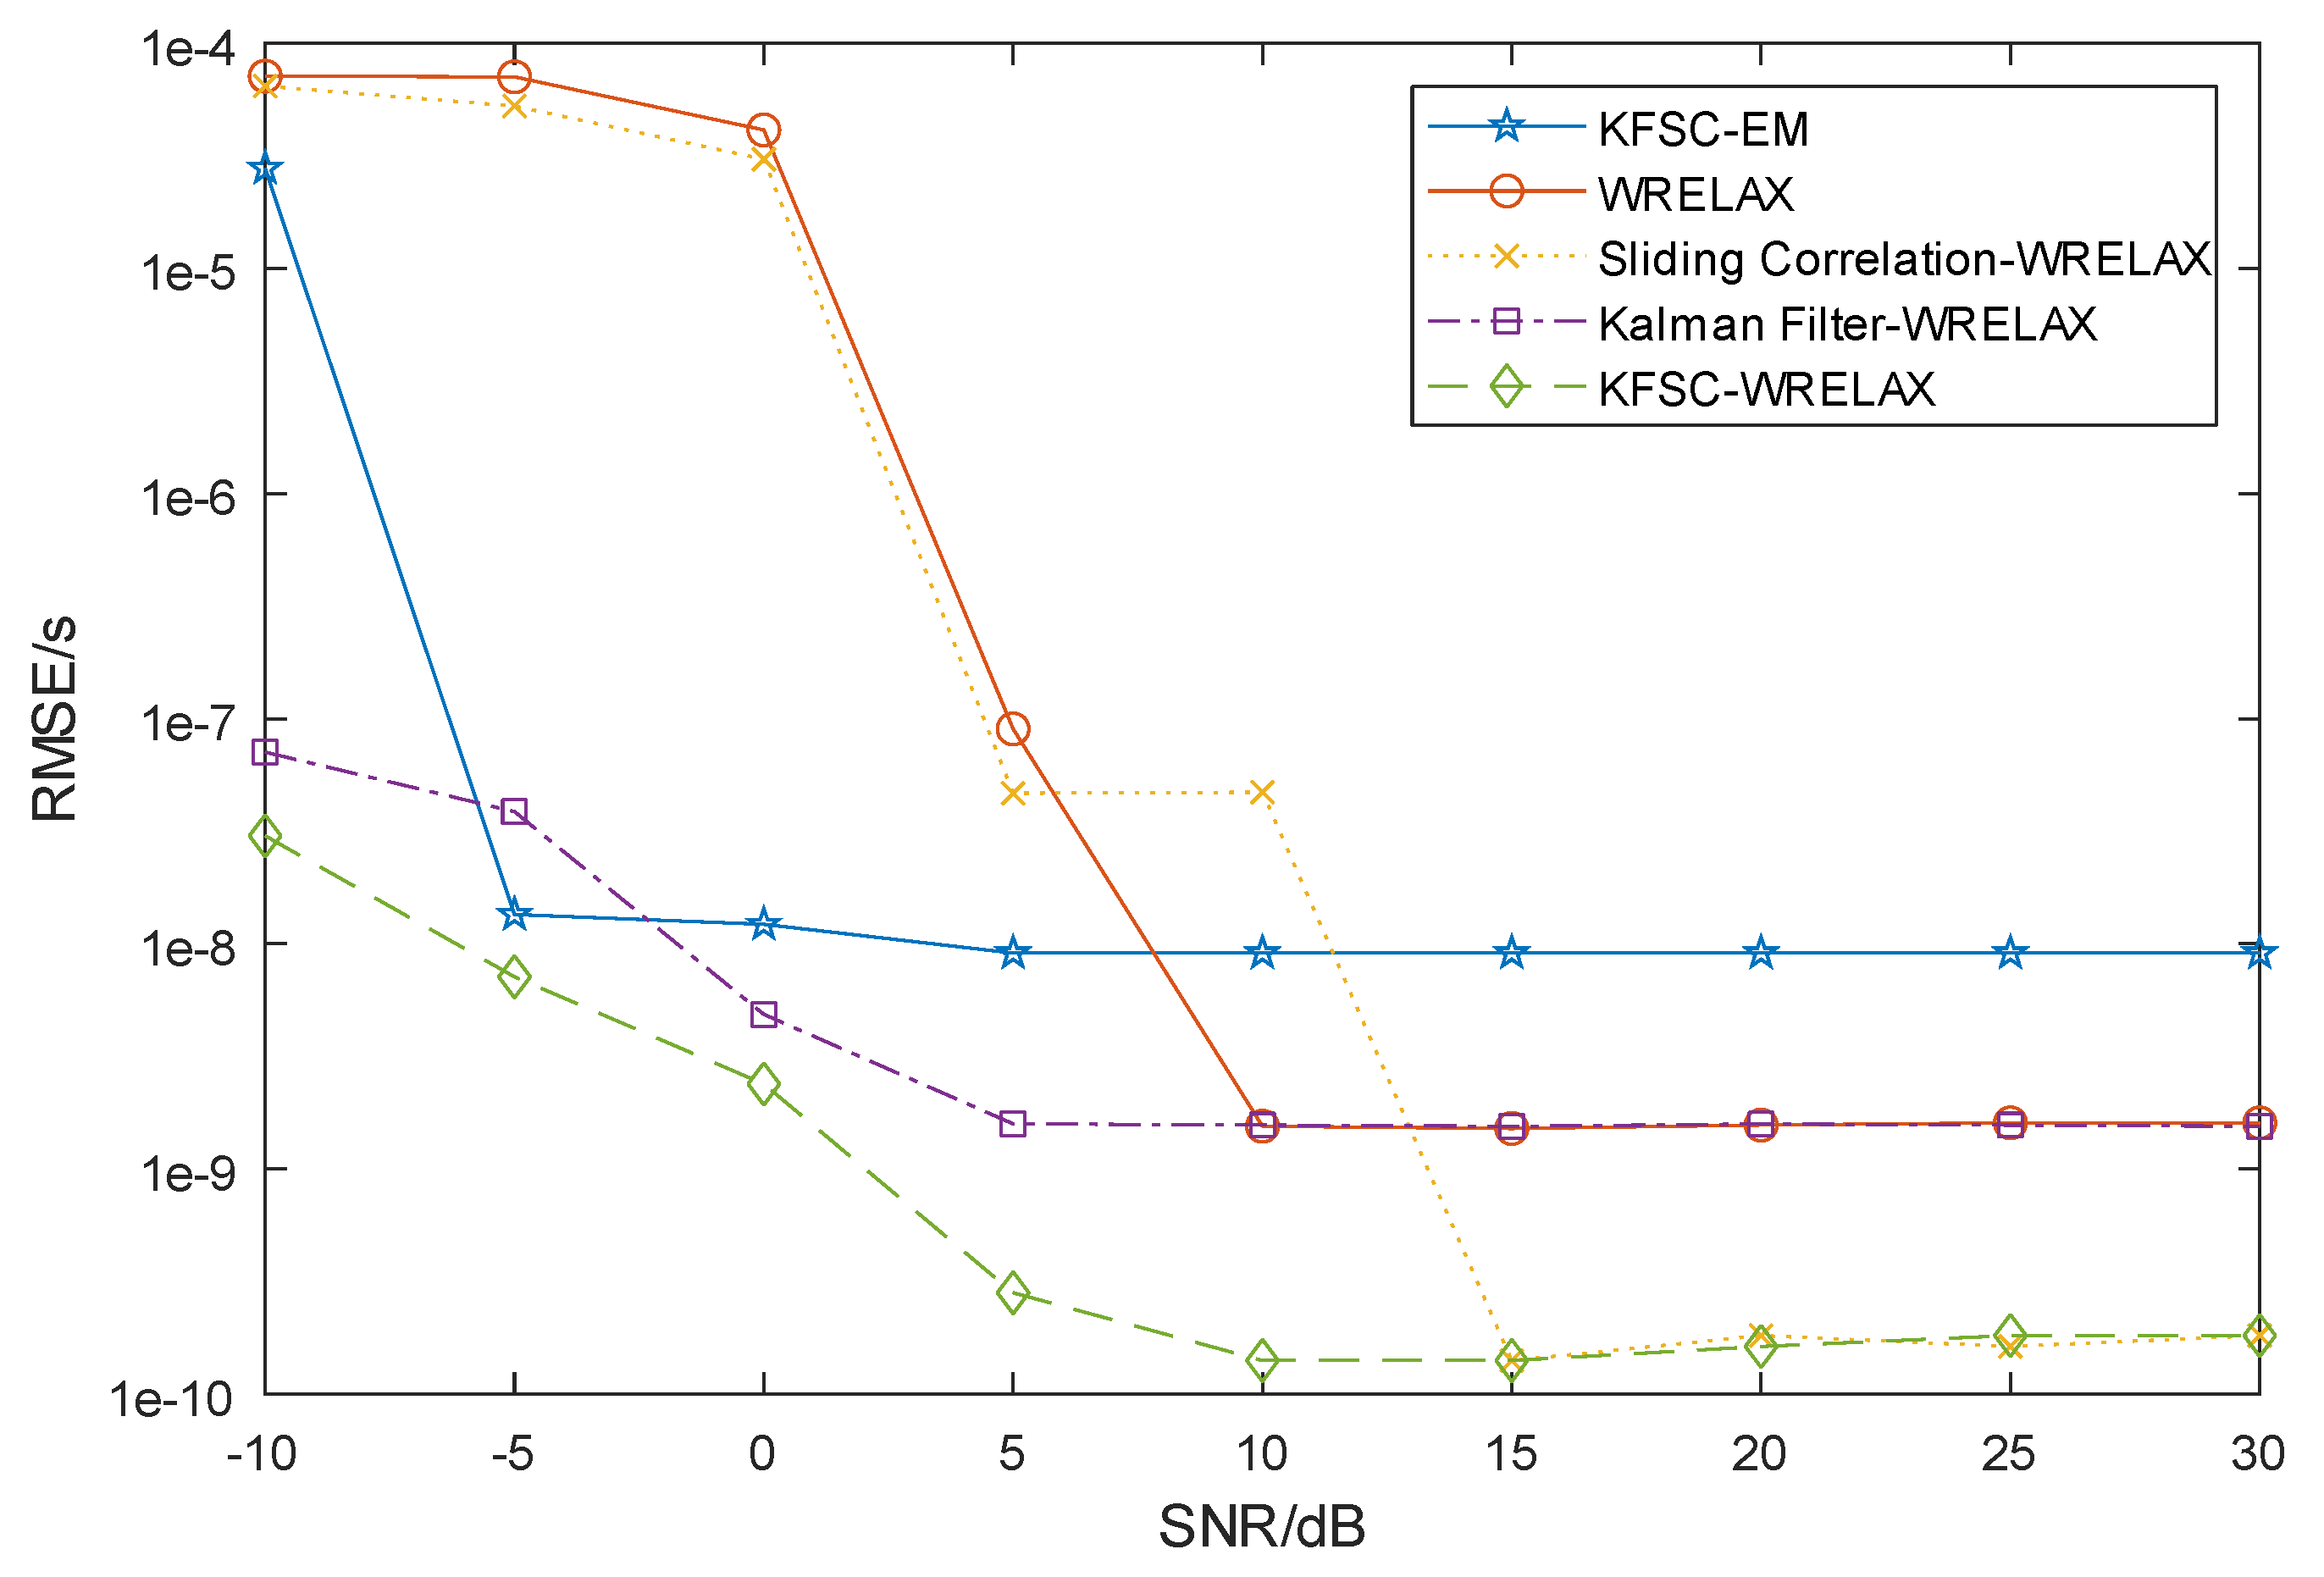
5.2. Simulation Results
To verify the estimation performance across different methods and under various SNR conditions, conduct independent experiments multiple times under each method and signal-to-noise ratio condition and calculate the root mean square error (RMSE) of the final result. The parameters of the signal source remain unchanged with a multipath number L of 2 and corresponding delays are ns and ns; amplitude attenuation coefficients are and , representing a relative attenuation of 13 dB. In Figure 4, the five curves represent the root mean square error of delay estimation obtained using the following five methods: ‘WRELAX’ (multipath delay extracted directly by the WRELAX algorithm without noise processing of the received signal), ‘Sliding Correlation-WRELAX’ (multipath delay extracted by the WRELAX algorithm after sliding correlation processing of the received signal), ‘Kalman Filter-WRELAX’ (multipath delay extracted by the WRELAX algorithm after Kalman filtering of the received signal), ‘KFSC-WRELAX’ (multipath delay extracted by the WRELAX algorithm after processing by the designed scheme in this paper), and ‘KFSC-EM’ (multipath delay extracted by the EM algorithm after processing by the designed scheme in this paper).
Figure 4.
In simulation error analysis diagram, five methods were employed, and multiple simulation validations were conducted while keeping other simulation parameters consistent. By calculating the estimated delay errors for each method and obtaining the average estimated error value, it can be directly observed that under different signal-to-noise ratio conditions, the method proposed in this paper effectively improves the estimation accuracy.
From Figure 4, it is clearly observable that the estimation errors of various algorithms are influenced by noise interference, and overall, the errors decrease as the SNR increases. Observing the curves for ‘WRELAX’, ‘Sliding Correlation-WRELAX’, ‘Kalman Filter-WRELAX’, and ‘KFSC-WRELAX’, it is evident that at low SNR levels the Kalman Filter shows more significant effects in estimation, with estimation errors about 30 dB lower than methods not using the Kalman Filter. At high SNR levels, the sliding correlation shows more pronounced effects in estimation, with errors about 10 dB lower than methods not employing sliding correlation. Comparing the ‘KFSC-EM’ [24,25] and ‘KFSC-WRELAX’ curves, the WRELAX method consistently outperforms the EM algorithm throughout. Thus, it can be seen that the KFSC-WRELAX method performs better than other methods in terms of estimation accuracy.
5.3. Channel Simulator Test Results
To verify the effectiveness of the algorithm, this study conducts simulation tests using a channel simulator [26,27], where the RF signal is received after passing through the ZTI-32 channel simulator. The parameters of the channel simulator are configured, and then the algorithm described in this paper is used to extract channel parameters.
The test results from the ZTI-23 channel simulator show that, as indicated in Table 2, even when the time difference between paths is several tens of nanoseconds, the estimated delay error can be controlled within 1 ns, and the number of iterations is also well managed. Additionally, from a theoretical perspective, the greater the amplitude attenuation difference between two paths, the more difficult it is to separate their delays, which in turn results in a relatively higher number of iterations. The results from the channel simulator are consistent with the theory analysis.
Table 2.
Channel simulator test results.
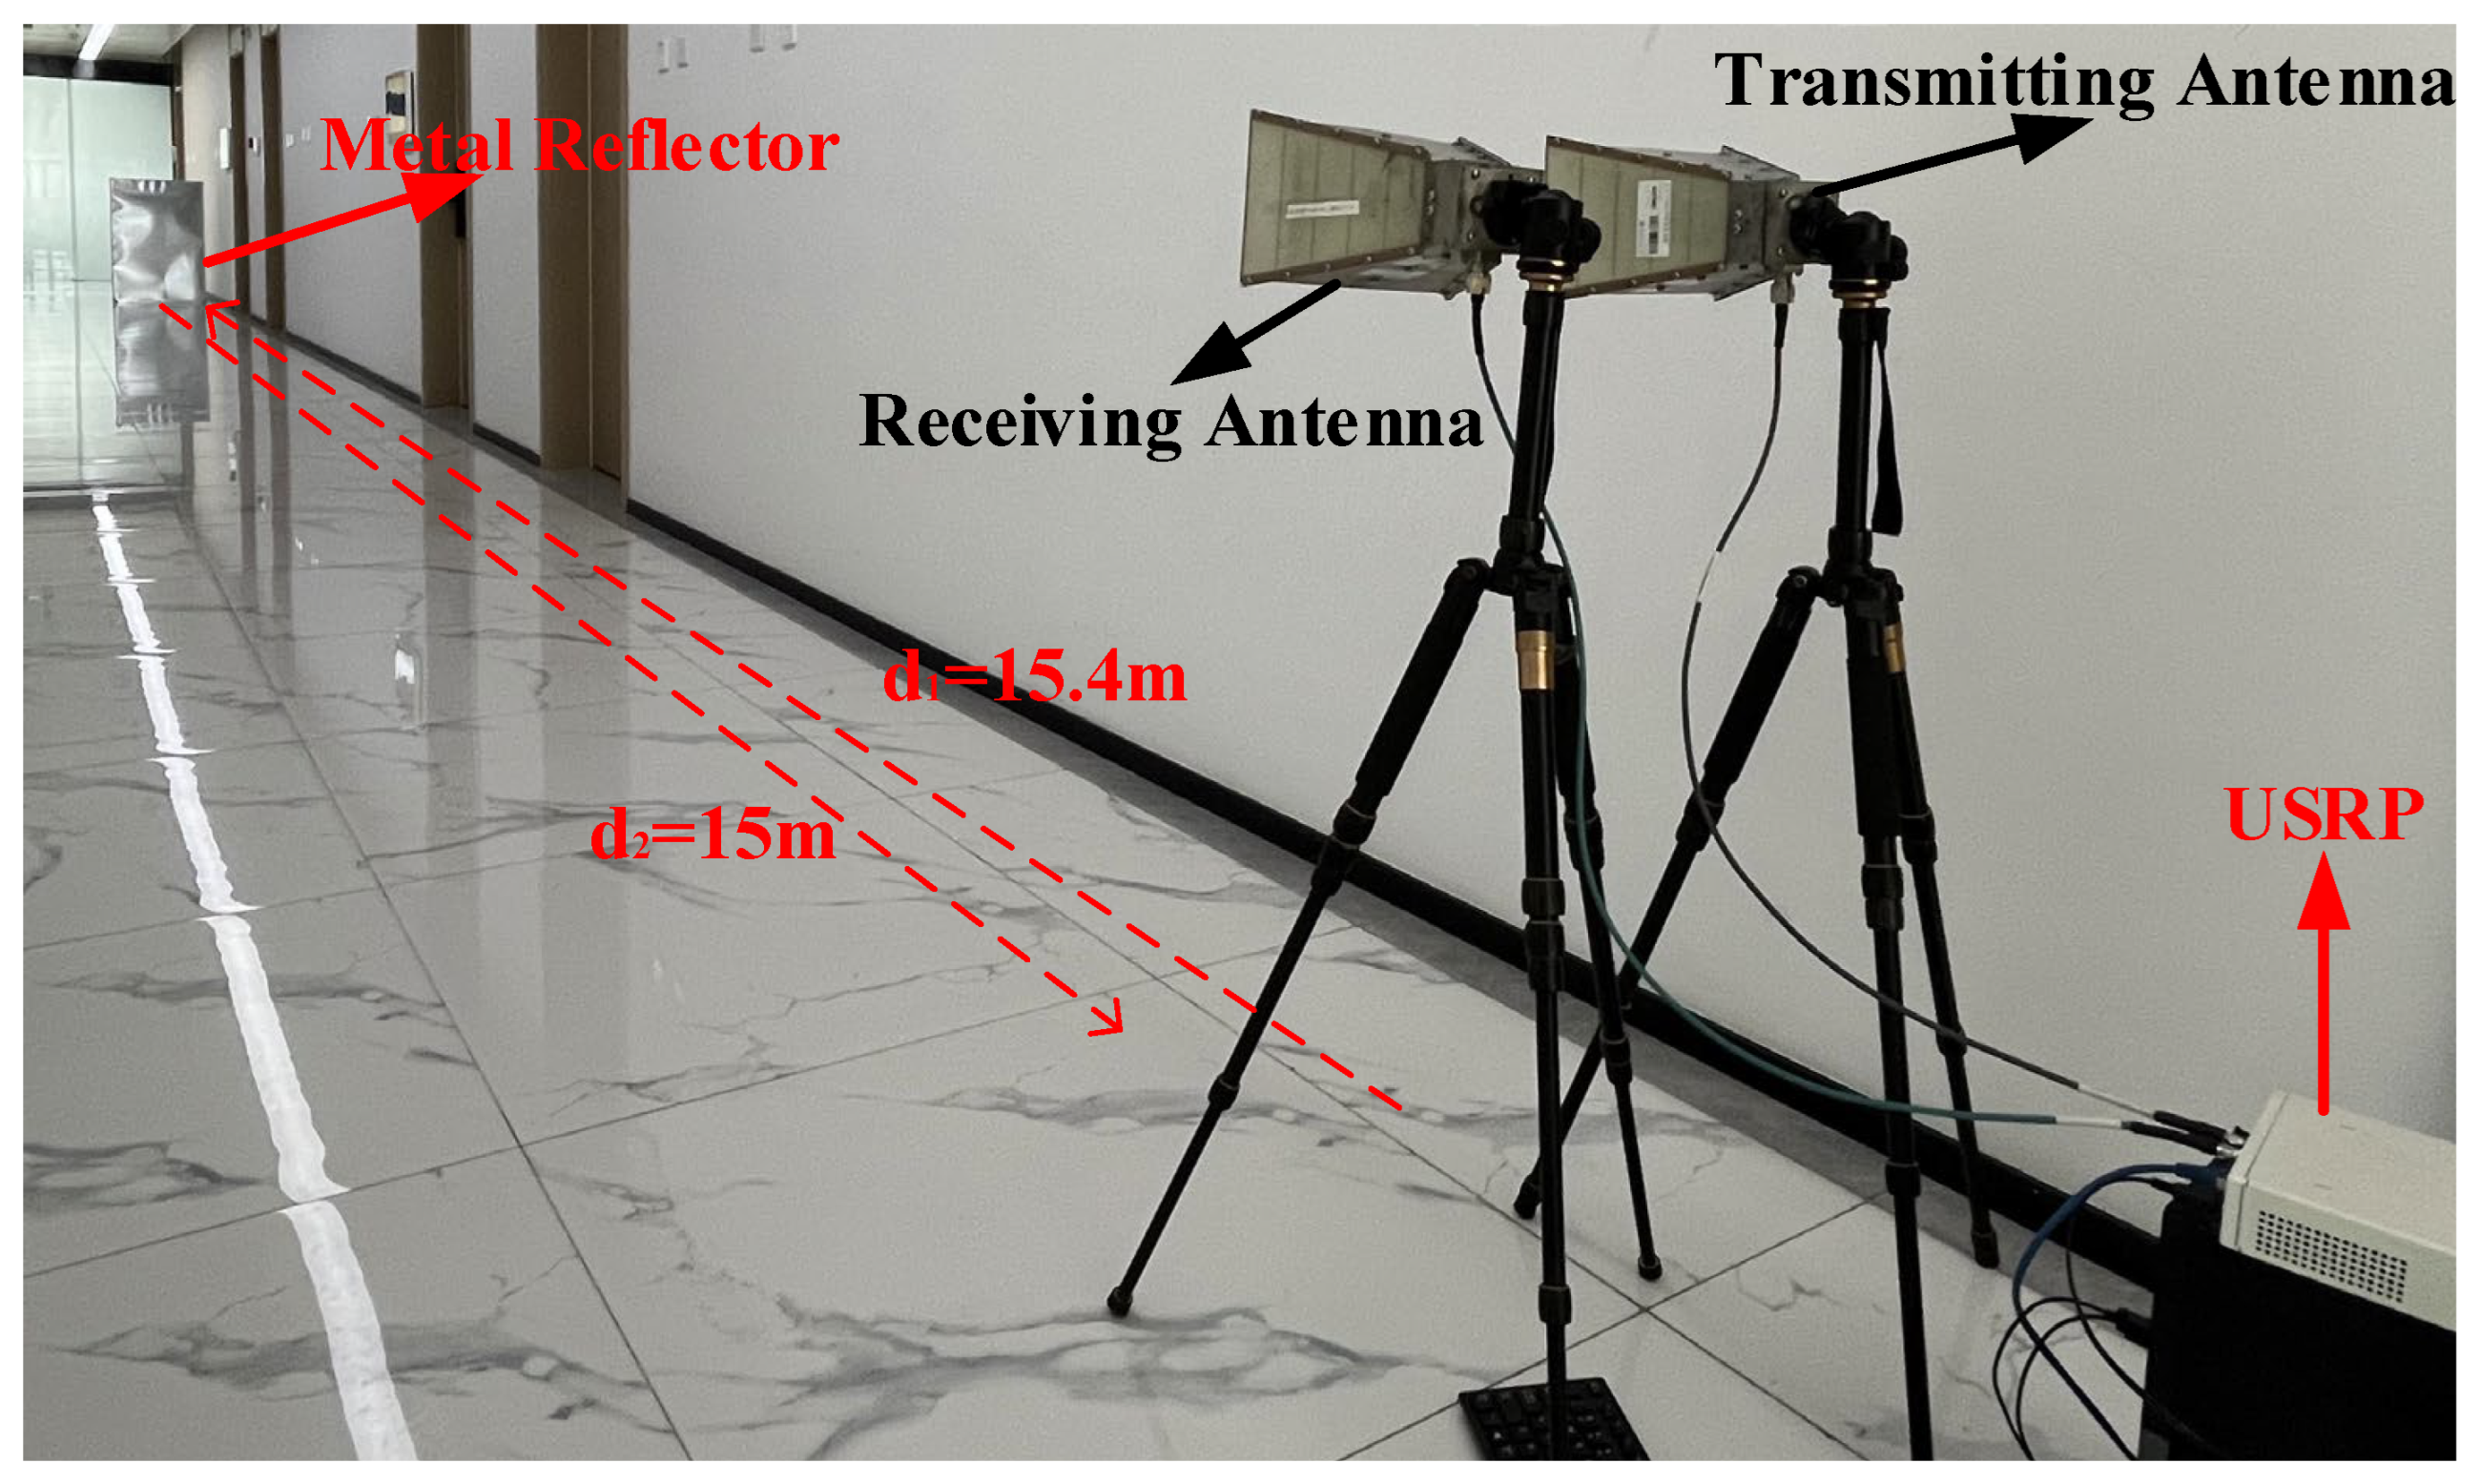
5.4. Corridor Test Results
To further validate the feasibility of the proposed approach, this study employed corridor testing [28,29], utilizing directional antennas to control the direction of signal transmission. Reflective paths were created using metal plates and the arrangement placed the transmitting antenna behind the receiving antenna, establishing the first path. By adjusting the distance between the metal reflector and the antennas, the delay of the second path was effectively controlled. The testing environment is illustrated in Figure 5:
Figure 5.
Corridor test environment diagram.
In Figure 5, the subtraction and addition of and represent the transmission distances for the first and second paths, respectively. From this, the delay difference between them is calculated to be 100 ns. Analyzing the signals received by the antenna enables the identification of the sample points where the two paths differ. By calculating the time interval between these sample points, the absolute delay for both paths can be accurately determined. The measurement results are presented in Table 3:
Table 3.
Corridor test results.
In Table 3, given the reception sampling frequency of 110 MHz and a sampling interval of 9.1 ns, the absolute delay difference between the two paths is calculated to be 100.22 ns, with a total error of 0.22 ns, which corresponds to a measurement distance error of 0.07 m. Based on the sampling interval, the estimation error can be computed as (c represents the speed of light, ), or approximately (−1.37 m, 1.37 m). According to the results of the corridor testing, the measurement error falls within the specified range and meets the expected outcomes.
6. Conclusions and Discussion
This paper proposes an improved method for measuring multipath delays in wireless channels tailored to environmental needs. This method integrates the correlation properties of m-sequences, Kalman filtering, sliding correlation, and the WRELAX estimation algorithm, providing a high-resolution channel delay estimation algorithm suitable for various noise environments. Kalman filtering enhances the signal-to-noise ratio by more than 6dB, while the sliding correlation method utilizes the autocorrelation properties of PN sequences to identify multipath correlation peaks. The results are then iteratively estimated for wireless channel multipath delay parameters using the WRELAX algorithm. The delay resolution and estimation error of the proposed algorithm outperform other methods to varying degrees under different signal-to-noise ratios. Experimental simulations and channel simulator test results demonstrate that the KFSC-WRELAX method achieves low error-estimation delays while controlling the number of iterations.
Author Contributions
Methodology, Y.D., Z.Z.; software, Y.D.; validation, Y.D., Z.Z.; formal analysis, Y.D.; investigation, Y.D.; resources, Y.D., Z.Z.; data curation, Y.D.; writing—original draft preparation, Y.D.; writing—review and editing, Y.D.; funding acquisition, Z.Z. All authors have read and agreed to the published version of the manuscript.
Funding
This research was funded by National Key R&D Program of China, 2022YFB2902100, and The Startup Foundation for Introducing Talent of NUIST, 2023r134.
Institutional Review Board Statement
Not applicable.
Informed Consent Statement
Not applicable.
Data Availability Statement
Data available upon request from the authors if the paper is accepted.
Conflicts of Interest
The authors declare no conflicts of interest.
Abbreviations
The following abbreviations are used in this manuscript:
| WRELAX | Weighted Fourier Transform combined with the RELAXation |
| PN | Pseudorandom Noise |
| KF | Kalman Filtering |
| FZC | Frank Zadoff Chu |
| SNR | Signal-to-Noise Ratio |
| LFSR | Linear Feedback Shift Register |
| ZC | Zadoff-Chu |
| PAPR | Peak-to-Average Power Ratio |
| RMSE | Root Mean Square Error |
References
- Zhang, Z.; Deng, Z.; Liu, J.; Ding, Z.; Liu, B. LJCD-Net: Cross-Domain Jamming Generalization Diagnostic Network Based on Deep Adversarial Transfer. Sensors 2024, 24, 3266. [Google Scholar] [CrossRef] [PubMed]
- Ren, Z.; Li, G.; Ji, C.; Yu, C.; Wang, S.; Wang, R. CASTER: A Computer-Vision-Assisted Wireless Channel Simulator for Gesture Recognition. IEEE Open J. Commun. Soc. 2024, 5, 3185–3195. [Google Scholar] [CrossRef]
- Zhang, L.; Zhang, T.; Wei, H. A Single Source-Aided Inertial Integrated Navigation Scheme for Passive Navigation of Autonomous Underwater Vehicles. IEEE Sens. J. 2024, 24, 11237–11245. [Google Scholar] [CrossRef]
- Nabati, M.; Ghorashi, S.A. A real-time fingerprint-based indoor positioning using deep learning and preceding states. Expert Syst. Appl. 2023, 213, 118889–118902. [Google Scholar] [CrossRef]
- Liu, N.; Liu, Z.; Gao, J.; Yuan, Y.; Yan Chan, K. Wi-Fi fingerprint-based indoor location: Multiple fingerprints and multiple classifiers with two-layer fusion weights. Int. J. Commun. Syst. 2024, e5828. [Google Scholar] [CrossRef]
- Sun, M.; Wang, Y.; Xu, S.; Cao, H.; Si, M. Indoor Positioning Integrating PDR/Geomagnetic Positioning Based on the Genetic-Particle Filter. Appl. Sci. 2020, 10, 668. [Google Scholar] [CrossRef]
- Wang, T.; Han, L.; Kong, Q.; Li, Z.; Li, C.; Han, J.; Bai, Q.; Chen, Y. An improved particle filter indoor fusion positioning approach based on Wi-Fi/PDR/geomagnetic field. Def. Technol. 2024, 32, 443–458. [Google Scholar] [CrossRef]
- Marouane, C.; Maier, M.; Feld, S.; Werner, M. Visual positioning systems—An extension to MoVIPS. In Proceedings of the 2014 International Conference on Indoor Positioning and Indoor Navigation (IPIN), Busan, Republic of Korea, 27–30 October 2014; pp. 95–104. [Google Scholar]
- Yuksel, Y. Design and Analysis of Inertial Navigation Systems with Skew Redundant Inertial Sensors. Ph.D. Thesis, University of Calgary, Calgary, AB, Canada, 2011. [Google Scholar]
- Liao, H.; Wang, H.; Zhang, S.; Zang, X. Design of real-time multipath channel sounder system based on GNU Radio. Electron. Meas. Technol. 2020, 43, 148–152. [Google Scholar] [CrossRef]
- Zhao, D.; Duan, H.; Zhang, X.; Liu, C. Research on Multipath Delay Estimation in Wireless Channels. Study Opt. Commun. 2019, 1, 53–58. [Google Scholar] [CrossRef]
- Ren, J. Research on Measurement Method of Wireless Channel Transmission Characteristics in Complicated Mountain Environment. Master’s Thesis, Southwest University of Science and Technology, Mianyang, China, 2022. [Google Scholar] [CrossRef]
- Li, H. Research on Optimization of Channel Estimation Algorithm Based on Machine Learning. Master’s Thesis, University of Electronic Science and Technology of China, Chengdu, China, 2020. [Google Scholar] [CrossRef]
- Liu, H.; Liang, J.; Chen, K.; Liao, T. Wireless Channel Simulation and Measurement of Maglev Tunnel. In Proceedings of the 2022 3rd Information Communication Technologies Conference (ICTC), Nanjing, China, 6–8 May 2022; pp. 25–32. [Google Scholar]
- Ness, G.J.; Helleseth, T. A New Three-Valued Cross Correlation Between m-Sequences of Different Lengths. IEEE Trans. Inf. Theory 2006, 52, 4695–4701. [Google Scholar] [CrossRef]
- Cui, G.; He, Y.; Li, P.; Wang, W. Enhanced Timing Advanced Estimation With Symmetric Zadoff-Chu Sequences for Satellite Systems. IEEE Commun. Lett. 2015, 19, 747–750. [Google Scholar] [CrossRef]
- Wittig, S.; Peter, M.; Keusgen, W. Channel estimation with Zadoff–Chu sequences in the presence of phase errors. Electron. Lett. 2023, 59, e12996. [Google Scholar] [CrossRef]
- Xu, R.; Xu, F.; Song, Y.; Duan, L.; Song, Y.; Tan, S.; Liu, Z. Impact of spectral filtering on pulse breaking-up and noise-like pulse generation in all-normal dispersion fiber lasers. Opt. Express 2020, 28, 21348–21358. [Google Scholar] [CrossRef] [PubMed]
- Bao, L.; Li, K.; Lee, J.; Dong, W.; Li, W.; Shin, K.; Kim, W. An Enhanced Indoor Three-Dimensional Localization System with Sensor Fusion Based on Ultra-Wideband Ranging and Dual Barometer Altimetry. Sensors 2024, 24, 3341. [Google Scholar] [CrossRef] [PubMed]
- Garcia, R.V.; Pardal, P.C.P.M.; Kuga, H.K.; Zanardi, M.C. Nonlinear filtering for sequential spacecraft attitude estimation with real data: Cubature Kalman Filter, Unscented Kalman Filter and Extended Kalman Filter. Adv. Space Res. 2019, 63, 1038–1050. [Google Scholar] [CrossRef]
- Vedel-Larsen, E.; Fuglø, J.; Channir, F.; Thomsen, C.E.; Sørensen, H.B. A comparative study between a simplified Kalman filter and Sliding Window Averaging for single trial dynamical estimation of event-related potentials. Comput Methods Programs Biomed. 2010, 99, 252–260. [Google Scholar] [CrossRef] [PubMed]
- Li, J.; Wu, R. An efficient algorithm for time delay estimation. IEEE Trans. Signal Process. 1998, 46, 2231–2235. [Google Scholar] [CrossRef]
- Jia, Q.; Wu, R.; Wang, W.; Wang, D.; Li, J. Multipath interference mitigation in GNSS via WRELAX. GPS Solut. 2017, 21, 487–498. [Google Scholar] [CrossRef]
- Feder, M.; Weinstein, E. Parameter estimation of superimposed signals using the EM algorithm. IEEE Trans. Acoust. Speech Signal Process. 1988, 36, 477–489. [Google Scholar] [CrossRef]
- Kuroda, M.; Geng, Z.; Sakakihara, M. Improving the vector [Math Processing Error] acceleration for the EM algorithm using a re-starting procedure. Comput Stat. 2015, 30, 1051–1077. [Google Scholar] [CrossRef]
- Wang, Y.; Chai, J.; Li, N.; Chen, P.; Wang, W. An Implementation of Fading Channel Simulator for Discrete-Time Wireless Communication Based on USRP Platform. In Proceedings of the 2023 IEEE 6th International Conference on Electronic Information and Communication Technology (ICEICT), Qingdao, China, 21–24 July 2023; pp. 788–792. [Google Scholar]
- Taotao, Z.; Yunge, T.; Huidong, Q.; Jianling, C.; Shuli, D. Design And Implementation of an Efficient Wireless Channel Simulator. In Proceedings of the 2021 IEEE 4th Advanced Information Management, Communicates, Electronic and Automation Control Conference (IMCEC), Chongqing, China, 18–20 June 2021; pp. 2175–2178. [Google Scholar]
- Zhou, Z.; Zhang, L.; Chen, X.; Wang, C.-X.; Huang, J. Multi-Frequency Wireless Channel Measurements and Characteristics Analysis in Indoor Corridor Scenarios. In Proceedings of the 2021 IEEE 94th Vehicular Technology Conference (VTC2021-Fall), Norman, OK, USA, 27–30 September 2021; pp. 1–5. [Google Scholar]
- Hui, X.; Wuxiong, Z.; Yang, Y. Channel Measurement and Modeling for the 15-GHz Radio Band in an Indoor Corridor Environment. J. Commun. Inf. Netw. 2016, 1, 102–108. [Google Scholar]
Disclaimer/Publisher’s Note: The statements, opinions and data contained in all publications are solely those of the individual author(s) and contributor(s) and not of MDPI and/or the editor(s). MDPI and/or the editor(s) disclaim responsibility for any injury to people or property resulting from any ideas, methods, instructions or products referred to in the content. |
© 2024 by the authors. Licensee MDPI, Basel, Switzerland. This article is an open access article distributed under the terms and conditions of the Creative Commons Attribution (CC BY) license (https://creativecommons.org/licenses/by/4.0/).