5.2. Evaluation Indicators
Structural similarity (SSIM) and peak signal-to-noise ratio (PSNR) are generally used to measure the quality of images restored by dehazing algorithms.
PSNR is evaluated by calculating the mean square error (MSE) between the clean image and the restored image. The smaller the value of MSE, the larger the value of PSNR, indicating a better dehazing effect of the model. For
-sized images, MSE and PSNR can be obtained by Equations (15) and (16), respectively:
where
is the maximum possible pixel value of the clean image.
SSIM is distinct from Equation (
9) in that it measures the similarity between two images by evaluating their luminance, contrast, and structure. The expression for SSIM is as follows:
where
and
denote the variance of images
X and
Y;
and
denote the mean of images
X and
Y;
,
, and
are constant terms;
denotes the covariance of images
X and
Y.
In the object detection task, mean average precision (mAP), frames per second (FPS), and the total number of parameters (Params) serve as metrics for evaluating both the algorithm’s detection accuracy and speed, as well as the model’s size. mAP is the mean of the average precision (AP) for each type of object and is calculated as follows:
where
C denotes the total number of categories, and
represents the AP for the class numbered
i.
is calculated using the interpolation method as follows:
where P(R) is the mapping relationship between precision (P) and recall (R). Precision and recall are also prevalent evaluation metrics in object detection, and their computation methods are as follows:
where TP denotes the number of objects predicted as positive samples that are actually positive; FP signifies the number of objects predicted as positive samples that are actually negative; FN represents the instances predicted as negative samples that are actually positive.
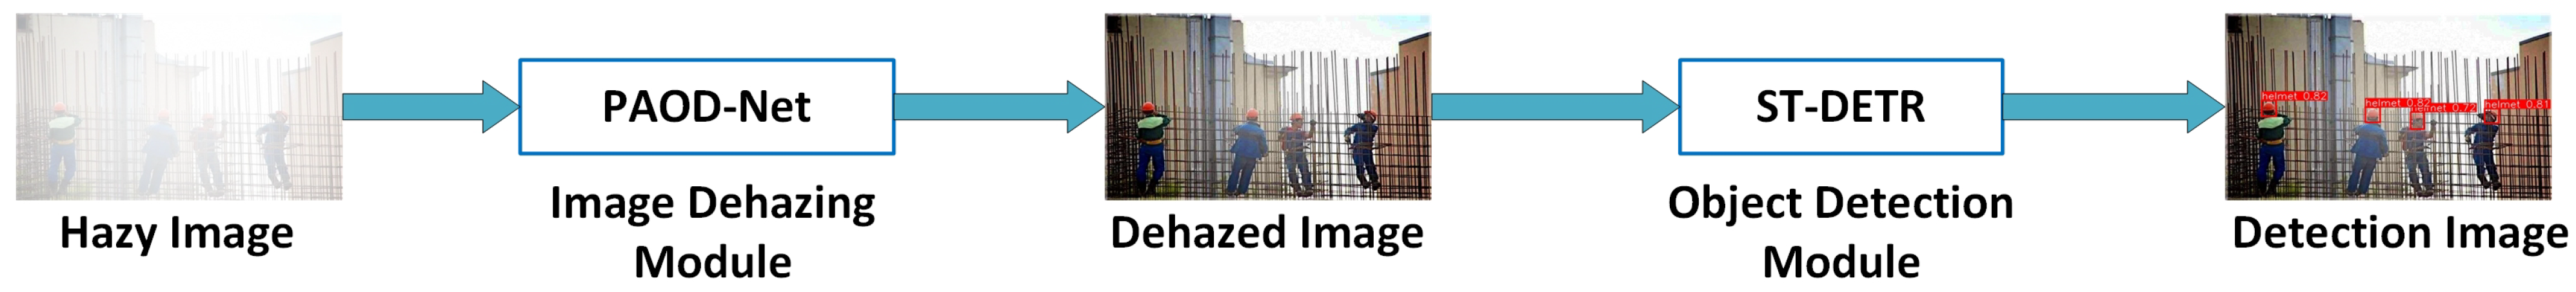
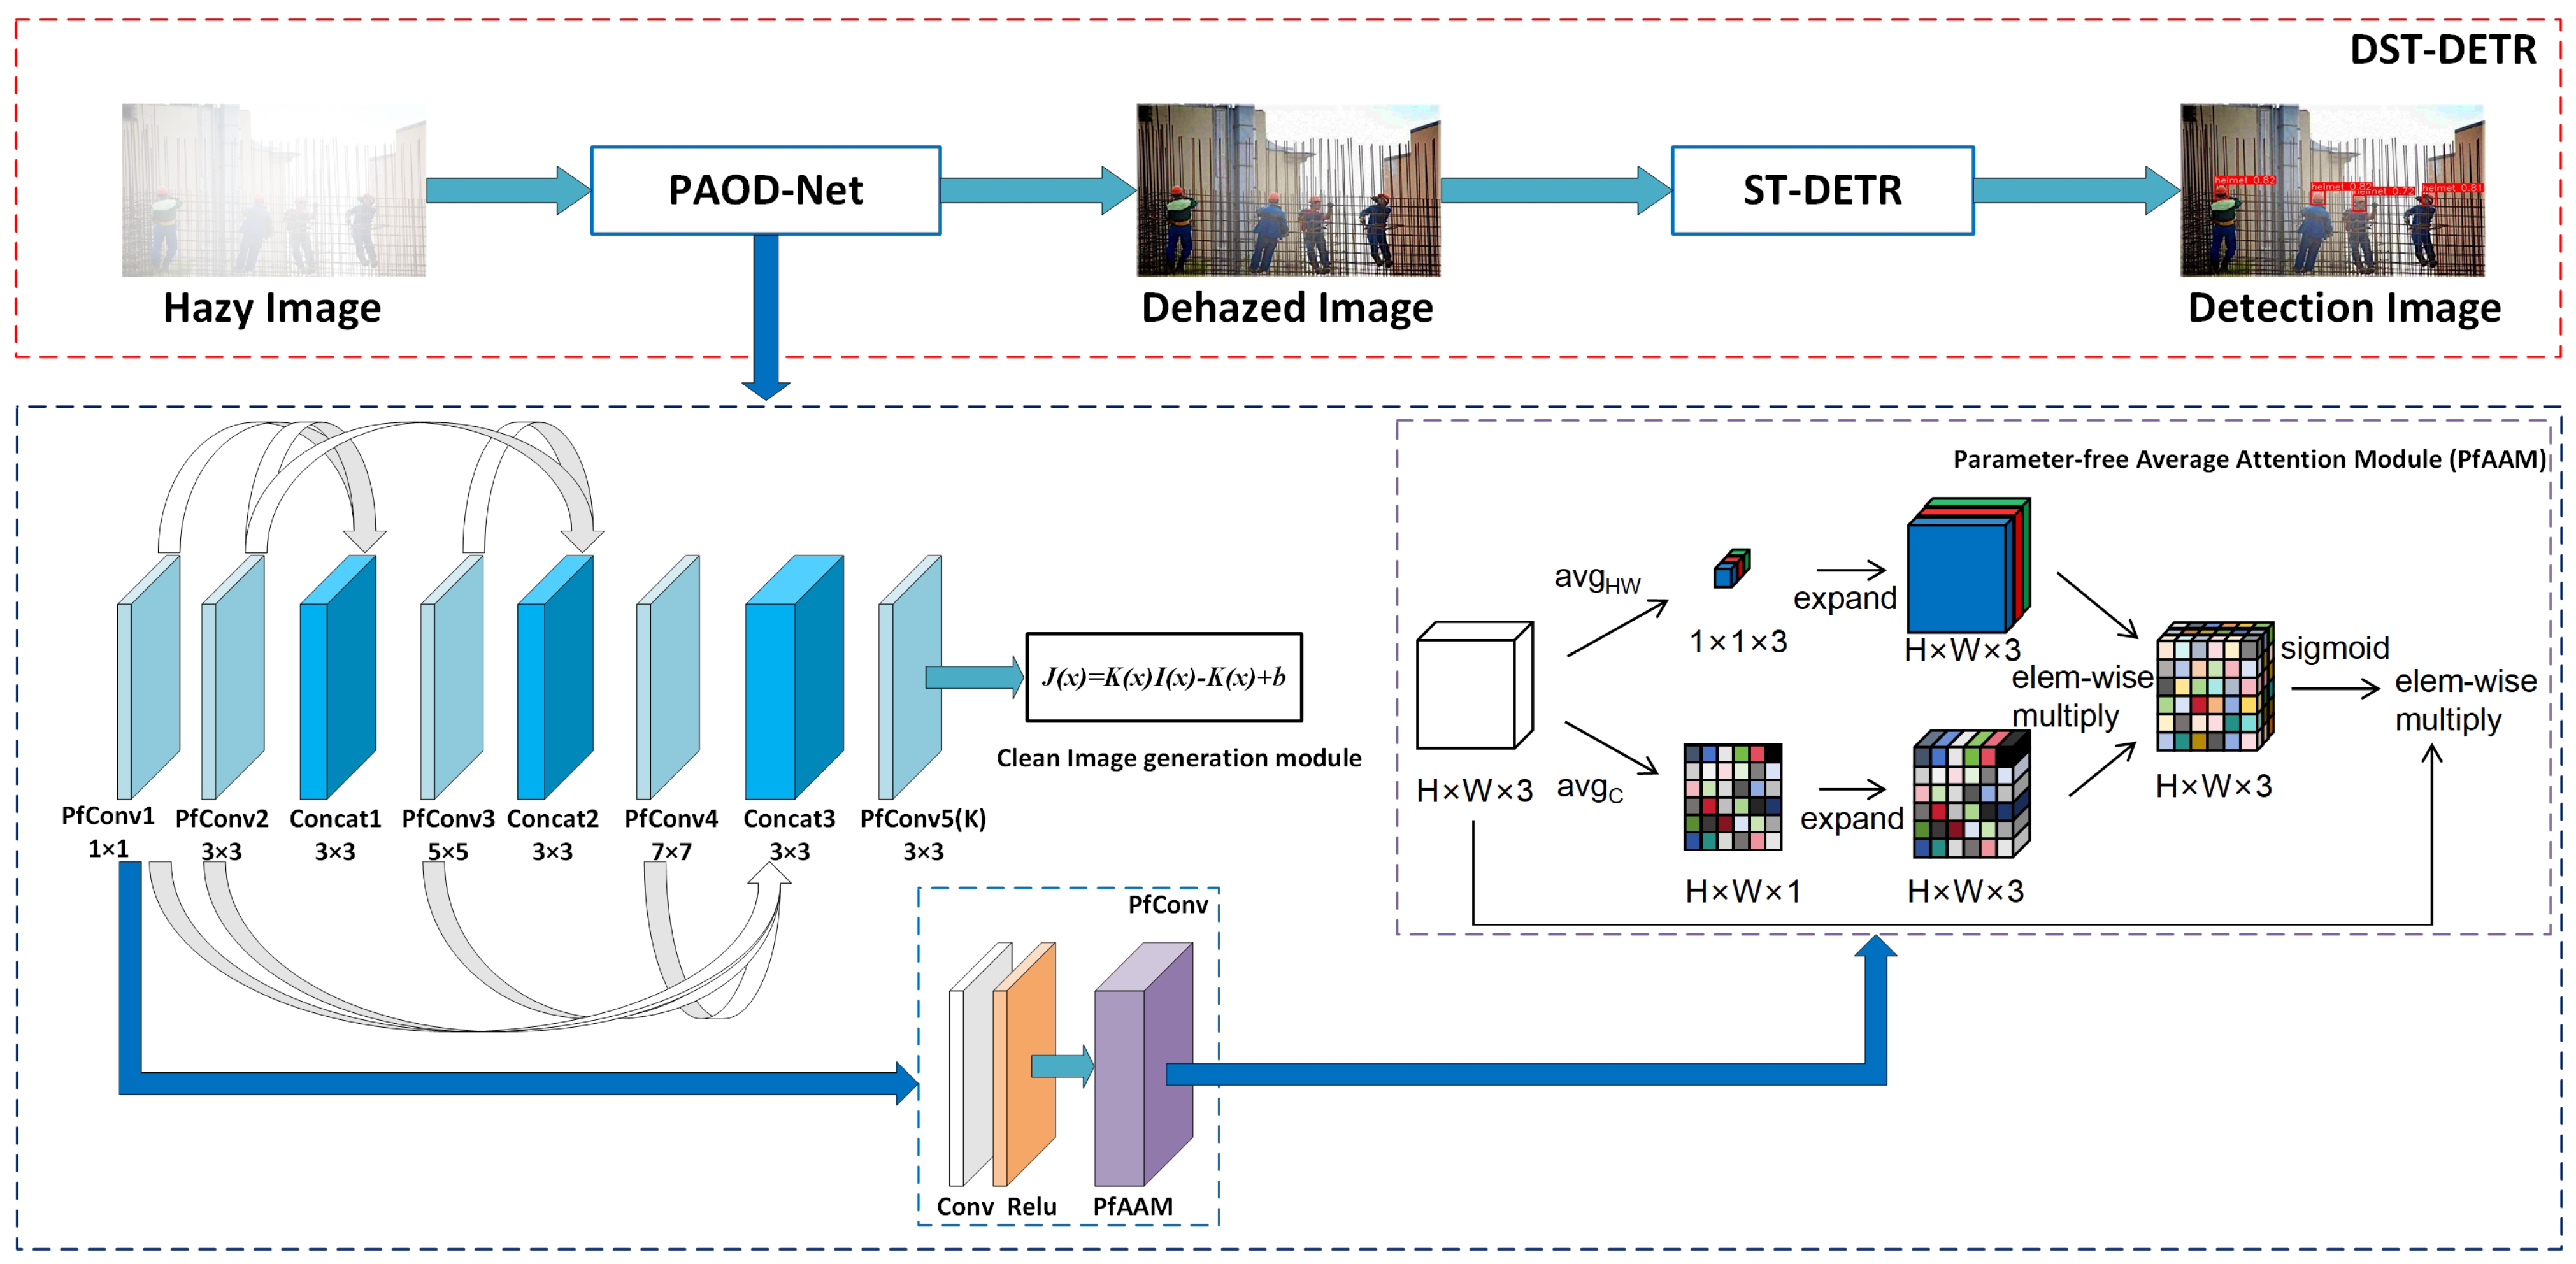
5.3. Image Dehazing Experiments
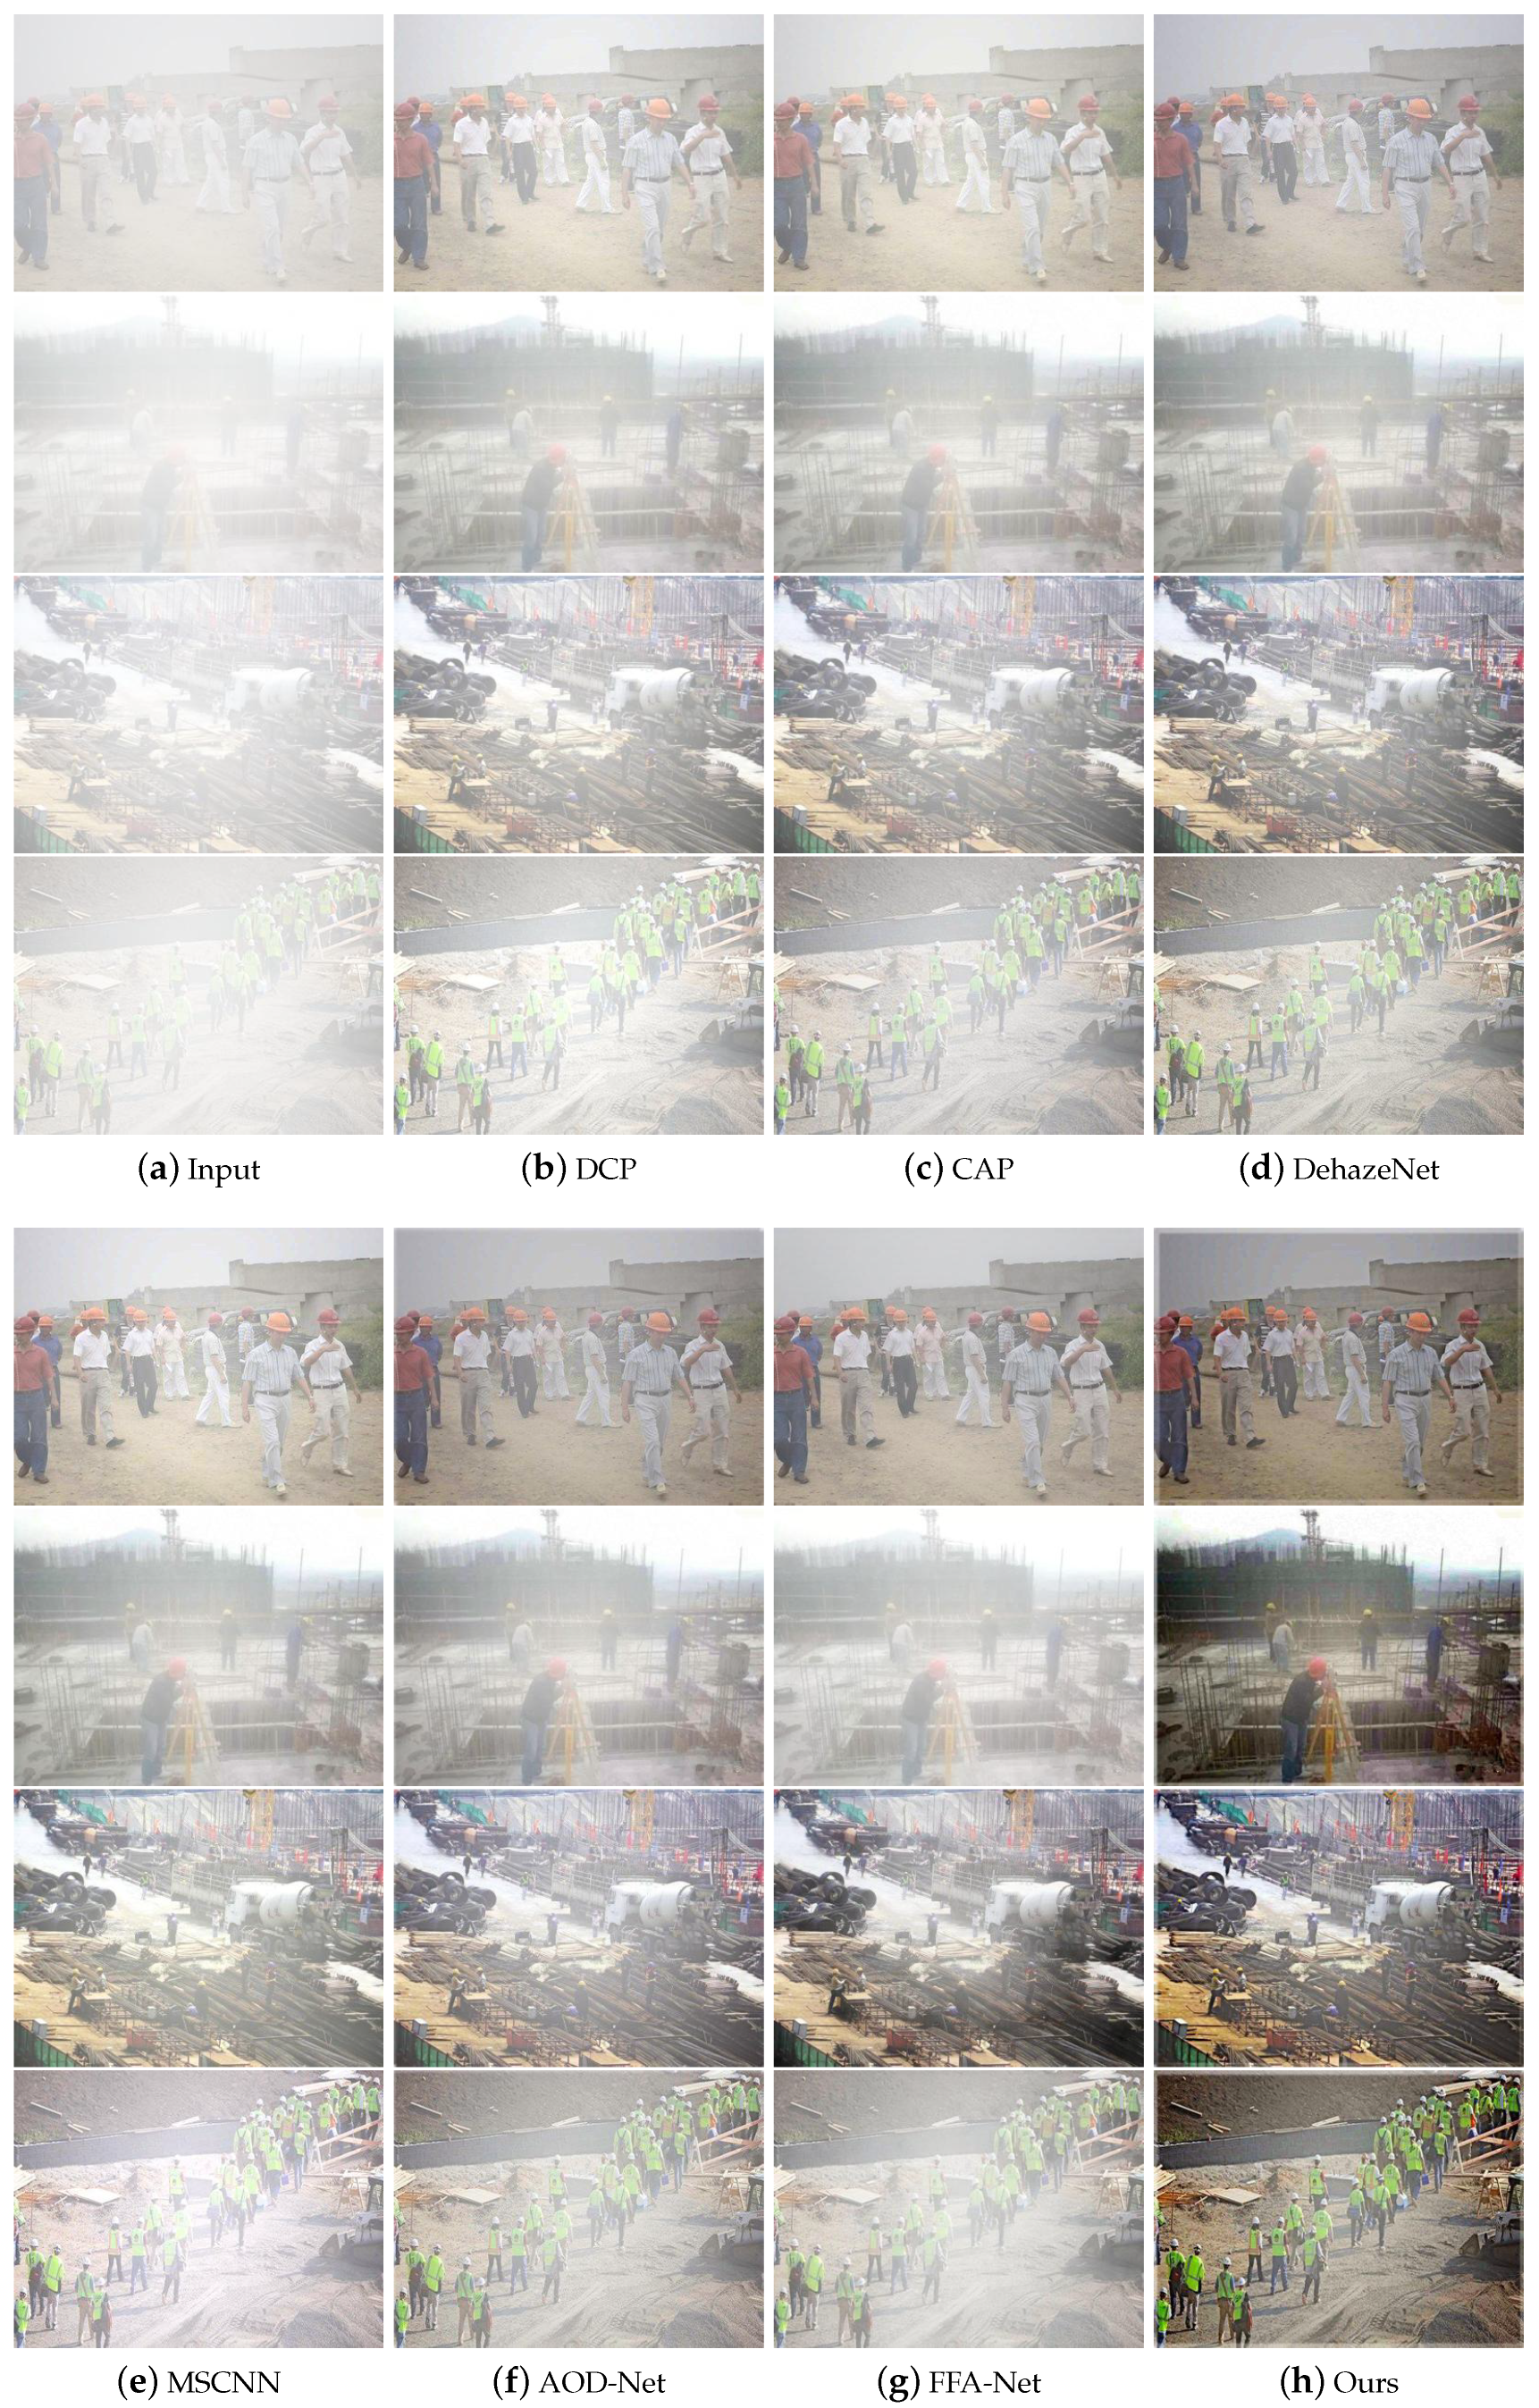
The quality of image recovery after dehazing can greatly affect the accuracy of object detection in foggy environments. In this paper, we design PAOD-Net (Ours) to compare with traditional DCP and CAP algorithms and deep convolutional neural network-based algorithms, including DehazeNet, MSCNN, AOD-Net, and FFA-Net. To better serve the object detection network, this paper selects the heavy haze test set, which has the most significant impact on the network, for a dehazing effect comparison. As illustrated in
Figure 8, images from various angles and backgrounds are chosen to verify the algorithm’s robustness. From the figure, it can be seen that the aforementioned dehazing algorithms generally exhibit uneven dehazing, resulting in darker, less clear images, which significantly impact subsequent image recognition tasks. As illustrated in
Figure 8h, our algorithm restores more details, markedly enhances image quality, and improves both saturation and color, rendering the visual effect much clearer. We hypothesize that the dehazing network makes the helmet colors more vivid, increasing the detector’s sensitivity to the helmet’s color features. This distinction helps differentiate the helmet from similarly colored background objects, further addressing issues of missed and false detections.
To make a full range of accurate comparisons, we evaluated them on three test sets with different haze concentrations. To evaluate the effectiveness and real-time performance of the aforementioned haze removal algorithms, the objective evaluation metrics PSNR and SSIM, as well as the average running time of each model, were employed. The average objective evaluation results of dehazed images for test sets with various haze densities, as well as the average running times of different models, are shown in
Table 1. As shown in the table, for the objective metrics PSNR and SSIM, while DCP achieves faster dehazing speed, its dehazing effect is suboptimal across all test sets. CAP and MSCNN perform well in light haze but poorly in heavy haze. DehazeNet and FFA-Net show excellent dehazing effects in light and medium haze, but their performance in heavy haze is unsatisfactory, and their dehazing times are too long to meet real-time requirements. Although AOD-Net has a very fast dehazing speed, meeting real-time requirements, its overall dehazing effect is relatively poor. Comparatively, the proposed PAOD-Net method demonstrates the strongest overall performance across all haze densities, achieving the best dehazing effect for heavy haze and leading performance for light and medium haze. Additionally, it significantly outperforms the aforementioned algorithms in dehazing efficiency. Compared to AOD-Net, the dehazing efficiency remains unaffected, and robustness is greatly enhanced, which is the primary reason for using PAOD-Net in this experiment.
To further demonstrate the effectiveness of this experiment for improving AOD-Net, ablation experiments were performed on PAOD-Net. The design compares the impact on model performance of replacing the PfConv module and various combinations of loss functions, along with the experimental results on the multiple haze level test set, as shown in
Table 2. For MS-SSIM, the Gaussian filters were constructed by setting
. The loss function for MS-SSIM +
used
, and MS-SSIM +
used
, following [
41]. As shown in the table, the PfConv module significantly enhances both the PSNR and SSIM of the model. When using the
loss function alone, the SSIM value is lower than when using the
loss function alone, and the combination of MS-SSIM and
loss function yields the best performance. The experiments demonstrate that our proposed improvements in PAOD-Net are highly effective, greatly enhancing dehazing effects and better restoring image quality. The effectiveness of our model is attributed to the PfConv module we designed, which, compared to the original Conv module, focuses more on critical features. This mechanism efficiently combines different features. Additionally, the introduction of the MS-SSIM +
loss function has profoundly impacted the robustness of image restoration.
5.4. Object Detection Experiments
From
Figure 8, it can be seen that the helmet images, after dehazing, display more distinct contours, enhanced information richness, and improved recognizability and contrast. Therefore, we combined the dehazing model with the object detection model for joint training, enabling effective helmet detection in foggy conditions. To assess the effectiveness of the joint optimization model introduced in this study for detecting helmets in hazy conditions, this experiment was conducted on the joint test set for both horizontal and vertical comparison experiments. The improved ST-DETR (Ours) algorithm is compared with the current most popular Faster R-CNN, SSD, YOLO series, and RT-DETR object detectors after PAOD-Net dehazing experiments. To ensure that the model sizes are similar, Faster R-CNN under ResNet50, SSD under VGG16, and YOLOv5-M, YOLOv8-M, YOLOv9-M, YOLOv10-M, and RT-DETR-R18 are selected as the baseline models for the experiments, and the mAP detection results of the different models under different haze concentrations are given in
Table 3. From the table, it can be seen that the YOLO and DETR series exhibit leading detection performance, with each YOLO model demonstrating considerable competitiveness. However, compared to our model, nearly all models display a common issue: they perform well in light and medium haze but poorly in heavy haze, lacking good generalization capabilities to handle complex and variable adverse weather. In comparison to RT-DETR, our model shows improvements in mAP@0.5 by 3.7%, 3.6%, and 4.0% under light, medium, and heavy haze conditions, respectively. This demonstrates that, supported by a high-level dehazing model, our enhanced object detection model is suitable for any haze density and performs best in heavy haze. This endows the entire model framework with exceptional dehazing detection performance and robustness.
In addition to verifying accuracy, the model’s overall evaluation should also be competitive.
Table 4 provides the detection results of different detectors under various haze concentrations. From the table, it can be seen that our model outperformed the pre-improved RT-DETR-R18, with an mAP@0.5 increase of 4.7% and an mAP@0.5:0.95 enhancement of 8.4%. Compared to RT-DETR-L, our model shows an mAP@0.5 rise of 4.5% and an mAP@0.5:0.95 increase of 7.4%. These results indicate that our optimizations for helmet detection can achieve high precision. Furthermore, our detection accuracy surpasses that of YOLOv5-M, YOLOv8-M, YOLOv9-M, and YOLOv10-M, demonstrating that our model can attain superior accuracy with similar parameter quantities while also meeting real-time requirements. In comparison to YOLOv7, our model not only achieves higher precision but also features fewer parameters, showcasing its lightweight nature. This signifies that our model can deliver high-precision performance while emphasizing its lightweight characteristics, making it more suitable for deployment in scenarios requiring helmet detection, such as drones and surveillance cameras.
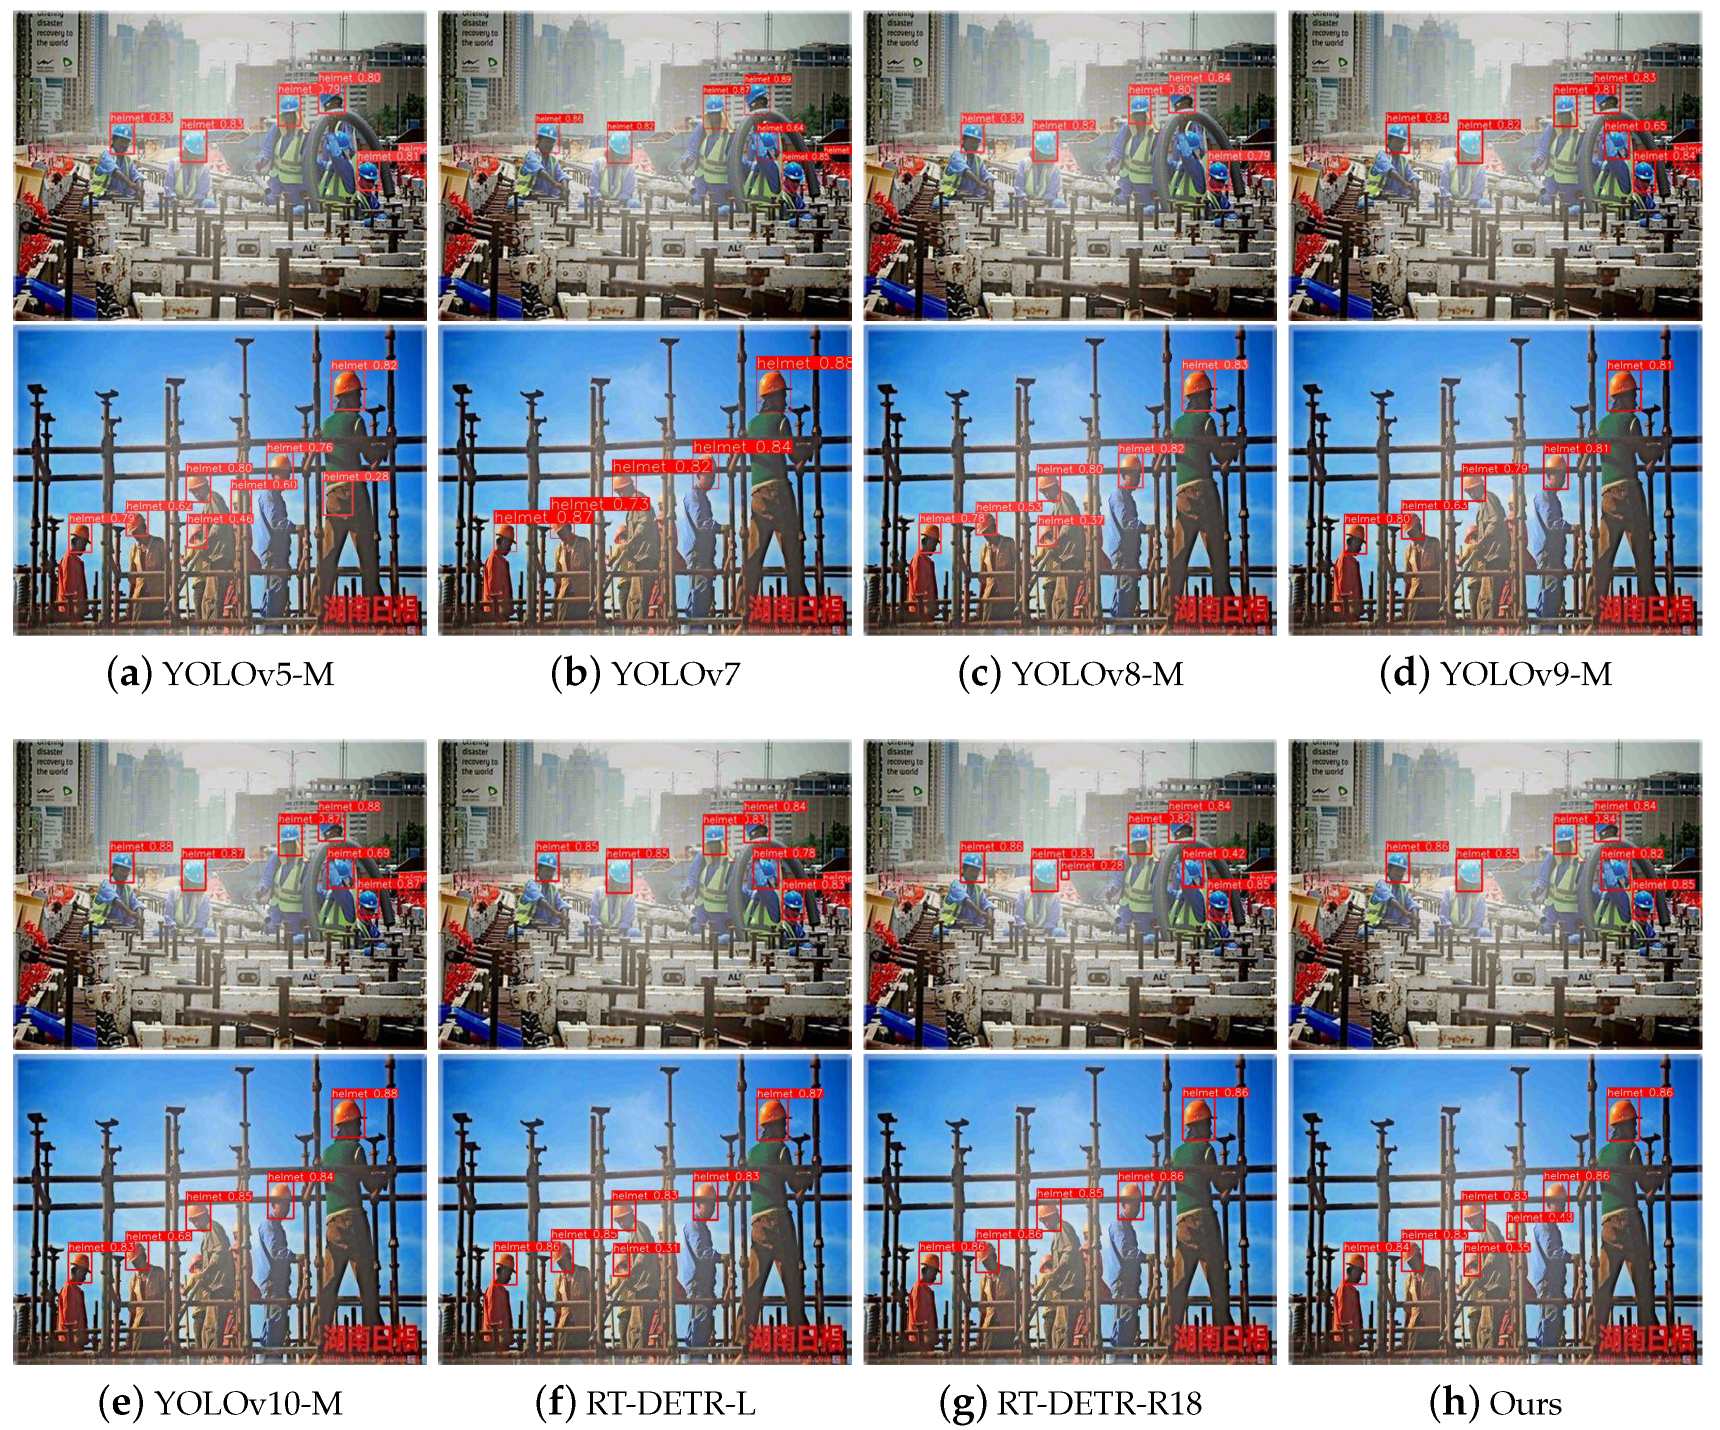
To more intuitively validate the object detection effectiveness and robustness of the proposed ST-DETR model, we present the visualization results of ST-DETR alongside YOLOv5-M, YOLOv7, YOLOv8-M, YOLOv9-M, YOLOv10-M, RT-DETR-L, and RT-DETR-R18 in
Figure 9 for an extensive qualitative comparison. The figure illustrates the multi-object detection performance of various detectors for helmets in different backgrounds, angles, and colors.
From the comparison of the two rows in the figure, it is evident that for safety helmet detection, which often appears as small objects in construction scenes, our method not only identifies helmets heavily obscured by other objects to address missed detection but also prevents helmets from being misidentified due to background objects of similar color. The effectiveness of our method is attributed to embedding the small-object layer into the BiFPN structure, which is inherently favorable to small-object detection, and further optimizing for high-precision helmet detection.
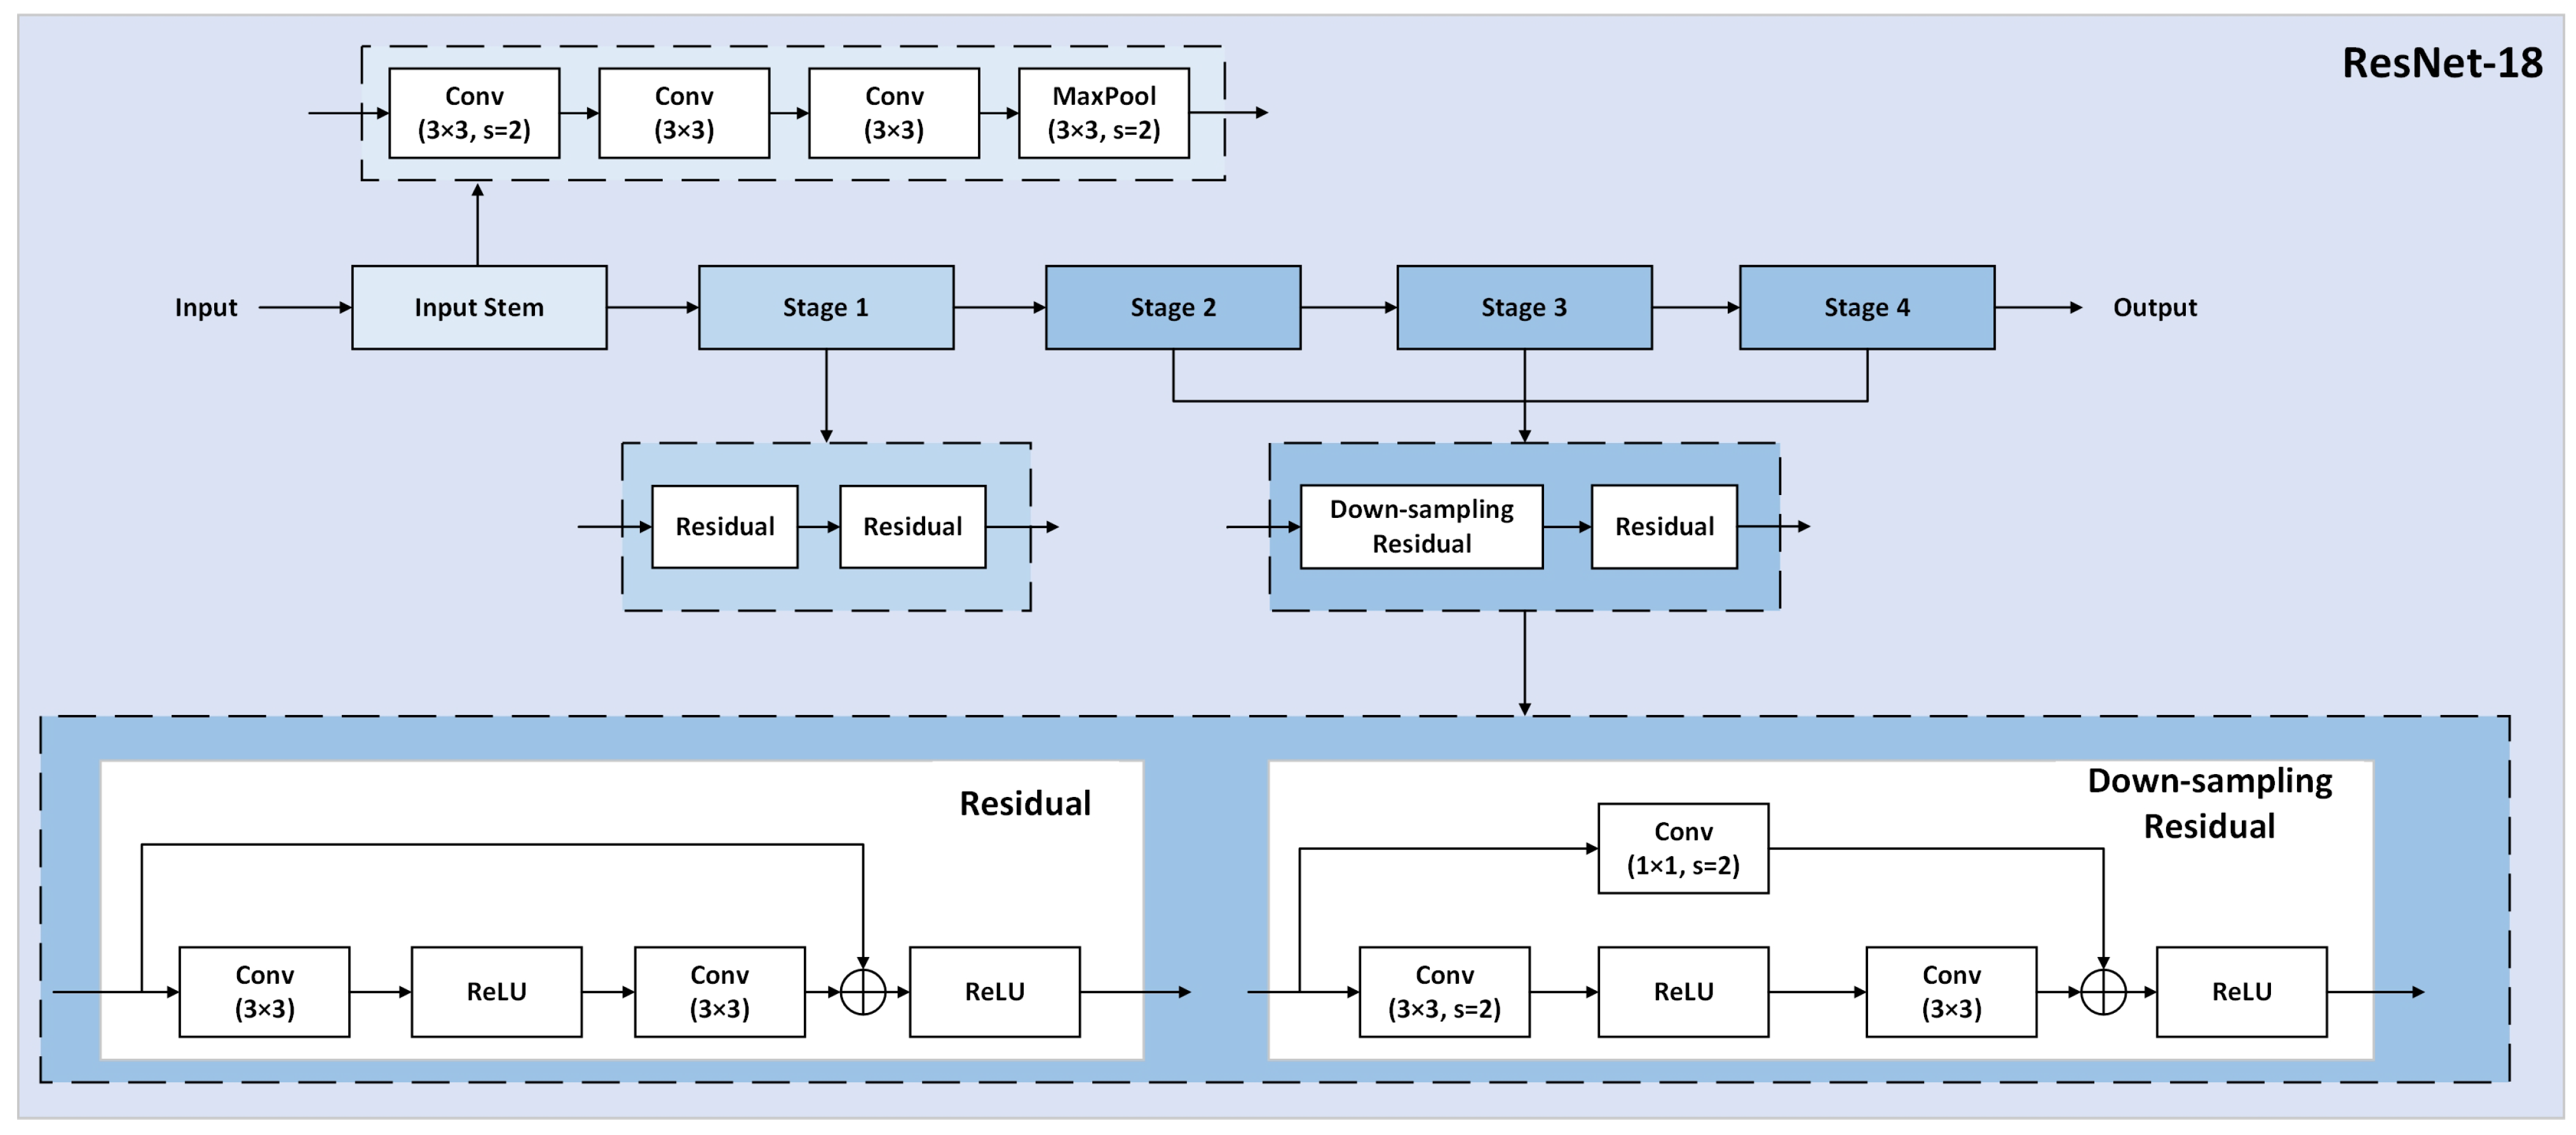
To further validate the effectiveness of this experiment for the improvement of the RT-DETR model, ablation experiments were conducted on ST-DETR. The design uses ResNet-18 as the benchmark, comparing the effect of adding BiFPN and combining a small target layer on the detector’s performance, as shown in
Table 5. The table demonstrates that under conditions of multiple haze, our proposed ST-DETR model significantly benefits from the BiFPN structure. The introduction of P2 has had an embellishing effect, effectively enhancing the detection performance of RT-DETR. Consequently, the model’s robustness is greatly improved, enabling it to effectively counteract the impact of adverse environments.
To verify the effectiveness of the overall framework of joint image dehazing and object detection, the dehazing model and the object detection model before and after improvement were subjected to full ablation experiments in the multiple haze test set, as shown in
Table 6. The table demonstrates that as the degree of image restoration improves—from no dehazing to dehazing with the AOD-Net model to dehazing with our designed PAOD-Net model—the mAP@0.5 values of the object detection model correspondingly increase. Notably, the improved ST-DETR model exhibits enhancements of 0.107, 0.224, and 0.427 compared to RT-DETR. These results indicate that better image restoration significantly enhances the performance of the object detection model, further underscoring the indispensable roles of the PAOD-Net image dehazing model and the ST-DETR object detection model within our overall dehazing and object detection framework.
Finally, to verify whether the proposed DST-DETR dehazing detection framework is applicable to other foggy detection tasks, we compared it against public datasets. We selected public datasets from both real and simulated perspectives for different scenarios. One dataset is the real foggy dataset RTTS from RESIDE-
[
42], which consists of 4322 real-world hazy images collected from the Internet, primarily covering traffic and driving scenes. The other is the simulated foggy dataset SFID [
3], containing 13,718 insulator images. The performance of various foggy weather detection models on public datasets was quantitatively evaluated as depicted in
Table 7.
From
Table 7, it can be observed that on the RTTS dataset, the foggy weather detection performance of DSNet, IA-YOLO, and BAD-Net is inferior to that of the original RT-DETR model used in this experiment. Our proposed DST-DETR foggy weather detection framework, based on RT-DETR, improved the Precision, Recall, mAP@0.5, and mAP@0.5:0.95 metrics by 3.1%, 7.1%, 6.8%, and 3.6%, respectively. Additionally, on the SFID dataset, our DST-DETR improved the mAP@0.5:0.95 metric by 4.1% compared to RT-DETR, with the remaining metrics showing no significant change due to their proximity to 1. Compared to the original paper’s FINet, our model also achieved advantages in Recall and mAP@0.5, while Precision and mAP@0.5:0.95 showed no significant disadvantages. Based on the above quantitative analysis, it is evident that our proposed DST-DETR foggy weather detection model not only excels in detecting safety helmets in foggy conditions but also possesses strong generalizability, demonstrating commendable performance on public datasets and is easily adaptable to other foggy weather detection tasks.
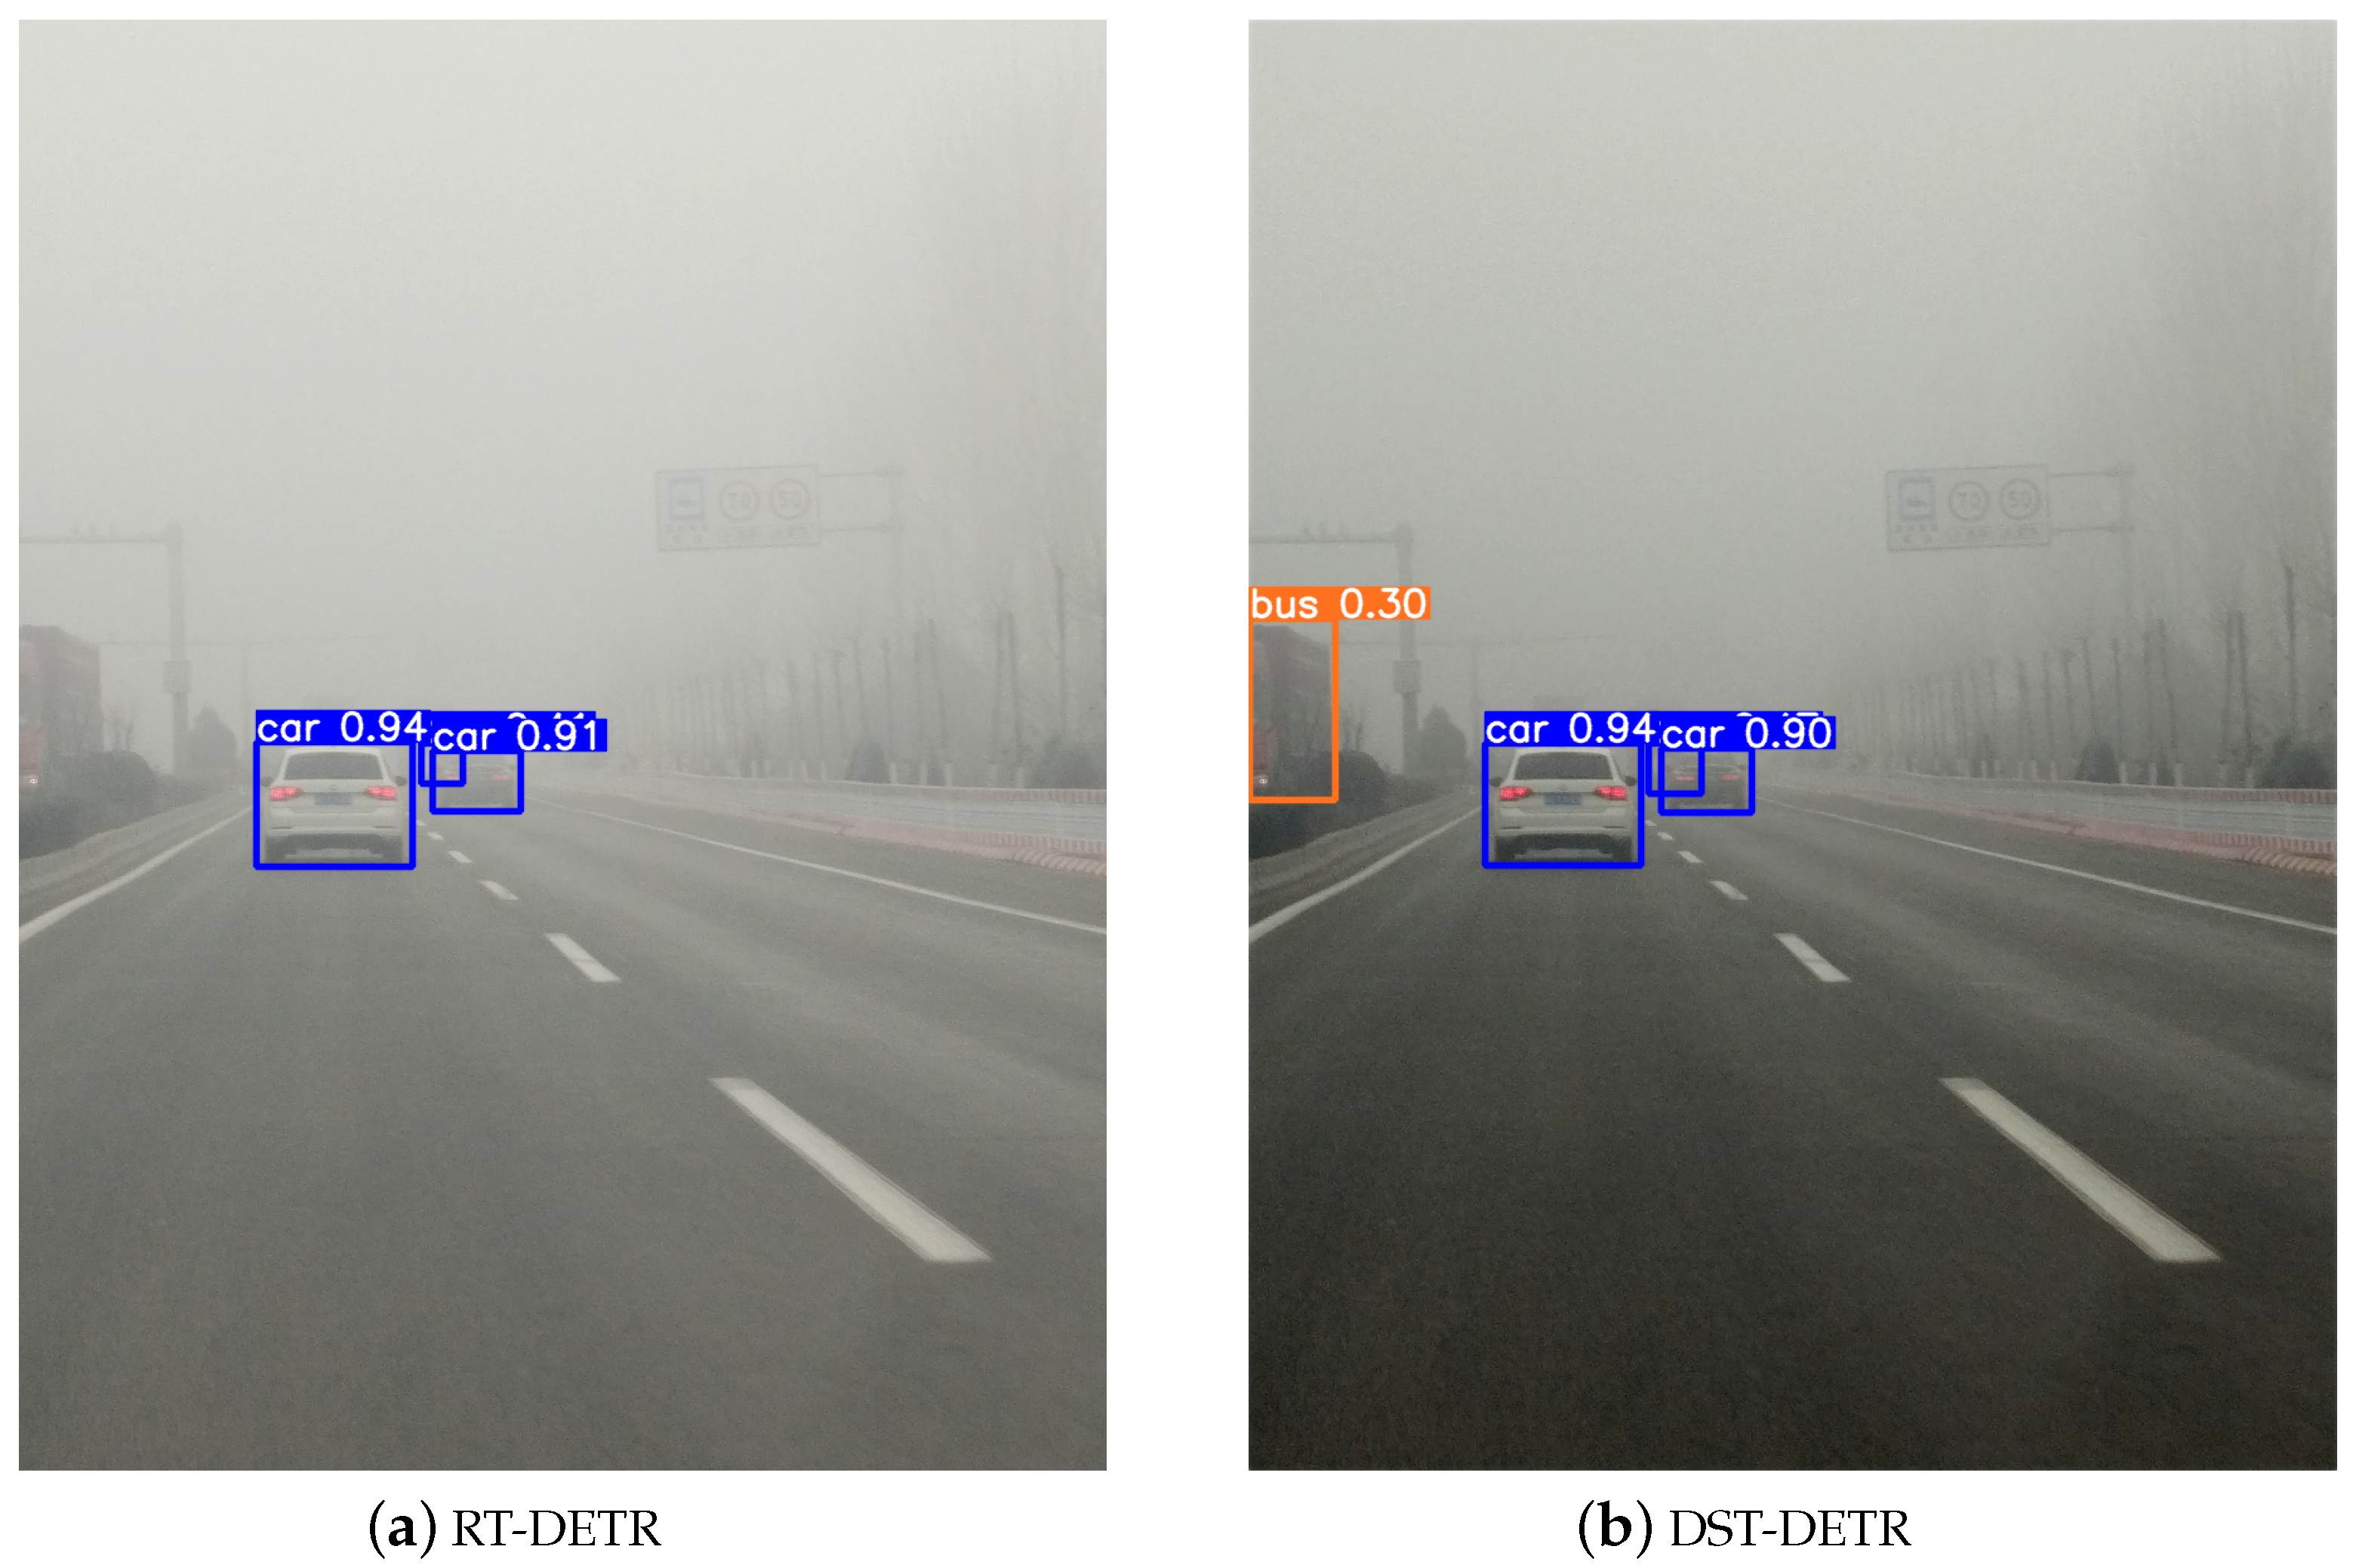
Subsequently, through experiments, the degree of image restoration and the detector’s detection performance were analyzed from a visual perception perspective. The visualization results of the proposed model compared to the original model are shown in
Figure 10 and
Figure 11 for qualitative comparison.
The comparison between
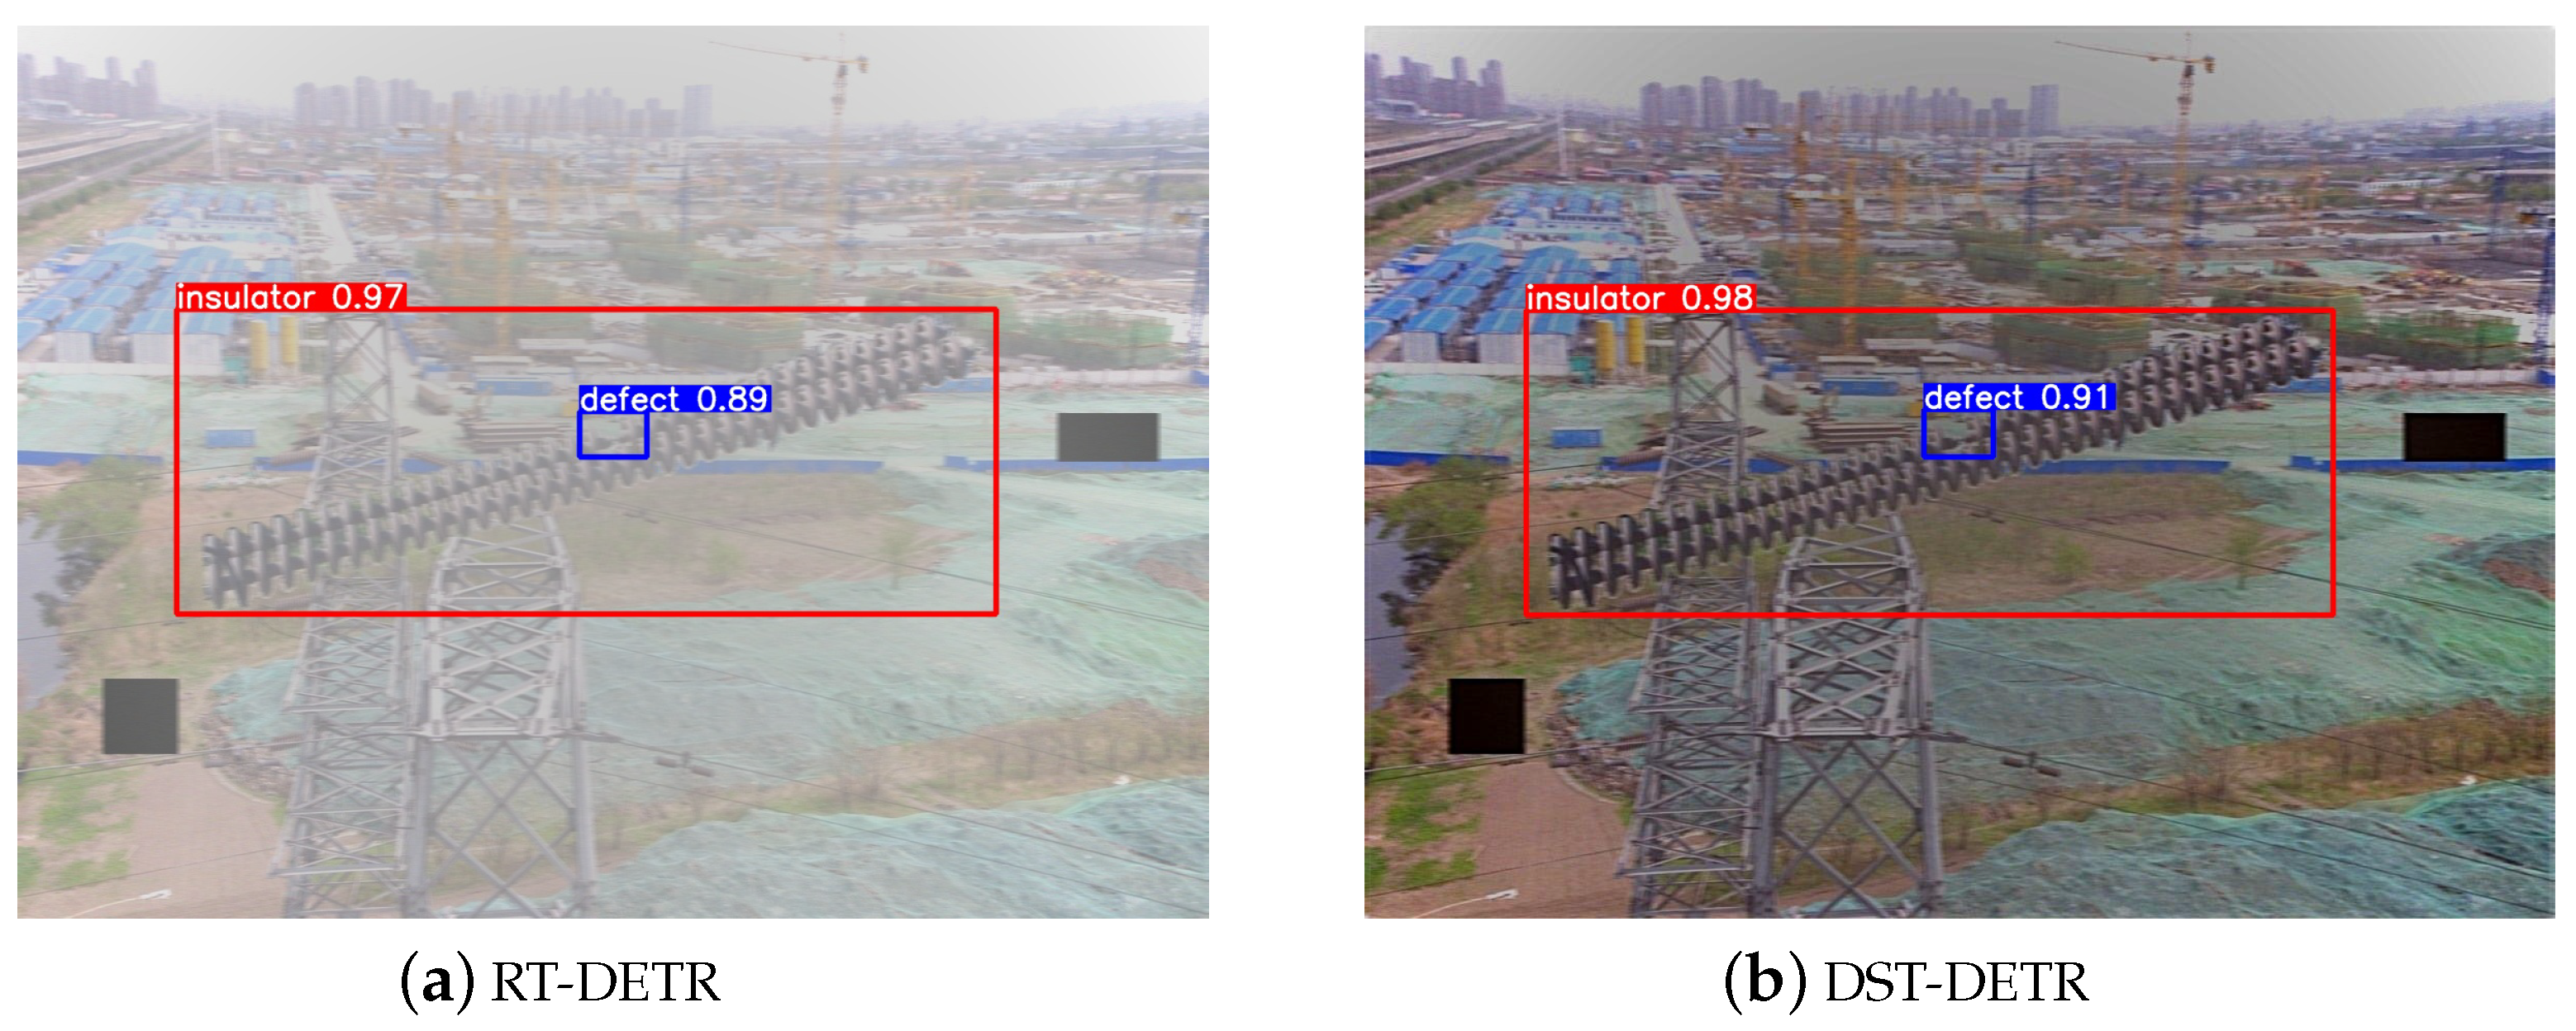
Figure 10a,b shows that our designed DST-DETR framework better identifies buses, avoiding missed detections and achieving a degree of image restoration. It not only defogs but also enhances image clarity, as seen in the deblurred traffic sign in the upper right corner of the image. The comparison between
Figure 11a,b demonstrates that our DST-DETR framework exhibits superior detection performance for both categories. These comparative advantages are attributed to our enhancements in the image restoration capability of the dehazing model and the improvements made to the detector.
Notably, although the DST-DETR framework achieved excellent detection performance on both real and simulated foggy datasets, the comparison between
Figure 10b and
Figure 11b reveals that its image restoration effect is superior on the simulated dataset. This is evident in the richer color features and details. The reason for this is that the simulated dataset includes a dedicated dehazing dataset, which contains a synthetic fog training set for each clean image used in dehazing experiments. In conclusion, the DST-DETR framework can achieve excellent dehazing detection results on both real and simulated foggy datasets, making it meaningful to further deploy and implement it in real-world scenarios.


