
Advancing Cycling Safety: On-Bike Alert System Utilizing Multi-Layer Radar Point Cloud Clustering for Coarse Object Classification

 ,
,
Abstract
1. Introduction
- An mmWave radar-based system operating at 77 GHz connected to a micro-controller, communicating with the cyclist’s mobile device via Bluetooth and providing preliminary classification results of nearby obstacles.
- A RadBike dataset: an annotated dataset of radar point cloud data synchronized with an RGB camera sensor designed for micromobility applications.
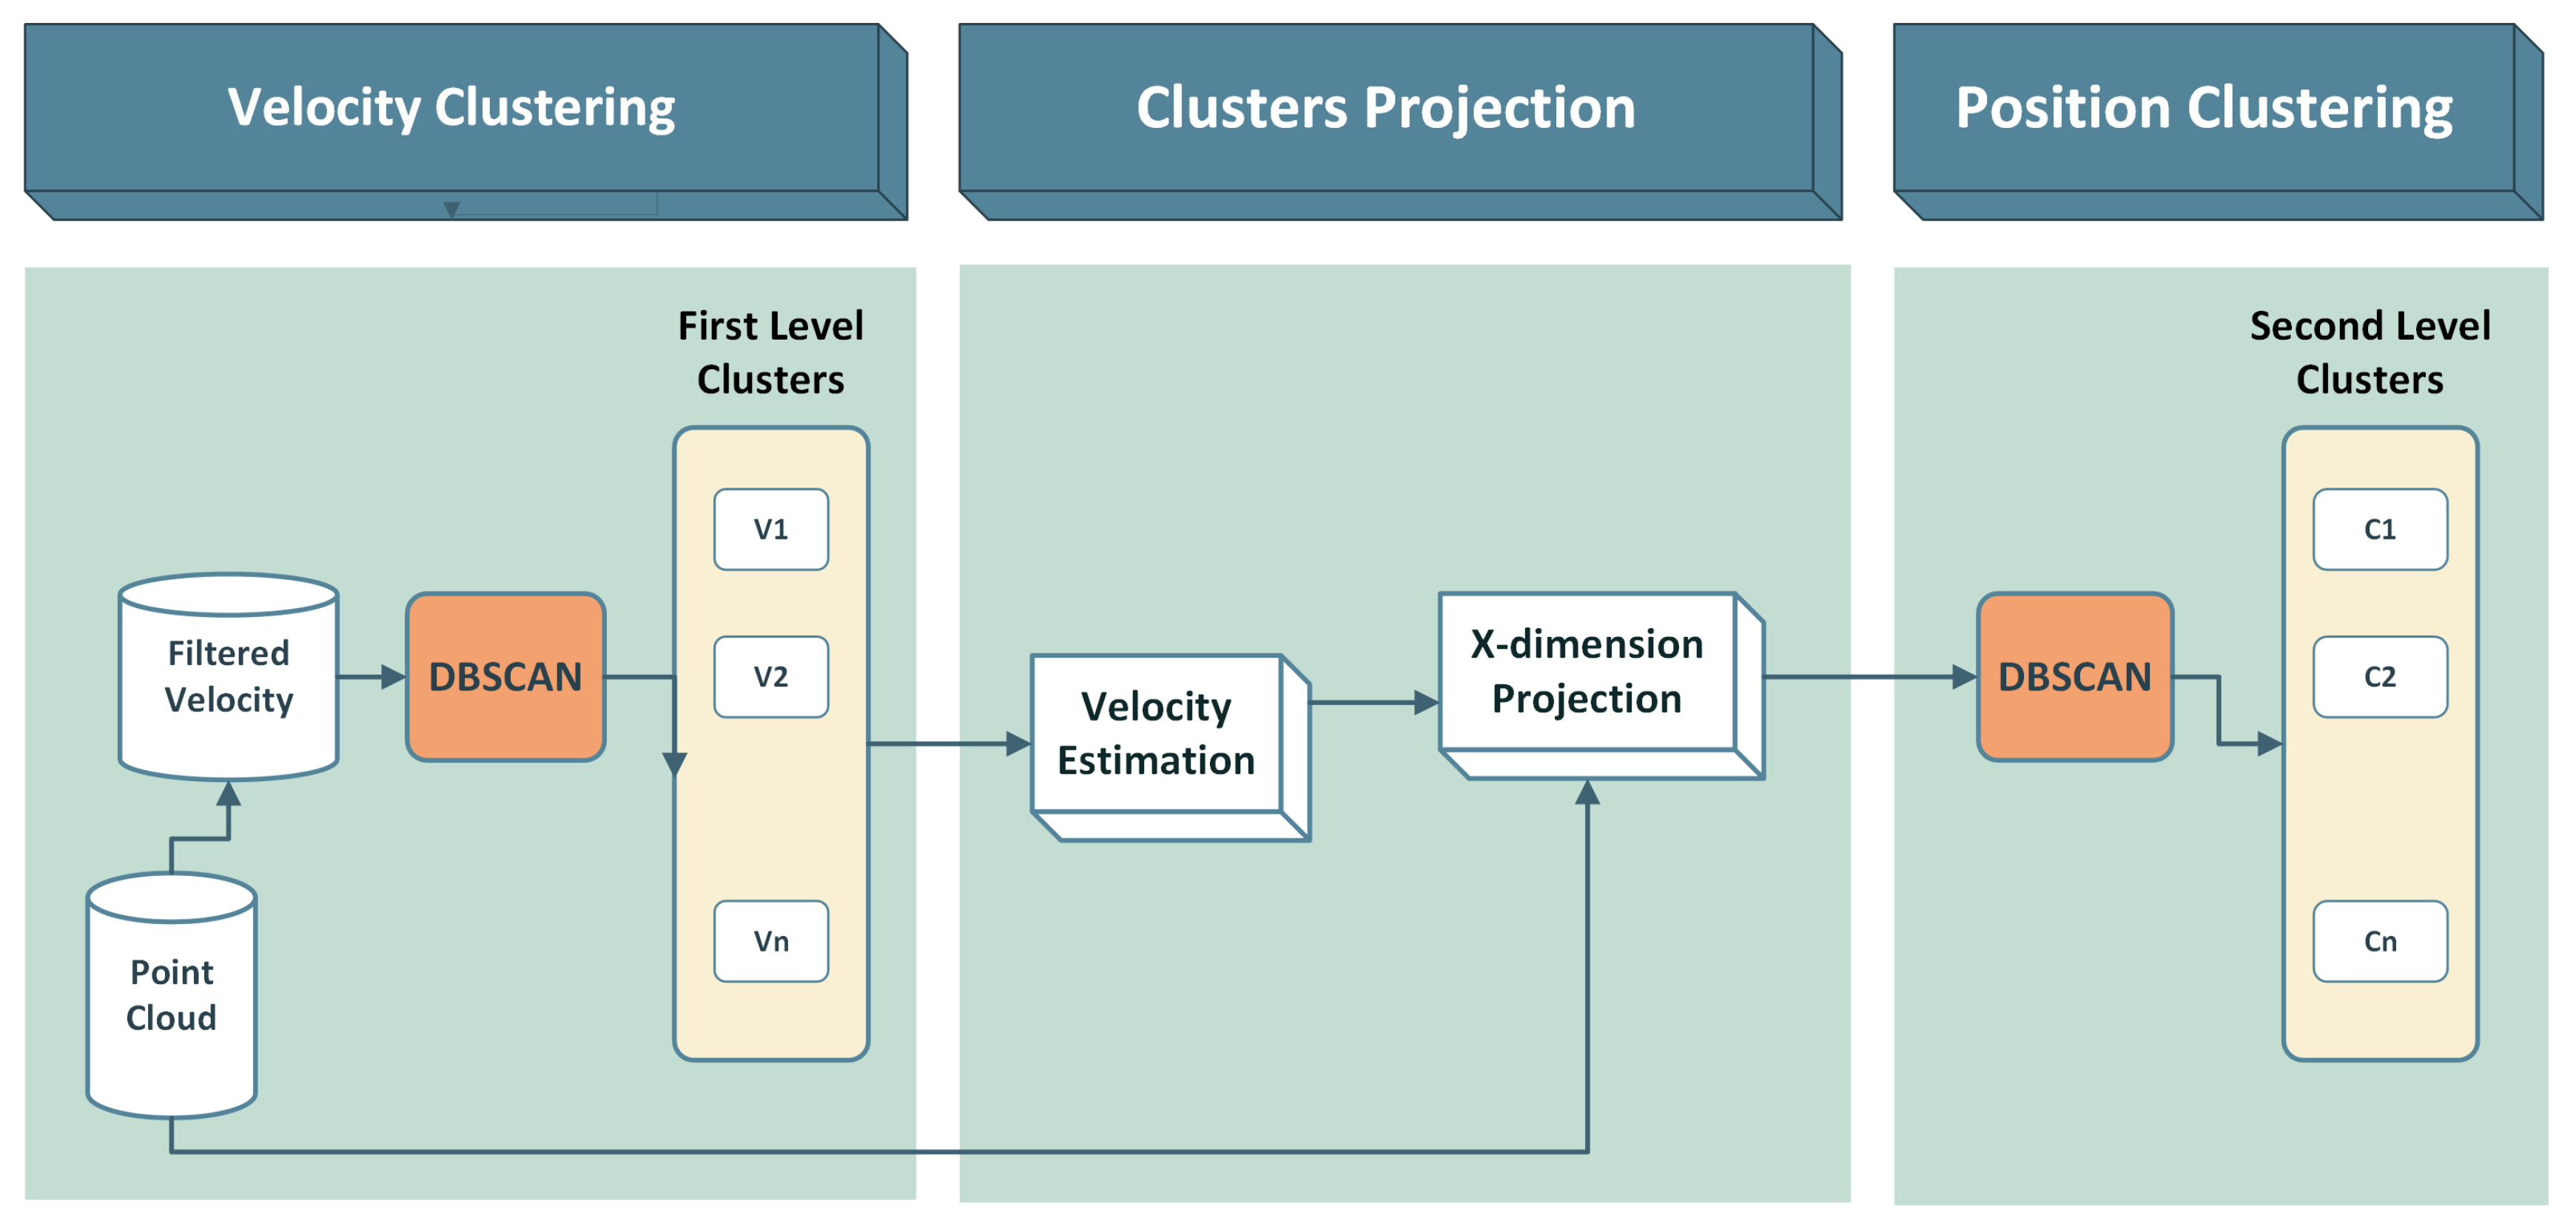
- An effective two-level clustering approach consisting of first-level velocity and a second-level position clustering based on temporal projections of initial clusters for a fixed number of frames.
- A coarse classification approach based on the temporal and spatial features of the resulting clusters with high accuracy in classifying nearby objects proposed for the main classes: four-wheeled, two-wheeled, and others.
2. Related Work
2.1. Deep Learning Based Classification
2.2. Machine Learning-Based Classification
2.3. Hybrid Classification
3. Proposed System
- Radar detection filtering: initially, the radar detection data are filtered based on velocity. This step ensures that only relevant moving objects are considered for further analysis.
- Two-level clustering algorithm: this is applied to the filtered radar data. The resulting clusters contain groups of objects with similar characteristics.
- Feature extraction: Relevant features are extracted from the clustered data. These features serve as input for the subsequent coarse classification algorithm.
- Coarse classification into three main classes: Our coarse classification algorithm segments the clusters into three primary classes:
- Four-wheeled class: Comprising trucks and cars. These large, high-speed objects pose significant risks to cyclists due to their dimensions.
- Two-wheeled class: Consisting of motorcycles and bicycles. These modes of transport share the road with cyclists and exhibit similar mobility patterns. While still relevant, they pose comparatively lower risks.
- Others class: Encompassing pedestrians and any remaining objects not falling into the above categories. This includes people walking into the back of the bicycle, which does not pose a major risk to the cyclist.
4. Datasets
4.1. Evaluation Dataset: VoD
4.2. Proposed RadBike Dataset
4.2.1. Dataset Description
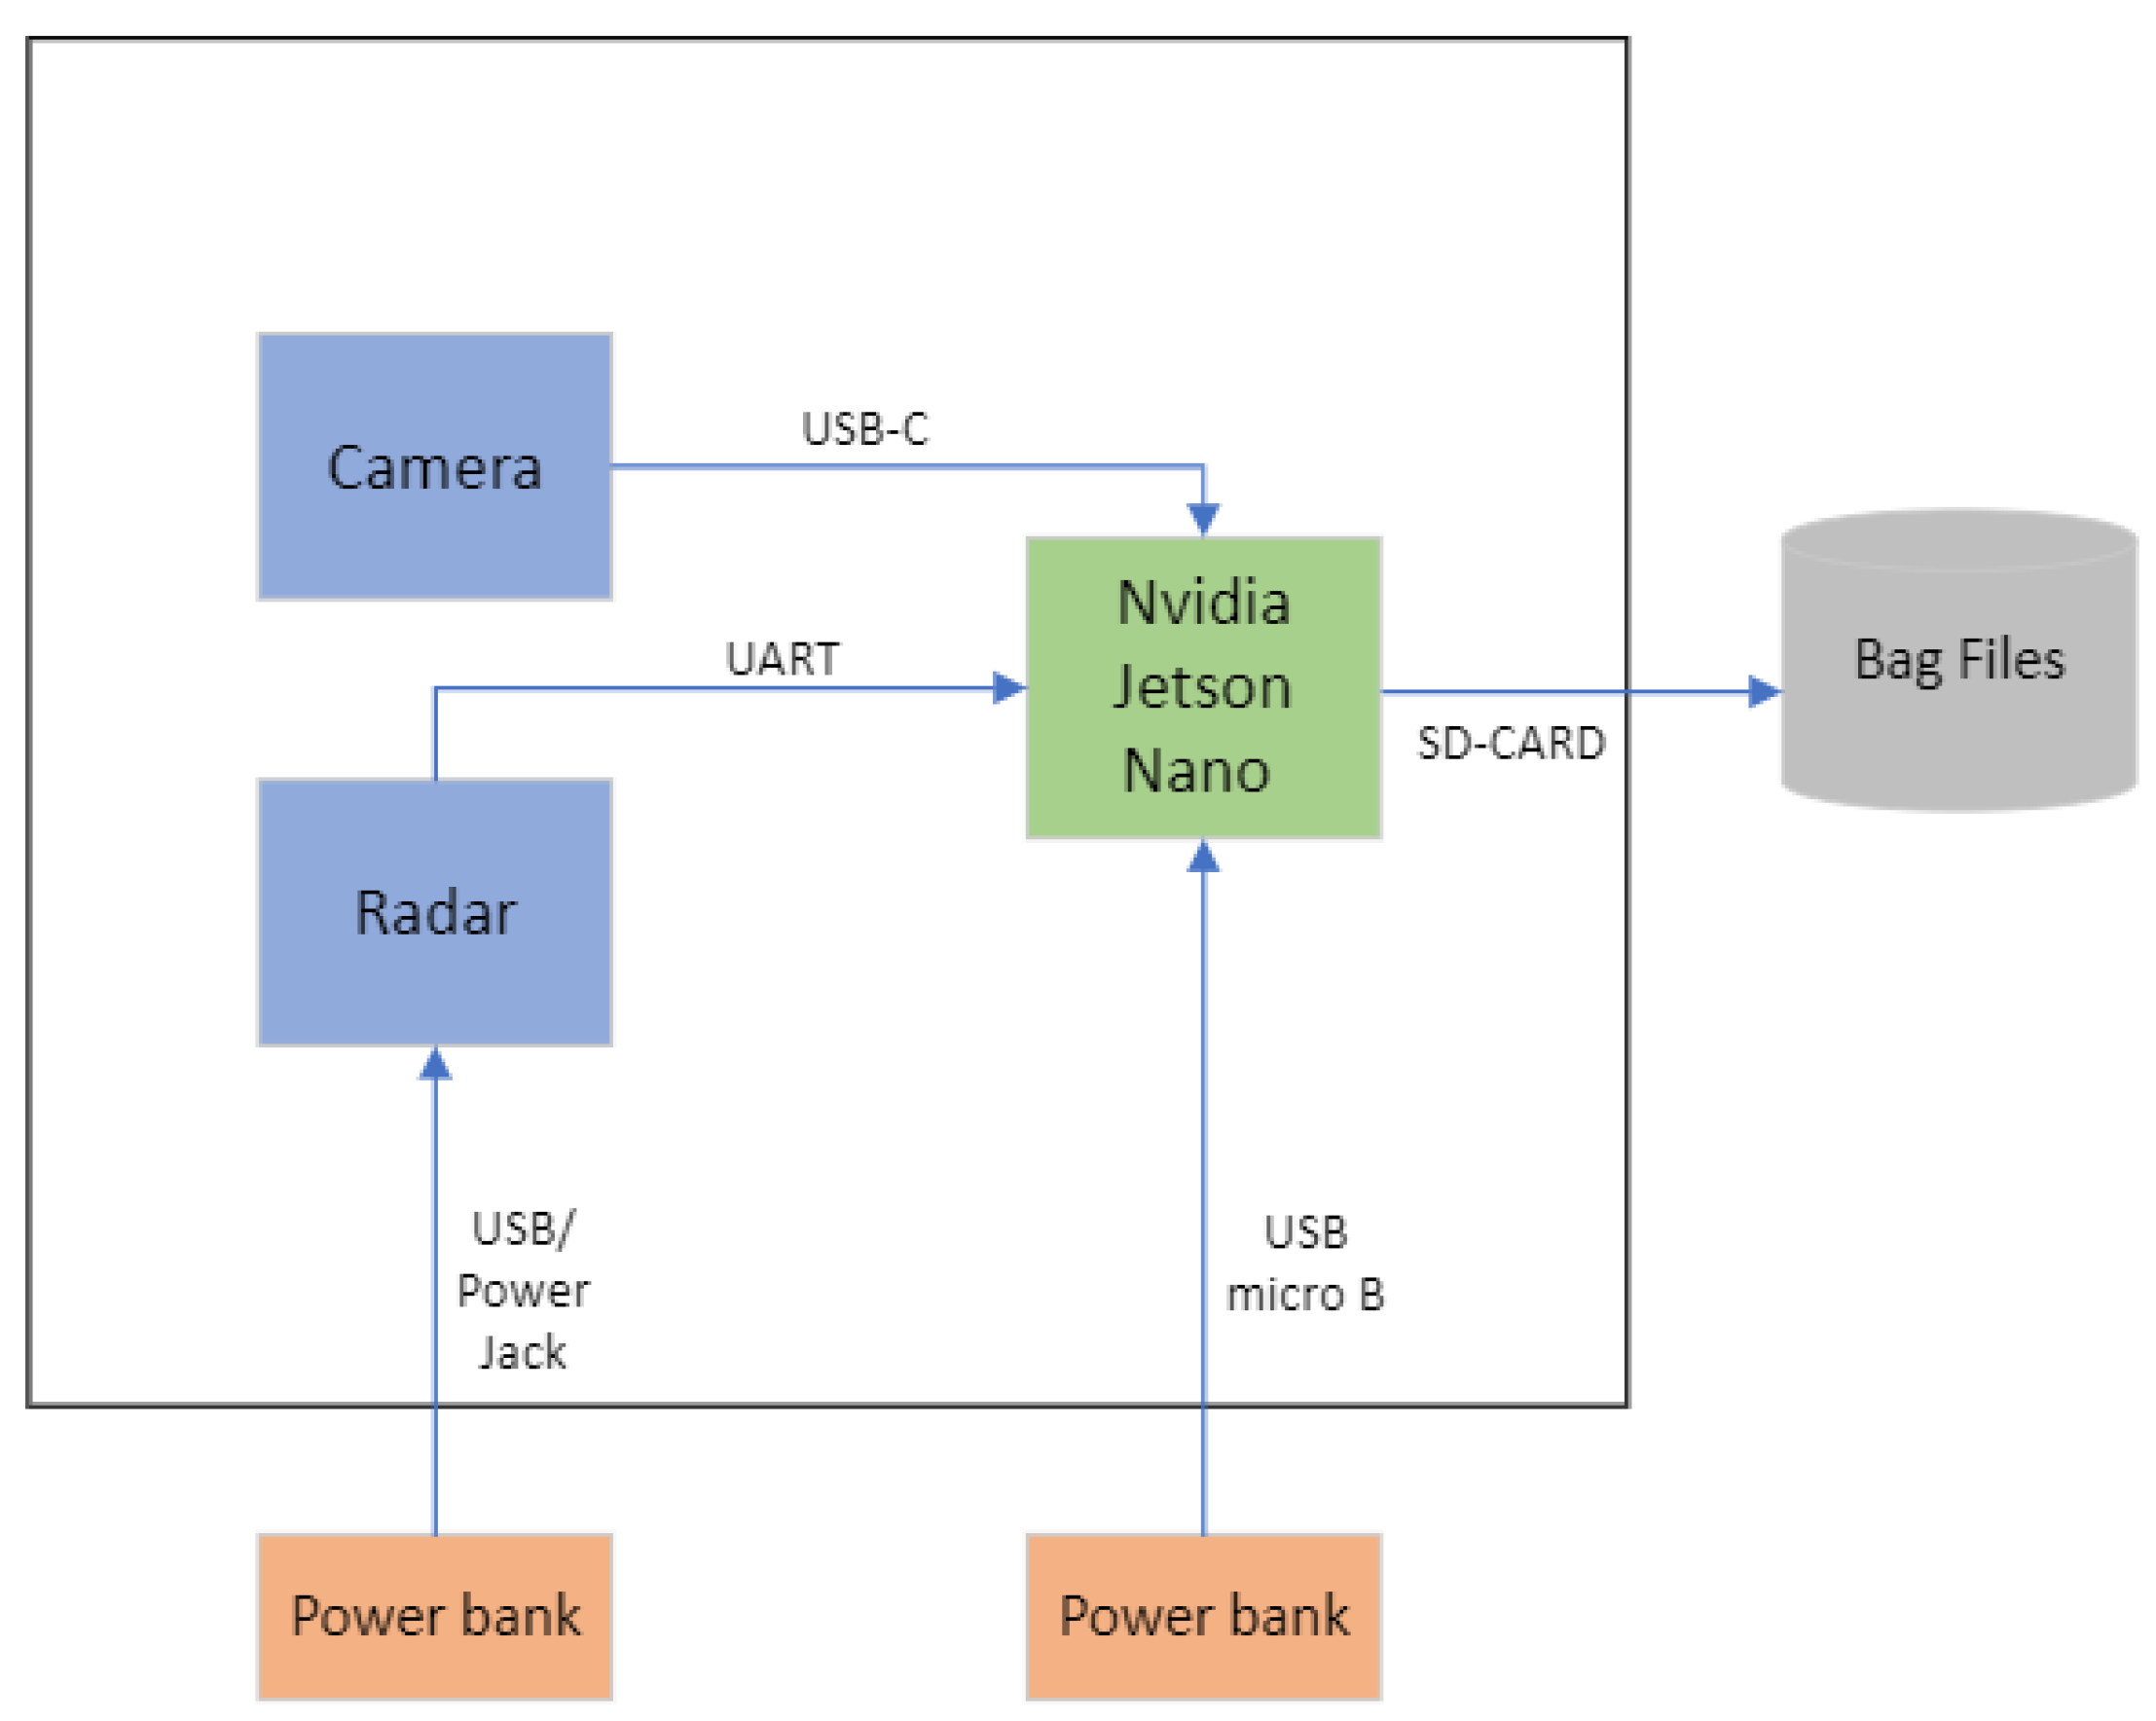
4.2.2. Data Acquisition System
4.2.3. Offline Software Synchronization
4.2.4. Cluster Level Annotation
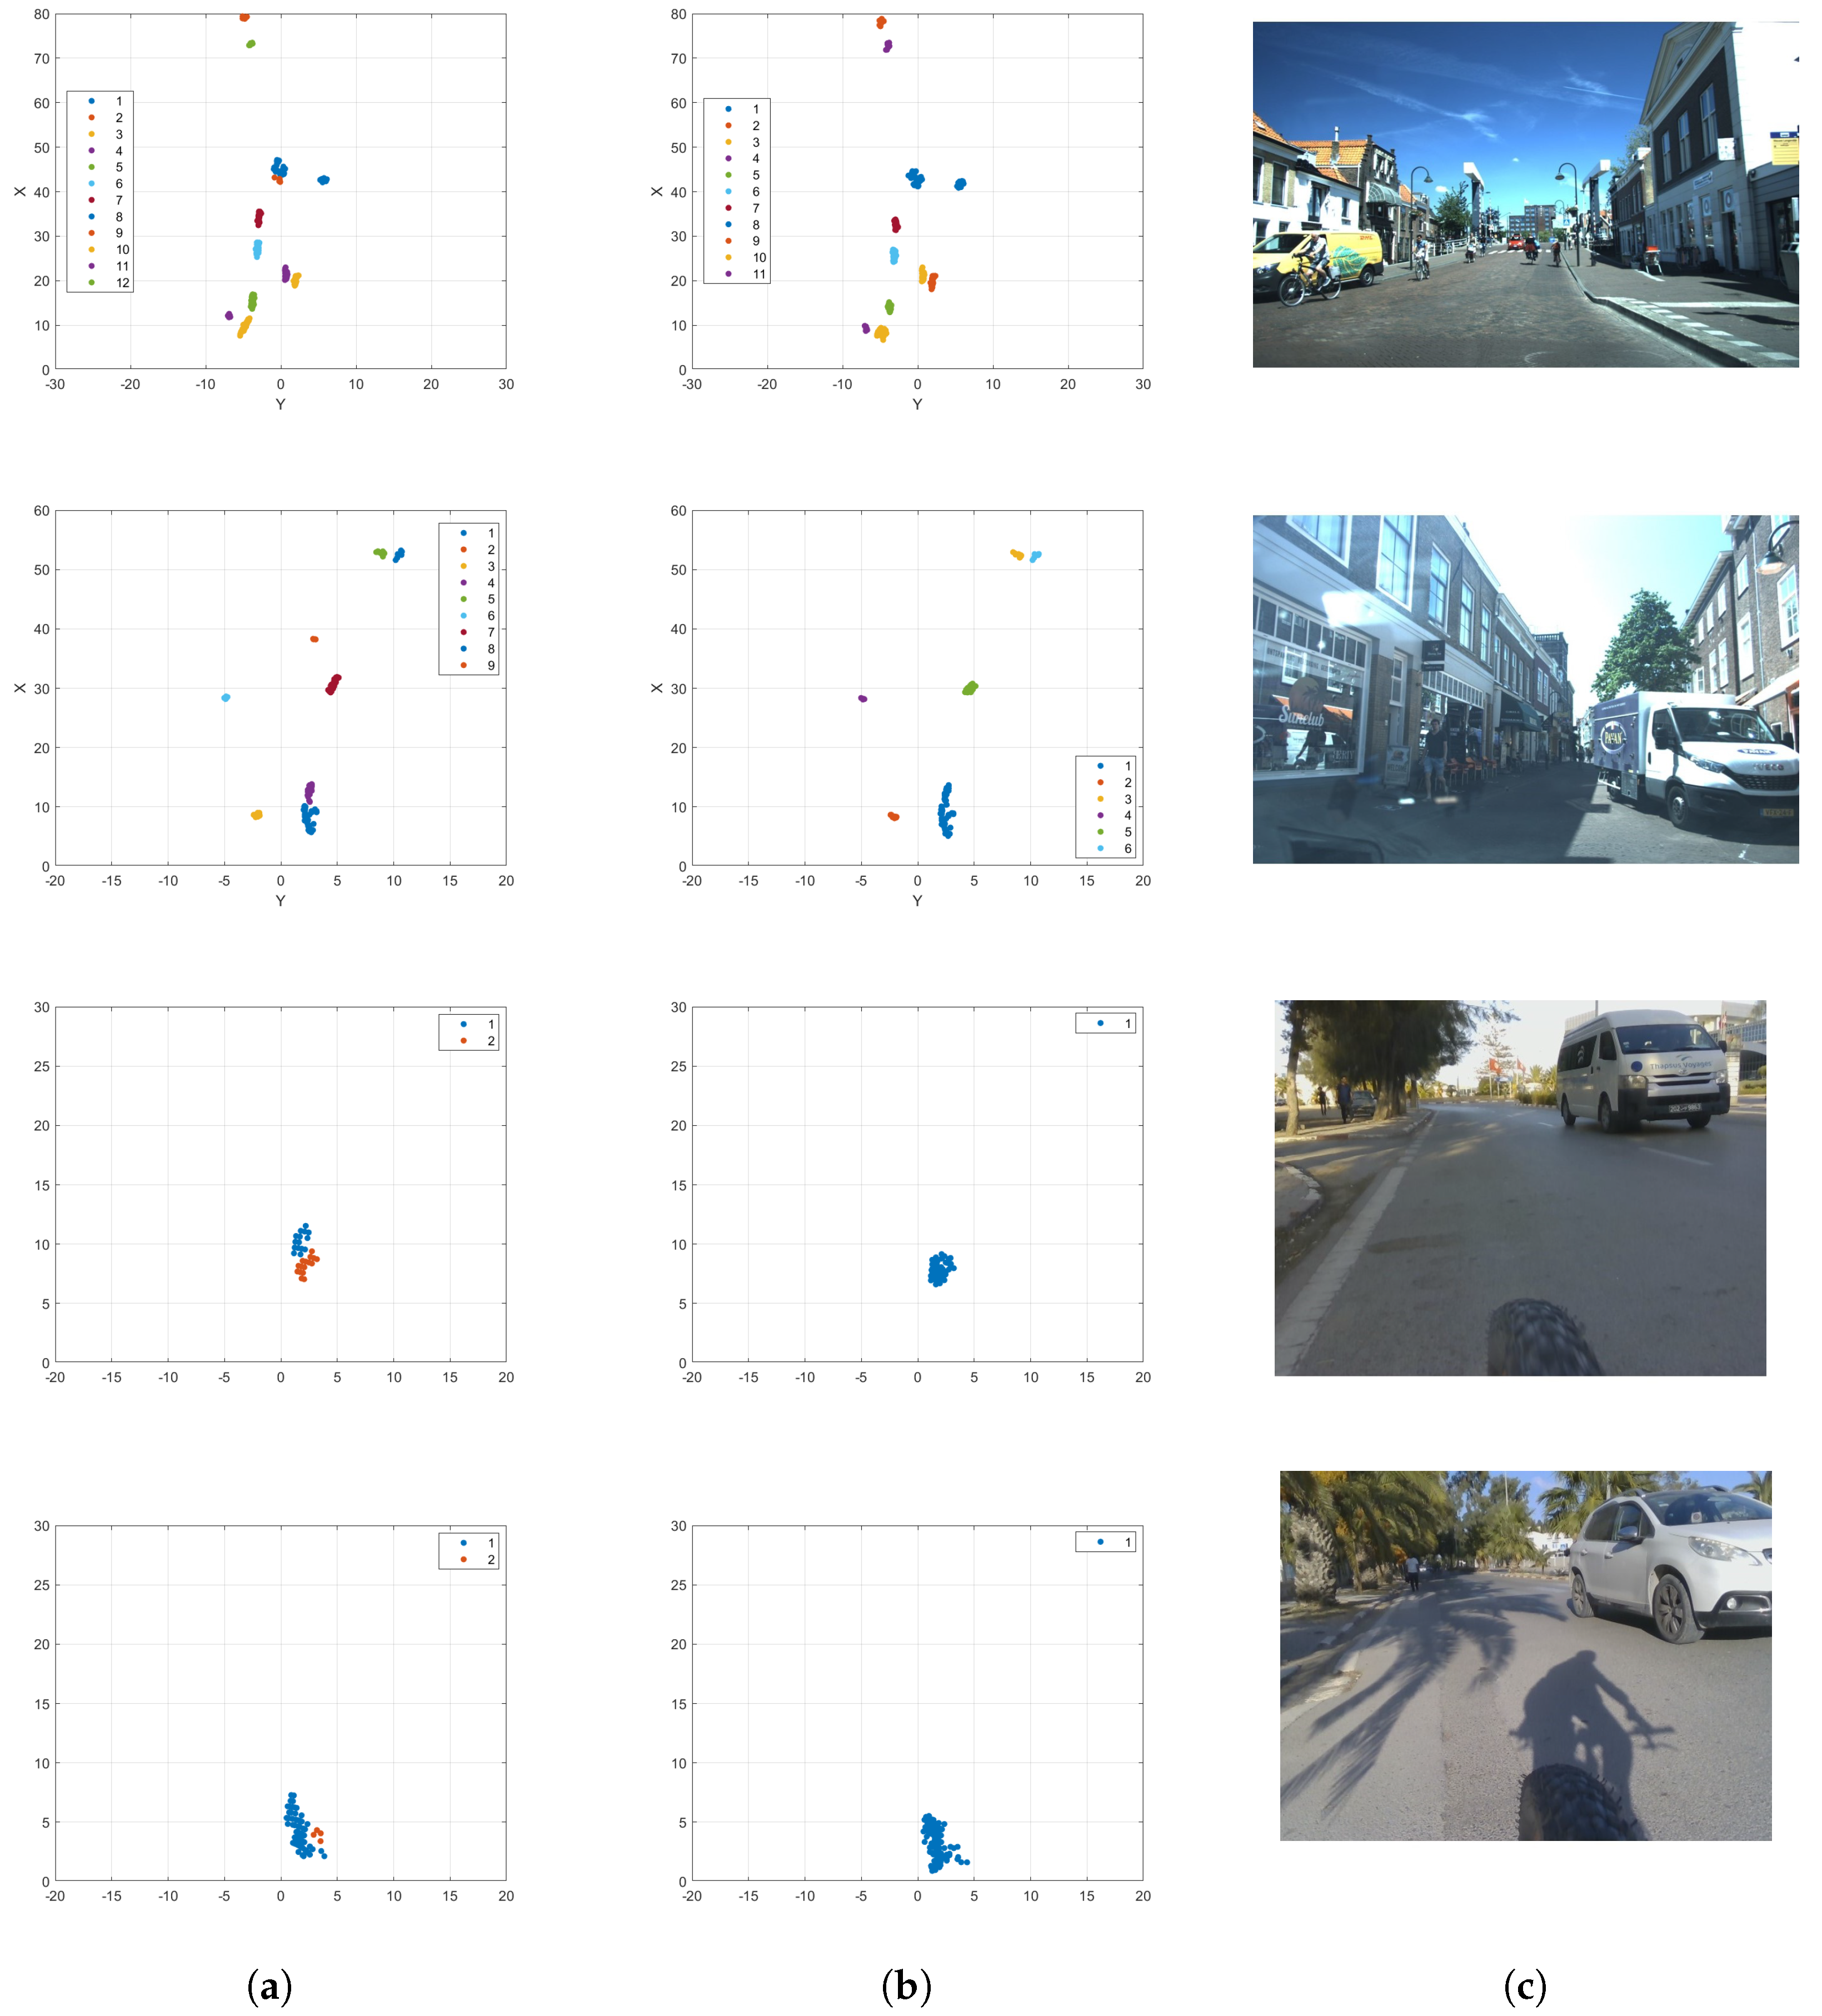
5. The Two-Level Clustering
5.1. Methodology
5.1.1. First Level: Velocity-Based Clustering
5.1.2. Second Level: Position-Based Clustering
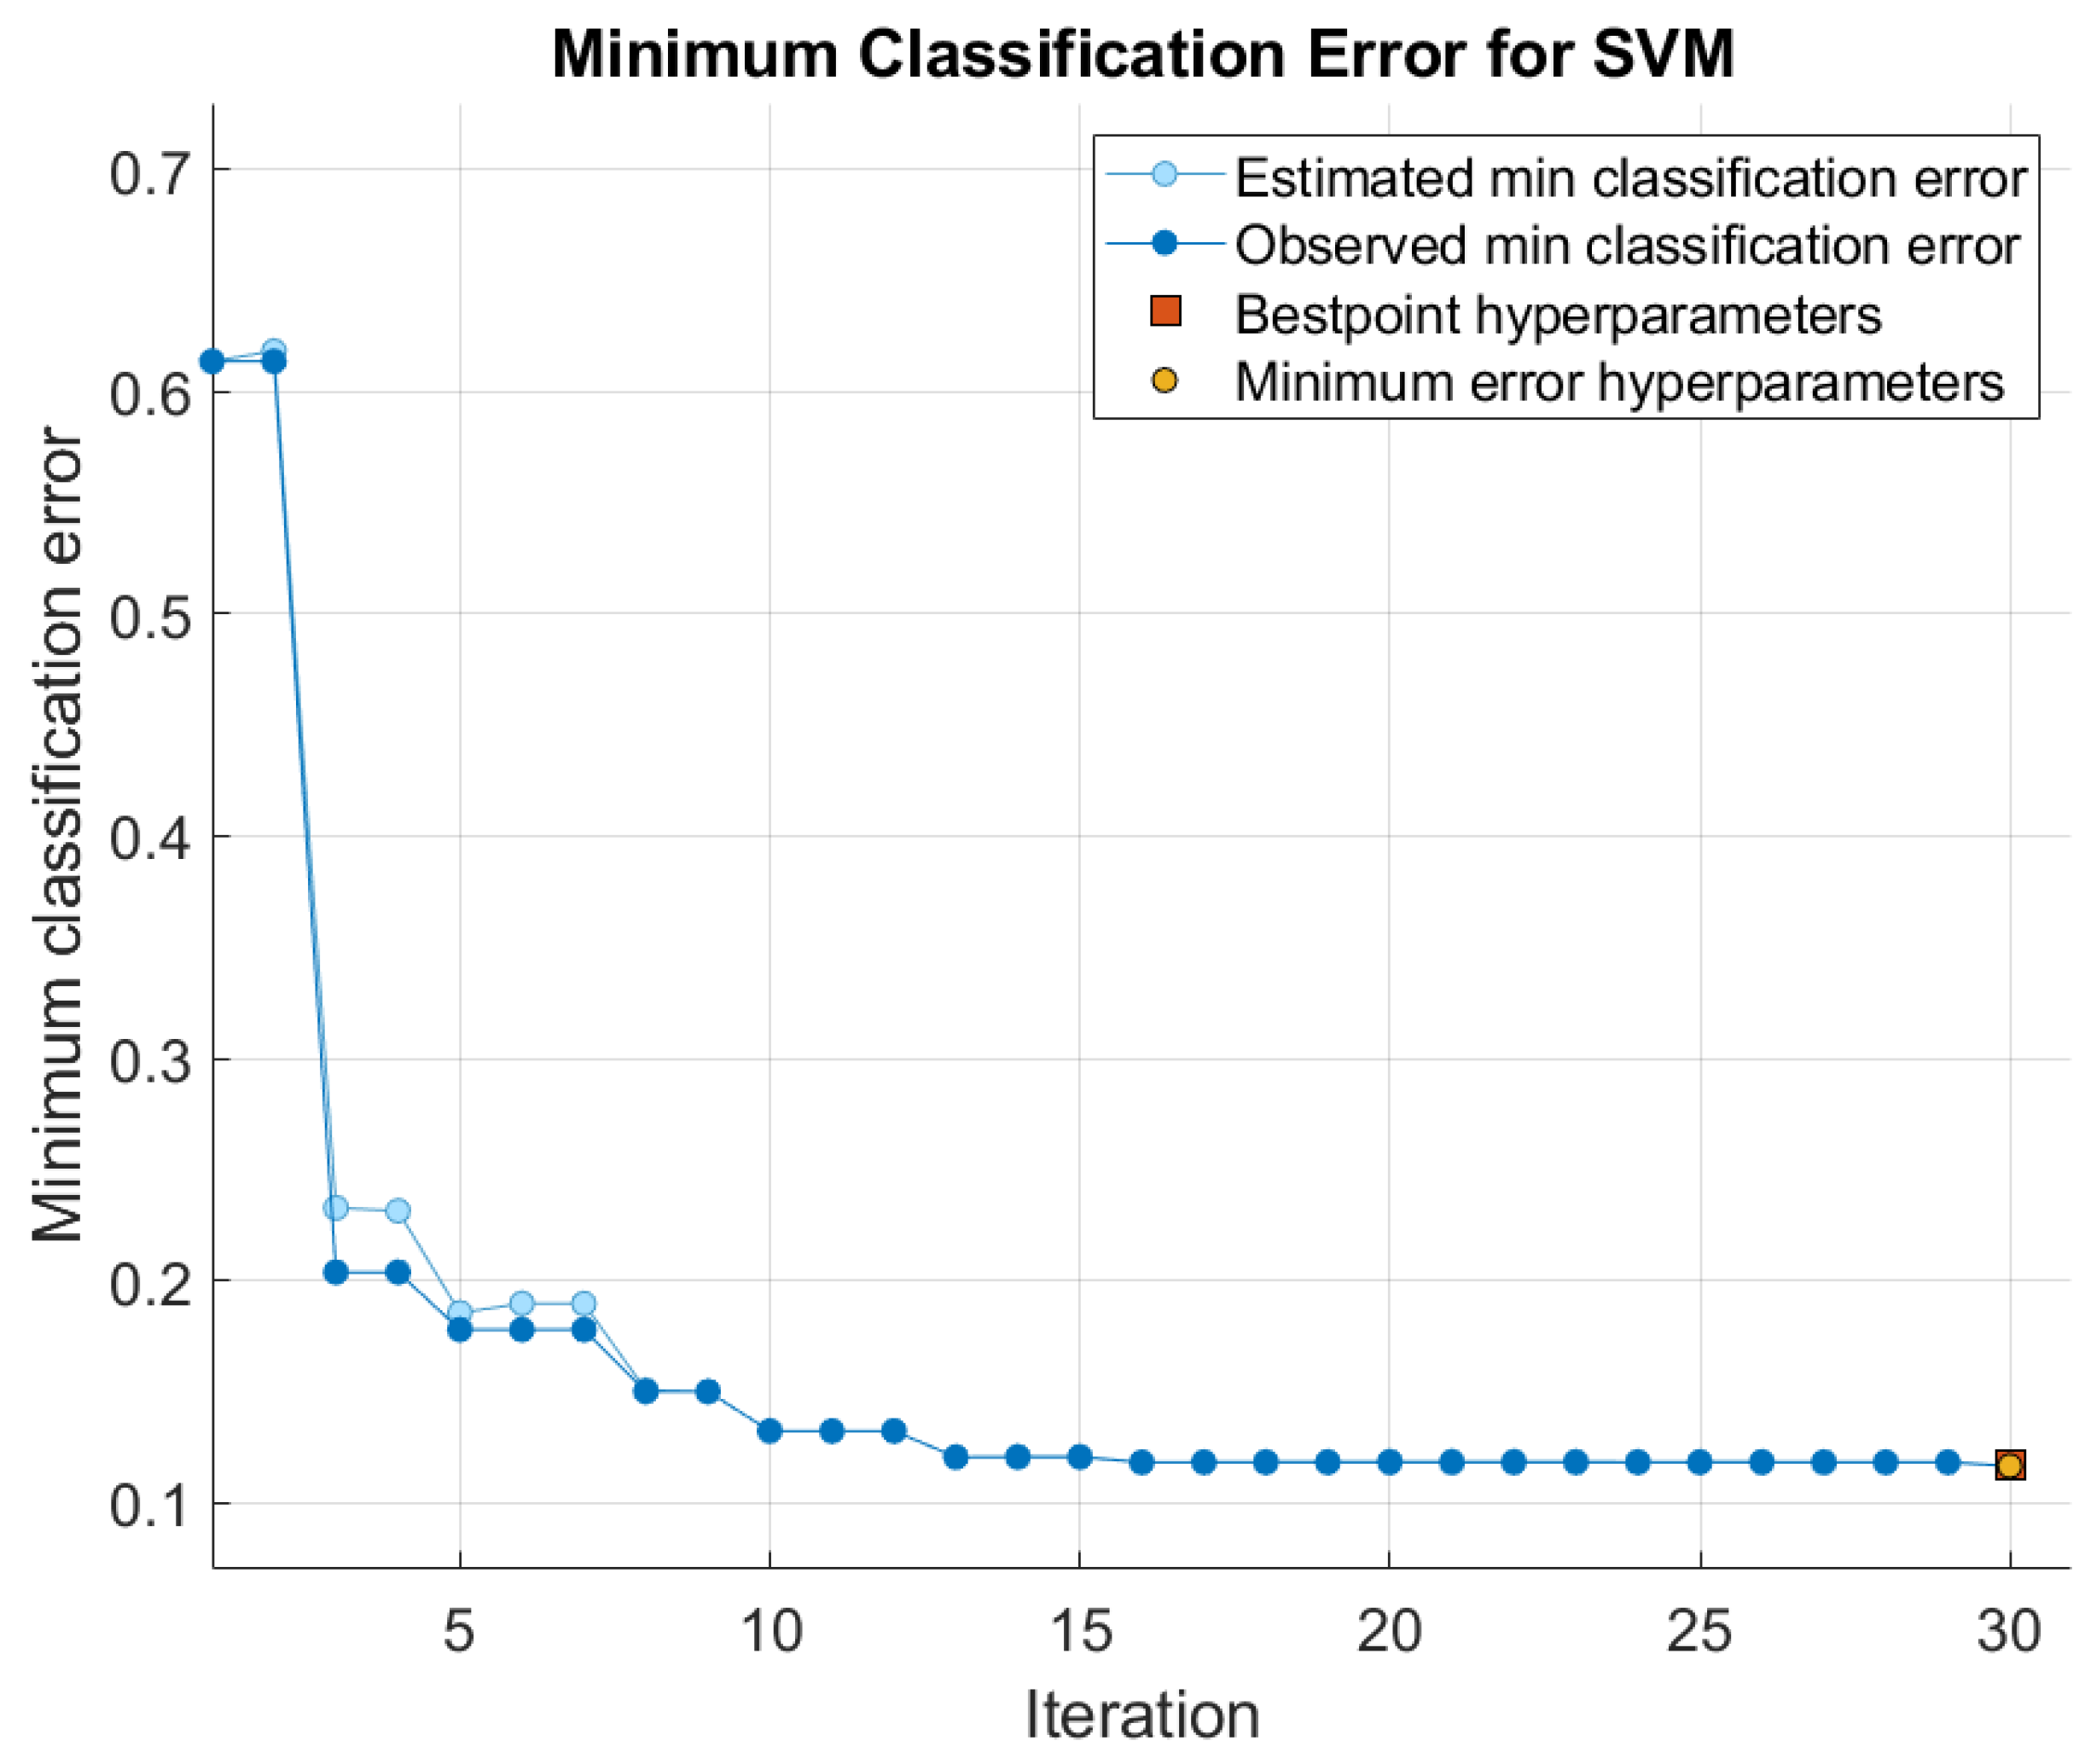
5.2. HyperParameter Tuning
5.3. Performance Evaluation
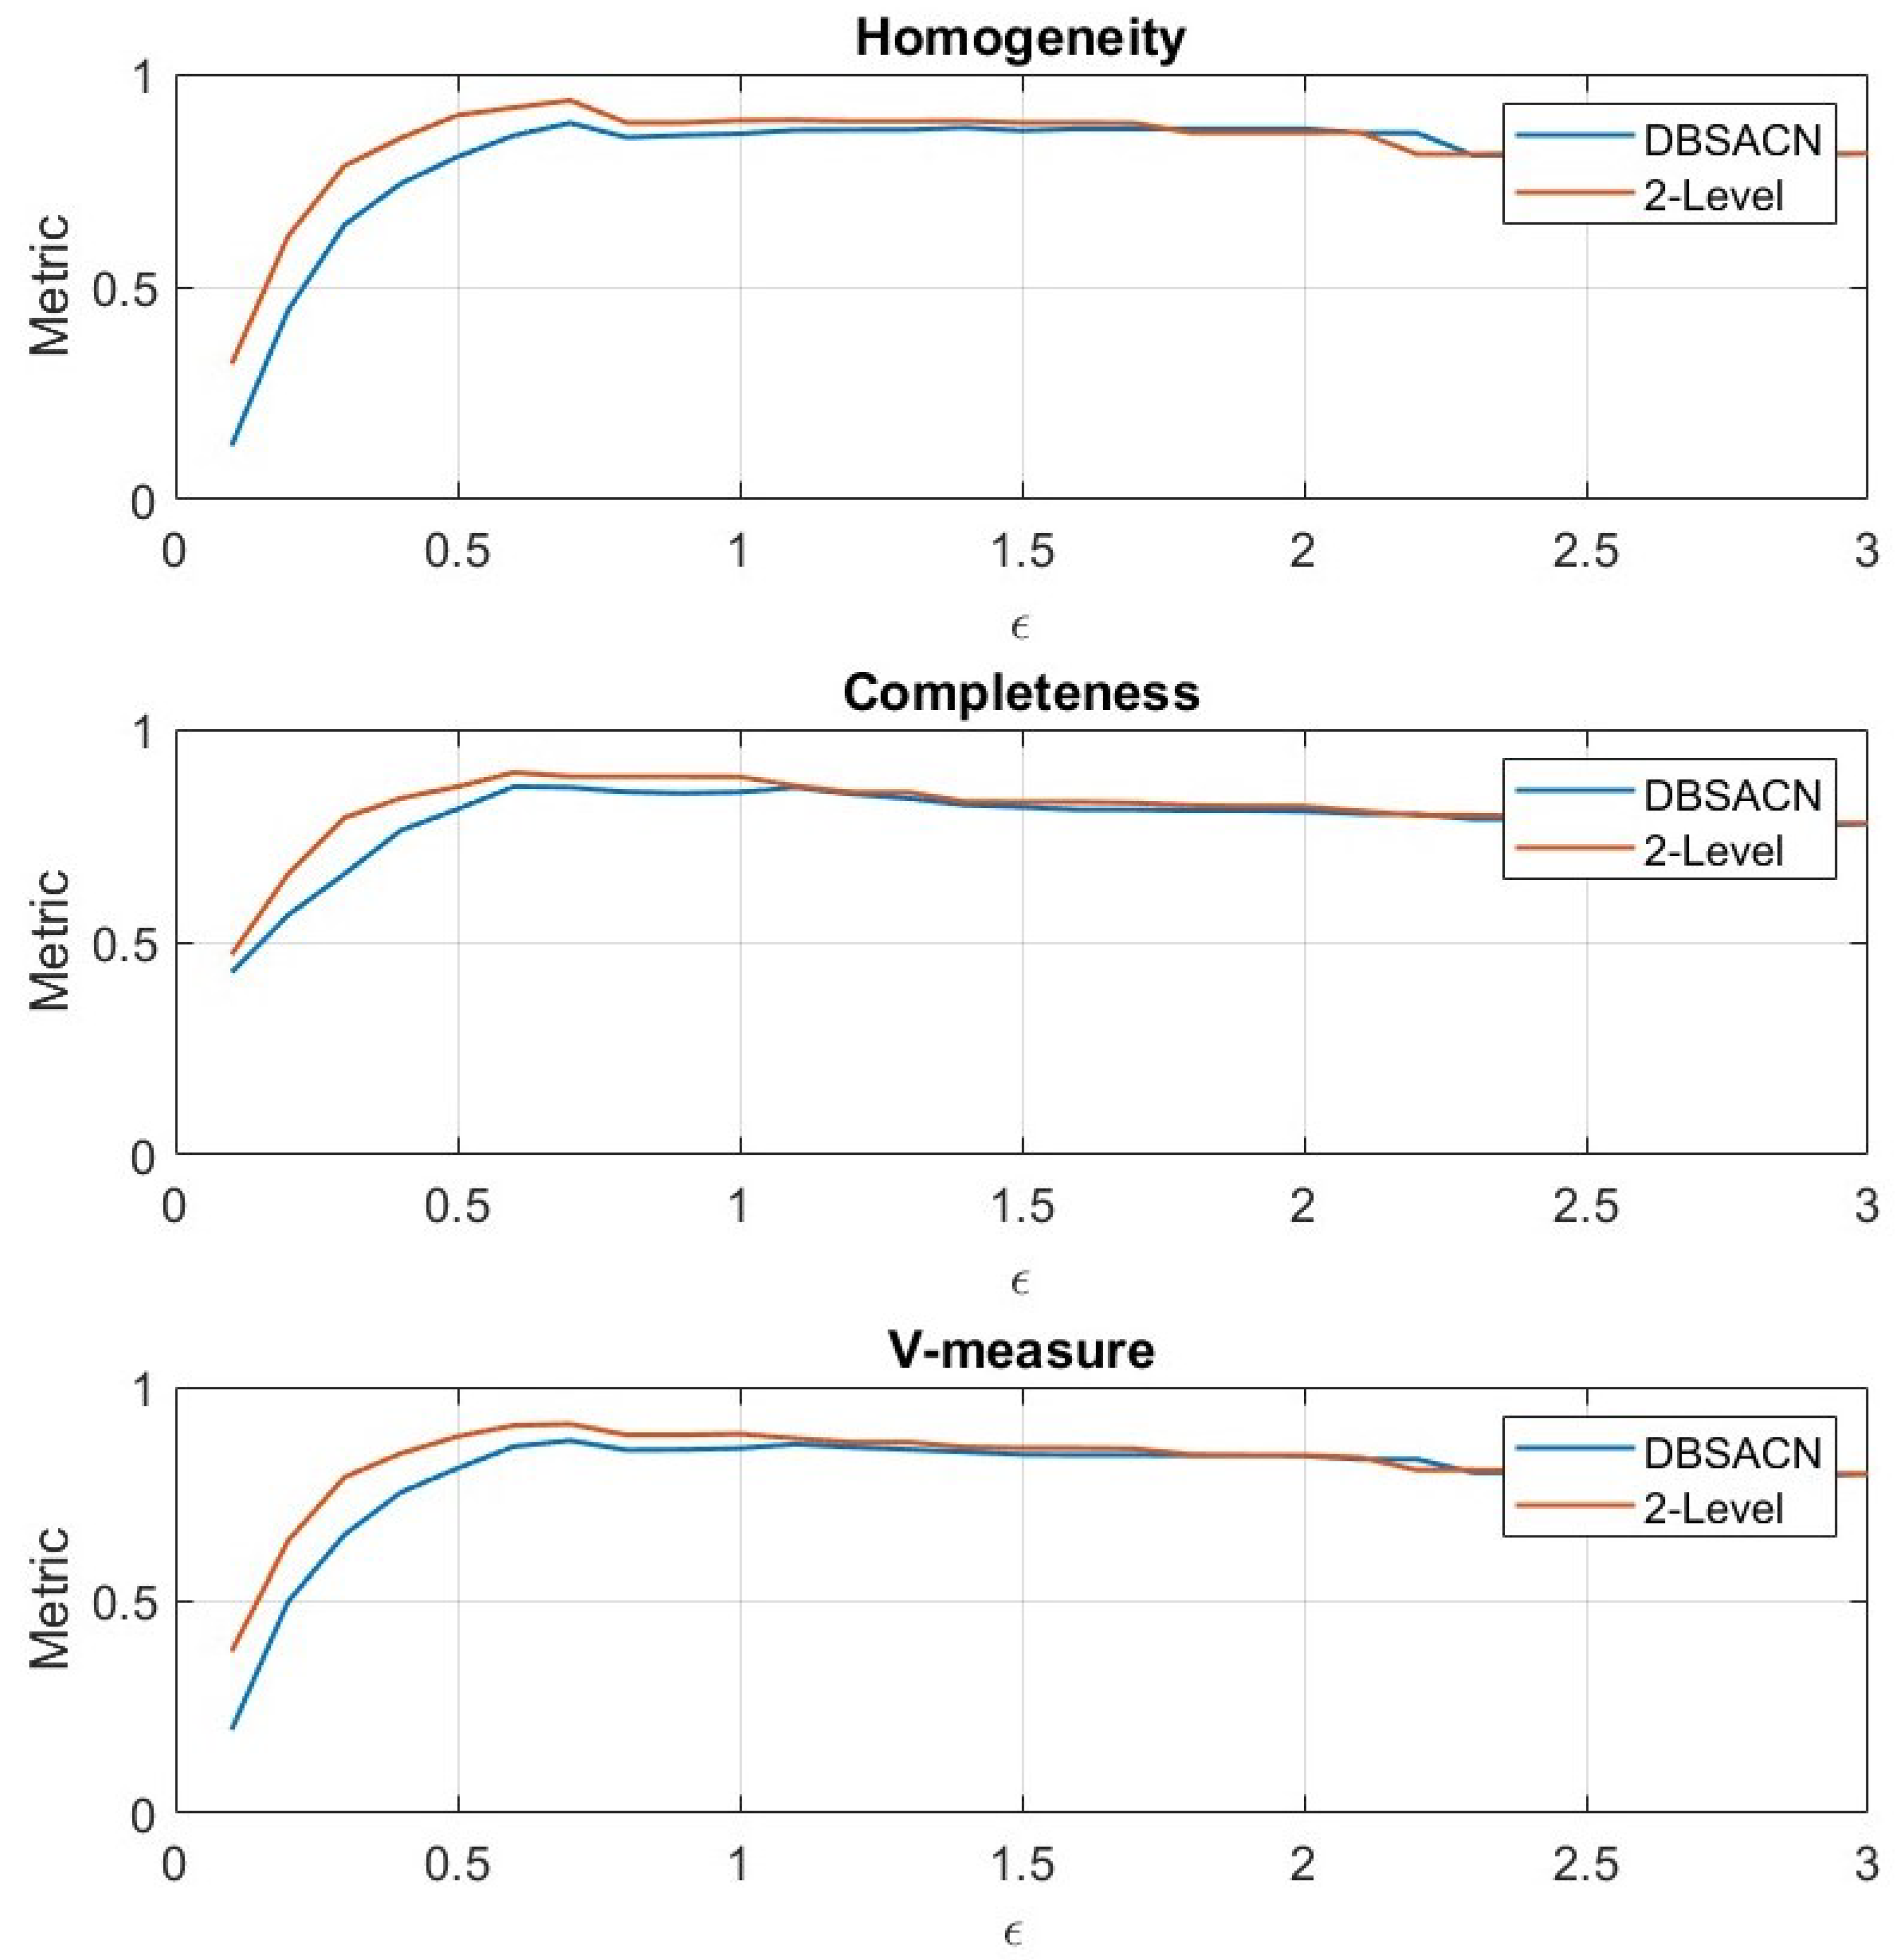
5.3.1. Performance Comparison
- Two-level clustering tends to have slightly higher mean values across most metrics compared to DBSCAN.
- DBSCAN shows a wider range of performance, with both lower min and higher max values.
- Homogeneity (H) and completeness (C): The two-level clustering approach shows slightly higher values for both H and C compared to DBSCAN, indicating that clusters in this approach are more pure and contain all members of a given class. This suggests a better separation of clusters based on class membership.
- The V-measure (V): the V-measure, which combines homogeneity and completeness, is also higher for the two-level clustering approach, indicating a better balance between precision and recall in clustering.
- Adjusted Rand index (ARI): The two-Level clustering approach has a higher AR value, suggesting a higher level of similarity between clusters compared to DBSCAN. This indicates that the clusters formed in the two-level approach are more consistent across different runs or variations.
- Davies–Bouldin Index (DB): the DB index is lower for the two-level clustering approach, indicating better clustering quality in terms of intra-cluster similarity and inter-cluster differences.
- Silhouette (S): the silhouette score is higher for the two-level clustering approach, indicating that the clusters are more well defined and appropriately separated compared to for DBSCAN.
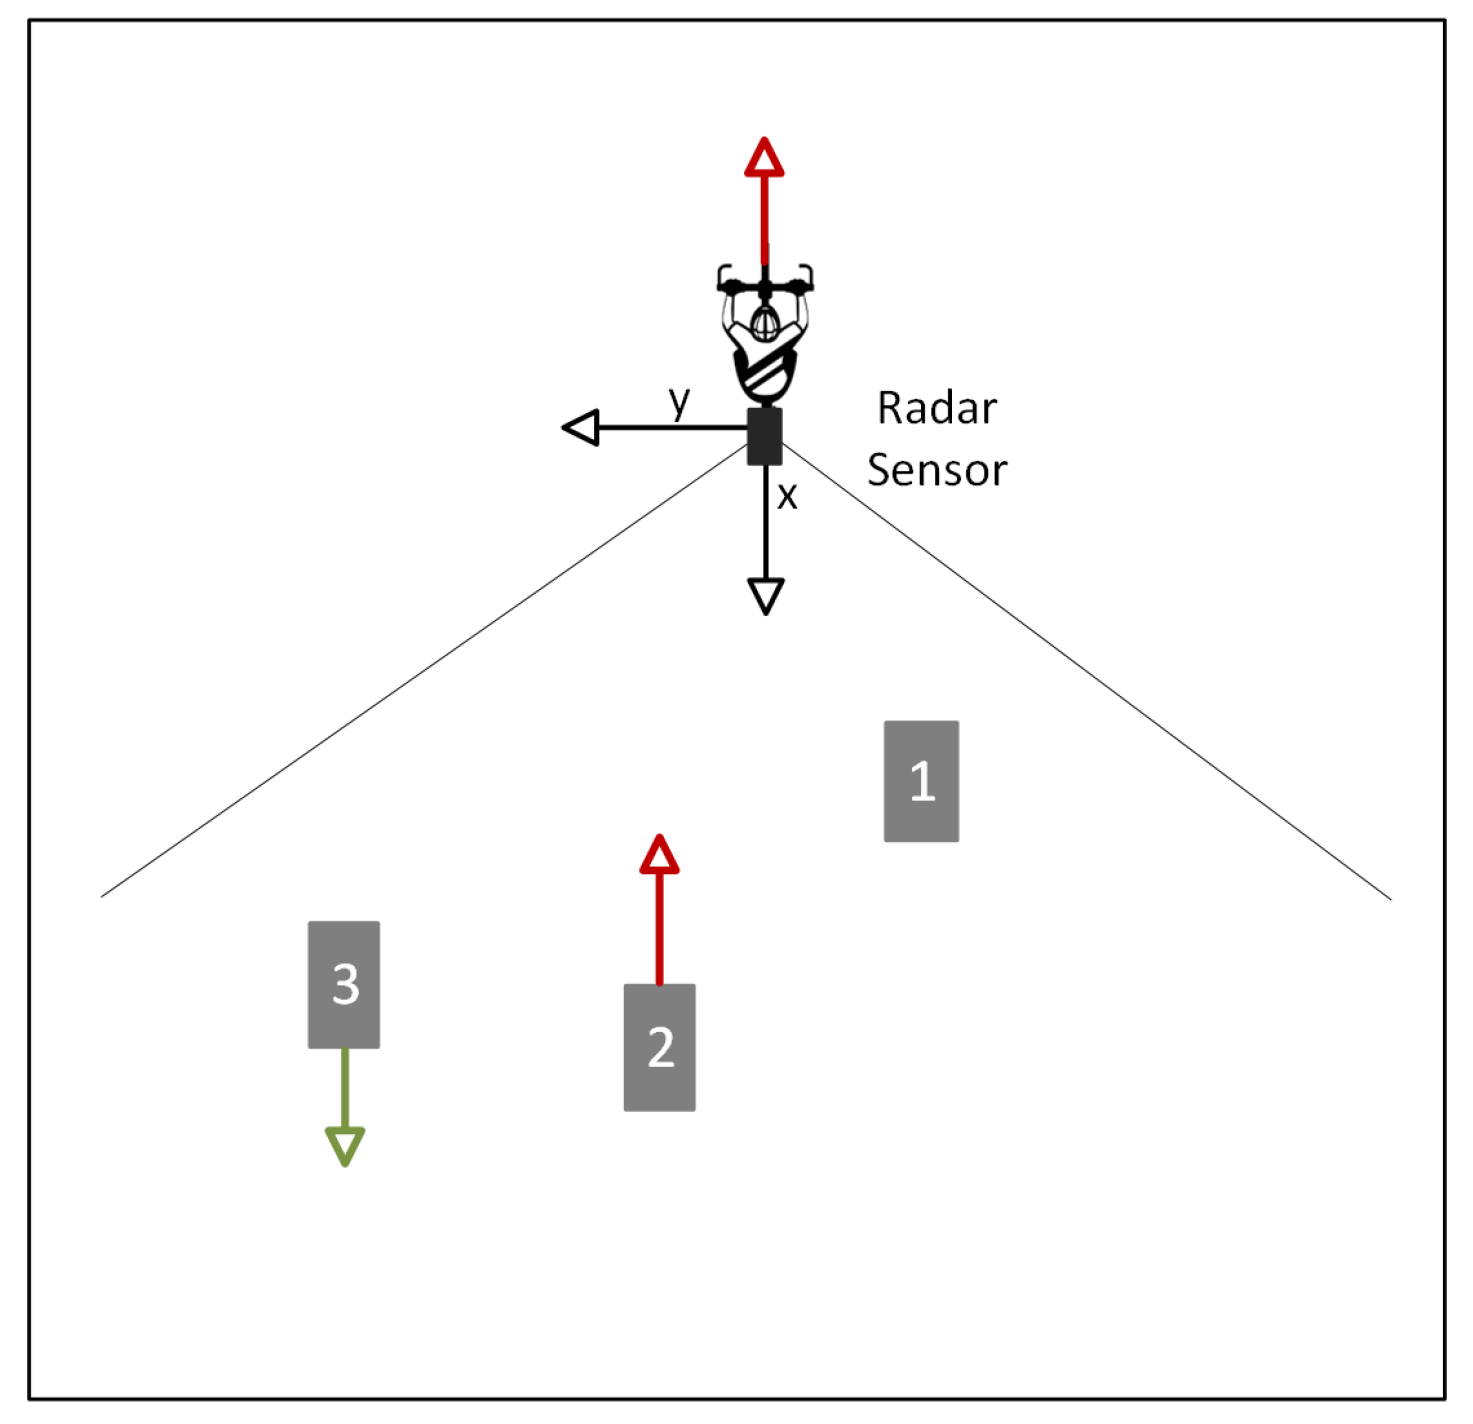
5.3.2. Impact of Clusters’ Projection on the X-Dimension
6. Classification Results and Analysis
6.1. Feature Extraction
- The mean velocity, denoted as , is the average velocity, , of the cluster, and it is calculated as the average velocity of all points in the same cluster, given by the following equation:
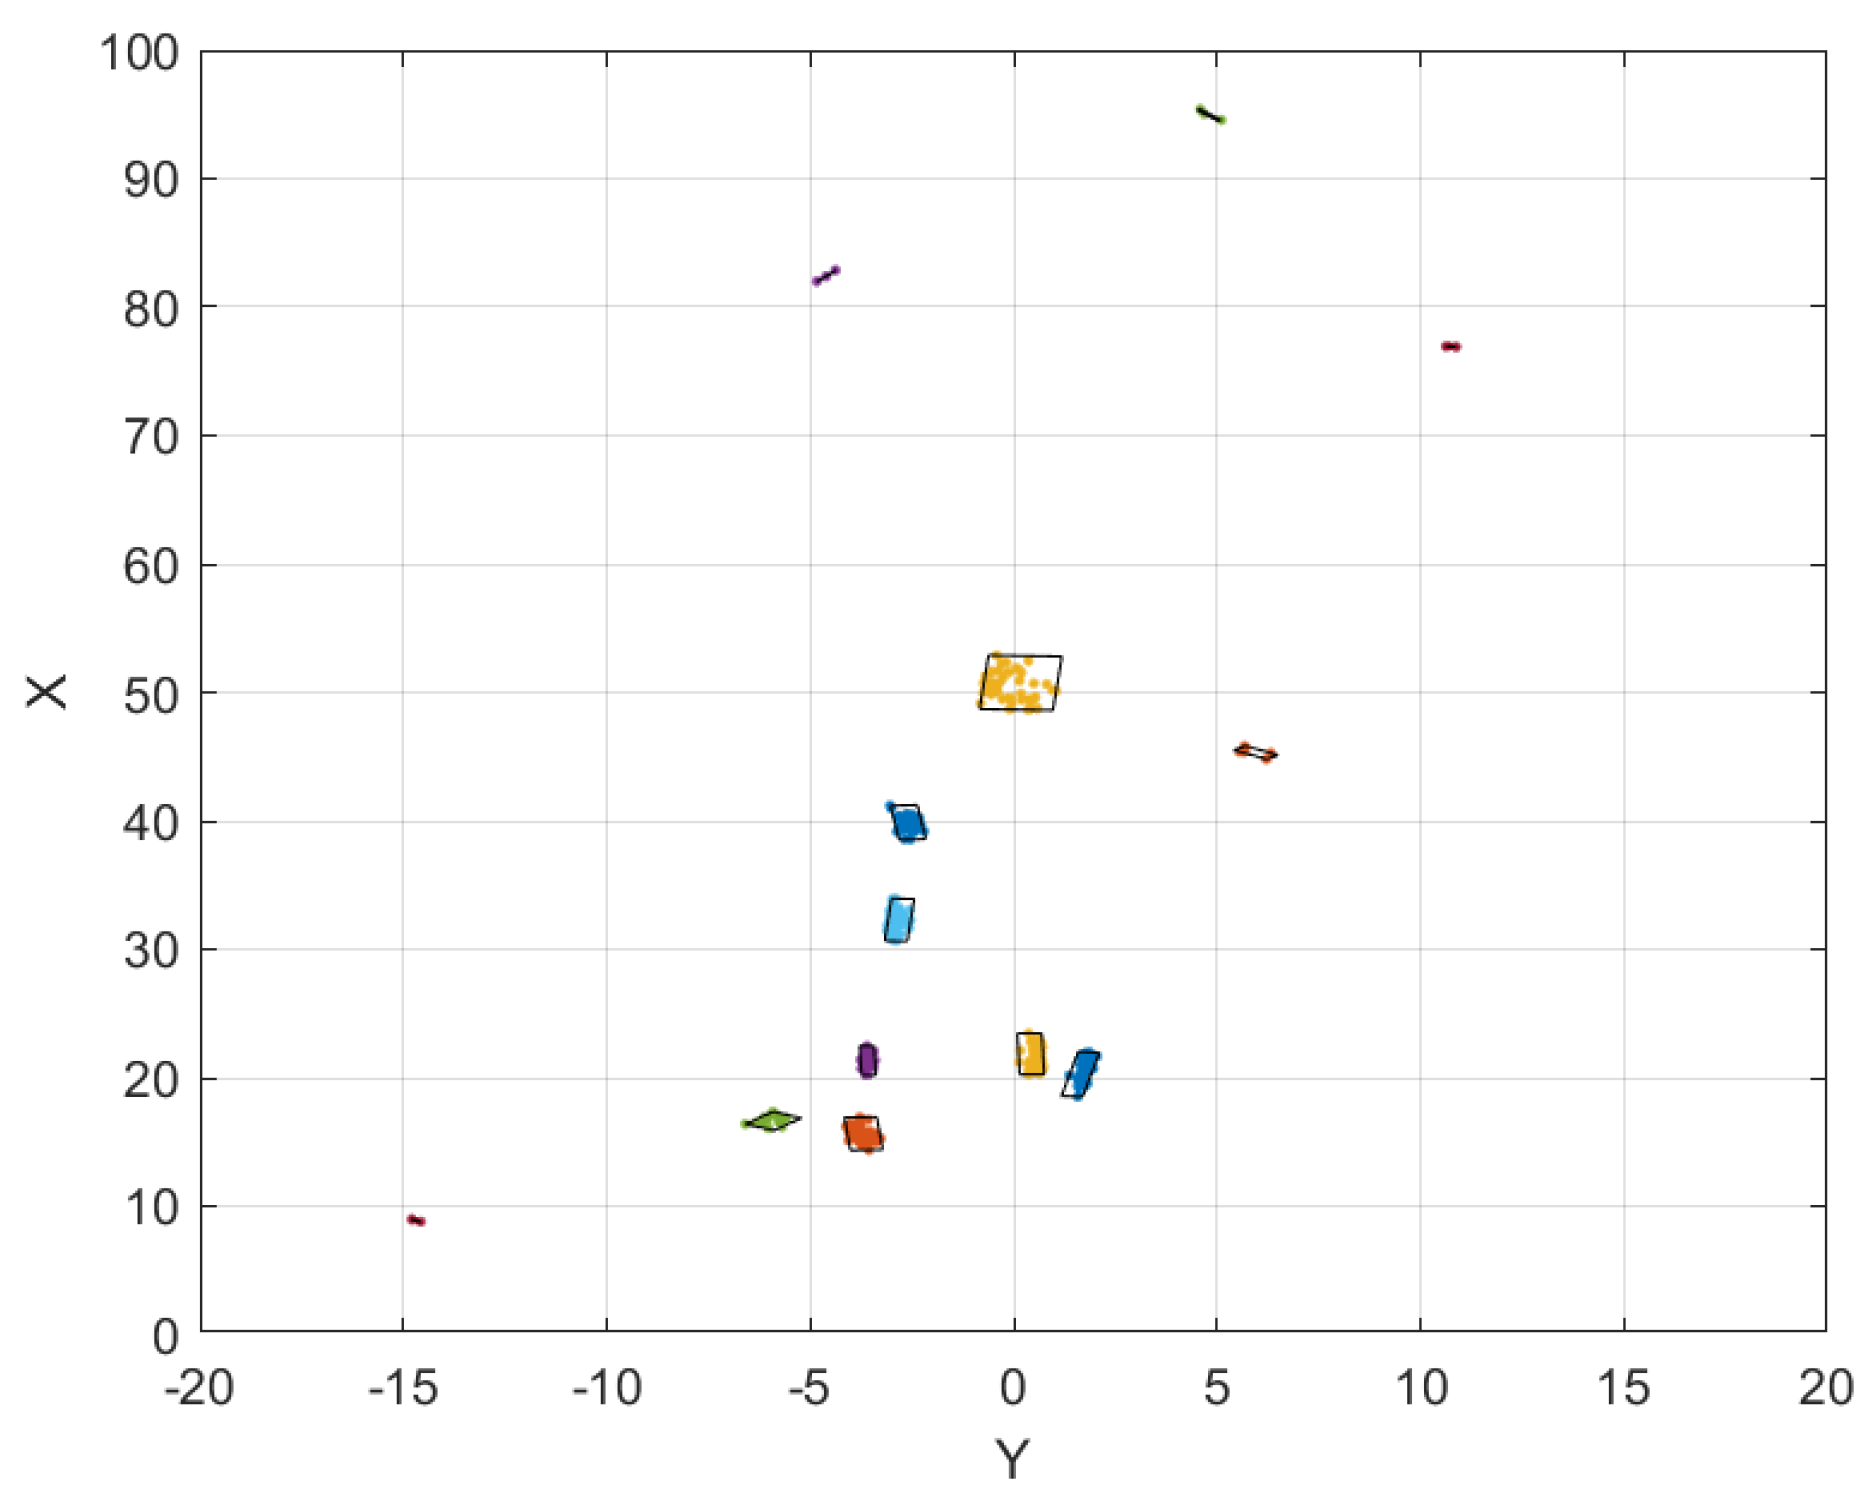
- The dimensions, denoted as (), are the dimensions of the estimated bounding box of the cluster represented in Figure 10. The bounding box is an optimization of the rectangular bounding box, covering all the points in the cluster with an estimated orientation of the cluster.
- The density represents the spatial distribution of the cluster and is calculated as follows:
- rcsEq is the equivalent radar cross section and represents the effective area presented by an object to the radar system. It quantifies the amount of radar energy that is scattered back toward the radar receiver. It takes into account the linear RCS of each point cloud given by and the signal phase, , which depends on the operating frequency of the radar, , and the time delay, , between the transmitted signal and the received signal. It is computed as follows:
- rcsStd is the standard deviation of the linear RCS estimated by the radar and refers to the statistical measure of variability in the linear RCS values of a given cluster.
6.2. Feature Selection
6.3. Classification Results
- 0: “four-wheeled”;
- 1: “two-wheeled”;
- 2: “others”.
7. Conclusions
Author Contributions
Funding
Institutional Review Board Statement
Informed Consent Statement
Data Availability Statement
Conflicts of Interest
Abbreviations
| AR | Adjusted Rand |
| AUC | Area Under the Curve |
| C | Completeness |
| CNN | Convolutional Neural Network |
| DB | Davies–Bouldin Index |
| DBSCAN | Density-Based Spatial Clustering of Applications with Noise |
| DL | Deep Learning |
| DT | Decision Tree |
| ESPRIT | Estimation of Signal Parameters via Rotational Invariant Techniques |
| FFT | Fast Fourier Transform |
| FMCW | Frequency-Modulated Continuous Wave |
| FPR | False Positive Rate |
| FPS | Frame Rate per Second |
| GHz | Giga Hertz |
| H | Homogeneity |
| ITS | Intelligent Transportation Systems |
| MCE | Minimum Classification Error |
| MDPI | Multidisciplinary Digital Publishing Institute |
| MIQ | Mutual Information Quotient |
| ML | Machine Learning |
| MRMR | Minimum Redundancy–Maximum Relevance |
| Pedelec | Pedal Electric Cycles |
| RCS | Radar Cross Section |
| RF | Random Forest |
| RGB | Red Green Blue |
| ROC | Receiver Operating Characteristic |
| ROS | Robot Operating System |
| S | Silhouette |
| SVM | Support Vector Machine |
| US | United States |
| V | V-measure |
| VGG16 | Very Deep Convolutional Networks with 16 layers |
| VoD | View of Delft |
| VRUs | Vulnerable Road Users |
| YOLO | You Only Look Once |
| TI | Texas Instruments |
| TPR | True Positive Rate |
References
- Report of the National Highway Traffic Safety Administration (NHTSA). Traffic Safety Facts: 2021 Data. June 2023. Available online: https://crashstats.nhtsa.dot.gov/Api/Public/ViewPublication/813484 (accessed on 1 November 2023).
- Kalaiselvan, K. Early Warning System for Safe Lateral Maneuver of Bicycles. Master’s Thesis, University of Twente, Enschede, The Netherlands, 2022. [Google Scholar]
- Englund, C.; Clasen, H.; Bui, T.H.; Lindström, D.; Andersson, J.; Englund, C.; Clasen, H.; Lindström, D. Radar system for bicycle—A new measure for safety. In Proceedings of the ITS World Congress, Singapore, 21–25 October 2019; pp. 21–25. [Google Scholar]
- Degen, C.; Domnik, C.; Kürten, A.; Meuleners, M.; Notz, M.; Pohle-Fröhlich, R.; Naroska, E. Driver Assistance System for Pedelecs. In Proceedings of the 2019 20th International Radar Symposium (IRS), Ulm, Germany, 26–28 June 2019; pp. 1–8. [Google Scholar]
- Dorn, C.; Kurin, T.; Erhardt, S.; Lurz, F.; Hagelauer, A. Signal Processing for Low-Power and Low-Cost Radar Systems in Bicycle Safety Applications. In Proceedings of the 2022 IEEE Topical Conference on Wireless Sensors and Sensor Networks (WiSNeT), Las Vegas, NV, USA, 16–19 January 2022; pp. 11–13. [Google Scholar]
- Hägelen, M.; Jetten, R.; Kassner, J.; Kulke, R. Safety and Comfort Enhancement with Radar for a Bicycle Assistance System. In Proceedings of the 2019 20th International Radar Symposium (IRS), Ulm, Germany, 26–28 June 2019; pp. 1–7. [Google Scholar]
- Lang, A.H.; Vora, S.; Caesar, H.; Zhou, L.; Yang, J.; Beijbom, O. PointPillars: Fast Encoders for Object Detection From Point Clouds. In Proceedings of the IEEE/CVF Conference on Computer Vision and Pattern Recognition, Long Beach, CA, USA, 15–20 June 2019; pp. 12697–12705. [Google Scholar]
- Palffy, A.; Pool, E.; Baratam, S.; Kooij, J.F.; Gavrila, D.M. Multi-class road user detection with 3+ 1D radar in the View-of-Delft dataset. IEEE Robot. Autom. Lett. 2022, 7, 4961–4968. [Google Scholar] [CrossRef]
- Ester, M.; Kriegel, H.P.; Sander, J.; Xu, X. A density-based algorithm for discovering clusters in large spatial databases with noise. In Proceedings of the Second International Conference on Knowledge Discovery in Databases and Data Mining (KDD), Portland, ON, USA, 2–4 August 1996; Volume 96, pp. 226–231. [Google Scholar]
- Cortes, C.; Vapnik, V. Support-vector networks. Mach. Learn. 1997, 20, 273–297. [Google Scholar] [CrossRef]
- Kim, S.; Lee, S.; Doo, S.; Shim, B. Moving Target Classification in Automotive Radar Systems Using Convolutional Recurrent Neural Networks. In Proceedings of the 2018 26th European Signal Processing Conference (EUSIPCO), Roma, Italy, 3–7 September 2018; pp. 1482–1486. [Google Scholar]
- Yanik, M.E.; Rao, S. Radar-Based Multiple Target Classification in Complex Environments Using 1D-CNN Models. In Proceedings of the 2023 IEEE Radar Conference (RadarConf23), San Antonio, TX, USA, 1–5 May 2023; pp. 1–6. [Google Scholar]
- Kim, W.; Cho, H.; Kim, J.; Kim, B.; Lee, S. YOLO-Based Simultaneous Target Detection and Classification in Automotive FMCW Radar Systems. Sensors 2020, 20, 2897. [Google Scholar] [CrossRef] [PubMed]
- Lamane, M.; Tabaa, M.; Klilou, A. New Approach Based on Pix2Pix–YOLOv7 mmWave Radar for Target Detection and Classification. Sensors 2023, 23, 9456. [Google Scholar] [CrossRef] [PubMed]
- Palffy, A.; Dong, J.; Kooij, J.F.; Gavrila, D.M. CNN Based Road User Detection Using the 3D Radar Cube. IEEE Robot. Autom. Lett. 2020, 5, 1263–1270. [Google Scholar] [CrossRef]
- Gao, X.; Xing, G.; Roy, S.; Liu, H. Experiments with mmWave Automotive Radar Test-bed. In Proceedings of the 53rd Asilomar Conference on Signals, Systems, and Computers, Pacific Grove, CA, USA, 3–6 November 2019; pp. 1–6. [Google Scholar]
- Zhao, Z.; Song, Y.; Cui, F.; Zhu, J.; Song, C.; Xu, Z.; Ding, K. Point Cloud Features-Based Kernel SVM for Human-Vehicle Classification in Millimeter Wave Radar. IEEE Access 2020, 8, 26012–26021. [Google Scholar] [CrossRef]
- Rizik, A.; Tavanti, E.; Vio, R.; Delucchi, A.; Chible, H.; Randazzo, A.; Caviglia, D.D. Single Target Recognition Using a Low-Cost FMCW Radar Based on Spectrum Analysis. In Proceedings of the 27th IEEE International Conference on Electronics, Circuits and Systems, (ICECS), Glasgow, Scotland, UK, 23–25 November 2020; pp. 1–4. [Google Scholar]
- Schubert, E.; Meinl, F.; Kunert, M.; Menzel, W. Clustering of High Resolution Automotive Radar Detections and Subsequent Feature Extraction for Classification of Road Users. In Proceedings of the 16th International Radar Symposium (IRS), Dresden, Germany, 24–26 June 2015; pp. 174–179. [Google Scholar]
- Scheiner, N.; Appenrodt, N.; Dickmann, J. Sick A Multi-Stage Clustering Framework for Automotive Radar Data. In Proceedings of the 2019 IEEE Intelligent Transportation Systems Conference, (ITSC), Auckland, New Zealand, 27–30 October 2019; pp. 2060–2067. [Google Scholar]
- Xie, S.; Wang, C.; Yang, X.; Wan, Y.; Zeng, T.; Liu, Z. Millimeter-Wave Radar Target Detection Based on Inter-frame DBSCAN Clustering. In Proceedings of the 22nd IEEE International Conference on Communication Technology (ICCT), Nanjing, China, 11–14 November 2022; pp. 1703–1708. [Google Scholar]
- Lu, Y.; Balachandran, A.; Tharmarasa, R.; Chomal, S. Detection Level and Target Level Road User Classification with Radar Point Cloud. In Proceedings of the 2023 IEEE Sensors Applications Symposium (SAS), Ottawa, ON, Canada, 18–20 July 2023; pp. 1–6. [Google Scholar]
- Kim, W.; Cho, H.; Kim, J.; Kim, B.; Lee, S. Target Classification Using Combined YOLO-SVM in High-Resolution Automotive FMCW Radar. In Proceedings of the 2020 IEEE Radar Conference (RadarConf20), Florence, Italy, 21–25 September 2020; pp. 1–5. [Google Scholar]
- Gao, T.; Lai, Z.; Mei, Z.; Wu, Q. Hybrid SVM-CNN Classification Technique for Moving Targets in Automotive FMCW Radar System. In Proceedings of the 11th International Conference on Wireless Communications and Signal Processing (WCSP), Xi’an, China, 23–25 October 2019; pp. 1–6. [Google Scholar]
- Fang, W.H.; Fang, L.D. Joint Angle and Range Estimation with Signal Clustering in FMCW Radar. IEEE Sens. 2020, 20, 1882–1892. [Google Scholar] [CrossRef]
- Noureddine, B.O.; Walid, R.; Olivier, J. Maneuvering Aid for cyclists. INPI Patent FR3122927, 18 November 2022. [Google Scholar]
- Rosenberg, A.; Hirschberg, J. V-Measure: A Conditional Entropy-Based External Cluster Evaluation Measure. In Proceedings of the 2007 Joint Conference on Empirical Methods in Natural Language Processing and Computational Natural Language Learning (EMNLP-CoNLL), Prague, Czech Republic, 28–30 June 2007; pp. 410–420. [Google Scholar]
- Warrens, M.J.; van der Hoef, H. Understanding the adjusted rand index and other partition comparison indices based on counting object pairs. J. Classif. 2022, 39, 487–509. [Google Scholar] [CrossRef]
- Davies, D.L.; Bouldin, D.W. A cluster separation measure. IEEE Trans. Pattern Anal. Mach. Intell. 1979, 1, 224–227. [Google Scholar] [CrossRef] [PubMed]
- Kaufman, L.; Rousseeuw, P.J. Finding Groups in Data: An Introduction to Cluster Analysis; John Wiley & Sons: Hoboken, NJ, USA, 2009. [Google Scholar]
- Ding, C.; Peng, H. Minimum Redundancy Feature Selection from Microarray Gene Expression Data. J. Bioinform. Comput. Biol. 2005, 3, 185–206. [Google Scholar] [CrossRef] [PubMed]
- Rokach, L.; Maimon, O. Decision trees. In Data Mining and Knowledge Discovery Handbook; Springer: New York, NY, USA, 2005; pp. 165–192. [Google Scholar]
- Breiman, L. Random Forests. Mach. Learn. 2001, 45, 5–32. [Google Scholar] [CrossRef]
- Chengsheng, T.; Huacheng, L.; Bing, X. AdaBoost typical Algorithm and its application research. MATEC Web Conf. 2017, 139, 222. [Google Scholar] [CrossRef]
- Kohavi, R. A Study of Cross-Validation and Bootstrap for Accuracy Estimation and Model Selection. IJCAI 1995, 14, 1137–1145. [Google Scholar]
- Snoek, J.; Larochelle, H.; Adams, R.P. Practical Bayesian Optimization of Machine Learning Algorithms. In Advances in Neural Information Processing Systems; Curran Associates, Inc.: New York, NY, USA, 2012; p. 25. [Google Scholar]
- Matton, M.; Van Compernolle, D.; Cools, R. Minimum classification error training in example based speech and pattern recognition using sparse weight matrices. Comput. Appl. Math. 2010, 234, 1303–1311. [Google Scholar] [CrossRef]
- Bradley, A.P. The use of the area under the ROC curve in the evaluation of machine learning algorithms. Pattern Recognit. 1997, 30, 1145–1159. [Google Scholar] [CrossRef]


| Parameter | Value |
|---|---|
| Maximum range | 100 m |
| Range resolution | 0.49 m |
| Maximum radial velocity | 20.29 m/s |
| Radial velocity resolution | 1.27 m/s |
| Azimuth resolution | 14.5° |
| Number of chirps per frame | 64 |
| Number of samples per chirp | 256 |
| Frame rate | 10 FPS |
| Sampling rate | 12.5 Msps |
| Sweep bandwidth | 307.2 MHz |
| Number of transmit antennas | 2 |
| Number of receive antennas | 4 |
| Parameter | Value |
|---|---|
| Frame resolution | 640 × 480 |
| Frame rate | 25 FPS |
| FOV (H × V) | 69° × 42° |
| sensor resolution | 2 MP |
| Key Metric | for | ||||||||||||
| 0.1 | 0.2 | 0.3 | 0.4 | 0.5 | 0.6 | 0.7 | 0.8 | 0.9 | 1.0 | 1.1 | 1.2 | 1.3 | |
| Homogeneity | 0.488 | 0.737 | 0.850 | 0.891 | 0.936 | 0.955 | 0.955 | 0.902 | 0.903 | 0.908 | 0.908 | 0.906 | 0.906 |
| Completeness | 0.456 | 0.603 | 0.746 | 0.763 | 0.790 | 0.820 | 0.813 | 0.809 | 0.803 | 0.797 | 0.787 | 0.781 | 0.781 |
| V-score | 0.471 | 0.663 | 0.795 | 0.822 | 0.857 | 0.882 | 0.878 | 0.853 | 0.850 | 0.849 | 0.843 | 0.839 | 0.839 |
| Key Metric | for | ||||||||||||
| 0.1 | 0.2 | 0.3 | 0.4 | 0.5 | 0.6 | 0.7 | 0.8 | 0.9 | 1 | 1.1 | 1.2 | 1.3 | |
| Homogeneity | 0.318 | 0.618 | 0.784 | 0.849 | 0.903 | 0.921 | 0.938 | 0.885 | 0.885 | 0.891 | 0.891 | 0.889 | 0.889 |
| Completeness | 0.471 | 0.659 | 0.792 | 0.838 | 0.865 | 0.898 | 0.889 | 0.889 | 0.889 | 0.889 | 0.867 | 0.852 | 0.852 |
| V-measure | 0.380 | 0.639 | 0.789 | 0.844 | 0.883 | 0.909 | 0.913 | 0.887 | 0.887 | 0.889 | 0.879 | 0.869 | 0.869 |
| Key Metric | for | ||||||||||||
| 0.1 | 0.2 | 0.3 | 0.4 | 0.5 e | 0.6 | 0.7 | 0.8 | 0.9 | 1.0 | 1.1 | 1.2 | 1.3 | |
| Homogeneity | 0.176 | 0.573 | 0.729 | 0.808 | 0.853 | 0.875 | 0.875 | 0.858 | 0.858 | 0.864 | 0.864 | 0.861 | 0.861 |
| Completeness | 0.450 | 0.687 | 0.787 | 0.851 | 0.890 | 0.943 | 0.943 | 0.928 | 0.928 | 0.912 | 0.912 | 0.907 | 0.907 |
| V-score | 0.253 | 0.625 | 0.757 | 0.829 | 0.871 | 0.908 | 0.908 | 0.892 | 0.892 | 0.887 | 0.887 | 0.883 | 0.883 |
| Method | H | C | V | AR | DB | S | |
|---|---|---|---|---|---|---|---|
| 2-Level | Mean | 0.91 | 0.91 | 0.91 | 0.86 | 0.16 | 0.53 |
| Min | 0.79 | 0.78 | 0.87 | 0.72 | 0.09 | 0.12 | |
| Max | 0.98 | 0.97 | 0.98 | 0.99 | 0.21 | 0.87 | |
| DBSCAN | Mean | 0.89 | 0.88 | 0.88 | 0.83 | 0.18 | 0.5 |
| Min | 0.77 | 0.73 | 0.81 | 0.69 | 0.07 | −0.2 | |
| Max | 0.96 | 0.95 | 0.97 | 0.97 | 0.33 | 0.86 | |
| Feature | Score |
|---|---|
| dimension over x-axis | 0.32 |
| dimension over y-axis | 0.24 |
| mean velocity | 0.21 |
| equivalent RCS | 0.19 |
| density | 0.11 |
| standard deviation of RCS | 0.09 |
| Accuracy | Feature Set | Classifier | |||
|---|---|---|---|---|---|
| DT | RF | Gaussian SVM | AdaBoost | ||
| Validation | Proposed feature set | 83.2% | 87.8% | 88.4% | 86.6% |
| Feature set from Ref. [17] | 77.8 % | 82.3% | 81.6% | 81.2% | |
| Test | Proposed feature set | 80.8% | 85.9% | 85.9% | 86.4% |
| Feature set from Ref. [17] | 82.6% | 86.1% | 83.9% | 84.8% | |
Disclaimer/Publisher’s Note: The statements, opinions and data contained in all publications are solely those of the individual author(s) and contributor(s) and not of MDPI and/or the editor(s). MDPI and/or the editor(s) disclaim responsibility for any injury to people or property resulting from any ideas, methods, instructions or products referred to in the content. |
© 2024 by the authors. Licensee MDPI, Basel, Switzerland. This article is an open access article distributed under the terms and conditions of the Creative Commons Attribution (CC BY) license (https://creativecommons.org/licenses/by/4.0/).
Share and Cite
Omri, A.; Benothman, N.; Sayahi, S.; Tlili, F.; Chaabane, F.; Besbes, H. Advancing Cycling Safety: On-Bike Alert System Utilizing Multi-Layer Radar Point Cloud Clustering for Coarse Object Classification. Sensors 2024, 24, 3094. https://doi.org/10.3390/s24103094
Omri A, Benothman N, Sayahi S, Tlili F, Chaabane F, Besbes H. Advancing Cycling Safety: On-Bike Alert System Utilizing Multi-Layer Radar Point Cloud Clustering for Coarse Object Classification. Sensors. 2024; 24(10):3094. https://doi.org/10.3390/s24103094
Chicago/Turabian StyleOmri, Asma, Noureddine Benothman, Sofiane Sayahi, Fethi Tlili, Ferdaous Chaabane, and Hichem Besbes. 2024. "Advancing Cycling Safety: On-Bike Alert System Utilizing Multi-Layer Radar Point Cloud Clustering for Coarse Object Classification" Sensors 24, no. 10: 3094. https://doi.org/10.3390/s24103094
APA StyleOmri, A., Benothman, N., Sayahi, S., Tlili, F., Chaabane, F., & Besbes, H. (2024). Advancing Cycling Safety: On-Bike Alert System Utilizing Multi-Layer Radar Point Cloud Clustering for Coarse Object Classification. Sensors, 24(10), 3094. https://doi.org/10.3390/s24103094