
Automated Vibroacoustic Monitoring of Trees for Borer Infestation


Abstract
1. Introduction
2. Materials and Methods
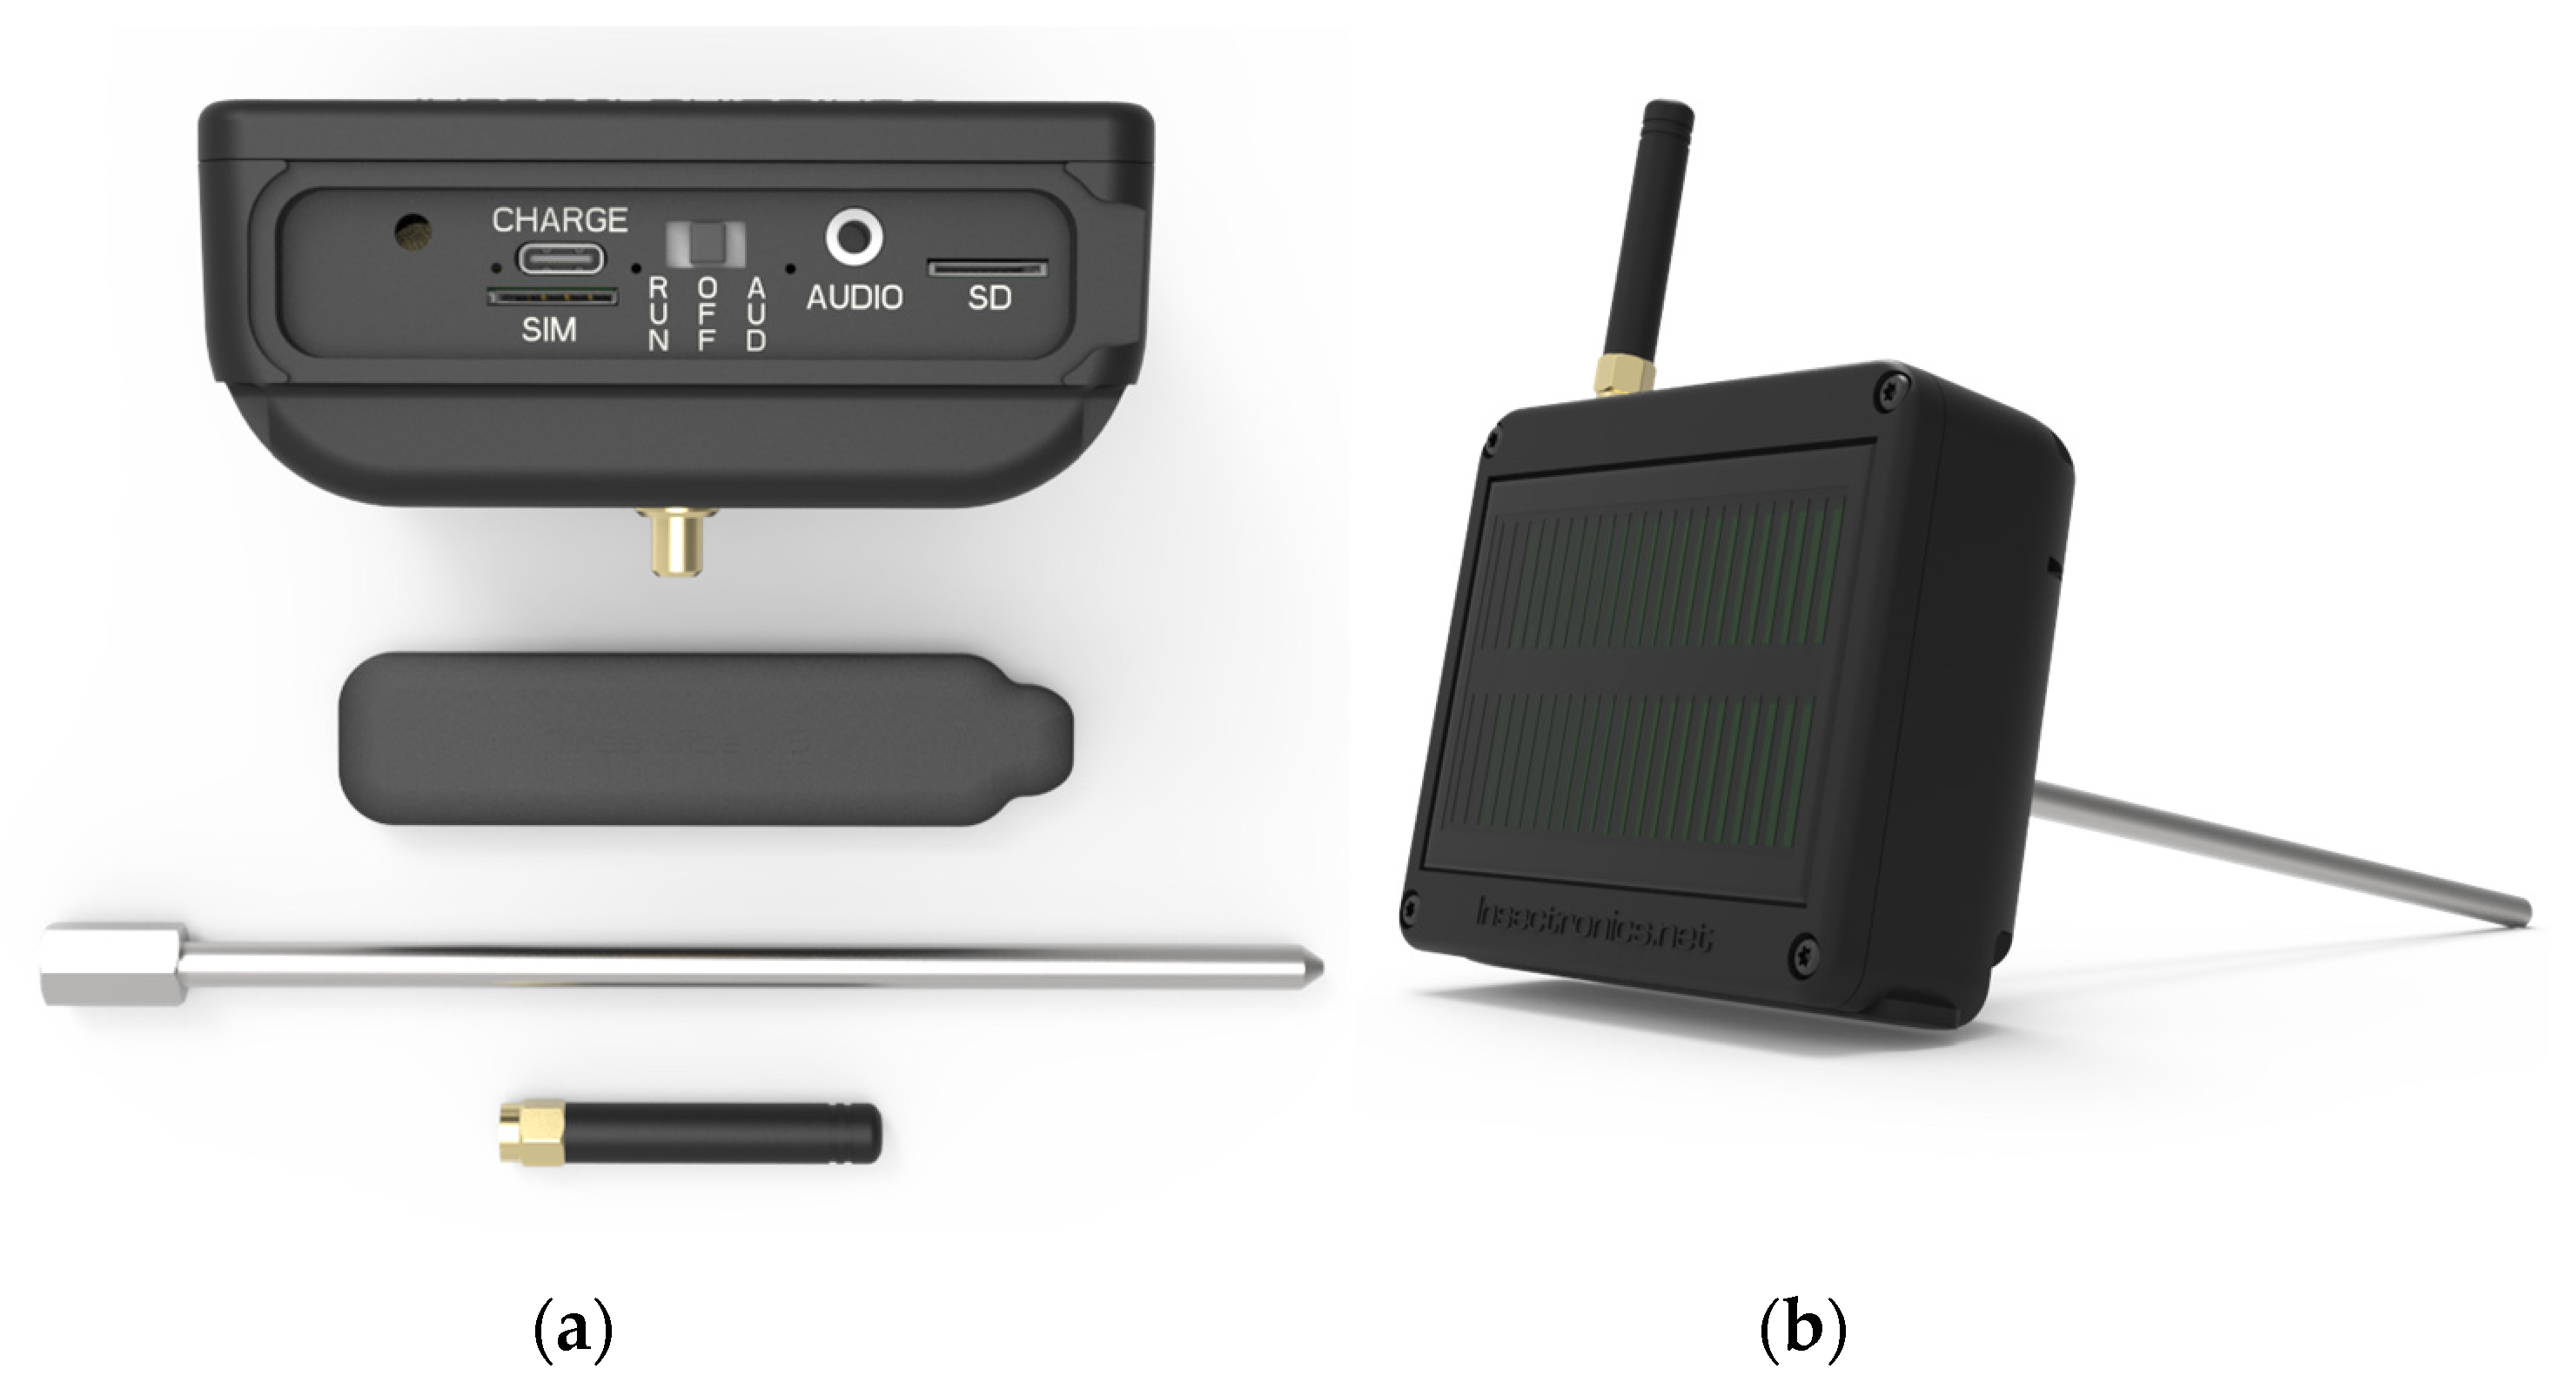
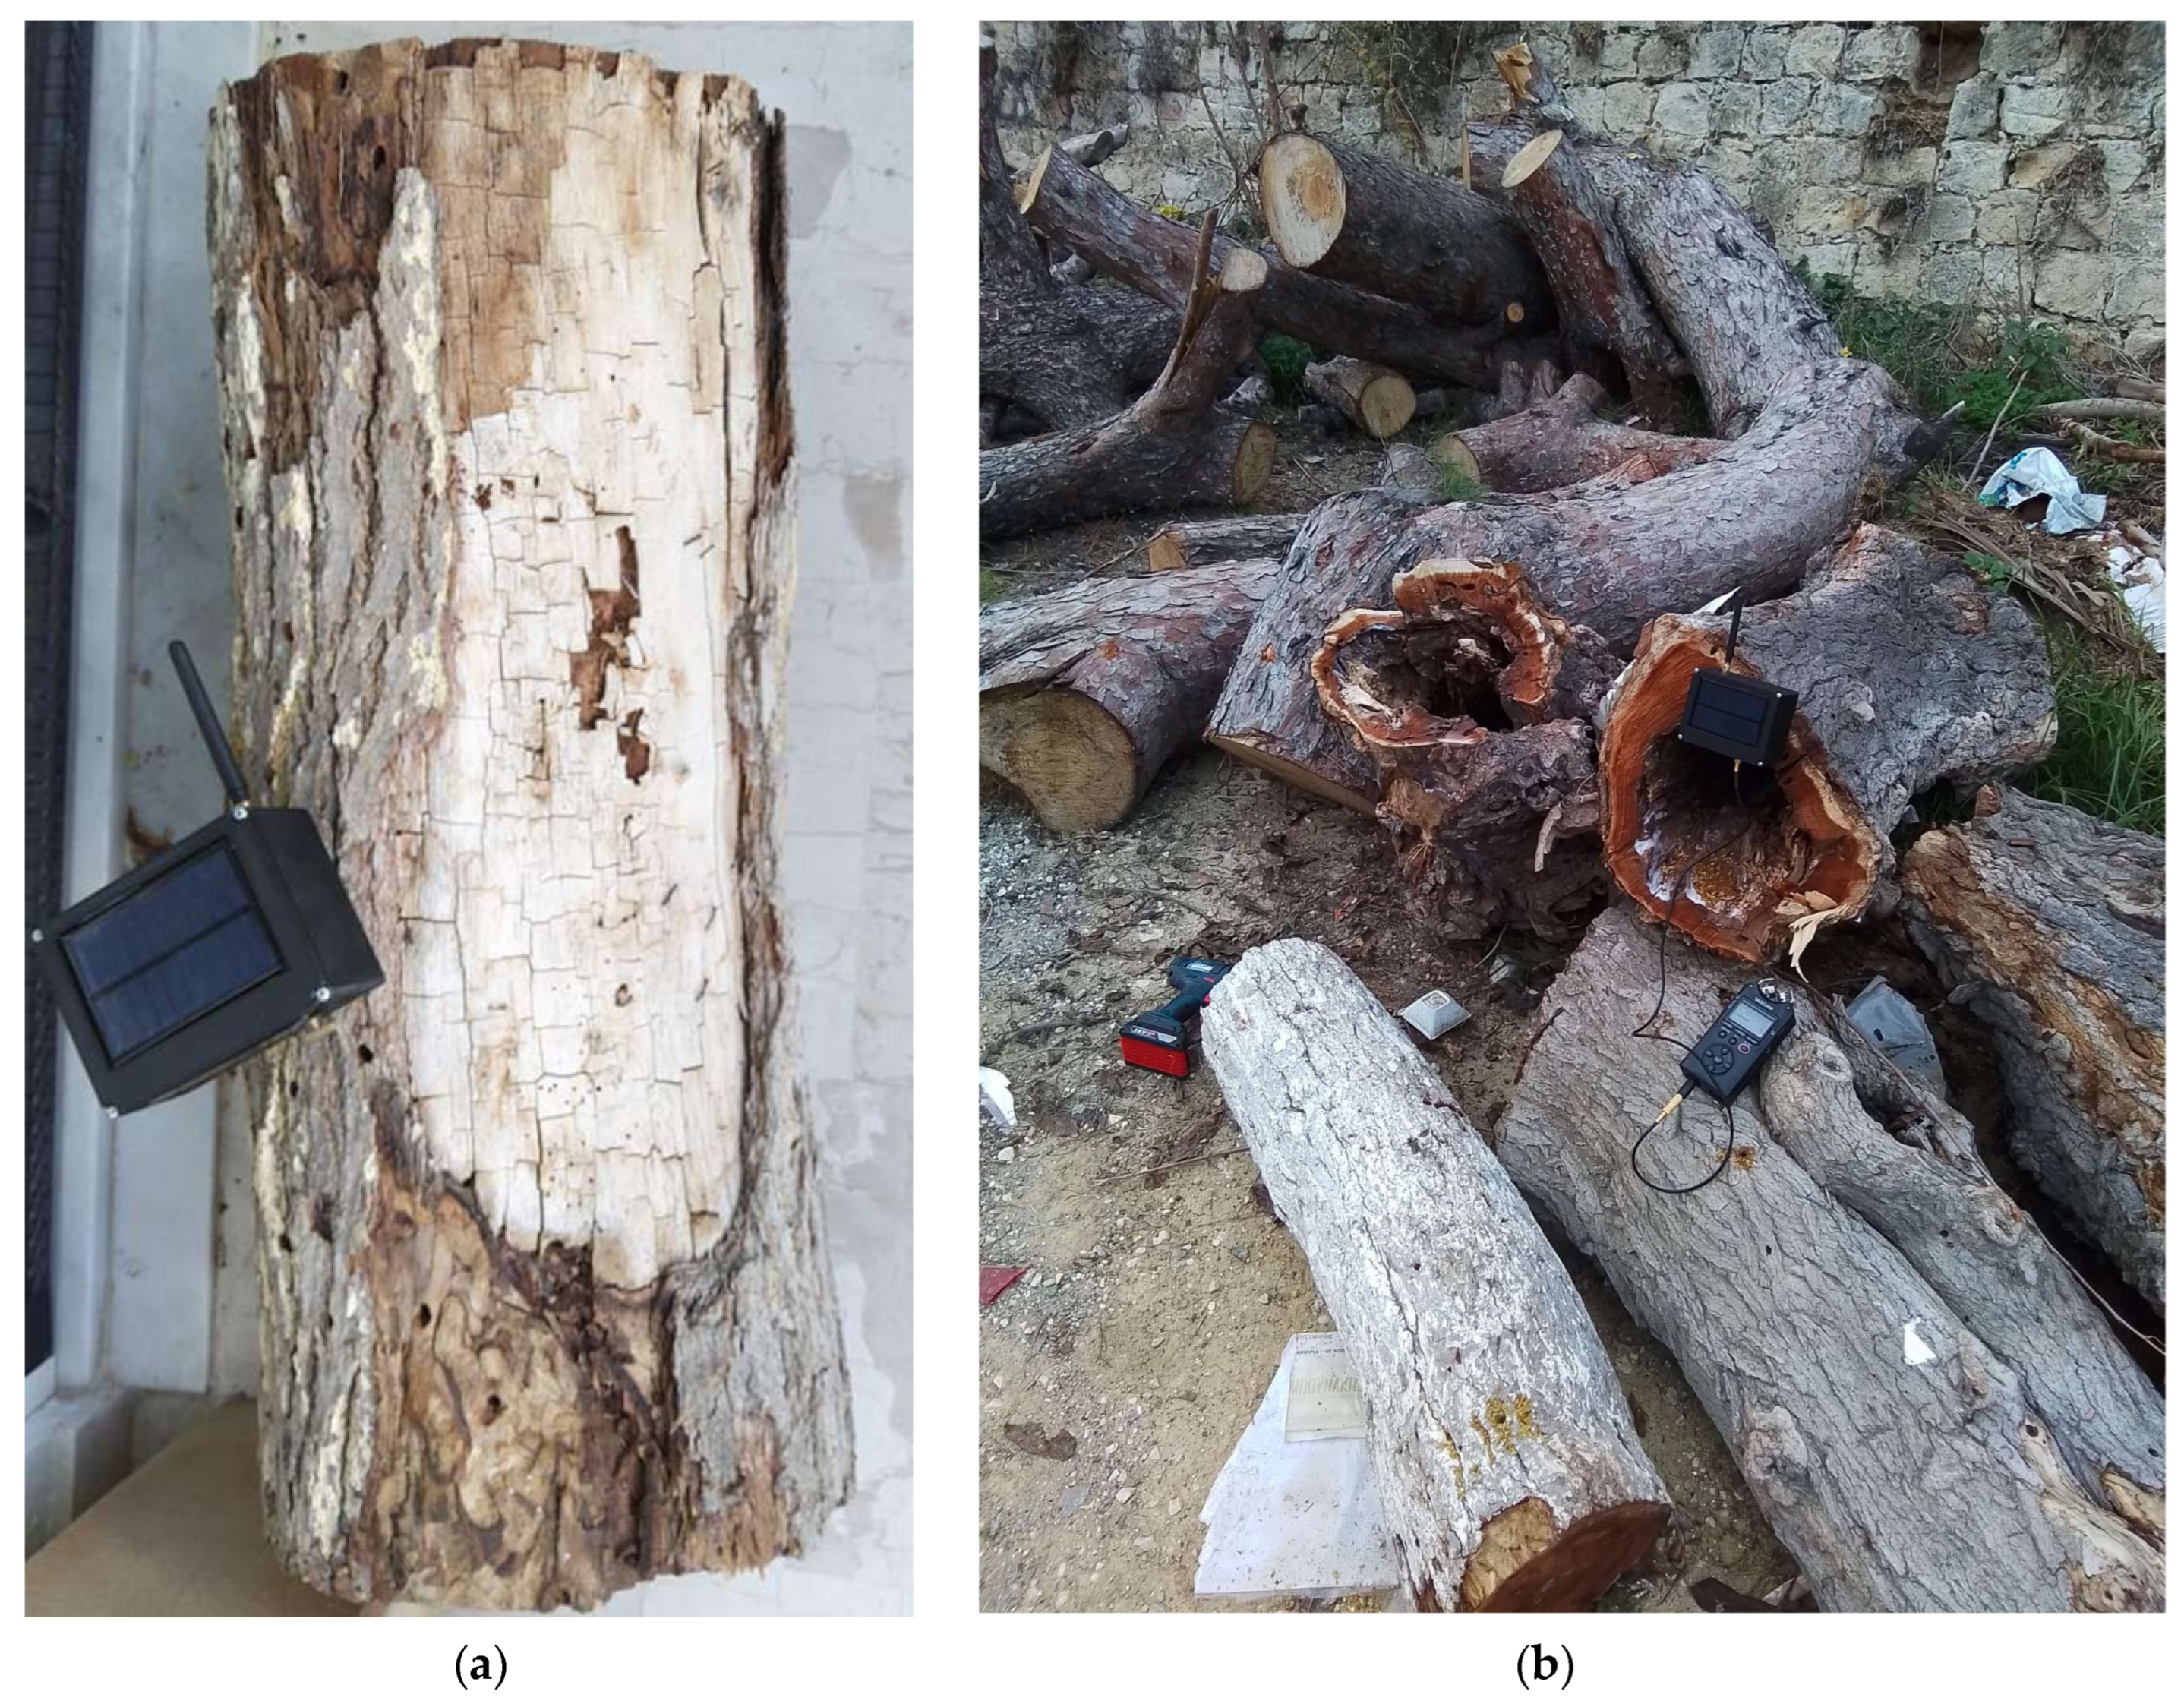
2.1. Materials
2.2. Methods
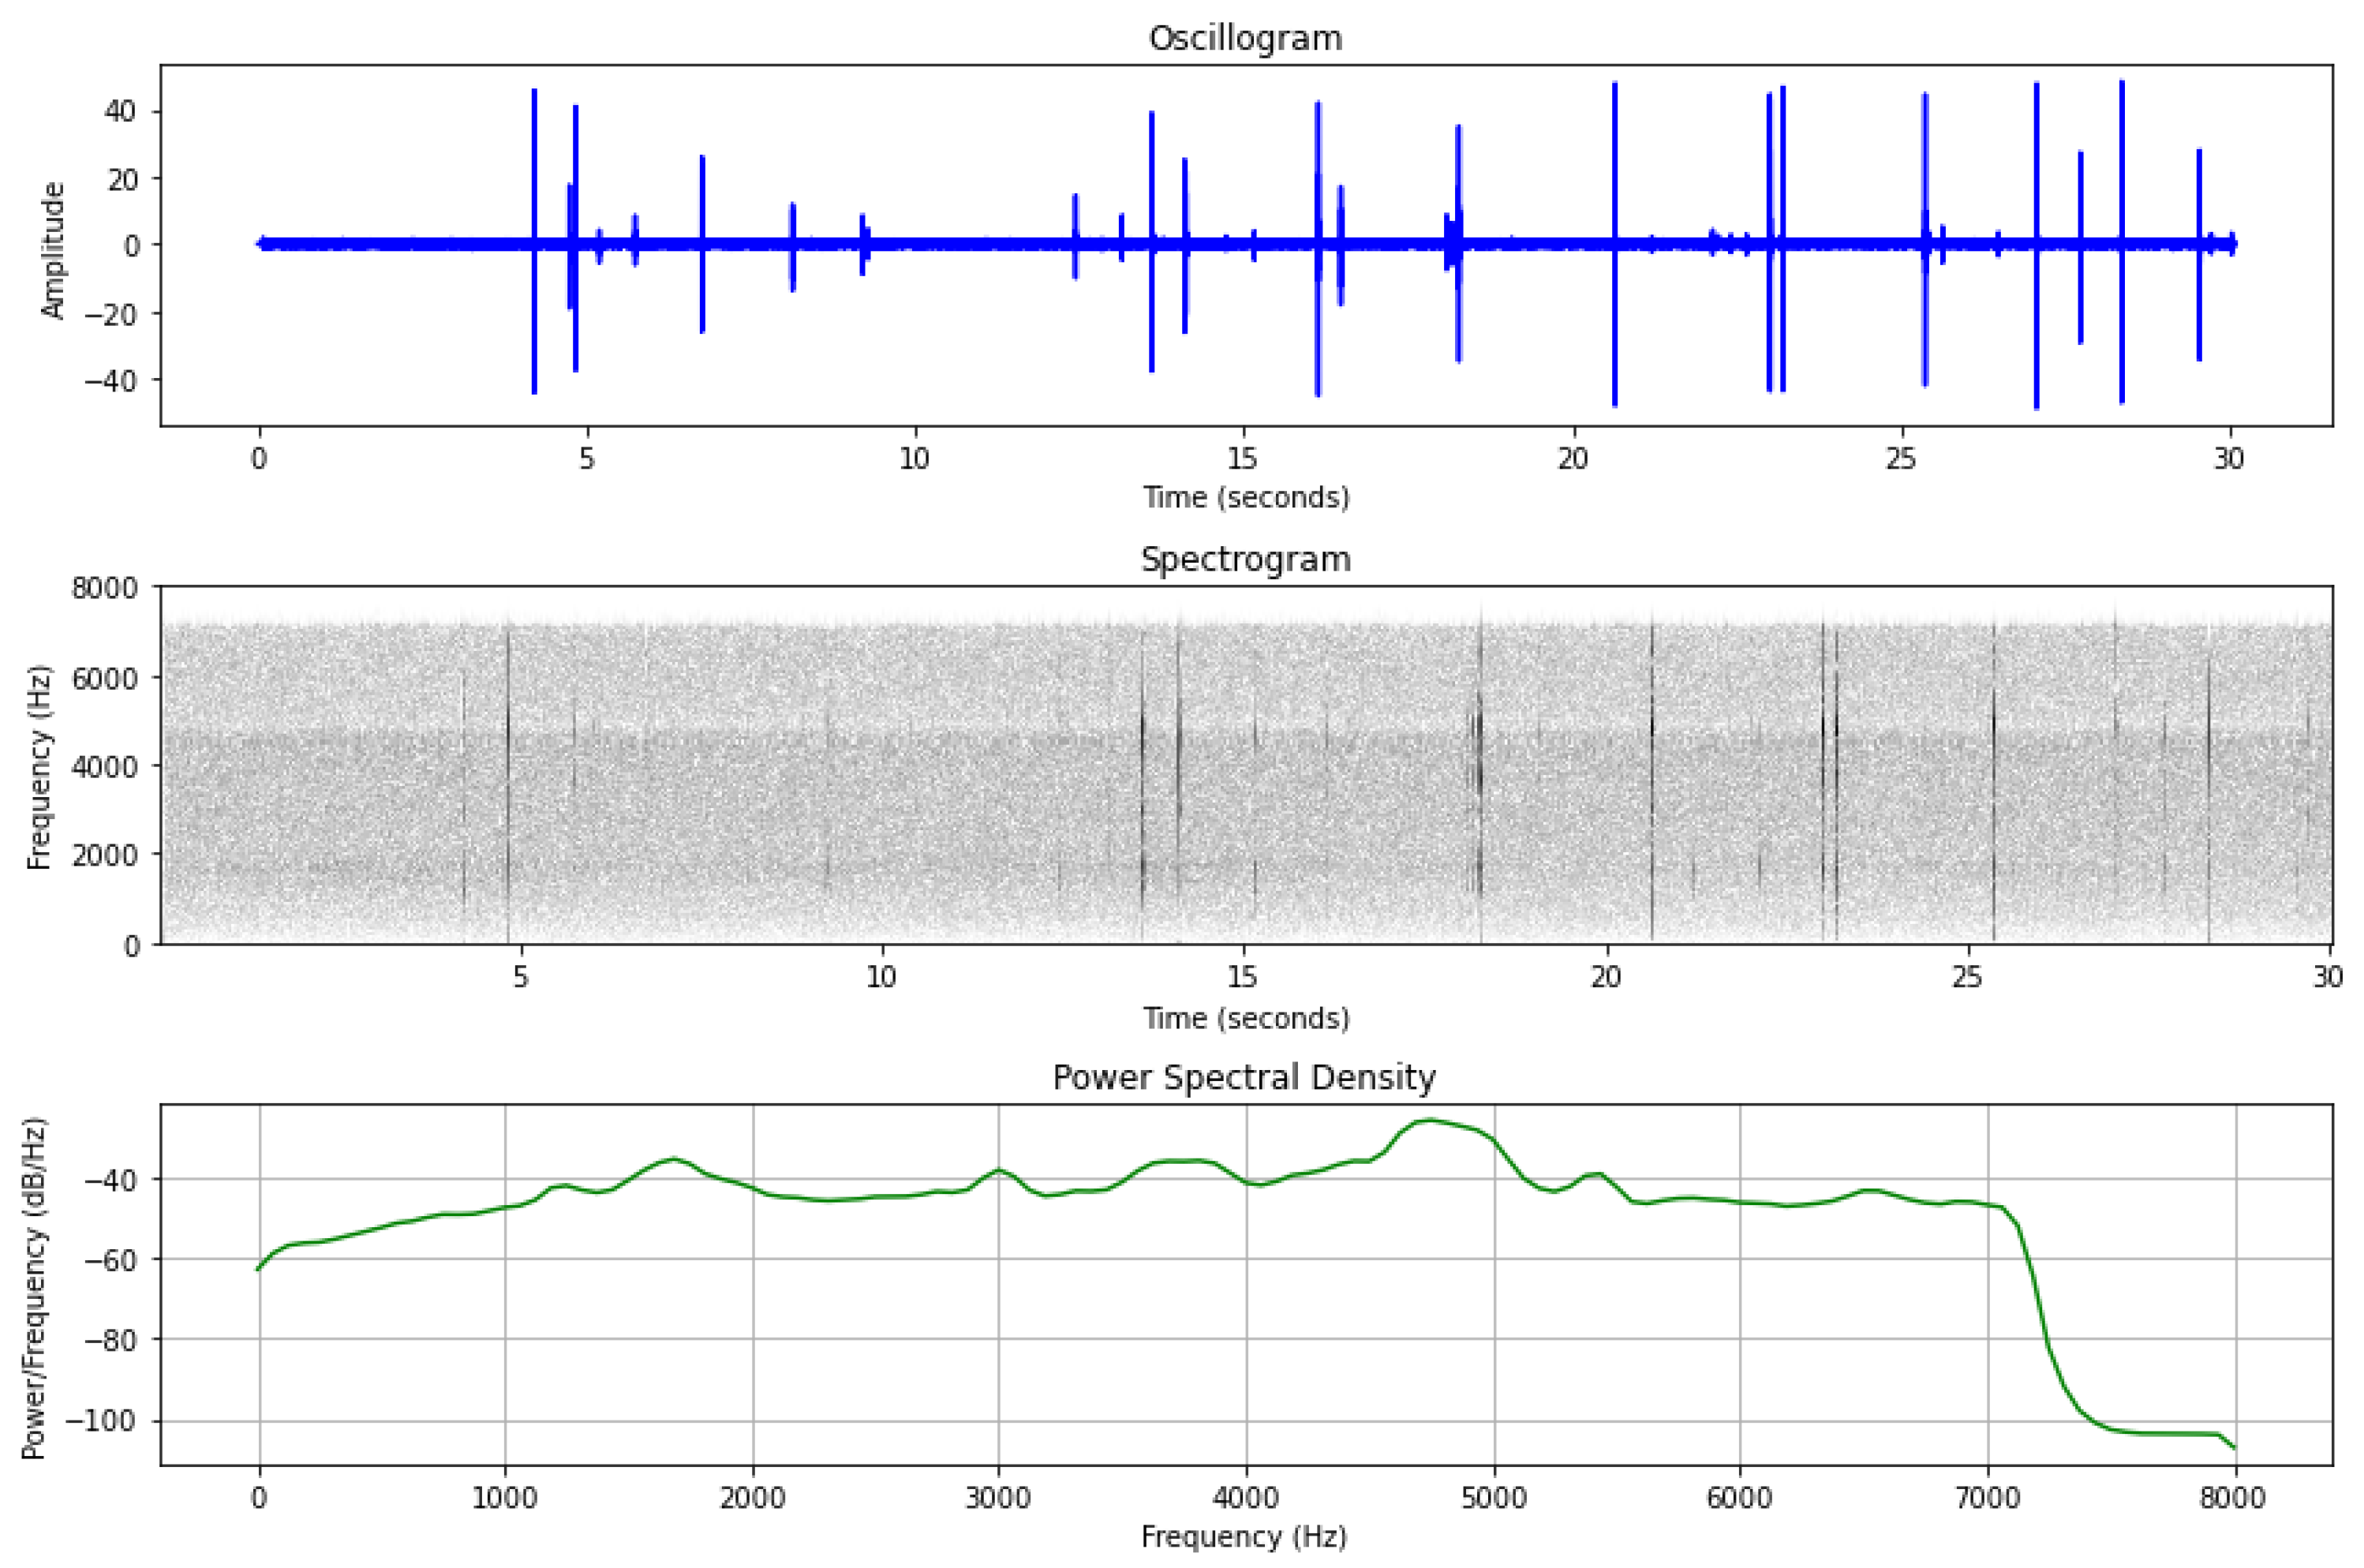
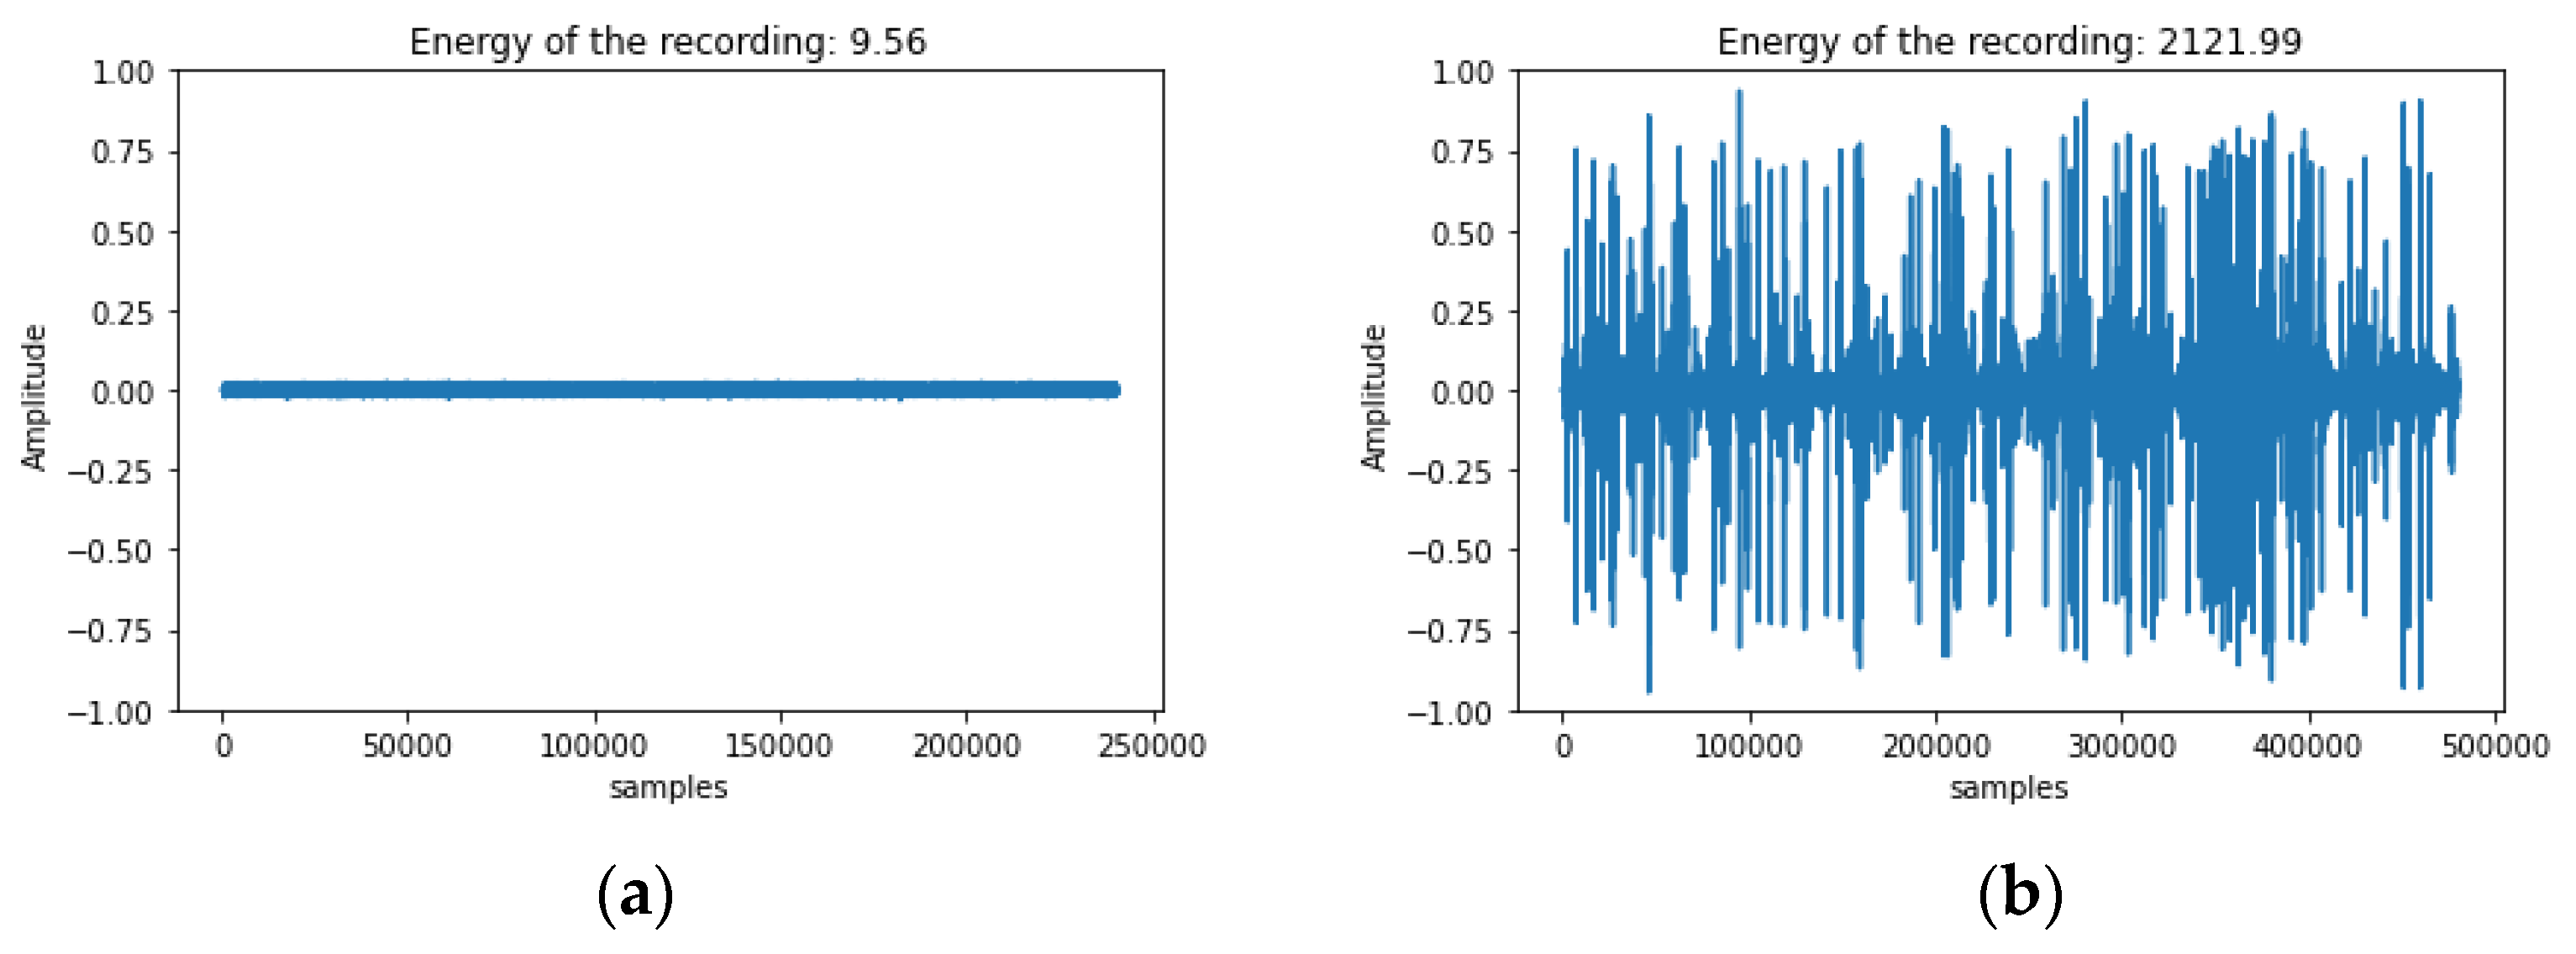
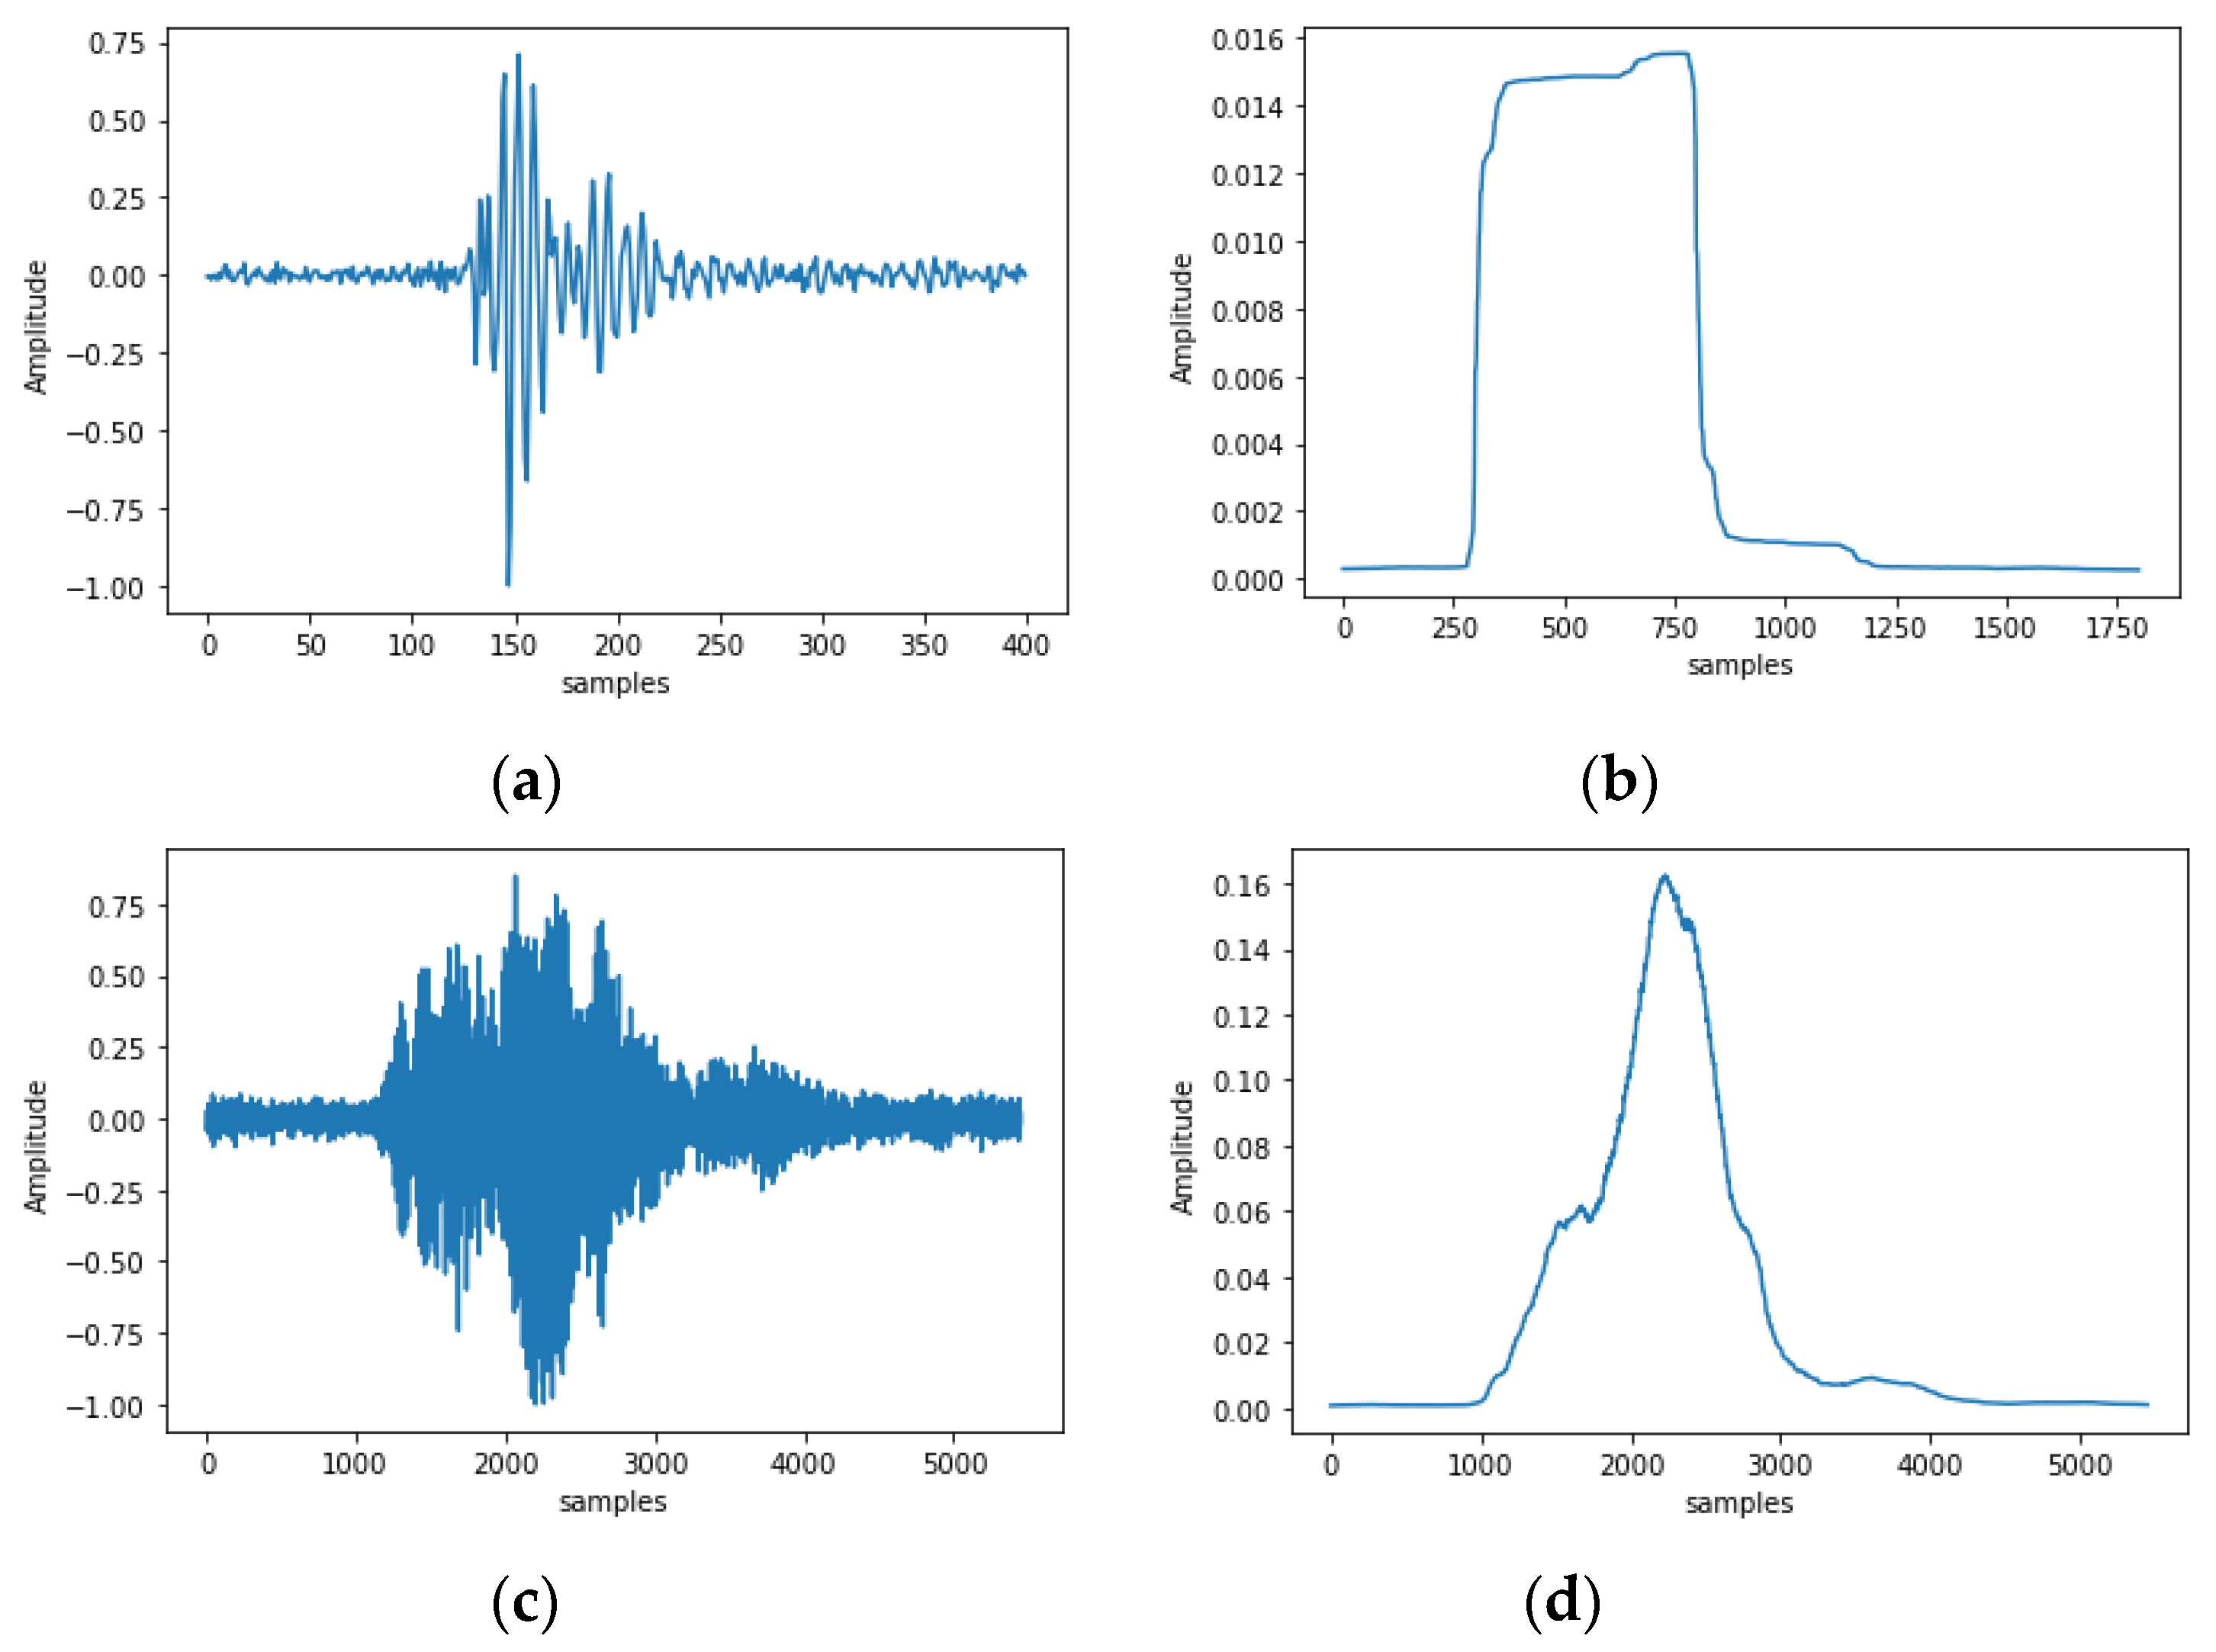
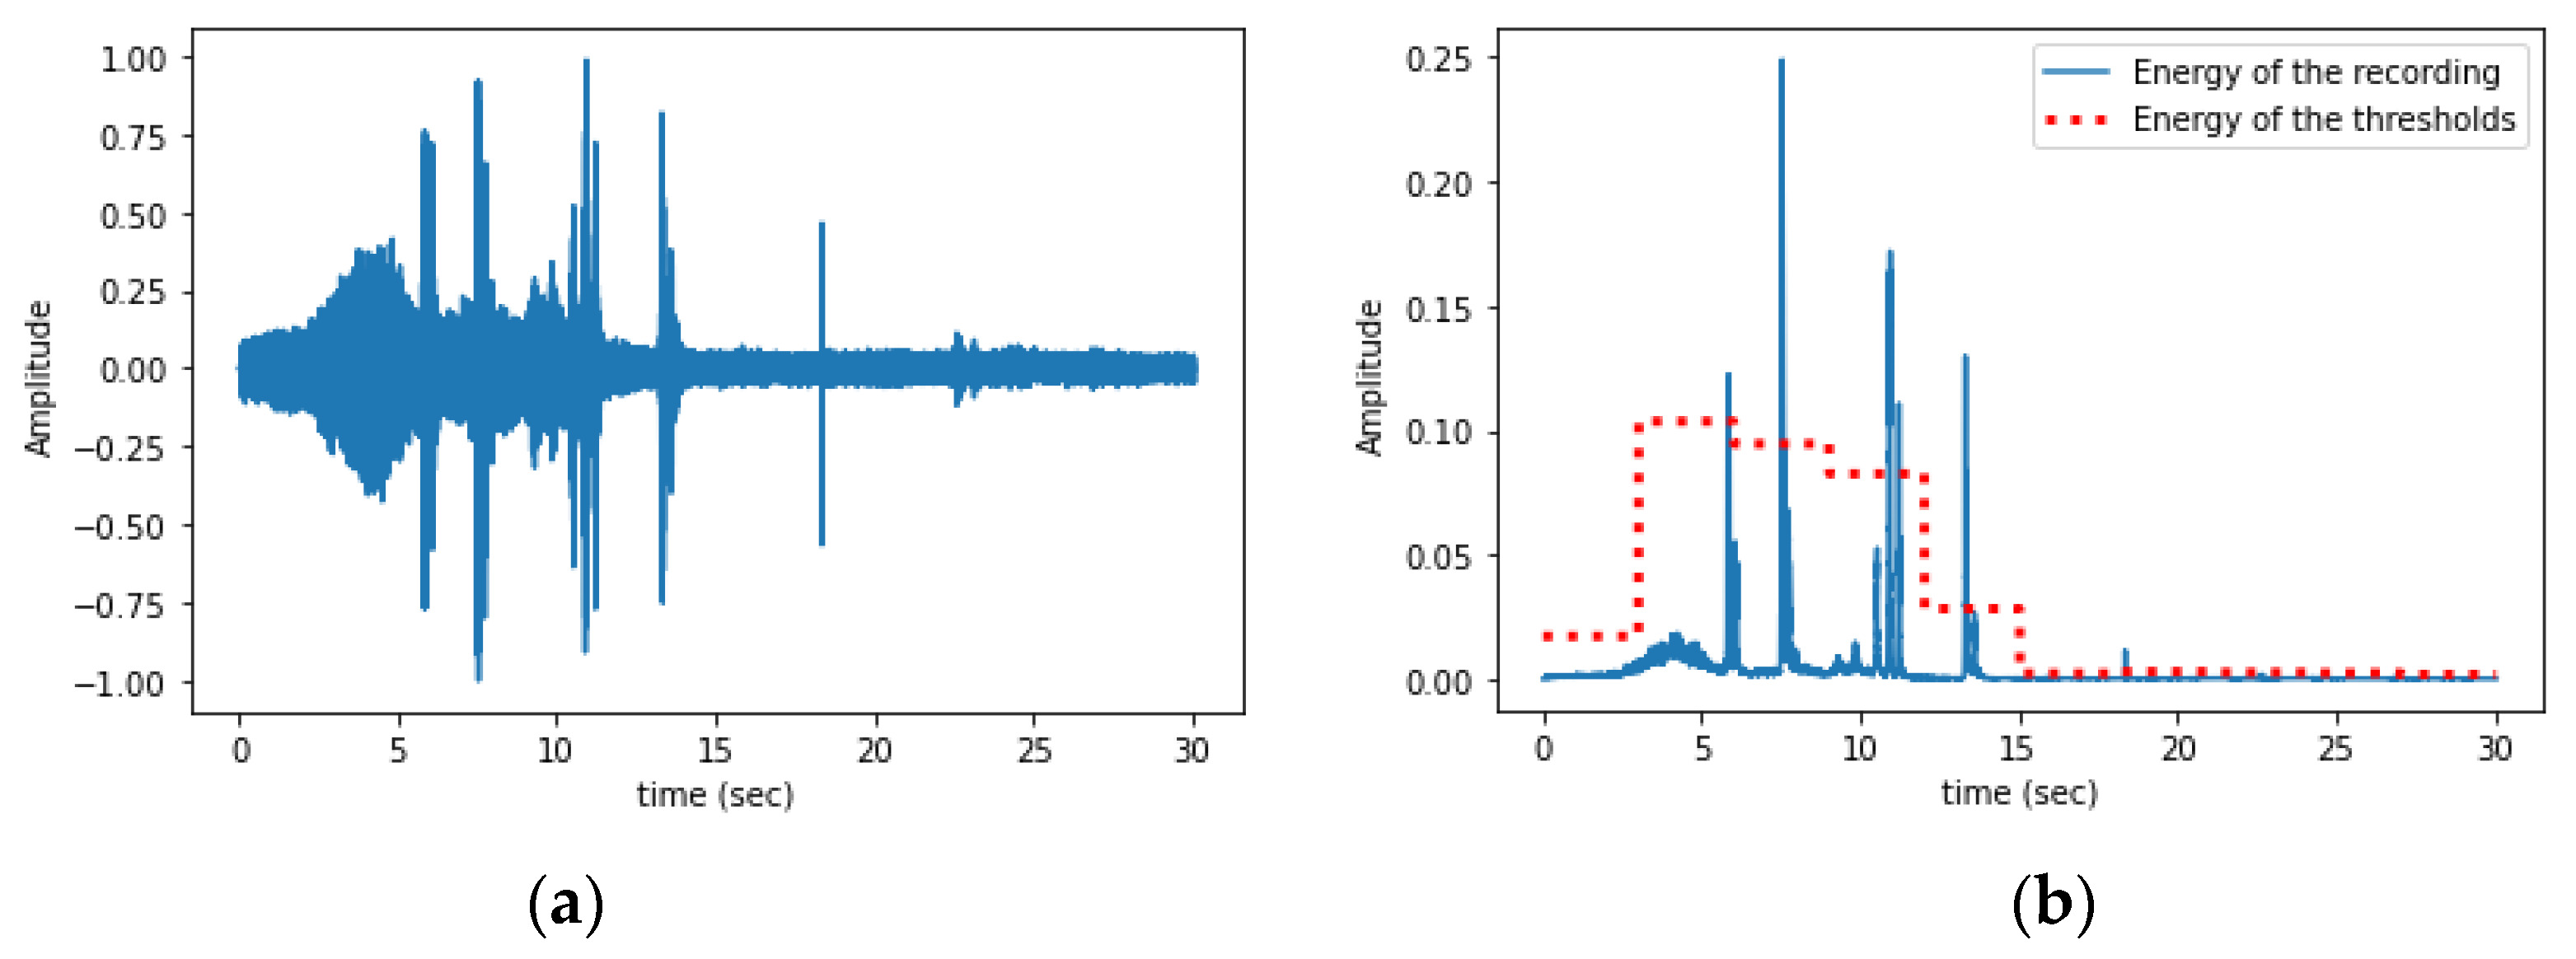
Signal Processing
H1: y[n] = x[n] + s[n],
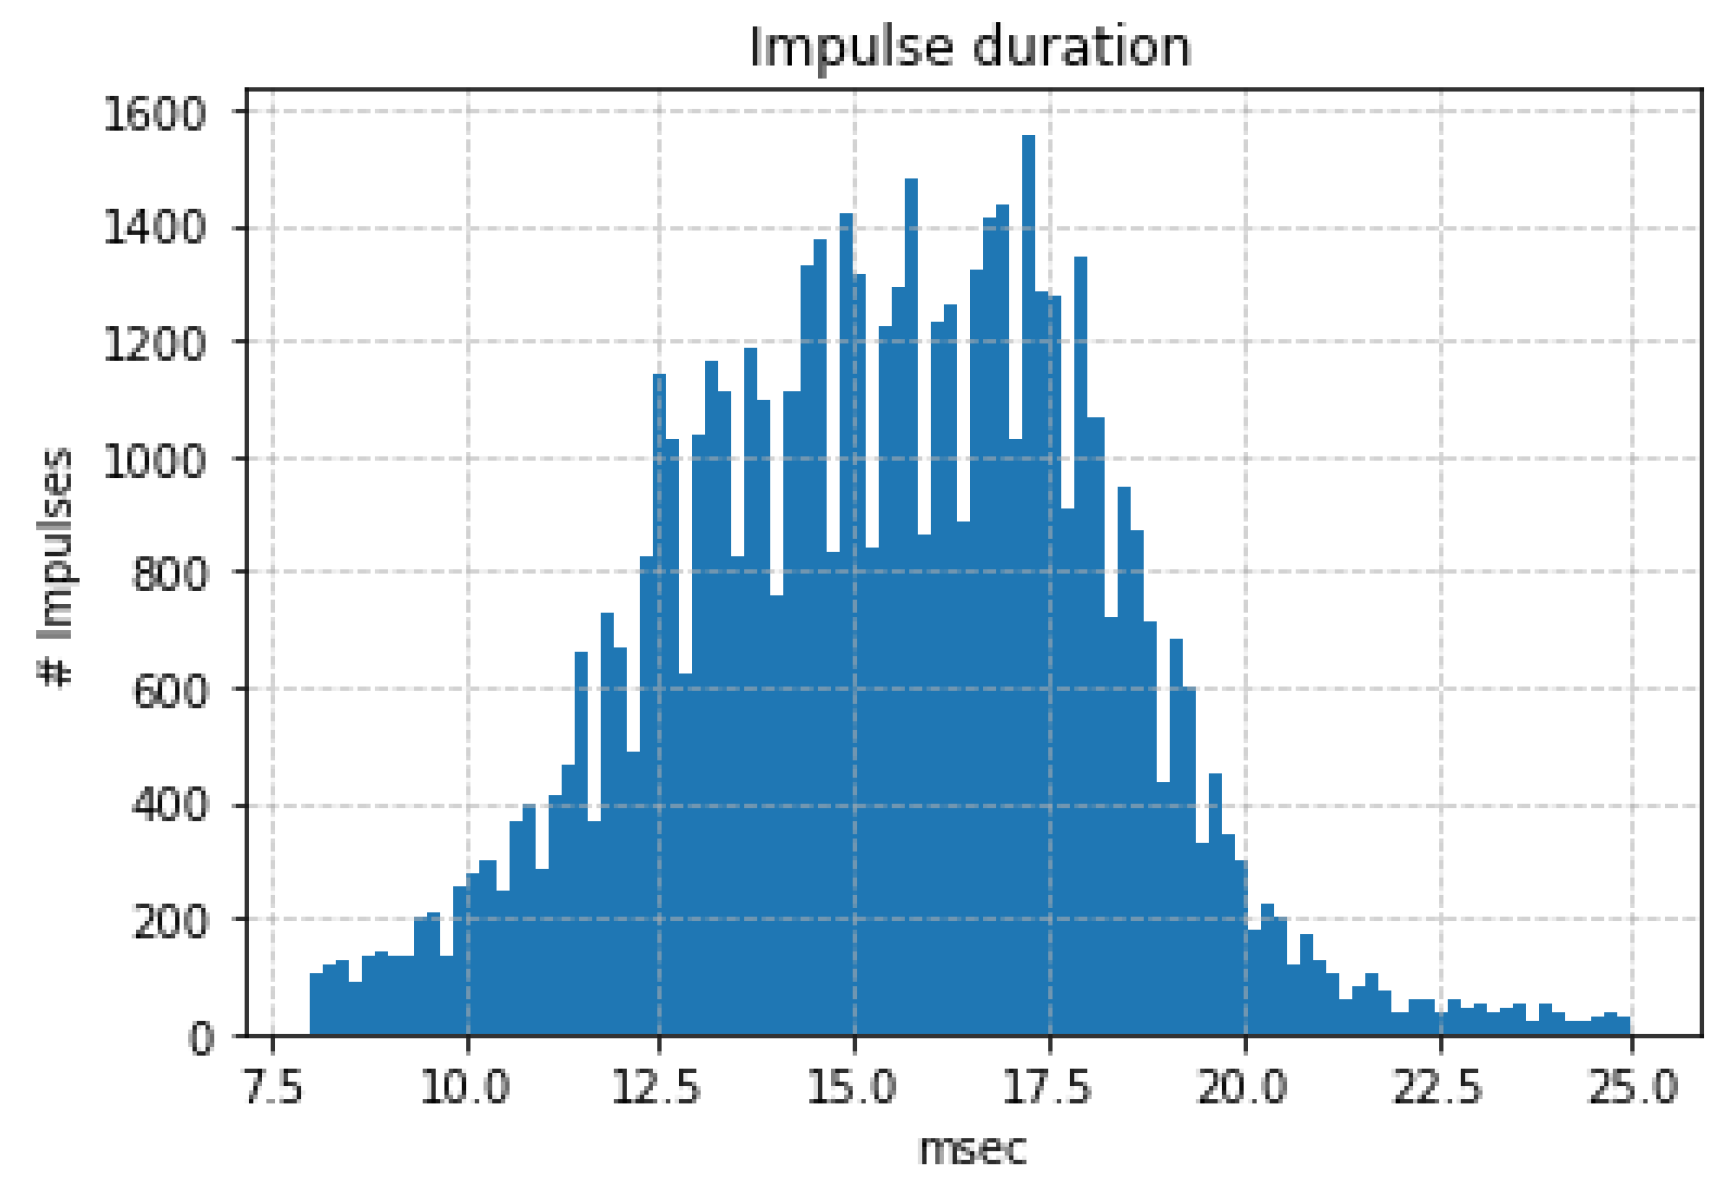
3. Results
3.1. In-Lab Experiments
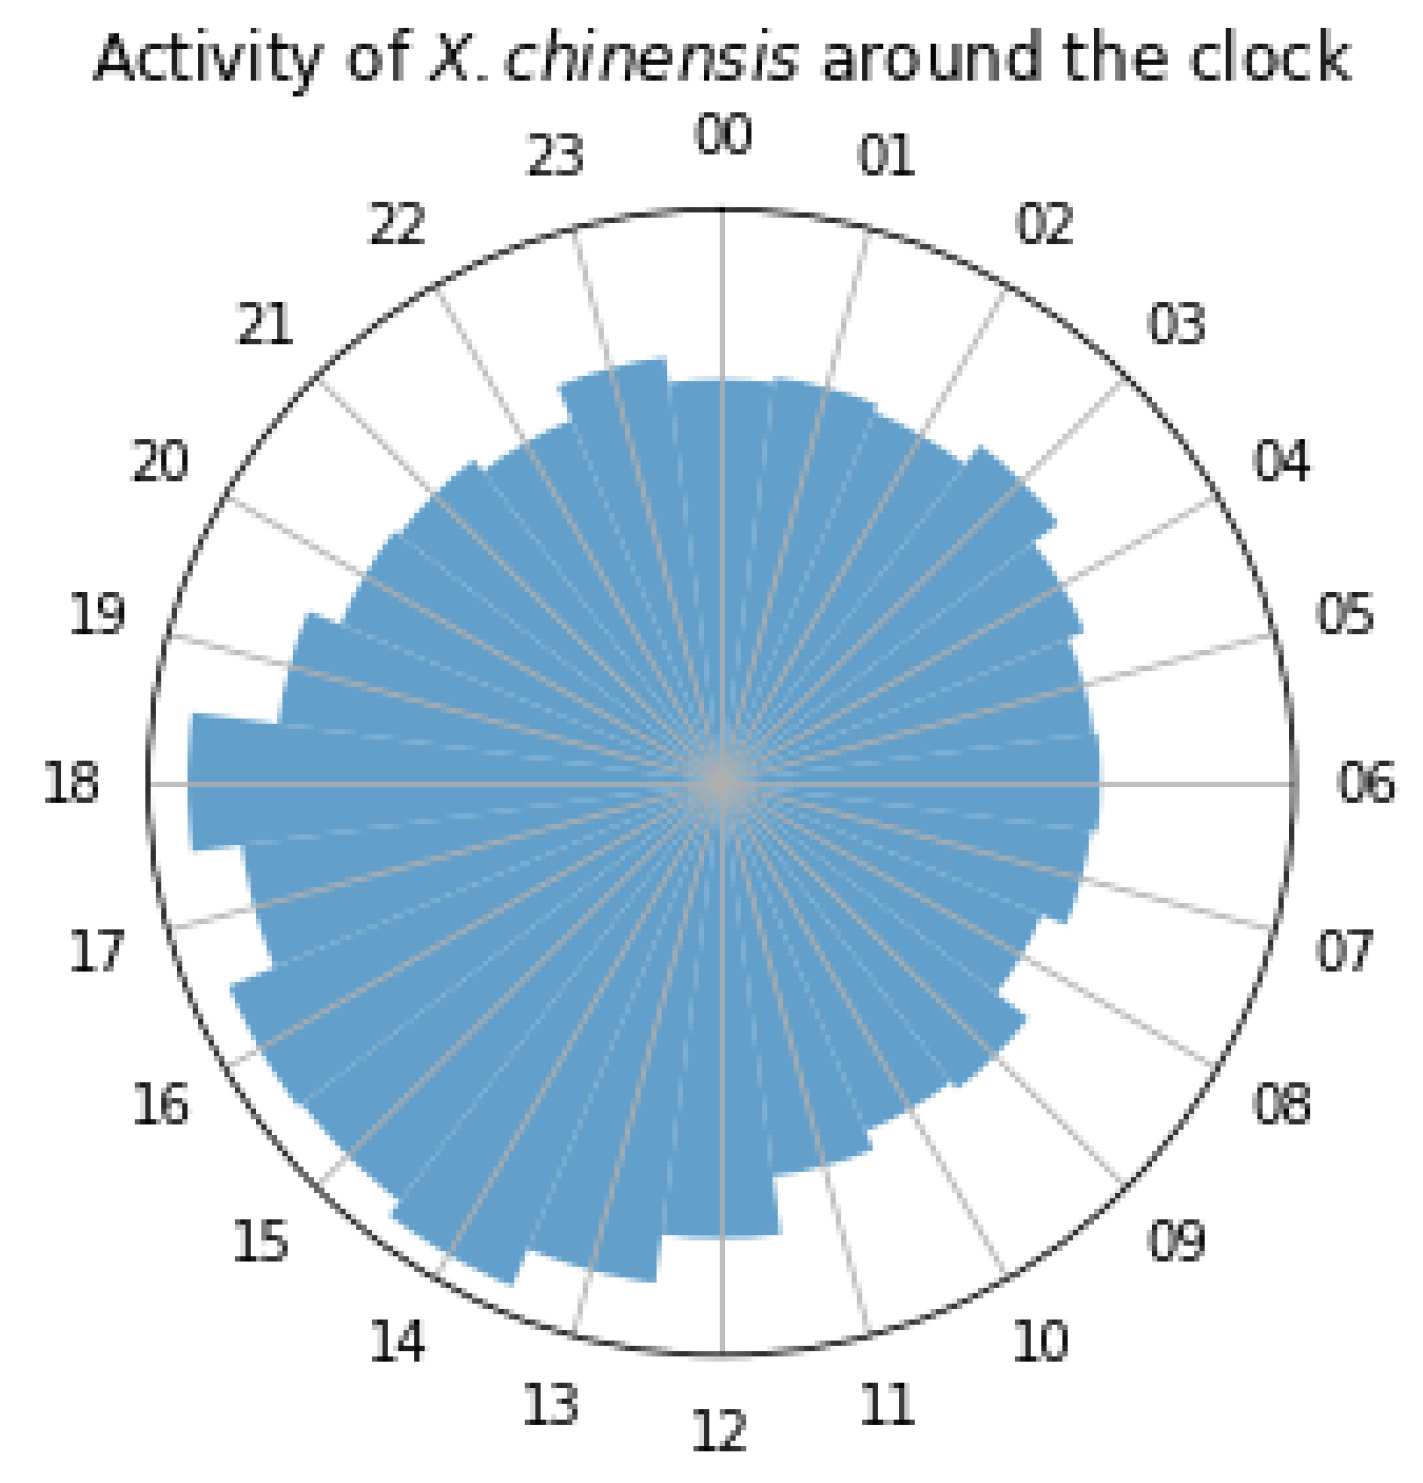
3.2. Field Experiments
4. Discussion
5. Conclusions
Author Contributions
Funding
Institutional Review Board Statement
Informed Consent Statement
Data Availability Statement
Conflicts of Interest
References
- Aukema, J.E.; Leung, B.; Kovacs, K.; Chivers, C.; Britton, K.O.; Englin, J.; Frankel, S.J.; Haight, R.G.; Holmes, T.P.; Liebhold, A.M.; et al. Economic Impacts of Non-Native Forest Insects in the Continental United States. PLoS ONE 2011, 6, e24587. [Google Scholar] [CrossRef]
- Potamitis, I. ChatGPT in the context of precision agriculture data analytics. arXiv 2023, arXiv:2311.06390. [Google Scholar]
- Sutanto, K.D.; Husain, M.; Rasool, K.G.; Mankin, R.W.; Omer, A.O.; Aldawood, A.S. Acoustic Comparisons of Red Palm Weevil (Rhynchophorus ferrugineus) Mortality in Naturally Infested Date Palms after Injection with Entomopathogenic Fungi or Nematodes, Aluminum Phosphide Fumigation, or Insecticidal Spray Treatments. Insects 2023, 14, 339. [Google Scholar] [CrossRef] [PubMed]
- Mankin, R.W.; Mizrach, A.; Hetzroni, A.; Levsky, S.; Nakache, Y.; Soroker, V. Temporal and spectral features of Sounds of wood-boring Beetle Larvae: Identifiable patterns of Activity enable improved discrimination from background noise. Fla. Entomol. 2008, 91, 241–248. [Google Scholar] [CrossRef]
- Mankin, R.W. Developments in crop insect pest detection techniques. In Advances in Monitoring of Native and Invasive Insect Pests of Crops; Fountain, M., Pope, T., Eds.; Burleigh Dodds Science Publishing: Cambridge, UK, 2023; pp. 117–146. ISBN 978-1-80146-107-8. [Google Scholar]
- Mankin, R.W.; Hagstrum, D.W.; Smith, M.T.; Roda, A.L.; Kairo, M.T. Perspective and Promise: A Century of Insect Acoustic Detection and Monitoring. Am. Entomol. 2011, 57, 30–44. [Google Scholar] [CrossRef]
- Mankin, R.W.; Smith, M.T.; Tropp, J.M.; Atkinson, E.B.; Jong, D.Y. Detection of Anoplophora glabripennis (Coleoptera: Cerambycidae) Larvae in Different Host Trees and Tissues by Automated Analyses of Sound-Impulse Frequency and Temporal Patterns. J. Econ. Entomol. 2008, 101, 838–849. [Google Scholar] [CrossRef] [PubMed]
- Potamitis, I.; Ganchev, T.; Kontodimas, D. On automatic bioacoustic detection of pests: The cases of Rhynchophorus Ferrugineus and sitophilus oryzae. J. Econ. Entomol. 2009, 102, 1681–1690. [Google Scholar] [CrossRef] [PubMed]
- Hetzroni, A.; Soroker, V.; Cohen, Y. Toward practical acoustic red palm weevil detection. Comput. Electron. Agric. 2016, 124, 100–106. [Google Scholar] [CrossRef]
- Sutin, A.; Flynn, T.; Salloum, H.; Sedunov, N.; Sinelnikov, Y.; Hull-Sanders, H. Vibro-acoustic methods of insect detection in agricultural shipments and wood packing materials. In Proceedings of the 2017 IEEE International Symposium on Technologies for Homeland Security (HST), Waltham, MA, USA, 25–26 April 2017; pp. 1–6. [Google Scholar]
- Potamitis, I.; Rigakis, I.; Tatlas, N.-A.; Potirakis, S. In-Vivo Vibroacoustic Surveillance of Trees in the Context of the IoT. Sensors 2019, 19, 1366. [Google Scholar] [CrossRef] [PubMed]
- Leivadara, E.; Leivadaras, I.; Vontas, I.; Trichas, A.; Simoglou, K.; Roditakis, E.; Avtzis, D.N. First record of Xylotrechus chinensis (Coleoptera, Cerambycidae) in Greece and in the EPPO region. Bull. OEPP/EPPO Bull. 2018, 48, 277–280. [Google Scholar] [CrossRef]
- Sarto i Monteys, V.; Torras i Tutusaus, G. A New Alien Invasive Longhorn Beetle, Xylotrechus chinensis (Cerambycidae), Is Infesting Mulberries in Catalonia (Spain). Insects 2018, 9, 52. [Google Scholar] [CrossRef] [PubMed]
- Rigakis, I.; Potamitis, I.; Tatlas, N.A.; Potirakis, S.M.; Ntalampiras, S. TreeVibes: Modern Tools for Global Monitoring of Trees for Borers. Smart Cities 2021, 4, 271–285. [Google Scholar] [CrossRef]
- Zhang, H.; Li, J.; Cai, G.; Chen, Z.; Zhang, H. A CNN-Based Method for Enhancing Boring Vibration with Time-Domain Convolution-Augmented Transformer. Insects 2023, 14, 631. [Google Scholar] [CrossRef] [PubMed]
- Shi, H.; Chen, Z.; Zhang, H.; Li, J.; Liu, X.; Ren, L.; Luo, Y. Enhancement of Boring Vibrations Based on Cascaded Dual-Domain Features Extraction for Insect Pest Agrilus planipennis Monitoring. Forests 2023, 14, 902. [Google Scholar] [CrossRef]
- Ghani, B.; Denton, T.; Kahl, S.; Klinck, H. Global birdsong embeddings enable superior transfer learning for bioacoustic classification. Sci. Rep. 2023, 13, 22876. [Google Scholar] [CrossRef] [PubMed]
- Sutanto, K.D.; Al-Shahwan, I.M.; Husain, M.; Rasool, K.G.; Mankin, R.W.; Aldawood, A.S. Field Evaluation of Promising Indigenous Entomopathogenic Fungal Isolates against Red Palm Weevil, Rhynchophorus ferrugineus (Coleoptera: Dryophthoridae). J. Fungi 2023, 9, 68. [Google Scholar] [CrossRef] [PubMed]
- Boulila, W.; Alzahem, A.; Koubaa, A.; Benjdira, B.; Ammar, A. Early detection of red palm weevil infestations using deep learning classification of acoustic signals. Comput. Electron. Agric. 2023, 212, 108154. [Google Scholar] [CrossRef]
- Maruthadurai, R.; Veerakumar, T.; Veershetty, C.; Chakaravarthi, A.S. Acoustic detection of stem and root borer Neoplocaederus ferrugineus (Coleoptera: Cerambycidae) in cashew. J. Asia-Pac. Entomol. 2022, 25, 101968. [Google Scholar] [CrossRef]

| Approach | MAE | RMSE | Parameters |
|---|---|---|---|
| Reject noisy recs, evaluate on all recs | 1.07 | 2.00 | θ1 > 185, α = 7 (Equations (3) and (4)) |
| Do not reject recs, evaluate on all recs | 1.71 | 4.93 | α = 10 |
| Evaluate only accepted recs | 1.01 | 1.91 | θ1 > 185, α = 7 (Equations (3) and (4)) |
| Precision | Recall | F1-Score | Support | |
|---|---|---|---|---|
| No pulses | 0.68 | 0.83 | 0.75 | 236 |
| Pulses | 0.84 | 0.69 | 0.76 | 296 |
| accuracy | 0.75 | 532 | ||
| Macro avg | 0.76 | 0.76 | 0.75 | 532 |
| Micro avg | 0.77 | 0.75 | 0.75 | 532 |
Disclaimer/Publisher’s Note: The statements, opinions and data contained in all publications are solely those of the individual author(s) and contributor(s) and not of MDPI and/or the editor(s). MDPI and/or the editor(s) disclaim responsibility for any injury to people or property resulting from any ideas, methods, instructions or products referred to in the content. |
© 2024 by the authors. Licensee MDPI, Basel, Switzerland. This article is an open access article distributed under the terms and conditions of the Creative Commons Attribution (CC BY) license (https://creativecommons.org/licenses/by/4.0/).
Share and Cite
Potamitis, I.; Rigakis, I. Automated Vibroacoustic Monitoring of Trees for Borer Infestation. Sensors 2024, 24, 3074. https://doi.org/10.3390/s24103074
Potamitis I, Rigakis I. Automated Vibroacoustic Monitoring of Trees for Borer Infestation. Sensors. 2024; 24(10):3074. https://doi.org/10.3390/s24103074
Chicago/Turabian StylePotamitis, Ilyas, and Iraklis Rigakis. 2024. "Automated Vibroacoustic Monitoring of Trees for Borer Infestation" Sensors 24, no. 10: 3074. https://doi.org/10.3390/s24103074
APA StylePotamitis, I., & Rigakis, I. (2024). Automated Vibroacoustic Monitoring of Trees for Borer Infestation. Sensors, 24(10), 3074. https://doi.org/10.3390/s24103074