
A Collaborative Merging Method for Connected and Automated Vehicle Platoons in a Freeway Merging Area with Considerations for Safety and Efficiency


Abstract
:1. Introduction
- (i).
- According to the actual distribution of the main road gaps, an appropriate split strategy for the ramp CAV platoon is selected, so that the CAV platoon can complete the merging process safely and efficiently in the form of several sub-platoons. It can make full use of the gap space of the main road under different traffic conditions, especially with heavy traffic, while retaining the advantage of CAV platoon driving, improving the safety and efficiency of ramp vehicles, and reducing interference with the normal flow of the main road vehicles.
- (ii).
- The PSCM method proposed in this study does not require the active coordination of main road vehicles in terms of velocity, that is, there is no mandatory requirement for the ratio of CAVs in the main road traffic flow. Therefore, the PSCM method is suitable for the scenario of a highway confluence area where the intellectualization degree of the CAV needs to be improved and the main road penetration is not high.
2. Methods
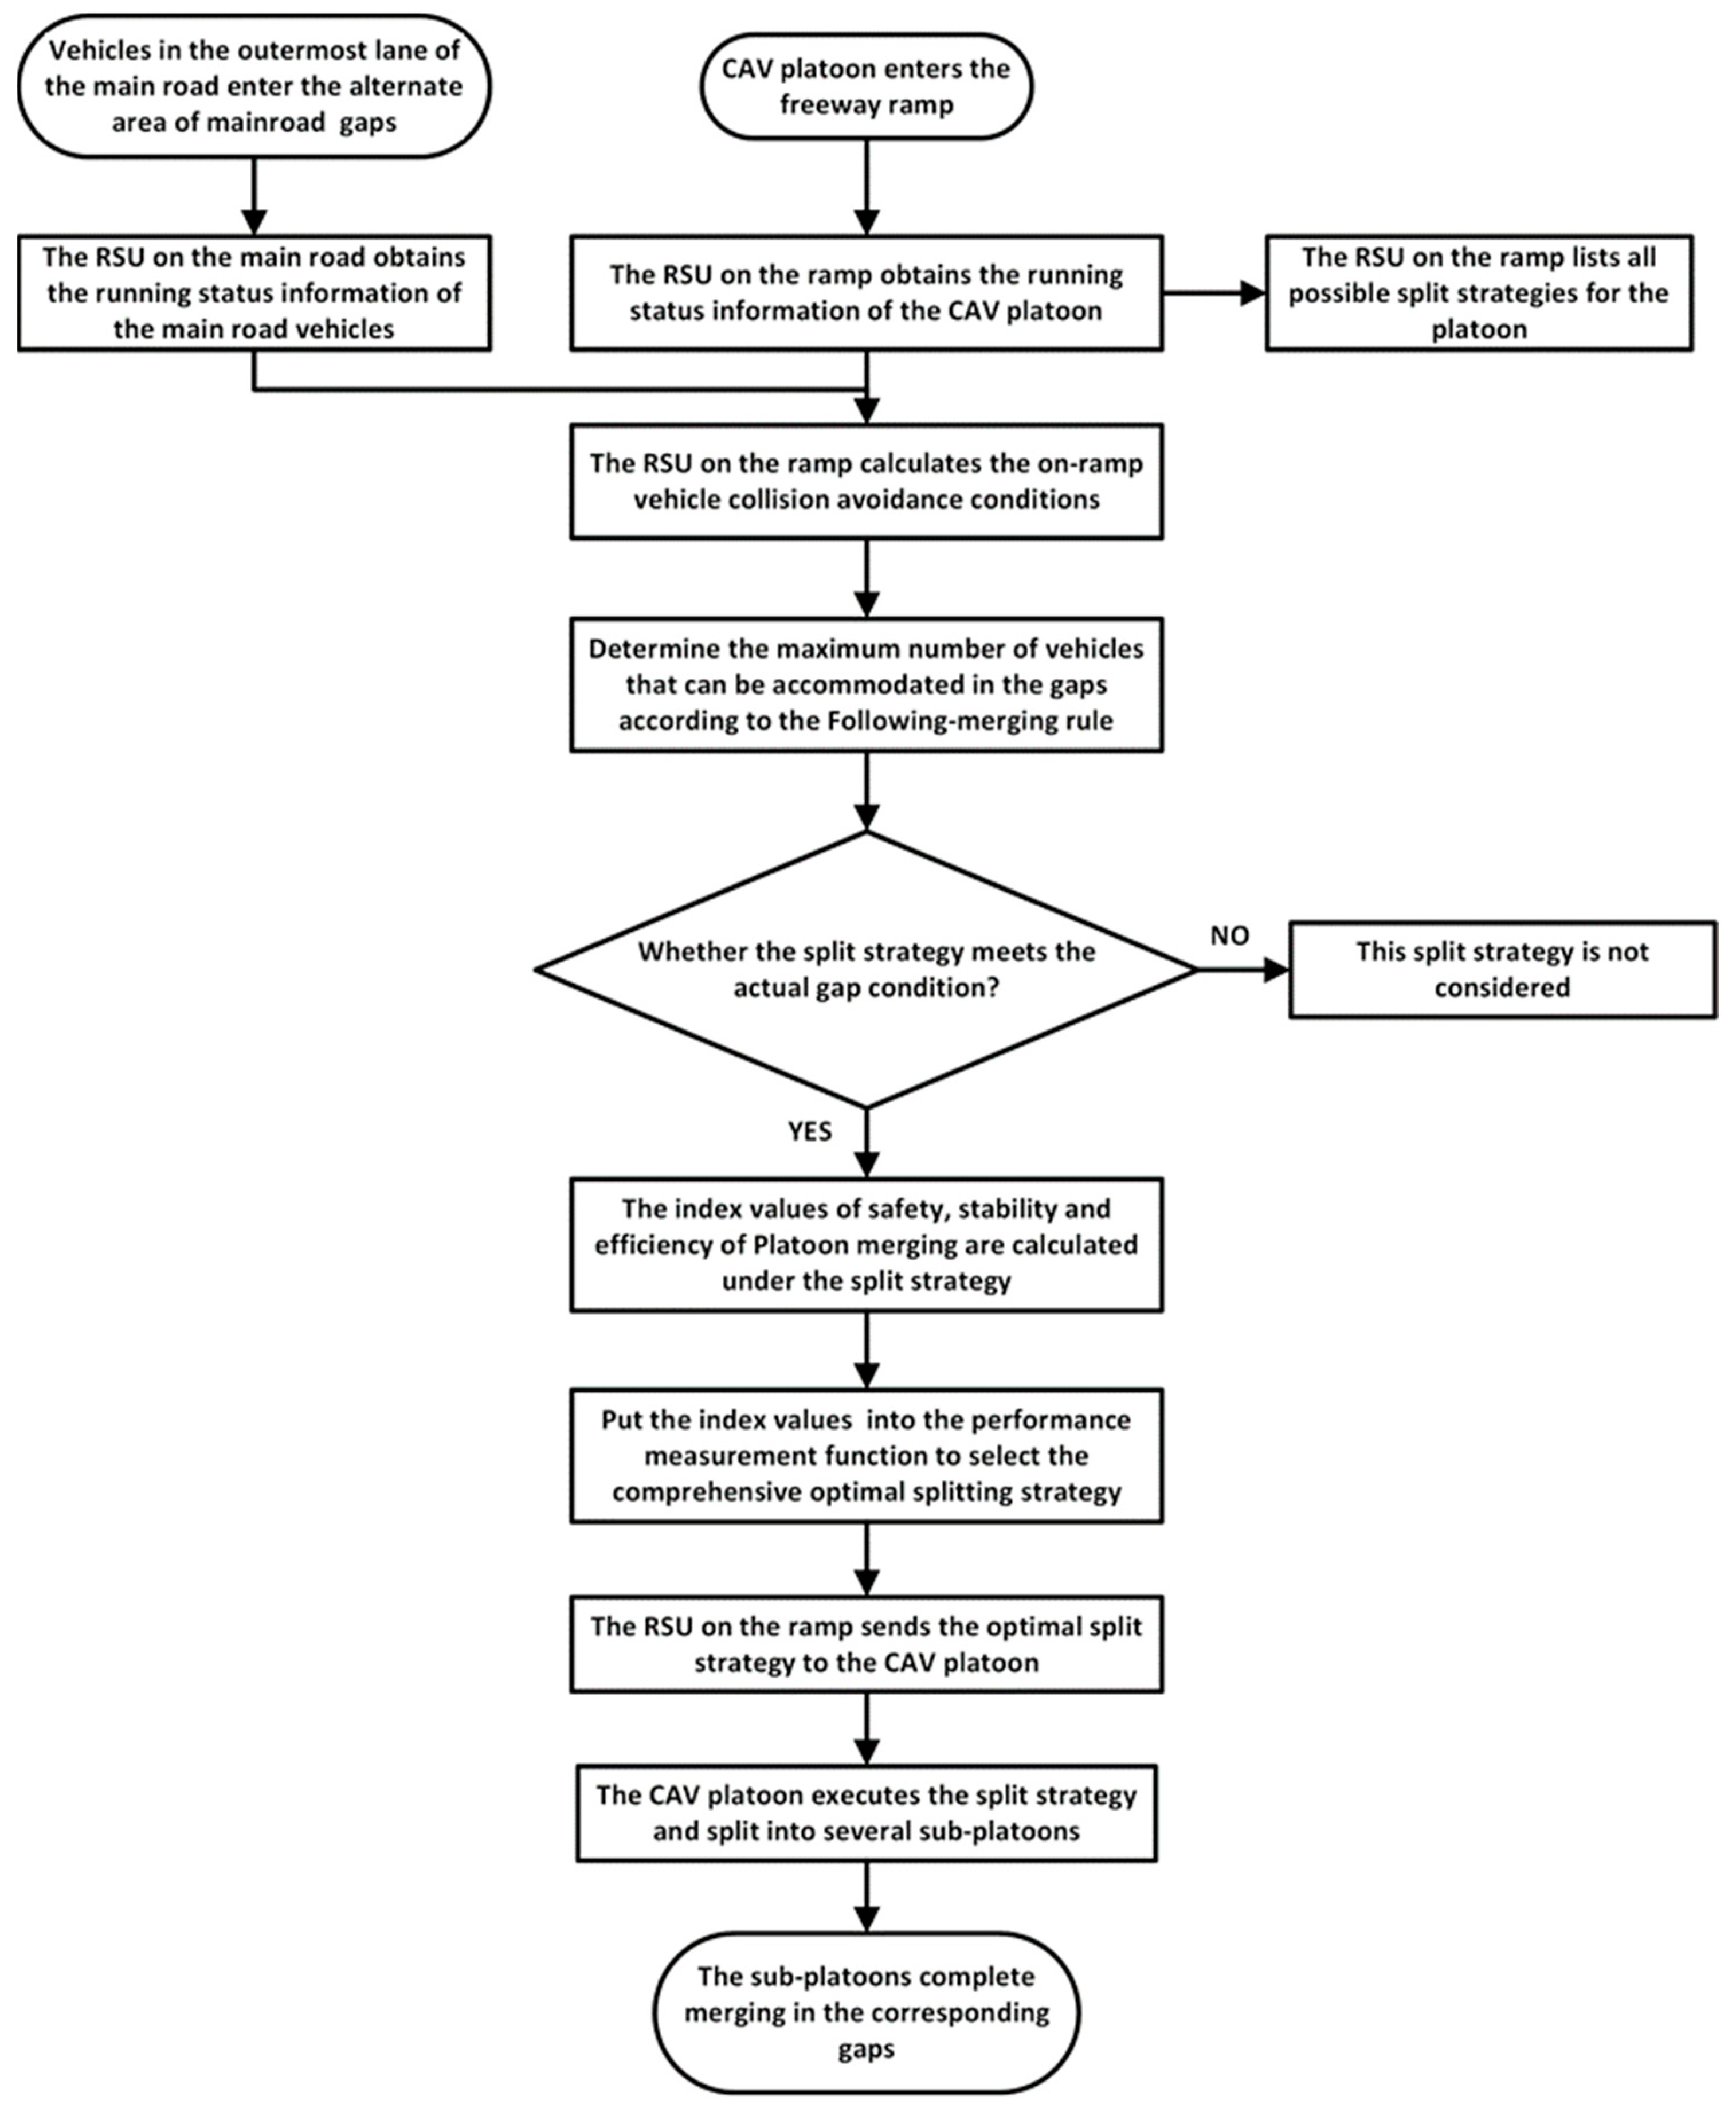
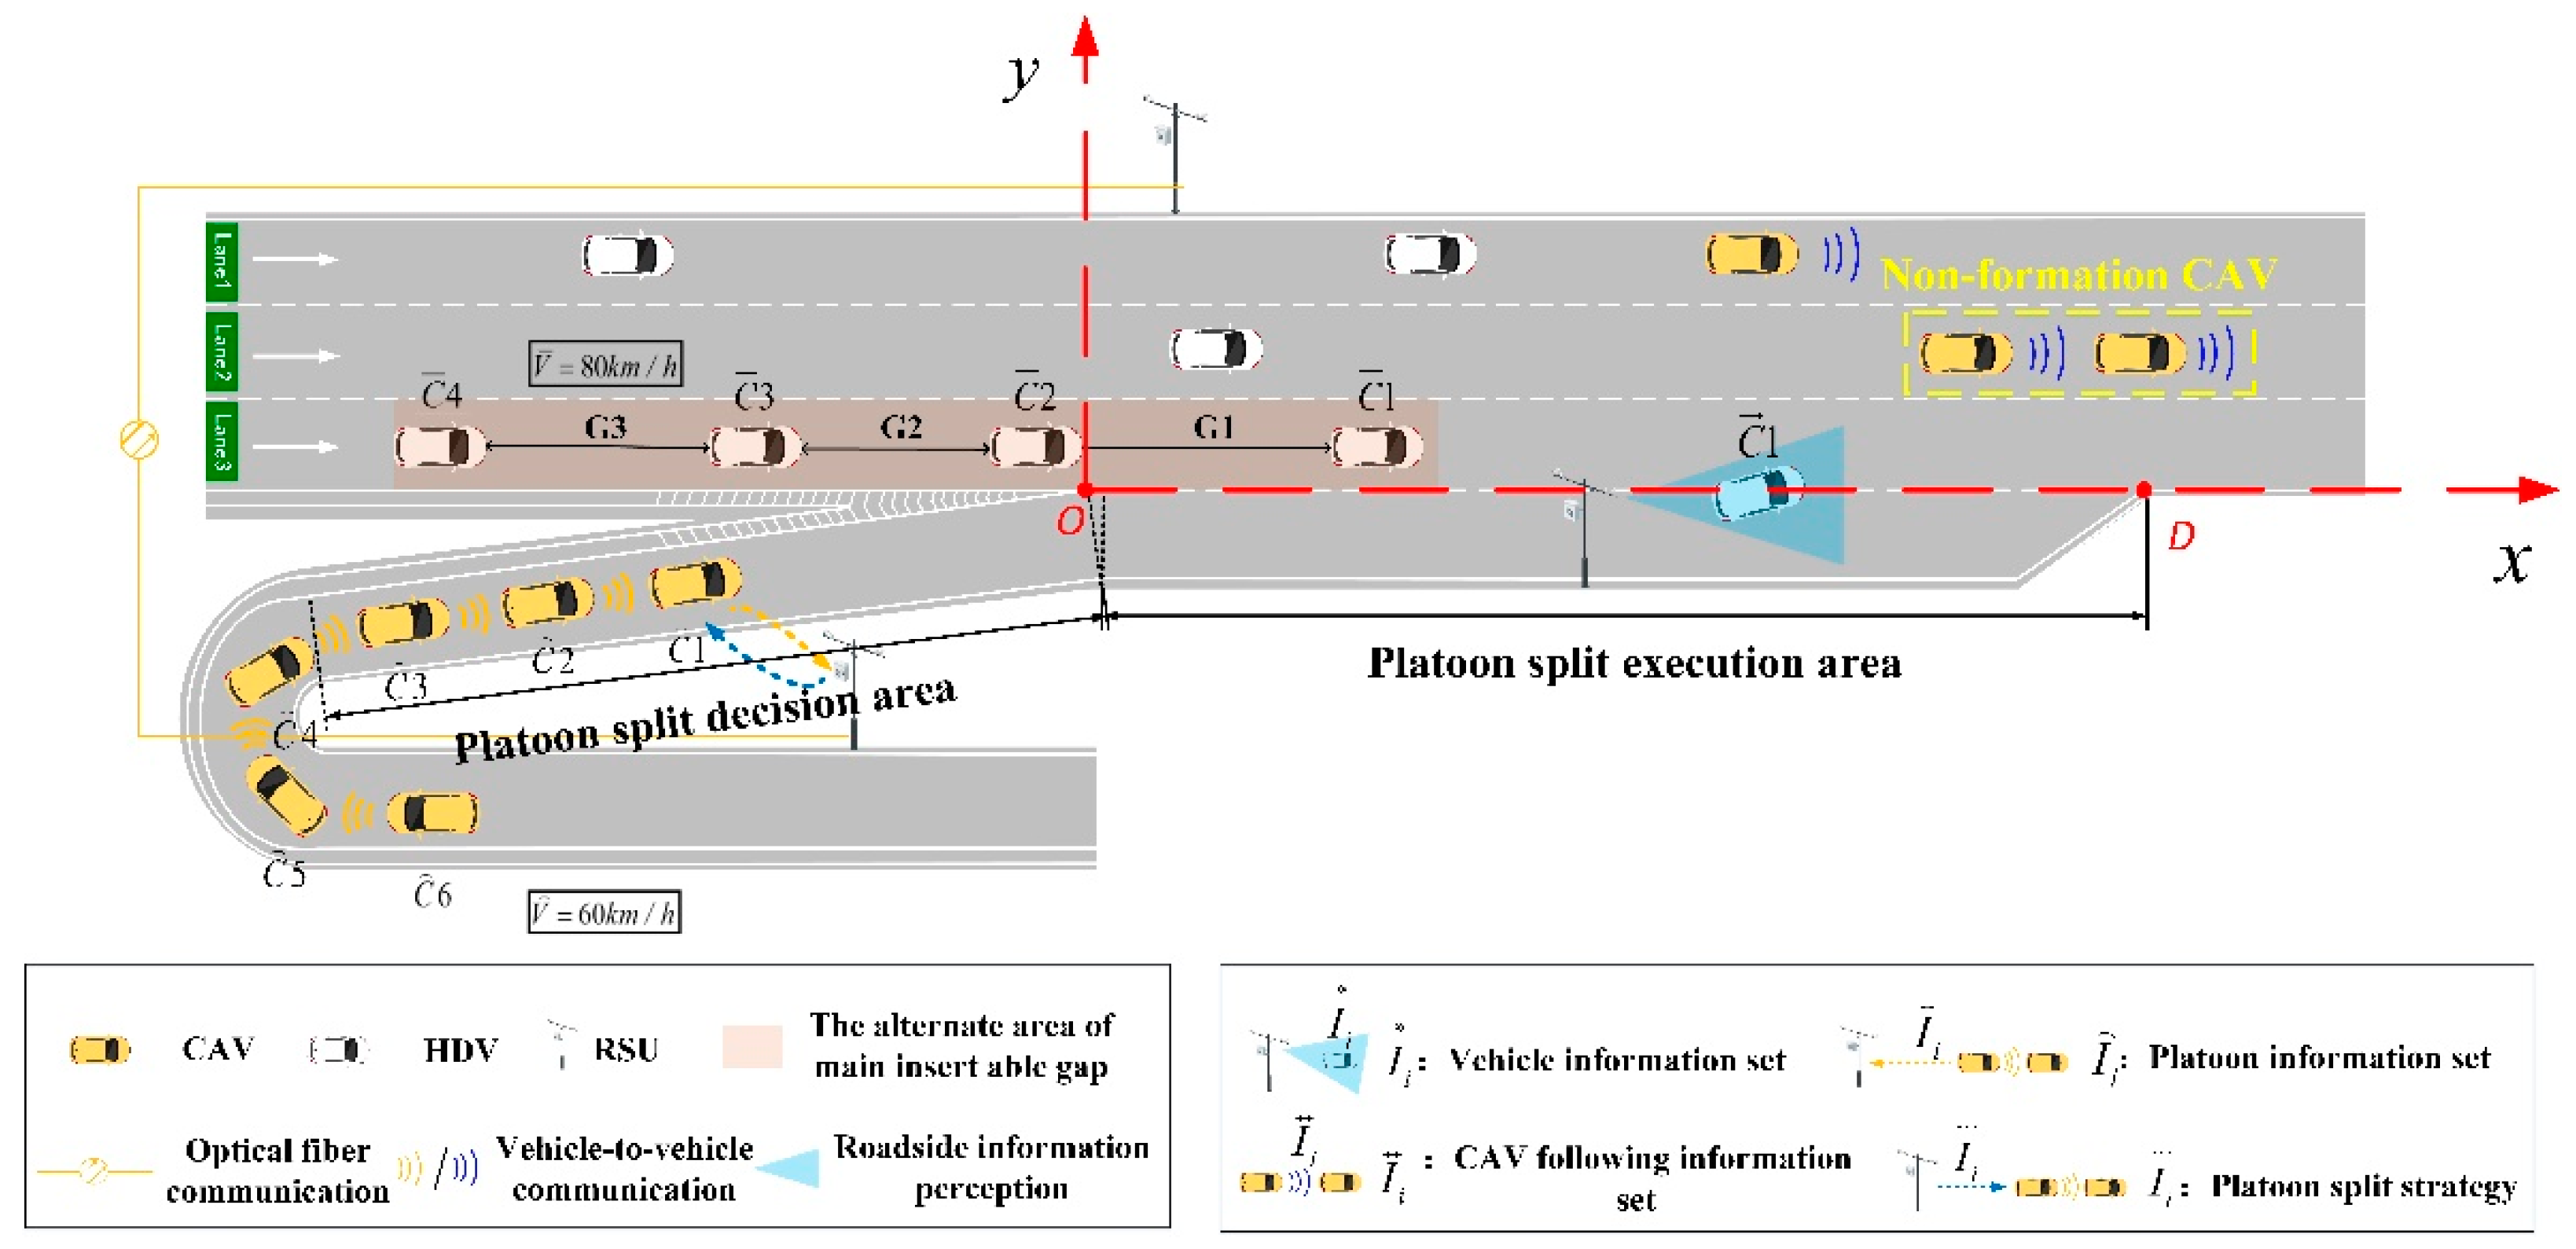
2.1. An Overview
2.2. Merging Vehicle Motion Control
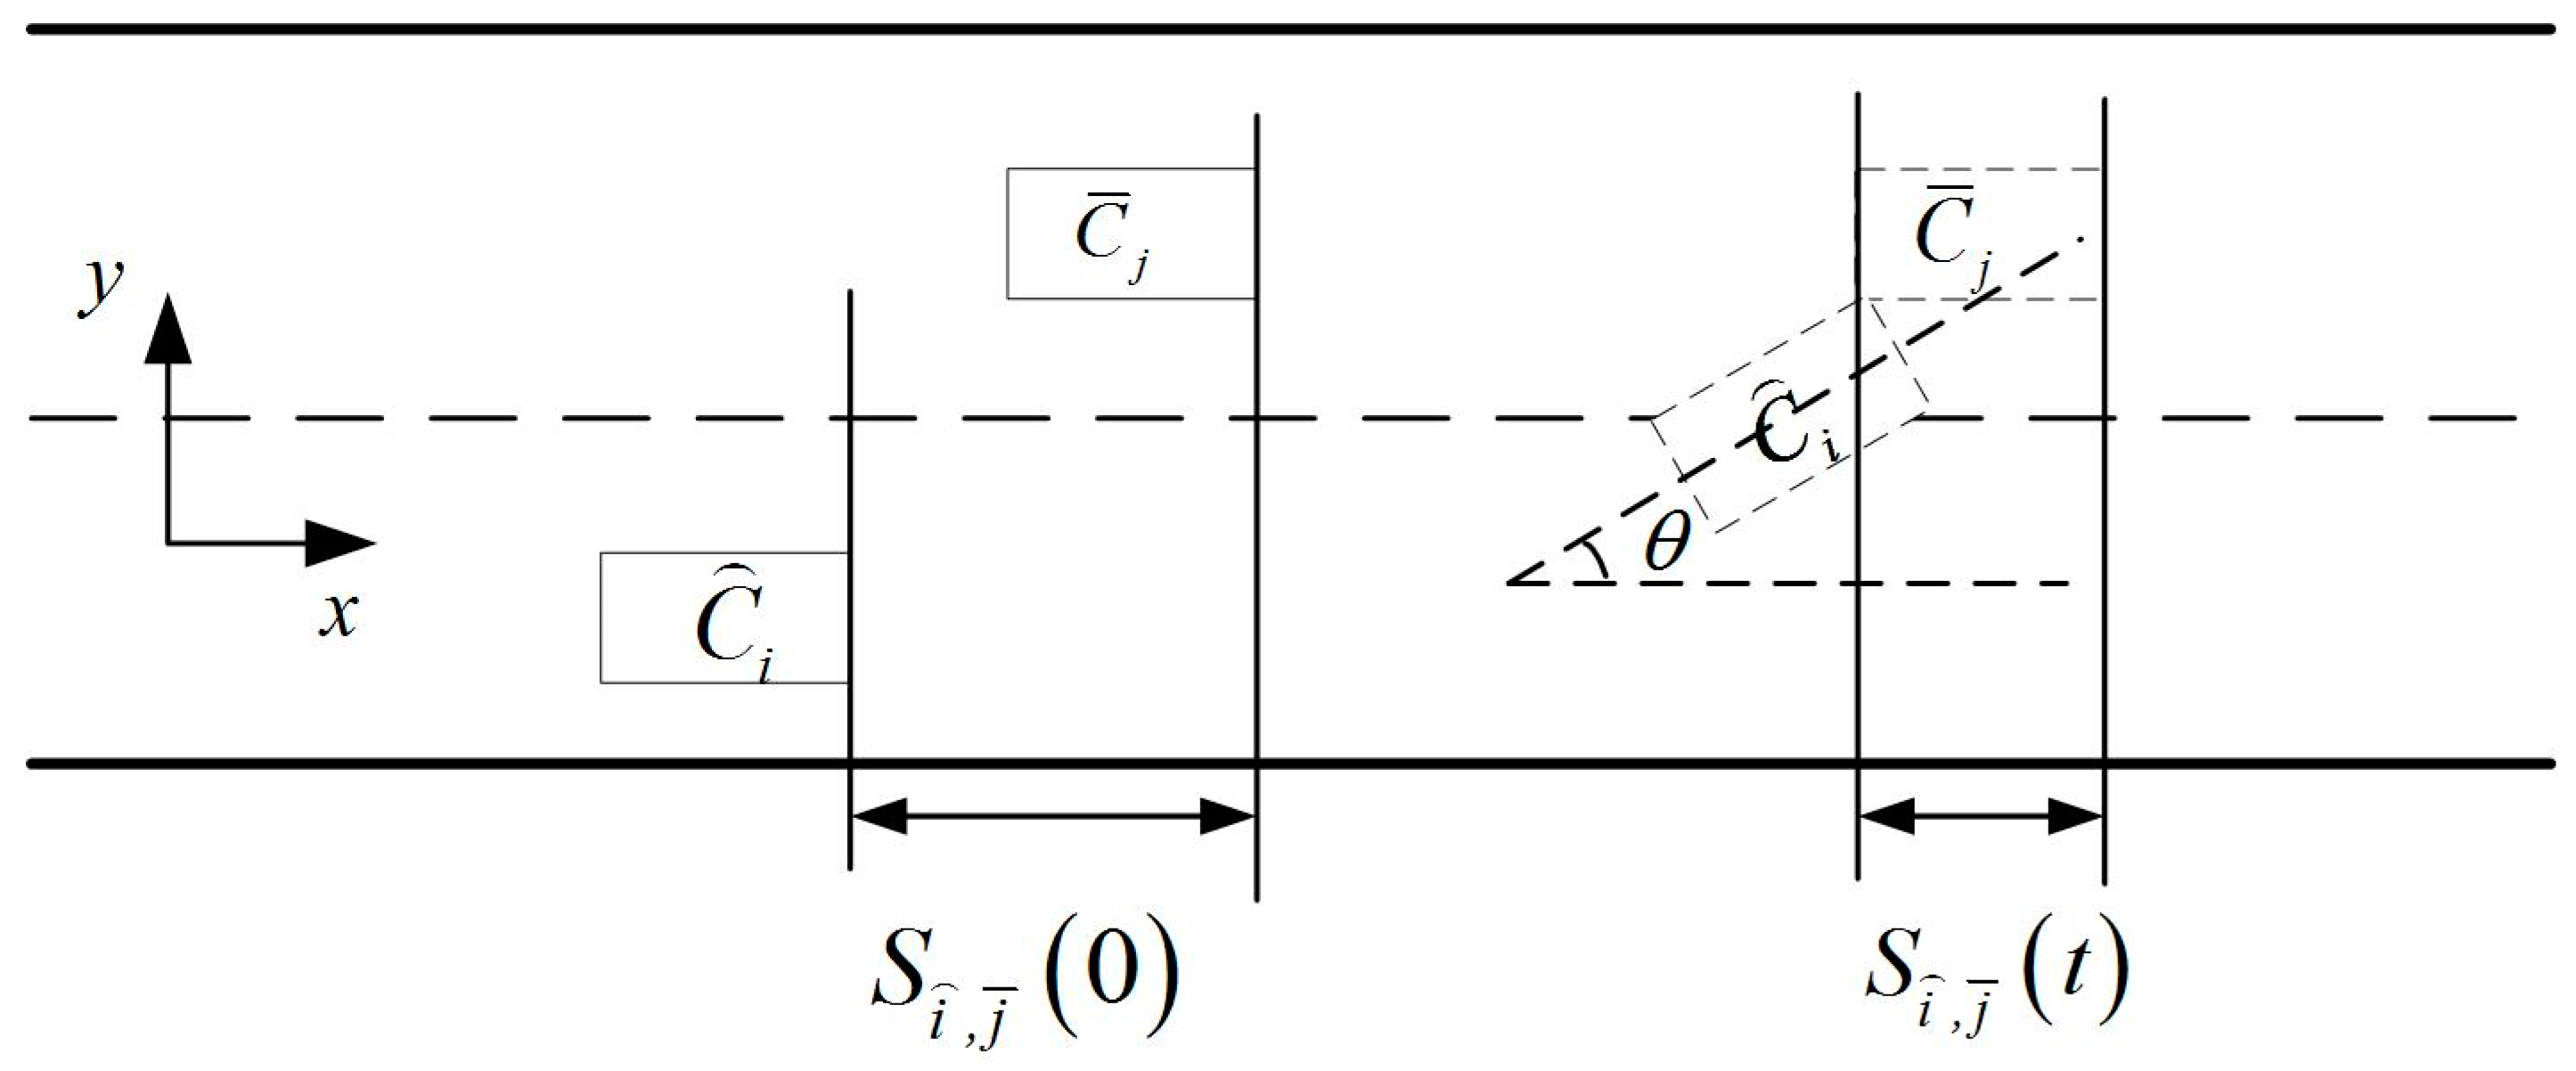
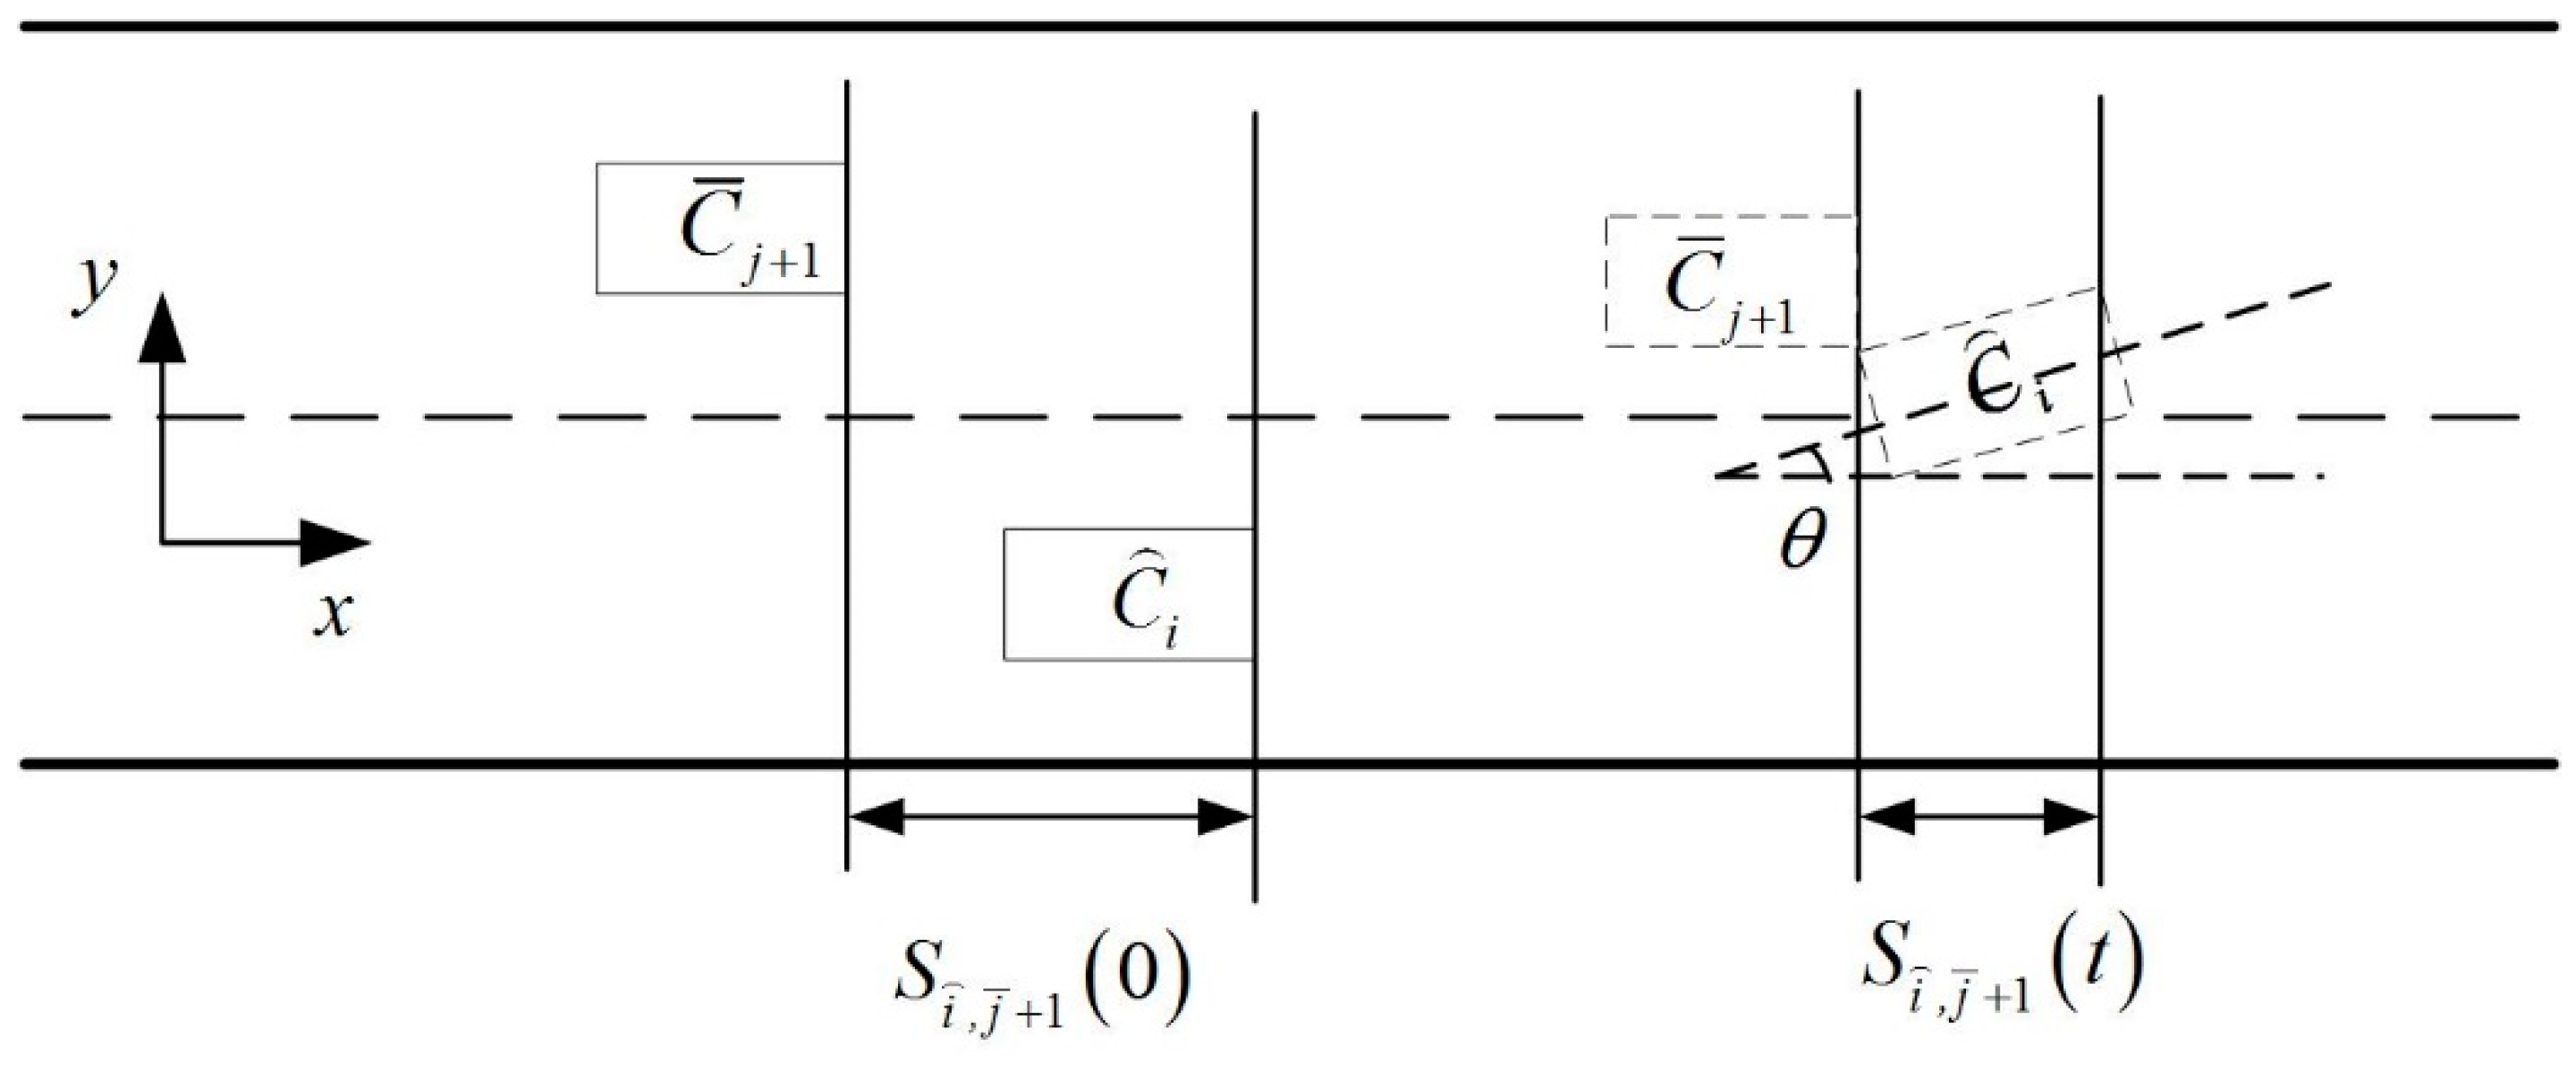
2.2.1. Collision Avoidance Conditions
2.2.2. Following–Merging Rule
- (1)
- Following model
- (2)
- Longitudinal adjustment
2.3. Constraint Condition Statement
2.3.1. Feasibility Analysis
2.3.2. Stability Analysis
2.3.3. Safety Analysis
2.3.4. Efficiency Analysis
2.3.5. Performance Measurement
3. Experiment Design
- (i).
- IDM: The expected acceleration and deceleration of the HDVs are 5 and −5 , respectively, with a time headway of 1.8 s and minimum parking distance of 5 m.
- (ii).
- ACC model: The related parameters are set as , and .
- (iii).
- CACC model [35]: The related parameters are set as, , and .
- (i).
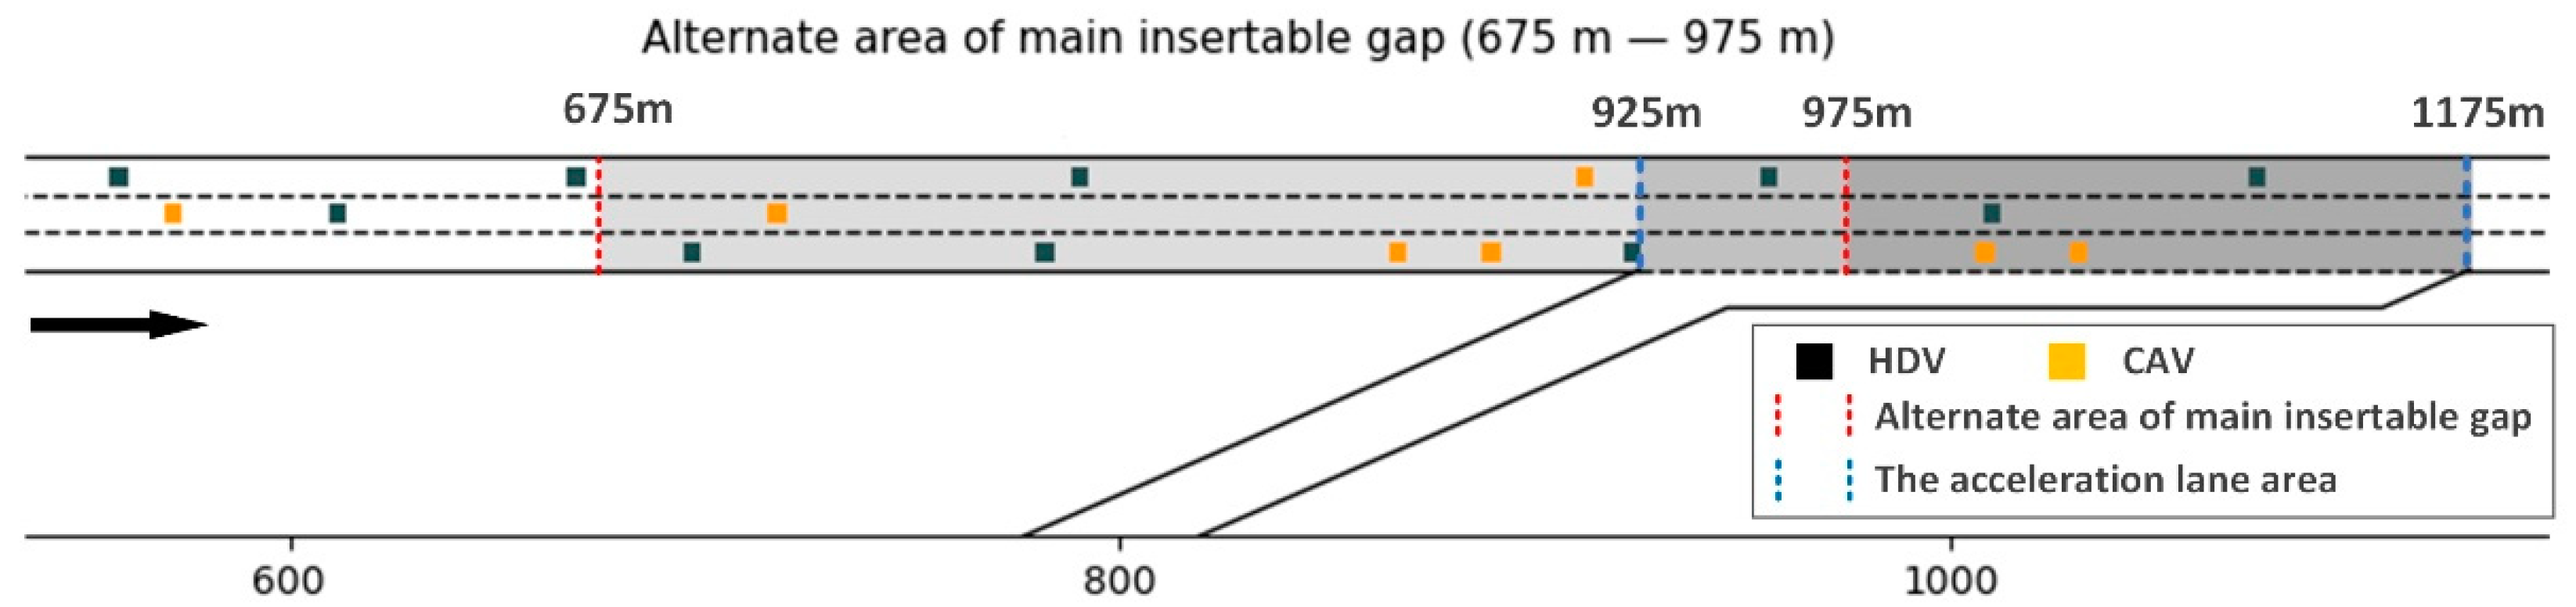
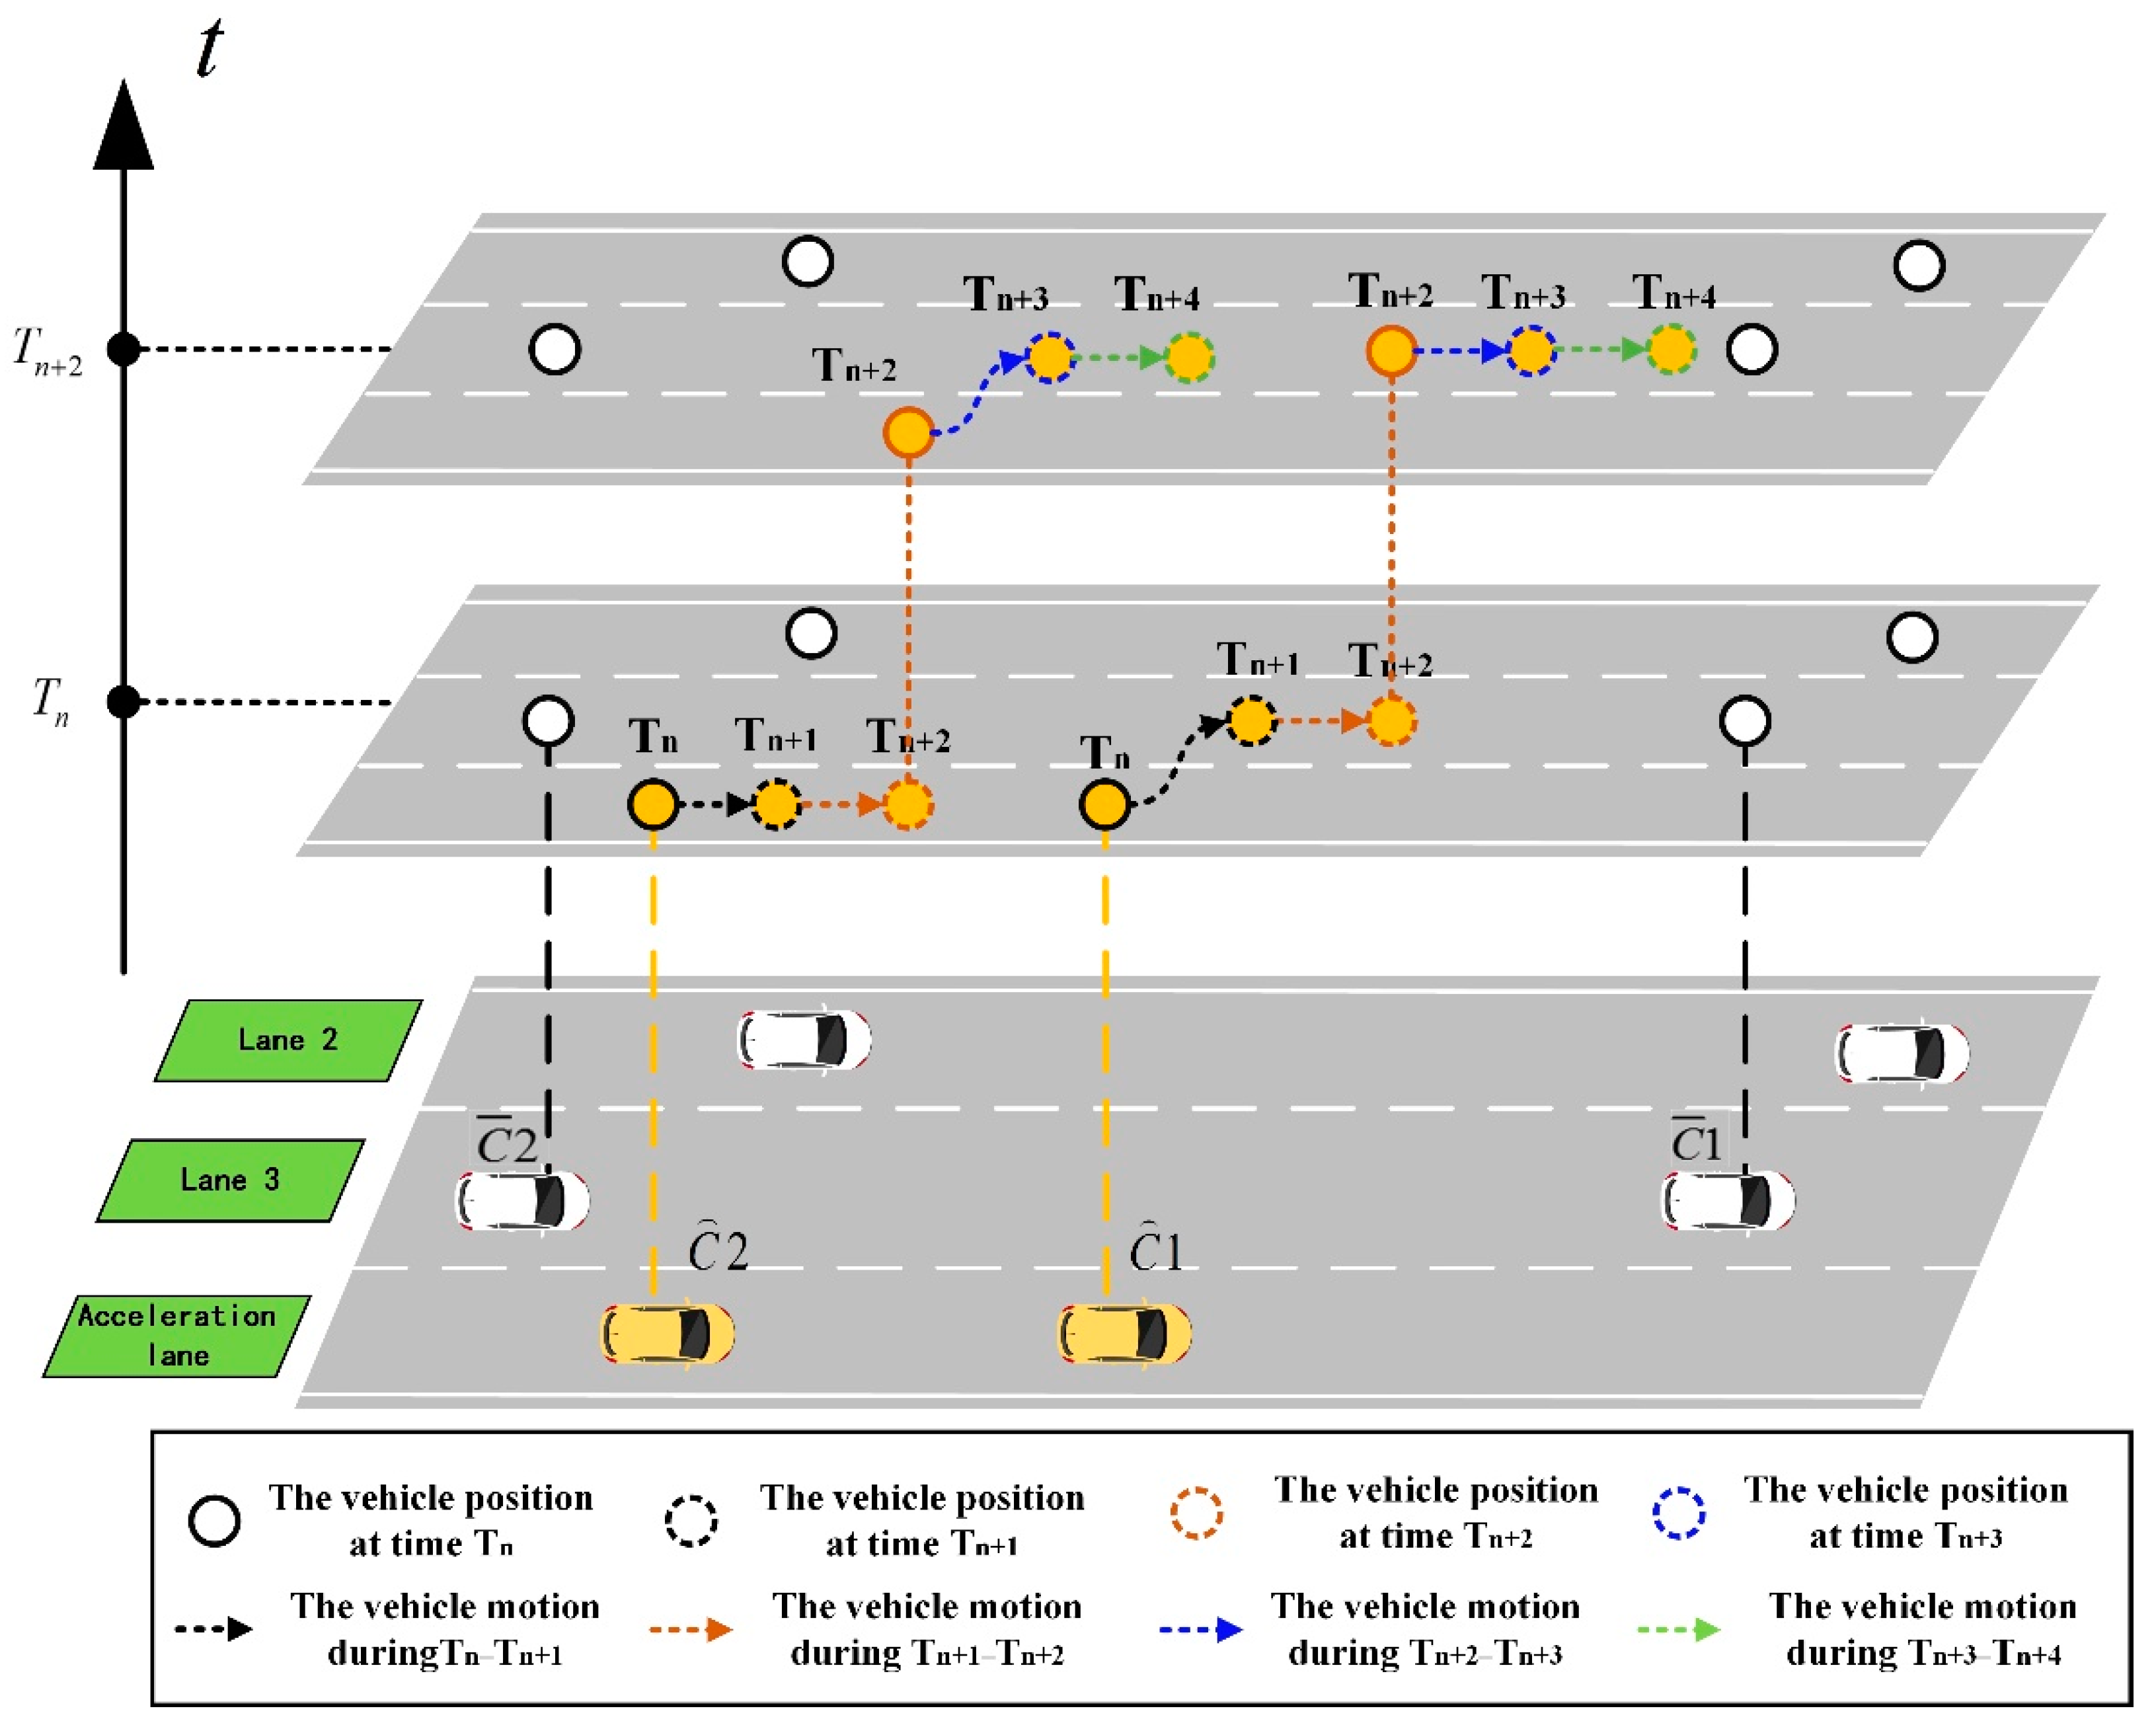
- In the single-vehicle merging scenario, a platoon composed of four CAVs approaches the starting point of the acceleration lane on the on-ramp and is going to merge into the mainline traffic flow. During this period, no collaborative control at the platoon level is carried out. Instead, it is regarded as four independent CAVs. RSUs analyze collision avoidance conditions and determine the acceptable gap according to the state of the mainline vehicles. Finally, a suitable driving strategy is formulated to complete the merging process. During this process, the vehicle behind the platoon that has not completed merging will regard the vehicle in front as an obstacle vehicle.
- (ii).
- In the platoon split merging scenario proposed in this study, a platoon composed of four CAVs can cooperate with the RSUs before entering the acceleration lane to complete the platoon split in advance according to the gap state of the mainline and the driving state of the platoon itself. It is worth noting that the meaning of platoon split at this time focuses on the differences in vehicle control logic in the platoon, rather than the separation of spatial distance between vehicles. After splitting, several small-scale sub-platoons are formed. Each sub-platoon corresponds to an acceptable mainline gap and a set of merging driving control schemes. Each vehicle in the sub-platoon executes in turn to complete the merging process.
4. Results Analysis
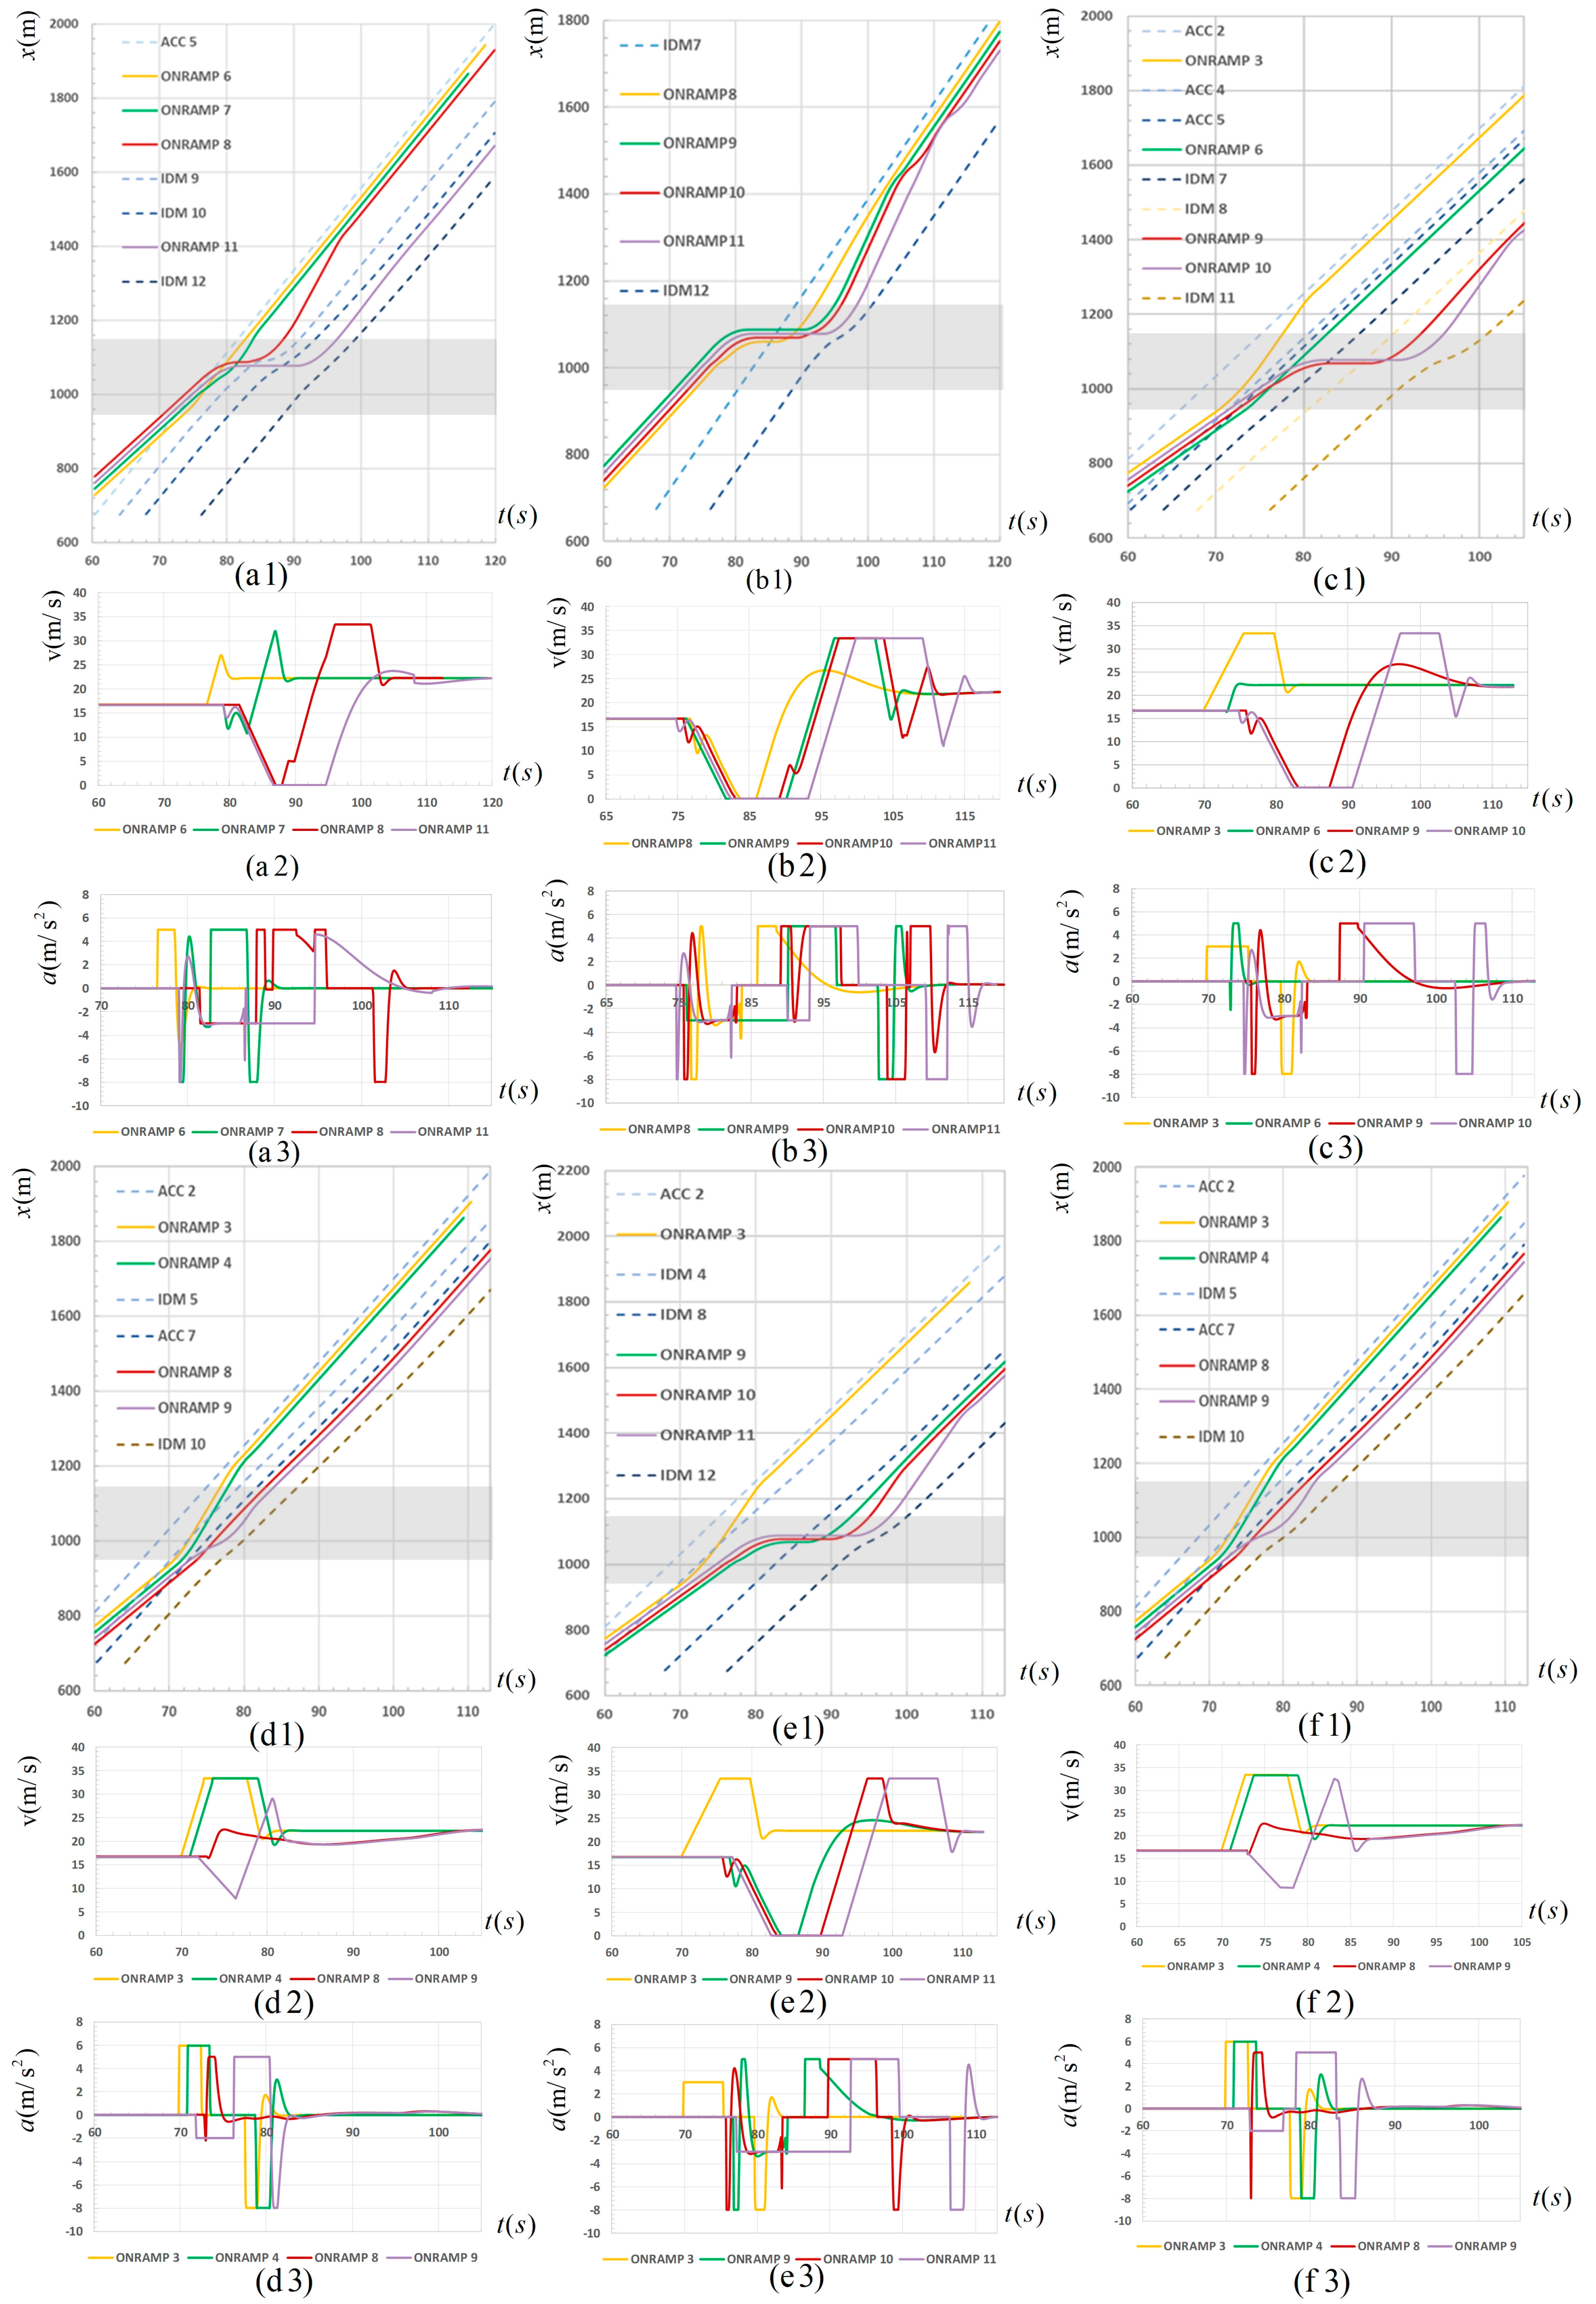
- (i).
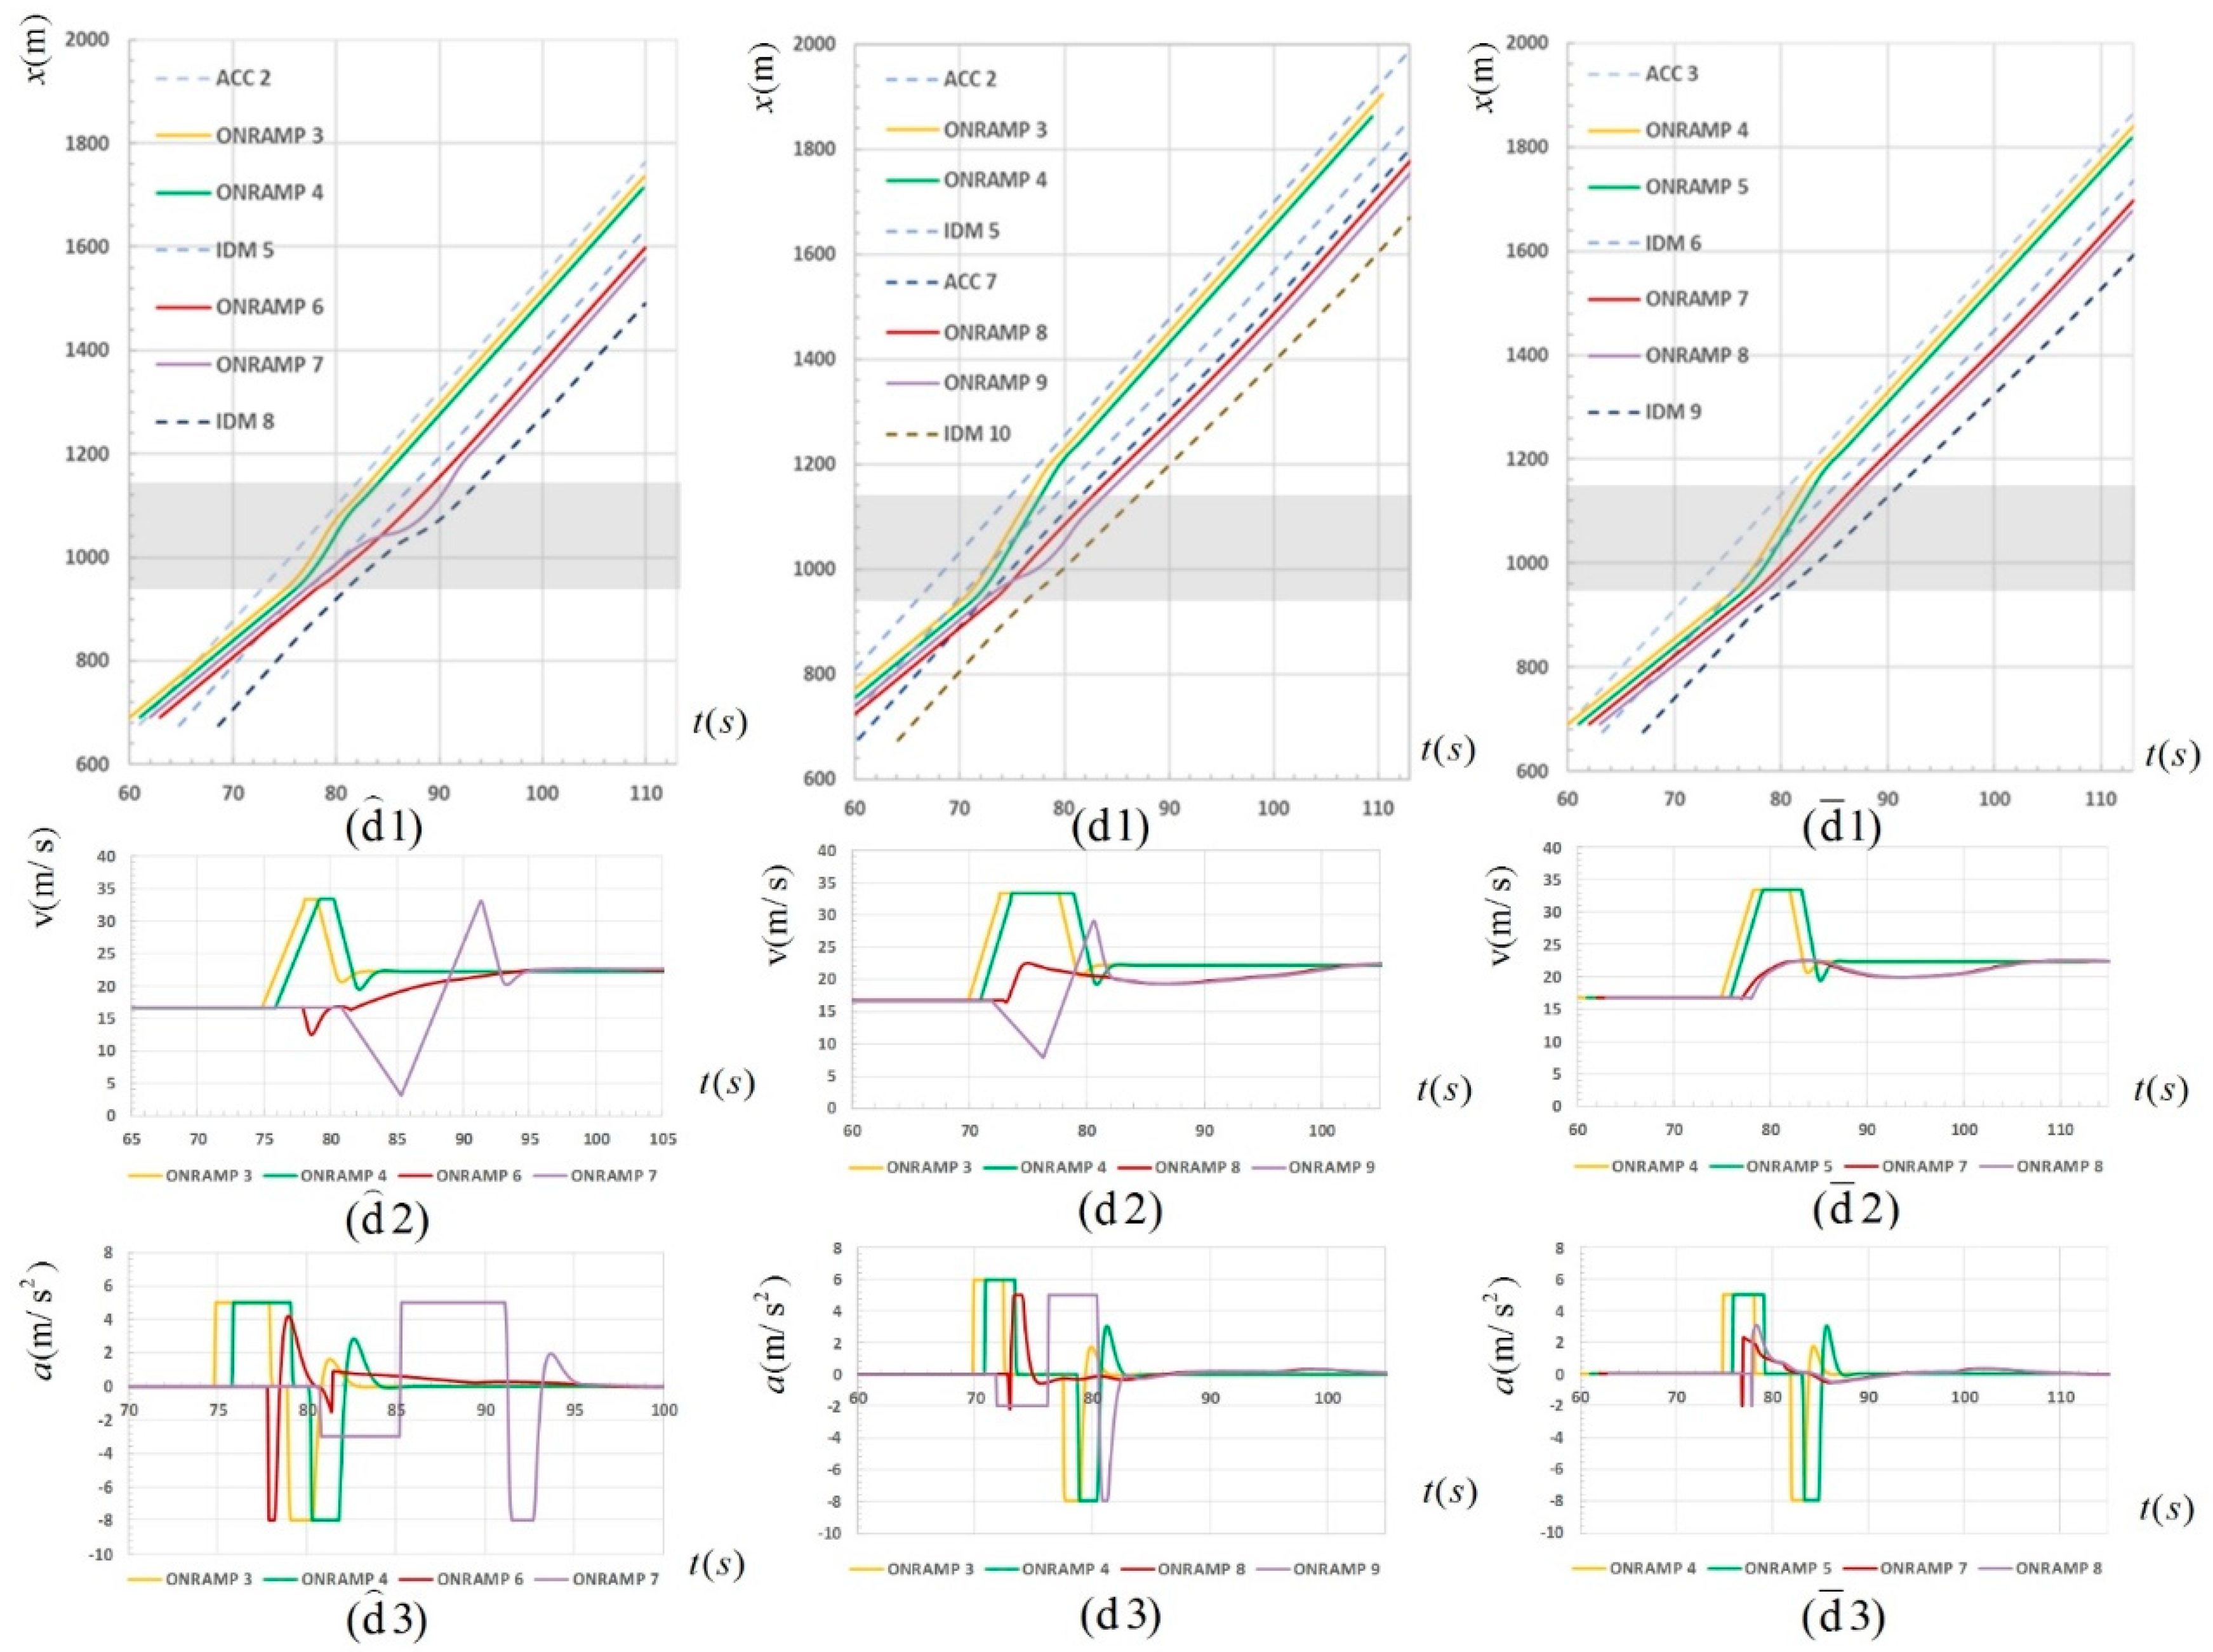
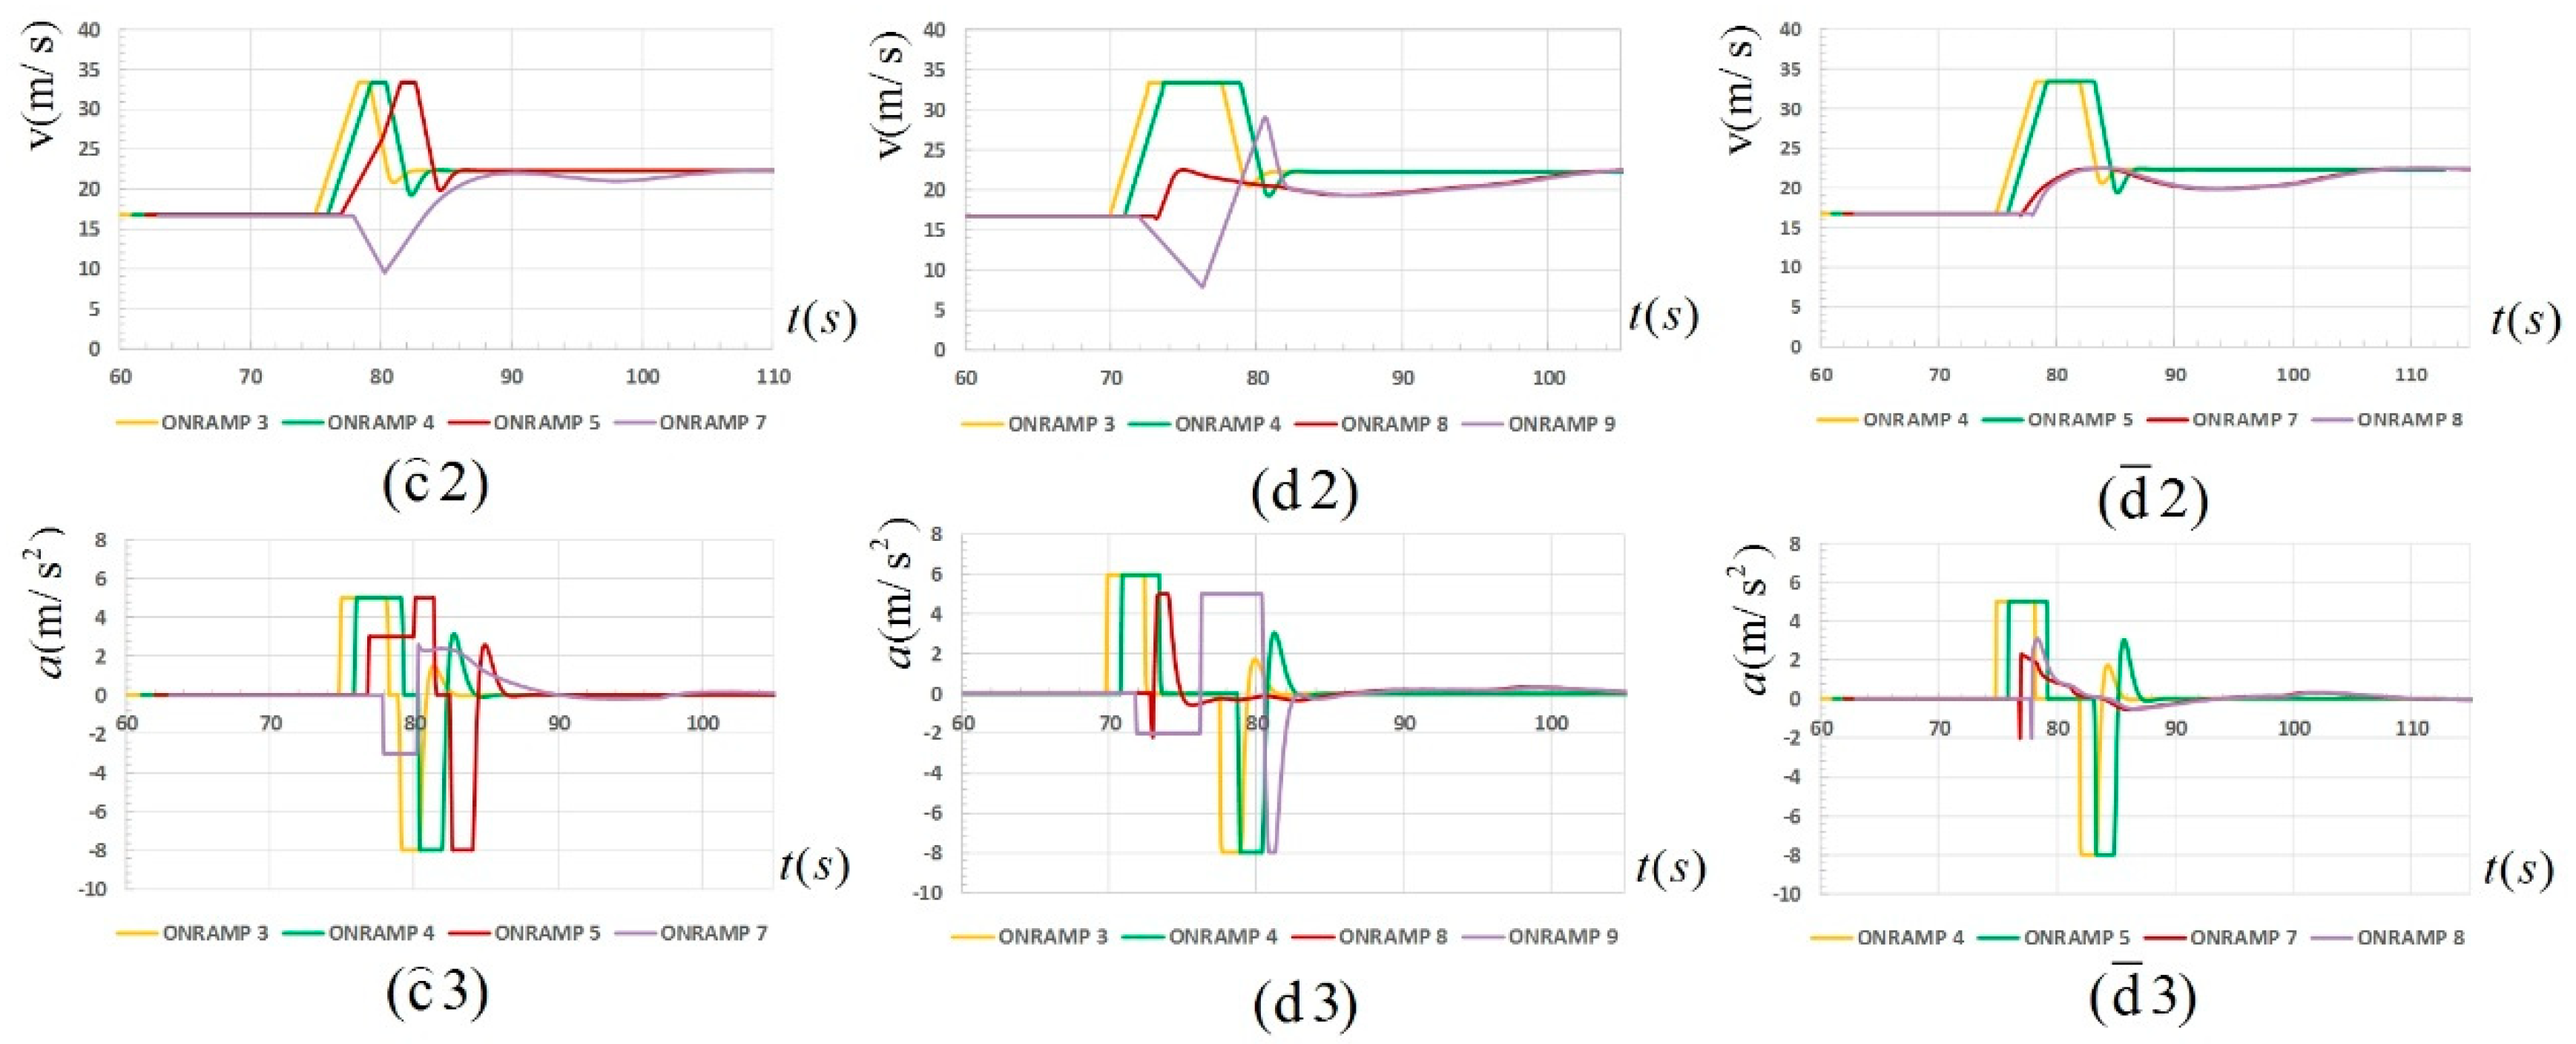
- The range of change in velocity is small (seen from d2, f2) and the frequency of change in acceleration is low (seen from d3, f3), which represents a smooth driving process, high safety and high driving comfort.
- (ii).
- No stopping behavior is observed. Moreover, the merging time is short, and the vehicles in front and behind on the main road do not slow down significantly (seen from d1, f1).
- (i).
- The platoon split merging strategy proposed in this study can improve the efficiency and safety of platoon merging in the merging area under certain circumstances and reduce the impact on the main road vehicles.
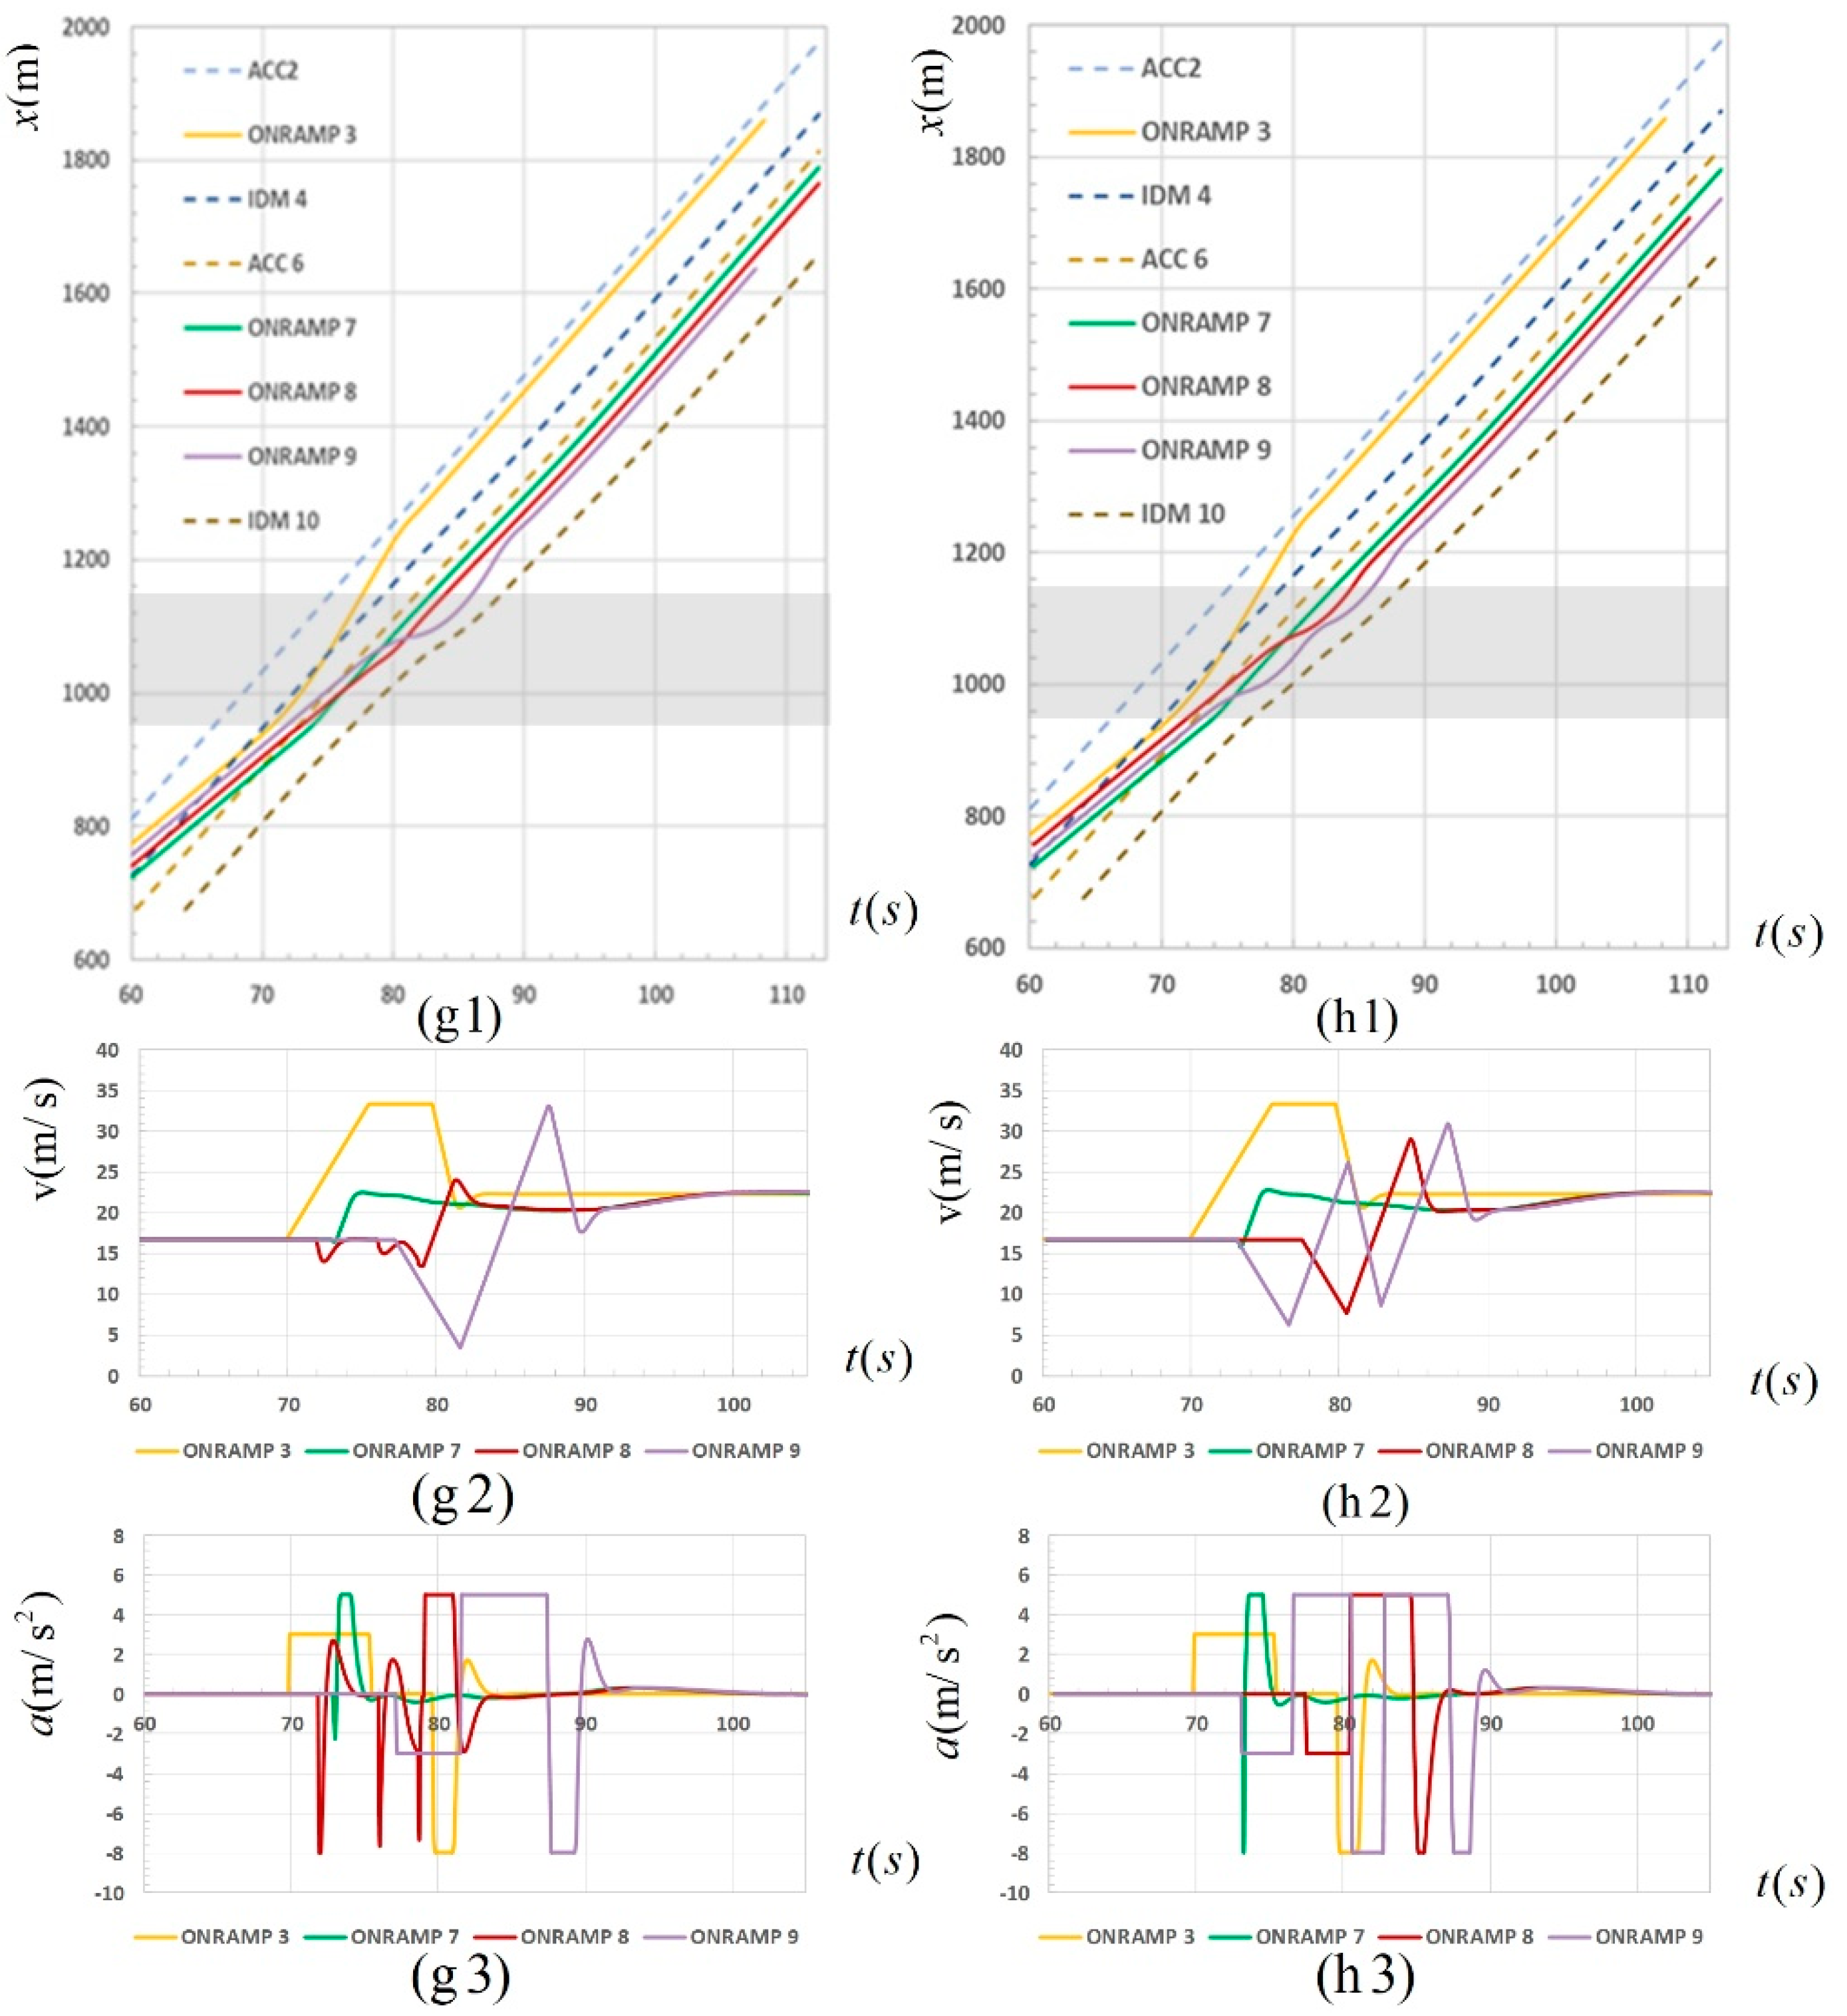
- (ii).
- The final merging performance of the CAV platoon is different under the control of different split strategies.
- (i).
- For the merging vehicles, the velocity variation chart has no zero point, indicating that the vehicles have no stopping behavior. The four spatiotemporal trajectory curves are generally smooth and compact, indicating that the vehicles run smoothly, the distance between the heads is small, and the merging efficiency is high.
- (ii).
- For vehicles on the main road, the spatiotemporal trajectory curves are generally straight, and the slope changes are small, indicating that the main road vehicles have no significant deceleration behavior and are less affected by the platoon merging behavior.
- (i).
- The number of vehicles in the sub-platoon should not be too large. It is mainly reflected in the increase in stopping time caused by waiting for a large gap, and in the process of stopping and starting, the car behind on the main road is forced to slow down significantly.
- (ii).
- The number of sub-platoons should not be too many. It is mainly reflected in the velocity disturbance, which amplifies the transmission between platoons, resulting in a decrease in the driving stability of downstream vehicles. In summary, there is a contradiction between the two points. Therefore, under specific ratios, the optimal split strategy for the arrival of the platoon is different, which is related to the gap distribution and the parameters of the platoon and needs to be analyzed in detail.
5. Conclusions and Future Work
- (i).
- For the merging CAV platoon, the PSCM method not only ensures safety during the acceleration and lane changing process, but also significantly promotes the efficiency of the merging CAV platoon, resulting in a 50.7% reduction in the travel time compared with that under the no-split control strategy.
- (ii).
- For the main road vehicles, the PSCM method reduces the interference of the CAV platoon with the normal flow of the main road vehicles during the merging process. The experimental results show that under the 50% CAV ratio, the average travel time of main road vehicles under the optimal platoon split strategy is reduced by 27.9%, and the standard deviation of acceleration is reduced by 68.6%.
- (iii).
- The PSCM method is more effective in reducing the merging interference with a higher ratio of CAVs in the mixed traffic flow. As the CAV ratio increases from 50% to 70%, the average velocity of main road vehicles in the 2-2 split strategy increases by 1.40%, and the average standard deviation of velocity and the average standard deviation of acceleration decrease by 4.35% and 1.99%, respectively.
Author Contributions
Funding
Institutional Review Board Statement
Informed Consent Statement
Data Availability Statement
Conflicts of Interest
References
- Sun, C.; Pei, X.; Hao, J.; Wang, Y.; Zhang, Z.; Wong, S.C. Role of road network features in the evaluation of incident impacts on urban traffic mobility. Transp. Res. Part B Methodol. 2018, 117, 101–116. [Google Scholar] [CrossRef]
- Garrison, D.; Mannering, F. Assessing the traffic impacts of freeway incidents and driver information. ITE J. 1990, 60, 19–23. [Google Scholar]
- Papageorgiou, M.; Kotsialos, A. Freeway ramp metering: An overview. IEEE Trans. Intell. Transp. Syst. 2002, 3, 271–281. [Google Scholar] [CrossRef]
- Kauppila, H.S. Isolated versus coordinated ramp metering: Field evaluation results of travel time reliability and traffic impact. Transp. Res. Part C Emerg. Technol. 2013, 28, 155–167. [Google Scholar]
- Frejo, J.R.D.; Camacho, E.F. Global Versus Local MPC Algorithms in Freeway Traffic Control with Ramp Metering and Variable Speed Limits. IEEE Trans. Intell. Transp. Syst. 2012, 13, 1556–1565. [Google Scholar] [CrossRef]
- Han, Y.; Hegyi, A.; Yuan, Y.; Hoogendoorn, S.; Papageorgiou, M.; Roncoli, C. Resolving freeway jam waves by discrete first-order model-based predictive control of variable speed limits. Transp. Res. Part C Emerg. Technol. 2017, 77, 405–420. [Google Scholar] [CrossRef]
- Liu, H.; Zhang, L.; Sun, D.; Wang, D. Optimize the Settings of Variable Speed Limit System to Improve the Performance of Freeway Traffic. IEEE Trans. Intell. Transp. Syst. 2015, 16, 3249–3257. [Google Scholar] [CrossRef]
- Carlson, R.C.; Papamichail, I.; Papageorgiou, M. Local Feedback-Based Mainstream Traffic Flow Control on Motorways Using Variable Speed Limits. IEEE Trans. Intell. Transp. Syst. 2011, 12, 1261–1276. [Google Scholar] [CrossRef]
- Yang, F.; Wang, S.; Li, J.; Liu, Z.; Sun, Q. An overview of Internet of Vehicles. China Commun. 2014, 11, 1–15. [Google Scholar] [CrossRef]
- Xiong, L.; Xia, X.; Lu, Y.; Liu, W.; Yu, Z. IMU-based Automated Vehicle Body Sideslip Angle and Attitude Estimation Aided by GNSS using Parallel Adaptive Kalman Filters. IEEE Trans. Veh. Technol. 2020, 69, 10668–10680. [Google Scholar] [CrossRef]
- Xiong, L.; Xia, X.; Lu, Y.; Liu, W.; Gao, L.; Song, S.; Han, Y.; Yu, Z. IMU-Based Automated Vehicle Slip Angle and Attitude Estimation Aided by Vehicle Dynamics. Sensors 2019, 19, 1930. [Google Scholar] [CrossRef] [PubMed]
- Bhover, S.U.; Tugashetti, A.; Rashinkar, P. V2X communication protocol in VANET for co-operative intelligent transportation system. In Proceedings of the 2017 International Conference on Innovative Mechanisms for Industry Applications (ICIMIA), Bengaluru, India, 21–23 February 2017. [Google Scholar]
- Huang, J. Research on Internet of Vehicles and its Application in Intelligent Transportation. Appl. Mech. Mater. 2013, 321–324, 2818–2821. [Google Scholar] [CrossRef]
- Choi, M.; Rubenecia, A.; Choi, H.H. Reservation-based cooperative traffic management at an intersection of multi-lane roads. In Proceedings of the International Conference on Information Networking IEEE Computer Society, Chiang Mai, Thailand, 10–12 January 2018. [Google Scholar]
- Huang, S.; Sadek, A.W.; Zhao, Y. Assessing the Mobility and Environmental Benefits of Reservation-Based Intelligent Intersections Using an Integrated Simulator. IEEE Trans. Intell. Transp. Syst. 2012, 13, 1201–1214. [Google Scholar] [CrossRef]
- Dresner, K.; Stone, P. A Multiagent Approach to Autonomous Intersection Management. J. Artif. Intell. Res. 2008, 31, 591–656. [Google Scholar] [CrossRef]
- Muñoz, J.C.; Daganzo, C.F. The bottleneck mechanism of a freeway diverge. Transp. Res. Part A Policy Pract. 2002, 36, 483–505. [Google Scholar] [CrossRef]
- Yang, F.; Gu, W.; Cassidy, M.J.; Li, X.; Li, T. Achieving higher taxi outflows from a drop-off lane: A simulation-based study. Transp. Res. Part C Emerg. Technol. 2020, 115, 102623. [Google Scholar] [CrossRef]
- Rios-Torres, J.; Malikopoulos, A.; Pisu, P. Online Optimal Control of Connected Vehicles for Efficient Traffic Flow at Merging Roads. In Proceedings of the 2015 IEEE 18th International Conference on Intelligent Transportation Systems-(ITSC 2015), Gran Canaria, Spain, 15–18 September 2015. [Google Scholar]
- Ding, J.; Li, L.; Peng, H.; Zhang, Y. A Rule-Based Cooperative Merging Strategy for Connected and Automated Vehicles. IEEE Trans. Intell. Transp. Syst. 2019, 21, 3436–3446. [Google Scholar] [CrossRef]
- Huang, Z.; Chu, D.; Wu, C.; He, Y. Path Planning and Cooperative Control for Automated Vehicle Platoon Using Hybrid Automata. IEEE Trans. Intell. Transp. Syst. 2019, 20, 959–974. [Google Scholar] [CrossRef]
- Meng, Y.; Li, L.; Wang, F.Y.; Li, K.; Li, Z. Analysis of Cooperative Driving Strategies for Non-Signalized Intersections. IEEE Trans. Veh. Technol. 2017, 67, 2900–2911. [Google Scholar] [CrossRef]
- Pei, H.; Feng, S.; Zhang, Y.; Yao, D. A Cooperative Driving Strategy for Merging at On-Ramps Based on Dynamic Programming. IEEE Trans. Veh. Technol. 2019, 68, 11646–11656. [Google Scholar] [CrossRef]
- Ahn, H.; Vecchio, D.D. Safety Verification and Control for Collision Avoidance at Road Intersections. IEEE Trans. Autom. Control 2017, 63, 630–642. [Google Scholar] [CrossRef]
- Li, P.; Zhou, X. Recasting and optimizing intersection automation as a connected-and-automated-vehicle (CAV) scheduling problem: A sequential branch-and-bound search approach in phase-time-traffic hypernetwork. Transp. Res. Part B Methodol. 2017, 105, 479–506. [Google Scholar] [CrossRef]
- Li, L.; Wang, F.-Y. Cooperative Driving at Blind Crossings Using Intervehicle Communication. IEEE Trans. Veh. Technol. 2006, 55, 1712–1724. [Google Scholar] [CrossRef]
- Xin, Q.; Fu, R.; Ukkusuri, S.V.; Yu, S.; Jiang, R. Modeling and impact analysis of connected vehicle merging accounting for mainline random length tight-platoon. Phys. A Stat. Mech. Its Appl. 2021, 563, 125452. [Google Scholar] [CrossRef]
- Karbalaieali, S.; Osman, O.A.; Ishak, S. A Dynamic Adaptive Algorithm for Merging Into Platoons in Connected Automated Environments. IEEE Trans. Intell. Transp. Syst. 2019, 21, 4111–4122. [Google Scholar] [CrossRef]
- Kumaravel, S.D.; Malikopoulos, A.A.; Ayyagari, R. Decentralized Cooperative Merging of Platoons of Connected and Automated Vehicles at Highway On-Ramps. arXiv 2020, arXiv:2002.04826. [Google Scholar]
- Xu, H.; Feng, S.; Zhang, Y.; Li, L. A Grouping-Based Cooperative Driving Strategy for CAVs Merging Problems. IEEE Trans. Veh. Technol. 2019, 68, 6125–6136. [Google Scholar] [CrossRef]
- Treiber, M.; Helbing, D.; Hennecke, A. Congested traffic states in empirical observations and microscopic simulations. Phys. Rev. E 2000, 62, 1805. [Google Scholar] [CrossRef] [PubMed]
- VanderWerf, J.; Shladover, S.; Kourjanskaia, N.; Miller, M.; Krishnan, H. Modeling Effects of Driver Control Assistance Systems on Traffic. Transp. Res. Rec. 2001, 1748, 167–174. [Google Scholar] [CrossRef]
- Milanés, V.; Shladover, S.E. Modeling cooperative and autonomous adaptive cruise control dynamic responses using experimental data. Transp. Res. Part C Emerg. Technol. 2014, 48, 285–300. [Google Scholar] [CrossRef]
- Yu, S.; Shi, Z. The effects of vehicular gap changes with memory on traffic flow in cooperative adaptive cruise control strategy. Phys. A Stat. Mech. Its Appl. 2015, 428, 206–223. [Google Scholar] [CrossRef]
- Ward, J.A. Heterogeneity, Lane-Changing and Instability in Traffic: A Mathematical Approach; University of Bristol: Bristol, UK, 2009. [Google Scholar]
- Yao, Z.; Hu, R.; Wang, Y.; Jiang, Y.; Ran, B.; Chen, Y. Stability analysis and the fundamental diagram for mixed connected automated and human-driven vehicles. Phys. A Stat. Mech. Its Appl. 2019, 533, 121931. [Google Scholar] [CrossRef]
- Yao, Z.; Xu, T.; Jiang, Y.; Hu, R. Linear stability analysis of heterogeneous traffic flow considering degradations of connected automated vehicles and reaction time. Phys. A Stat. Mech. Its Appl. 2021, 561, 125218. [Google Scholar] [CrossRef]
- Sun, J.; Zheng, Z.; Sun, J. Stability analysis methods and their applicability to car-following models in conventional and connected environments. Transp. Res. Part B Methodol. 2018, 109, 212–237. [Google Scholar] [CrossRef]
- Rahman, M.S.; Abdel-Aty, M. Longitudinal safety evaluation of connected vehicles’ platooning on expressways. Accid. Anal. Prev. 2018, 117, 381–391. [Google Scholar] [CrossRef]
- Moon, S.; Moon, I.; Yi, K. Design, tuning, and evaluation of a full-range adaptive cruise control system with collision avoidance. Control Eng. Pract. 2009, 17, 442–455. [Google Scholar] [CrossRef]


| Parameter | Remarks | Parameter | Remarks |
|---|---|---|---|
| Number of main road gaps | Number of sub-platoons after splitting | ||
| The maximum number of vehicles that can be accommodated in the main road gap |
| Model | IDM | ACC | CACC |
|---|---|---|---|
| Split Strategy | None | 0-4 | 1-3 | 2-2 | 3-1 | 1-1-2 | 1-2-1 | 2-1-1 |
|---|---|---|---|---|---|---|---|---|
| Letter | a | b | c | d | e | f | g | h |
| Strategies | None | 0-4 | 1-3 | 2-2 | 3-1 | 1-1-2 | 1-2-1 | 2-1-1 |
|---|---|---|---|---|---|---|---|---|
| CAV1 (s) | 6.10 | 19.70 | 11.90 | 9.80 | 11.90 | 9.80 | 11.90 | 11.90 |
| CAV2 (s) | 16.10 | 35.60 | 12.70 | 10.40 | 19.90 | 10.40 | 14.40 | 14.40 |
| CAV3 (s) | 33.50 | 38.70 | 32.20 | 12.70 | 27.40 | 12.70 | 9.70 | 14.40 |
| CAV4 (s) | 30.30 | 44.70 | 36.20 | 9.50 | 38.30 | 14.10 | 19.30 | 16.90 |
| Average Travel Time (s) | 21.50 | 34.675 | 23.25 | 10.60 | 24.375 | 11.75 | 13.825 | 14.40 |
| Ratio | Index | None | 0-4 | 1-3 | 2-2 | 3-1 | 1-1-2 | 1-2-1 | 2-1-1 | Average |
|---|---|---|---|---|---|---|---|---|---|---|
| 30% | Average velocity | 18.97 | 25.36 | 18.48 | 18.20 | 24.01 | 17.99 | 18.11 | 18.13 | 19.91 |
| Velocity SD | 1.96 | 2.13 | 1.65 | 2.39 | 1.87 | 2.98 | 2.93 | 2.54 | 2.31 | |
| Average acceleration | 0.12 | 0.52 | 0.46 | 0.29 | 0.65 | 0.44 | 0.51 | 0.30 | 0.41 | |
| Acceleration SD | 1.30 | 1.71 | 0.96 | 1.64 | 0.96 | 1.70 | 1.66 | 1.71 | 1.46 | |
| Average travel time | 10.78 | 8.01 | 10.84 | 11.09 | 8.58 | 11.25 | 11.15 | 11.14 | 10.36 | |
| 50% | Average velocity | 16.57 | 19.42 | 20.58 | 20.34 | 20.09 | 20.14 | 20.32 | 20.36 | 19.73 |
| Average velocity SD | 3.61 | 2.26 | 1.14 | 0.99 | 1.78 | 1.36 | 1.34 | 0.98 | 1.68 | |
| Average acceleration | −0.08 | −0.03 | 0.05 | −0.11 | −0.10 | −0.16 | −0.07 | −0.01 | −0.06 | |
| Average acceleration SD | 2.10 | 1.25 | 0.59 | 0.66 | 1.17 | 0.93 | 1.03 | 0.76 | 1.06 | |
| Average travel time | 13.05 | 10.52 | 9.84 | 9.86 | 10.04 | 9.97 | 9.94 | 9.91 | 10.39 | |
| 70% | Average velocity | 16.56 | 19.83 | 18.45 | 20.53 | 20.37 | 20.56 | 20.37 | 20.57 | 19.66 |
| Average velocity SD | 3.25 | 1.83 | 2.76 | 0.75 | 0.82 | 0.77 | 0.83 | 0.75 | 1.47 | |
| Average acceleration | −0.06 | −0.03 | 0.24 | 0.04 | 0.11 | 0.04 | 0.11 | 0.04 | 0.06 | |
| Average acceleration SD | 1.80 | 1.03 | 1.32 | 0.53 | 0.43 | 0.53 | 0.43 | 0.55 | 0.83 | |
| Average travel time | 12.09 | 10.23 | 11.08 | 9.79 | 9.91 | 9.78 | 9.90 | 9.77 | 10.32 |
Disclaimer/Publisher’s Note: The statements, opinions and data contained in all publications are solely those of the individual author(s) and contributor(s) and not of MDPI and/or the editor(s). MDPI and/or the editor(s) disclaim responsibility for any injury to people or property resulting from any ideas, methods, instructions or products referred to in the content. |
© 2023 by the authors. Licensee MDPI, Basel, Switzerland. This article is an open access article distributed under the terms and conditions of the Creative Commons Attribution (CC BY) license (https://creativecommons.org/licenses/by/4.0/).
Share and Cite
Gao, H.; Cen, Y.; Liu, B.; Song, X.; Liu, H.; Liu, J. A Collaborative Merging Method for Connected and Automated Vehicle Platoons in a Freeway Merging Area with Considerations for Safety and Efficiency. Sensors 2023, 23, 4401. https://doi.org/10.3390/s23094401
Gao H, Cen Y, Liu B, Song X, Liu H, Liu J. A Collaborative Merging Method for Connected and Automated Vehicle Platoons in a Freeway Merging Area with Considerations for Safety and Efficiency. Sensors. 2023; 23(9):4401. https://doi.org/10.3390/s23094401
Chicago/Turabian StyleGao, Huan, Yanqing Cen, Bo Liu, Xianghui Song, Hongben Liu, and Jia Liu. 2023. "A Collaborative Merging Method for Connected and Automated Vehicle Platoons in a Freeway Merging Area with Considerations for Safety and Efficiency" Sensors 23, no. 9: 4401. https://doi.org/10.3390/s23094401
APA StyleGao, H., Cen, Y., Liu, B., Song, X., Liu, H., & Liu, J. (2023). A Collaborative Merging Method for Connected and Automated Vehicle Platoons in a Freeway Merging Area with Considerations for Safety and Efficiency. Sensors, 23(9), 4401. https://doi.org/10.3390/s23094401