

Electroencephalography Signal Analysis for Human Activities Classification: A Solution Based on Machine Learning and Motor Imagery

 , , , and
Abstract
1. Introduction
2. Related Works and Research Background
- Does ML based on random forest algorithm classify different motor tasks (real or imagery)?
- Does ML based on random forest differentiate real and motor imagery in FP1 electrode?
- What is the classification performance comparing consumer-graded and research EEG devices?
- What is the variability between EEG’s spectro-temporal and spatial distribution characteristics among subjects?
3. Proposed Solution
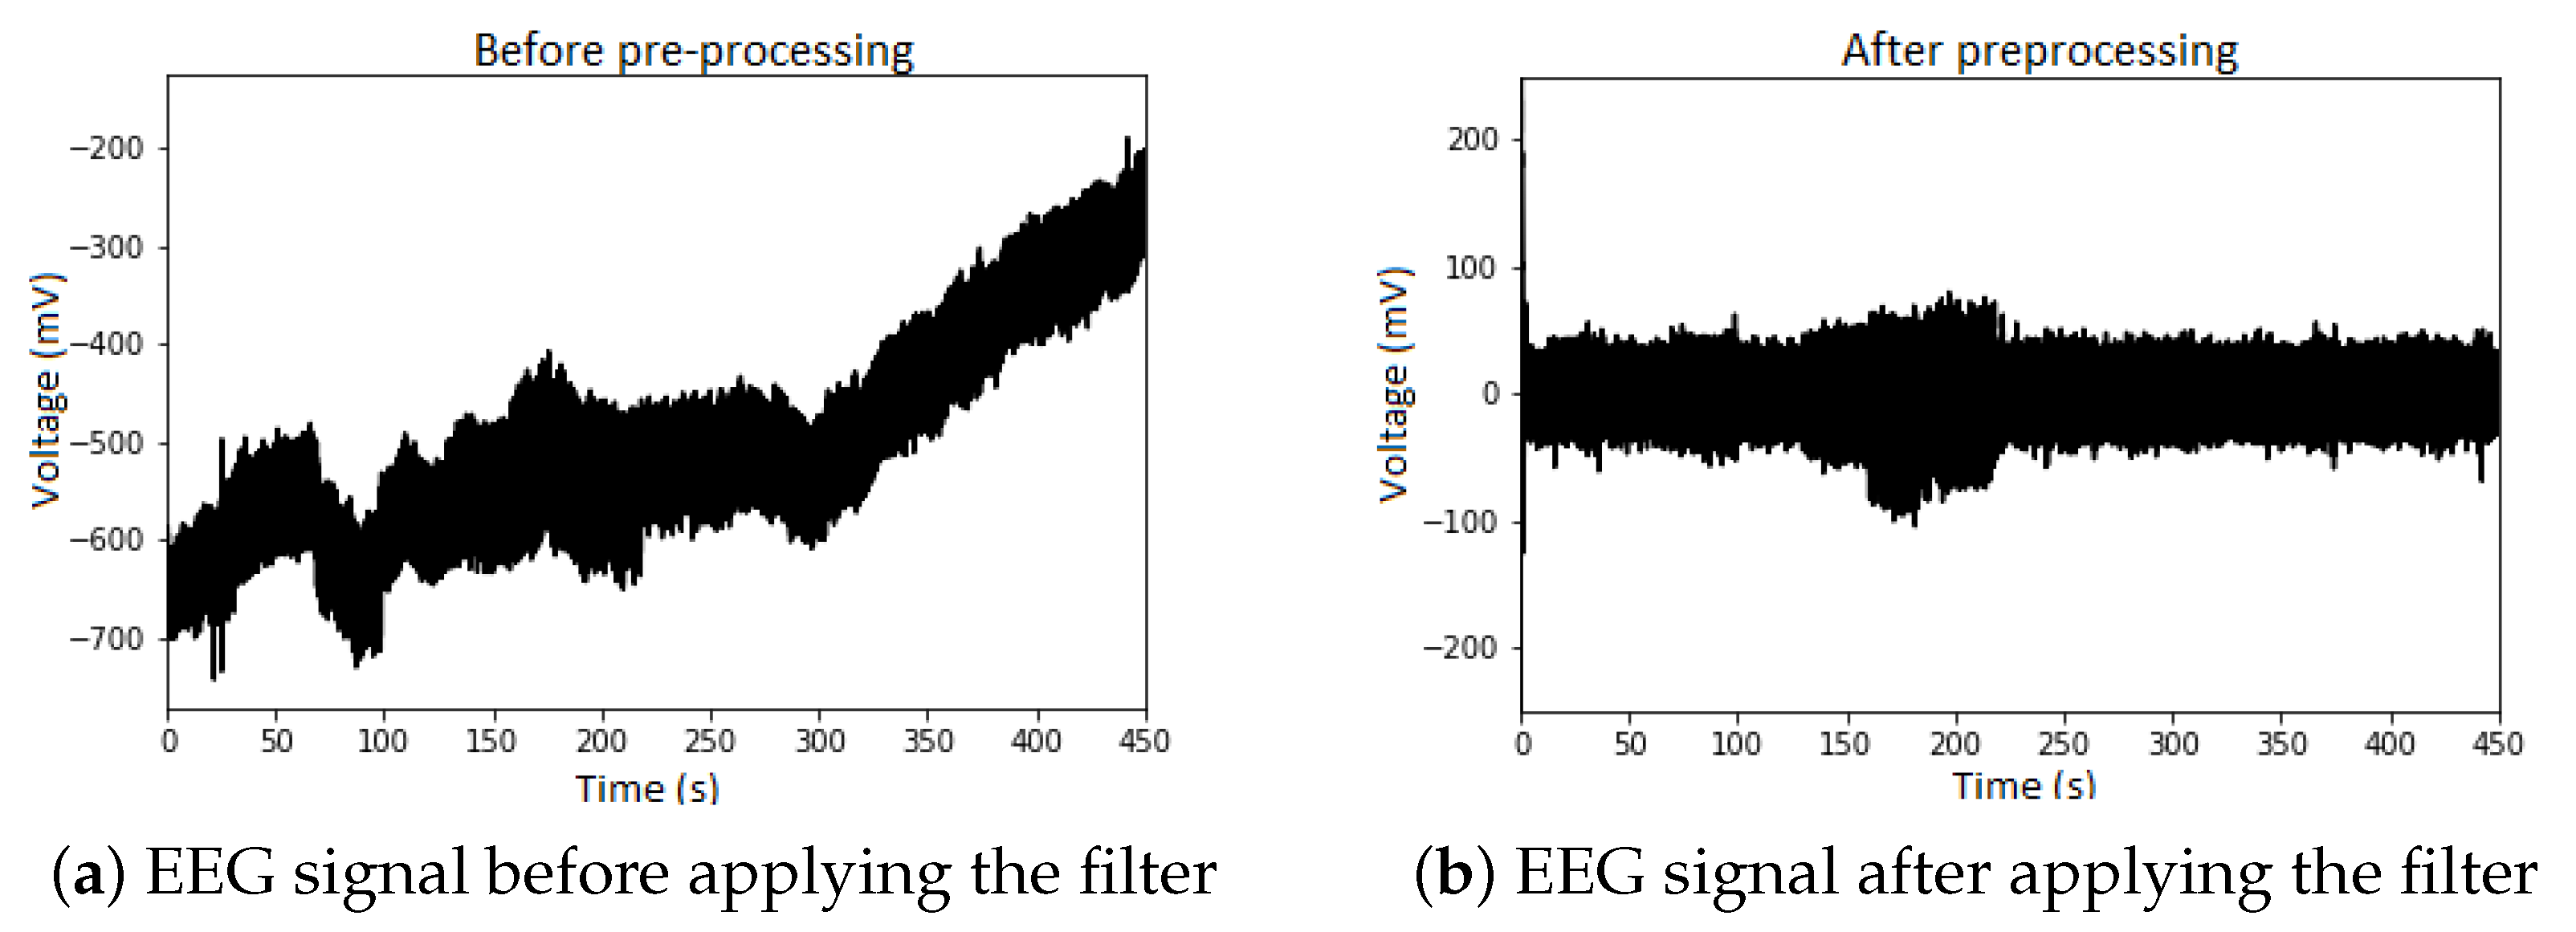
3.1. Signal Preprocessing
3.2. Machine Learning
3.3. Implementation of the Proposed Solution
- Level A comprises a single machine responsible for classifying the data according to the region of the movement, i.e., hands or ankles;
- Level B contains two machines, one for each region of the movement. The machines at Level B classify the movements between right and left. Considering that, at this point, we have already classified the data by its region, the possible outputs are left-hand, right-hand, left-ankle, and right-ankle movements;
- Level C determines whether the subject performed the movement or imagined it. It comprises four machines, each specialized in one possible output of Level B. Therefore, there are eight outputs for Level C: movement of the left-hand, imagery movement of the left-hand, movement of the right-hand, imagery movement of the right-hand, movement of the left ankle, imagery movement of the left ankle, movement of the right ankle, imagery movement of the right ankle.
Frameworks’ Definition
- Framework 1: used the same data collection from the same subject to train, validate, and test;
- Framework 2: considered two data collections from the same subject and used one of them to train and validate and the other for testing;
- Framework 3: to test and validate, we used data collections from the two subjects with the best and the worst accuracy in Framework 1’s classification. Then, we test it with data collections of the remaining seven subjects.
- Framework 1: 60% of data for train, 20% for validation, and 20% for test subsets;
- Framework 2: 40% of data for train, 10% for validation, and 50% for test subsets;
- Framework 3: 18% of data for train, 4% for validation, and 78% for test subsets.
4. Experimental Setup and Measurement Protocol
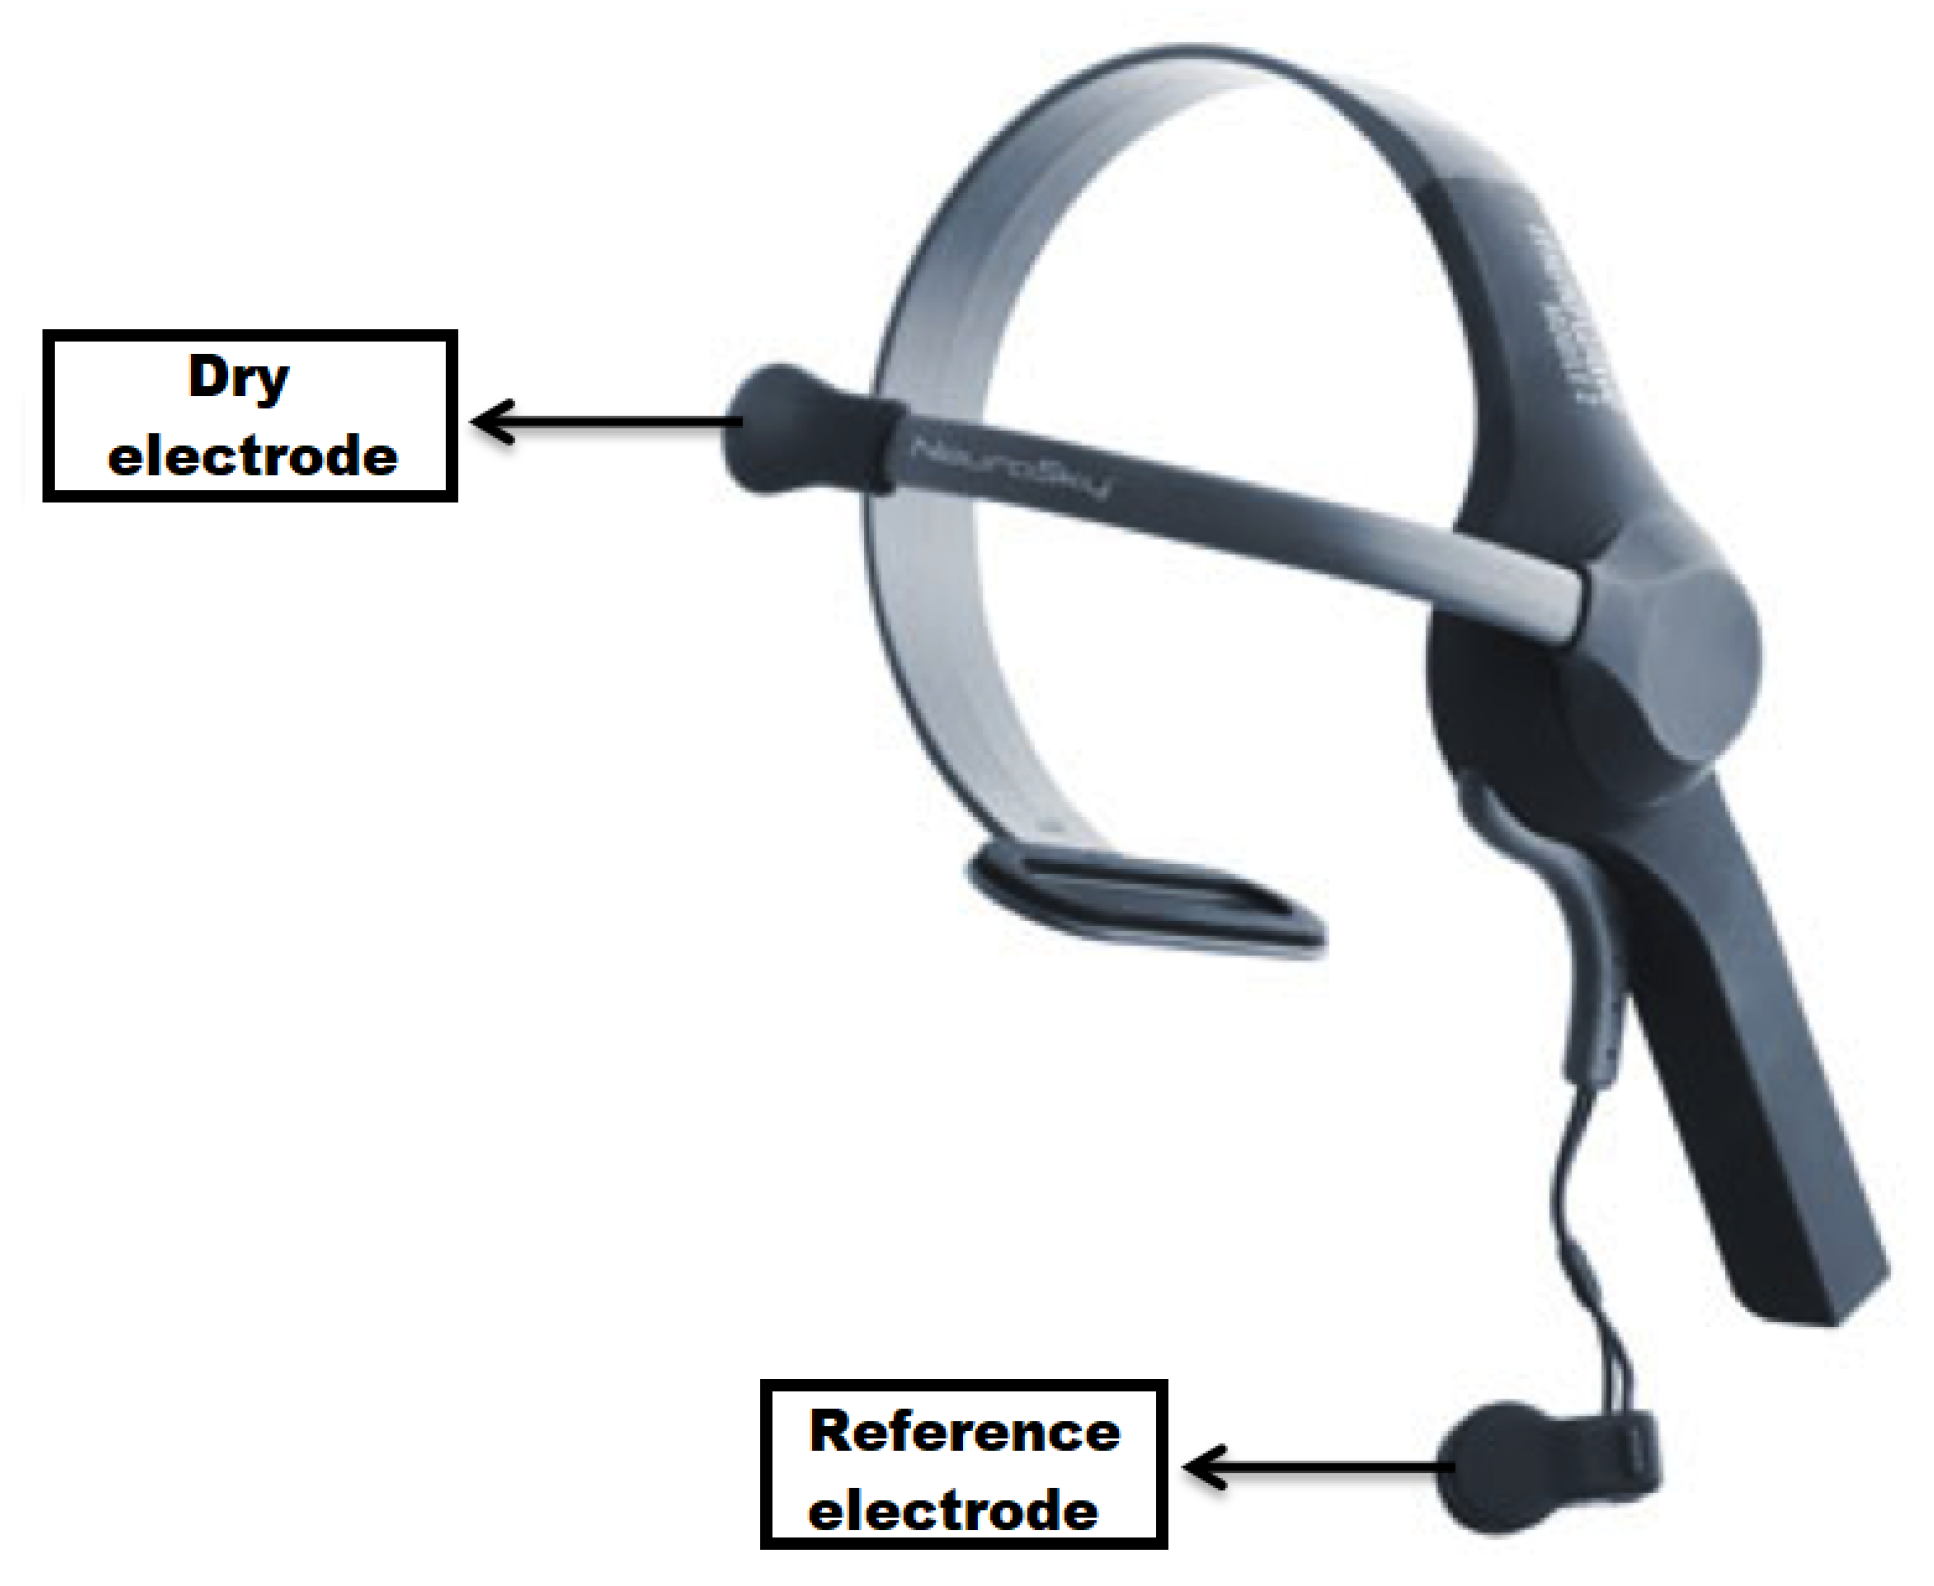
4.1. Experimental Setup
4.2. Measurement Protocol
- Imagine opening and closing the right-hand;
- Open and close the right-hand;
- Imagine opening and closing the left-hand;
- Open and close left-hand;
- Imagine flexing the right ankle;
- Flex the right ankle;
- Imagine flexing the left ankle;
- Flex the left ankle.
Data Selection
- Participants who did not follow the task instruction;
- Data with missing synchronization trigger;
- Low battery of the Mindwave, which impaired data streaming.
5. Results and Discussions
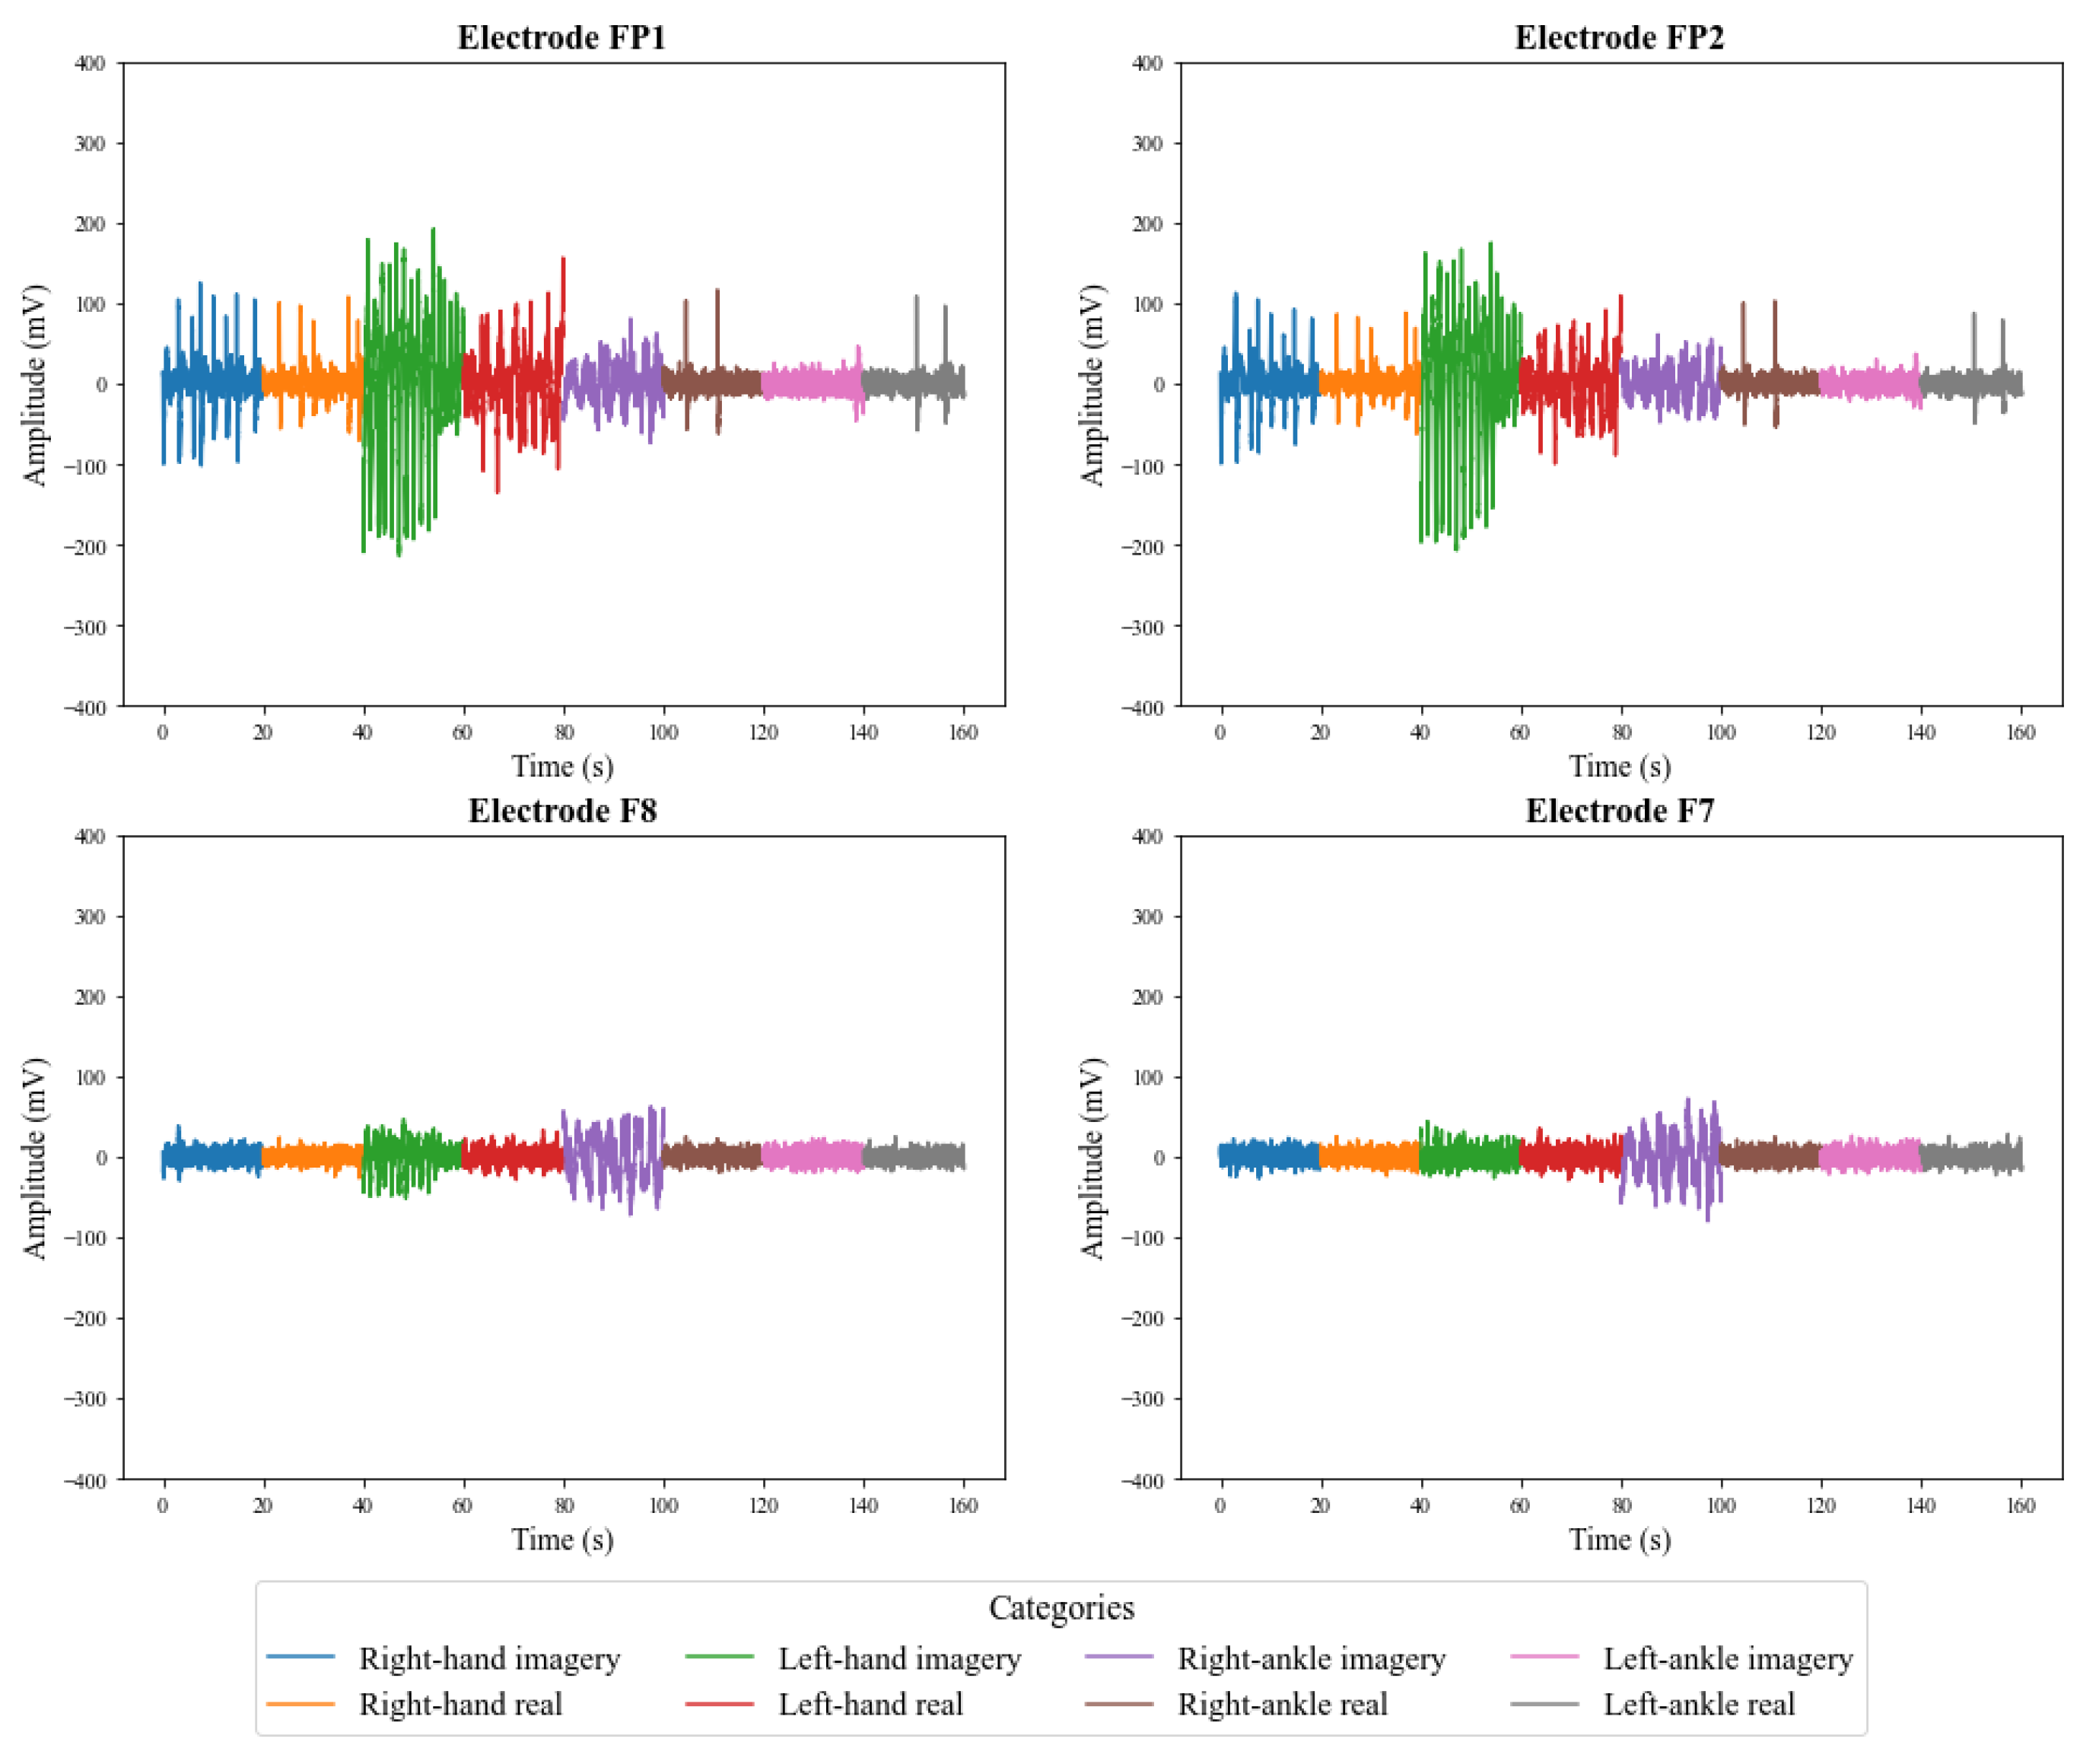
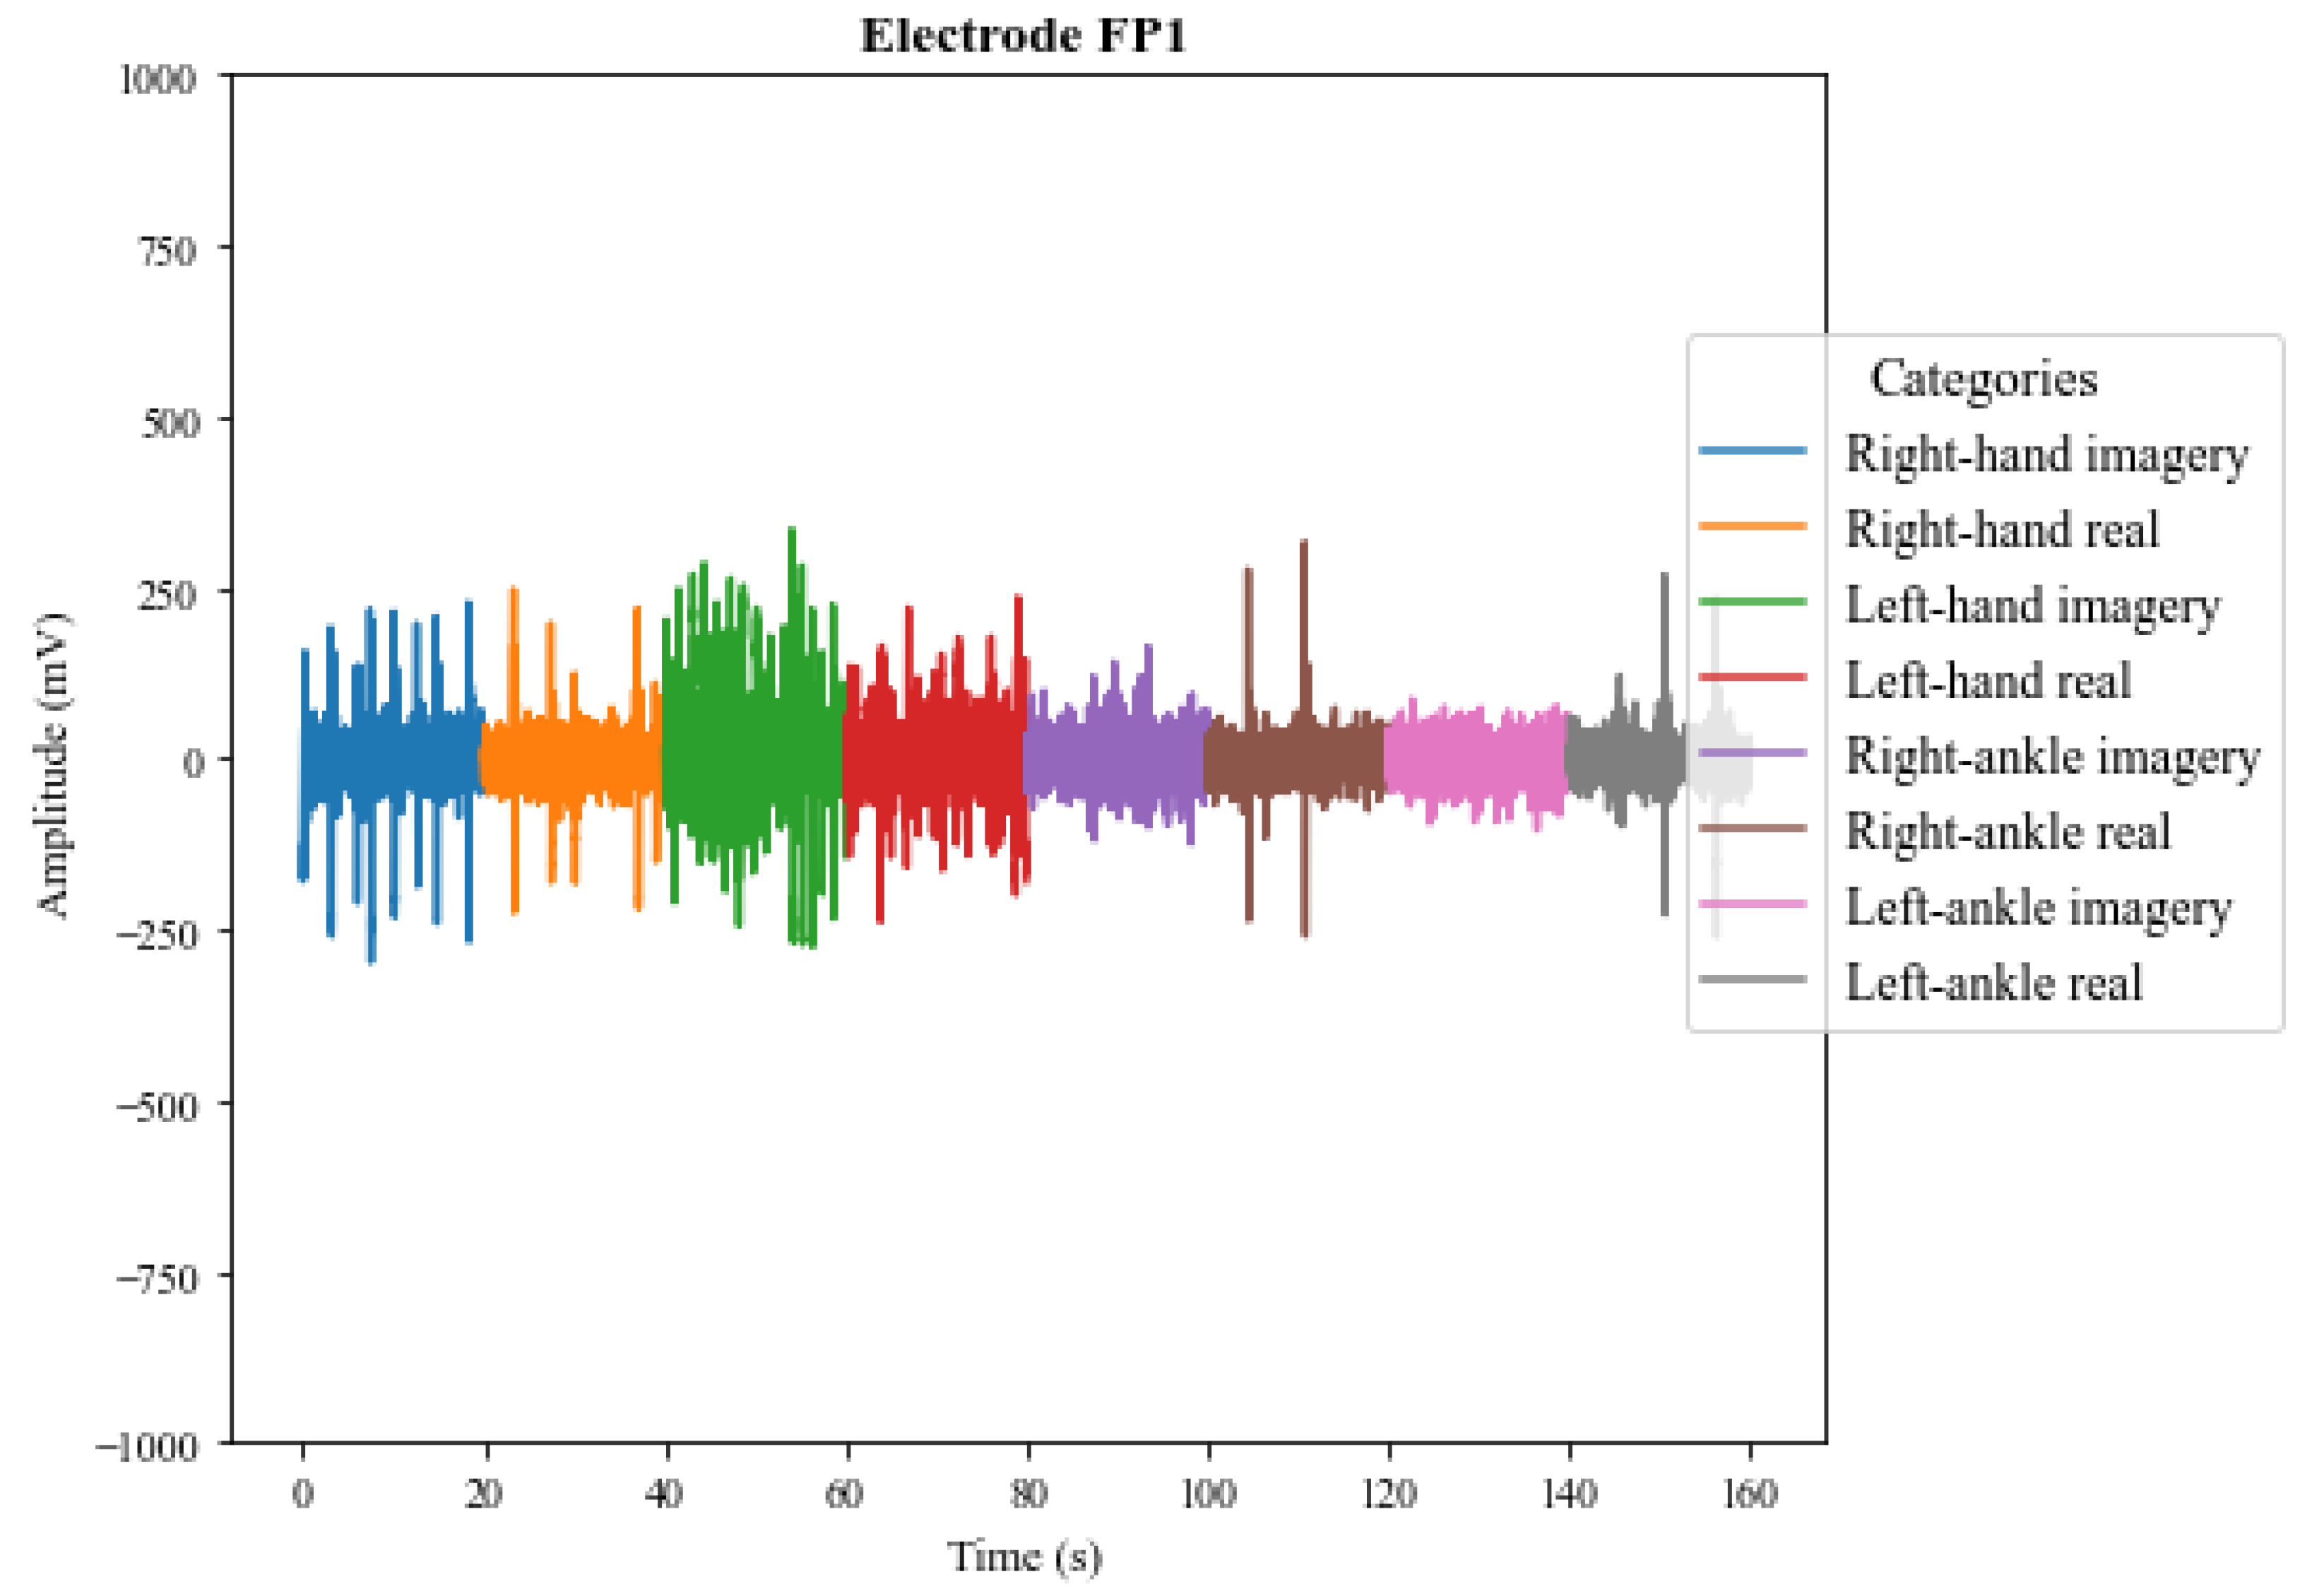
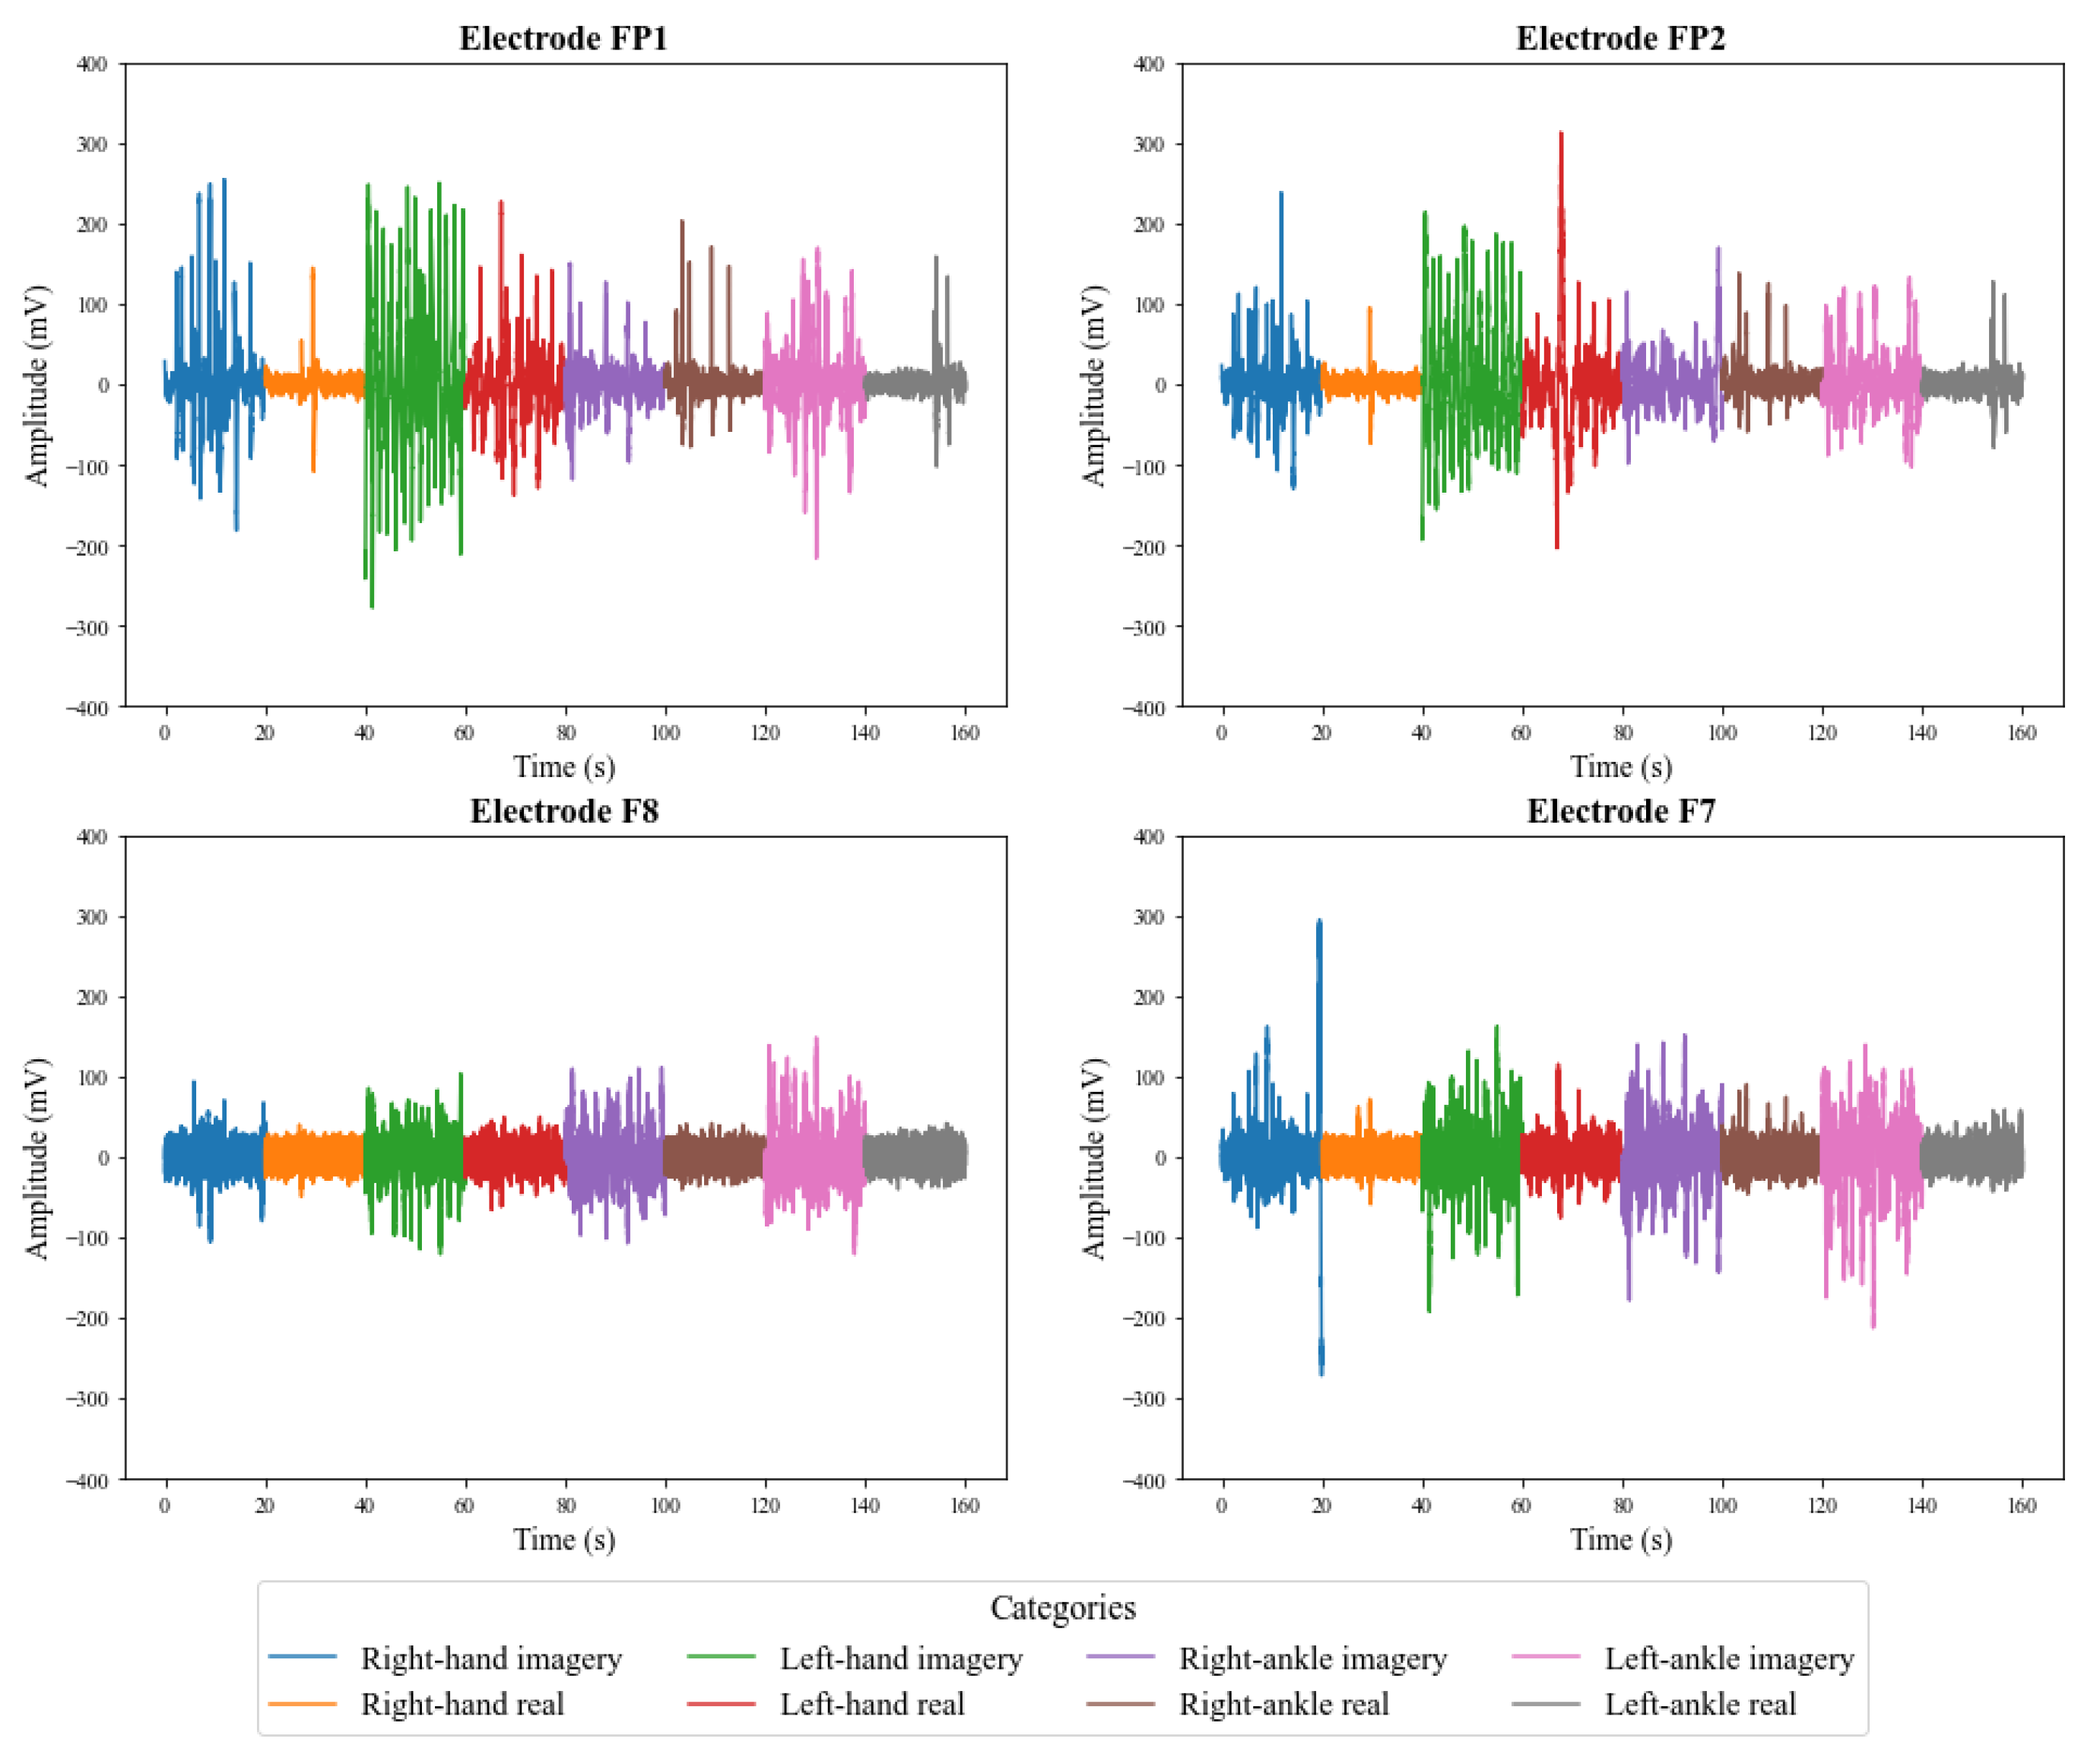
5.1. Preliminary Analysis
5.2. Classifier Results Analysis
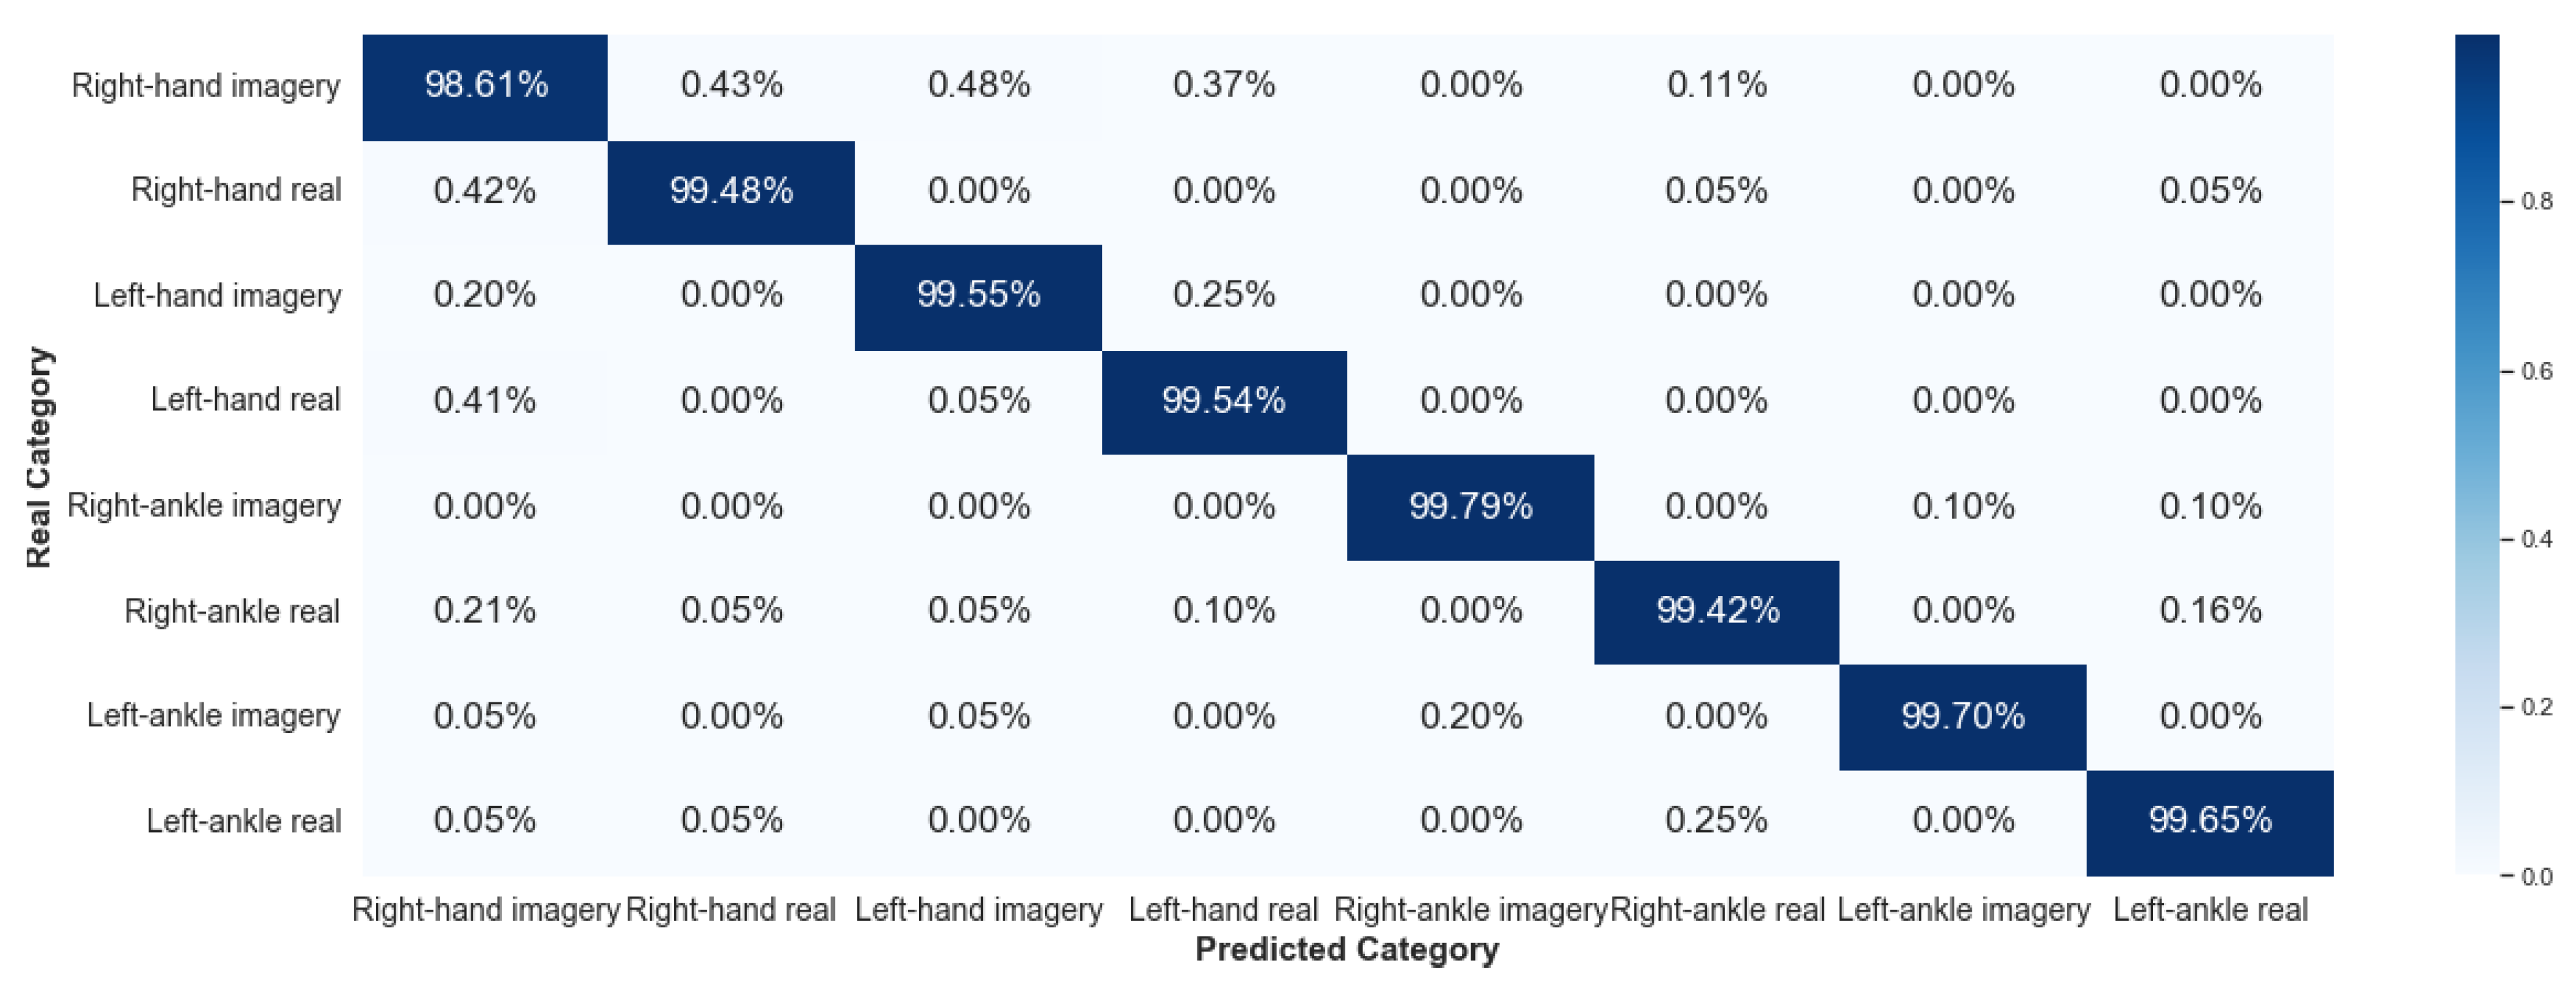
5.2.1. Framework 1
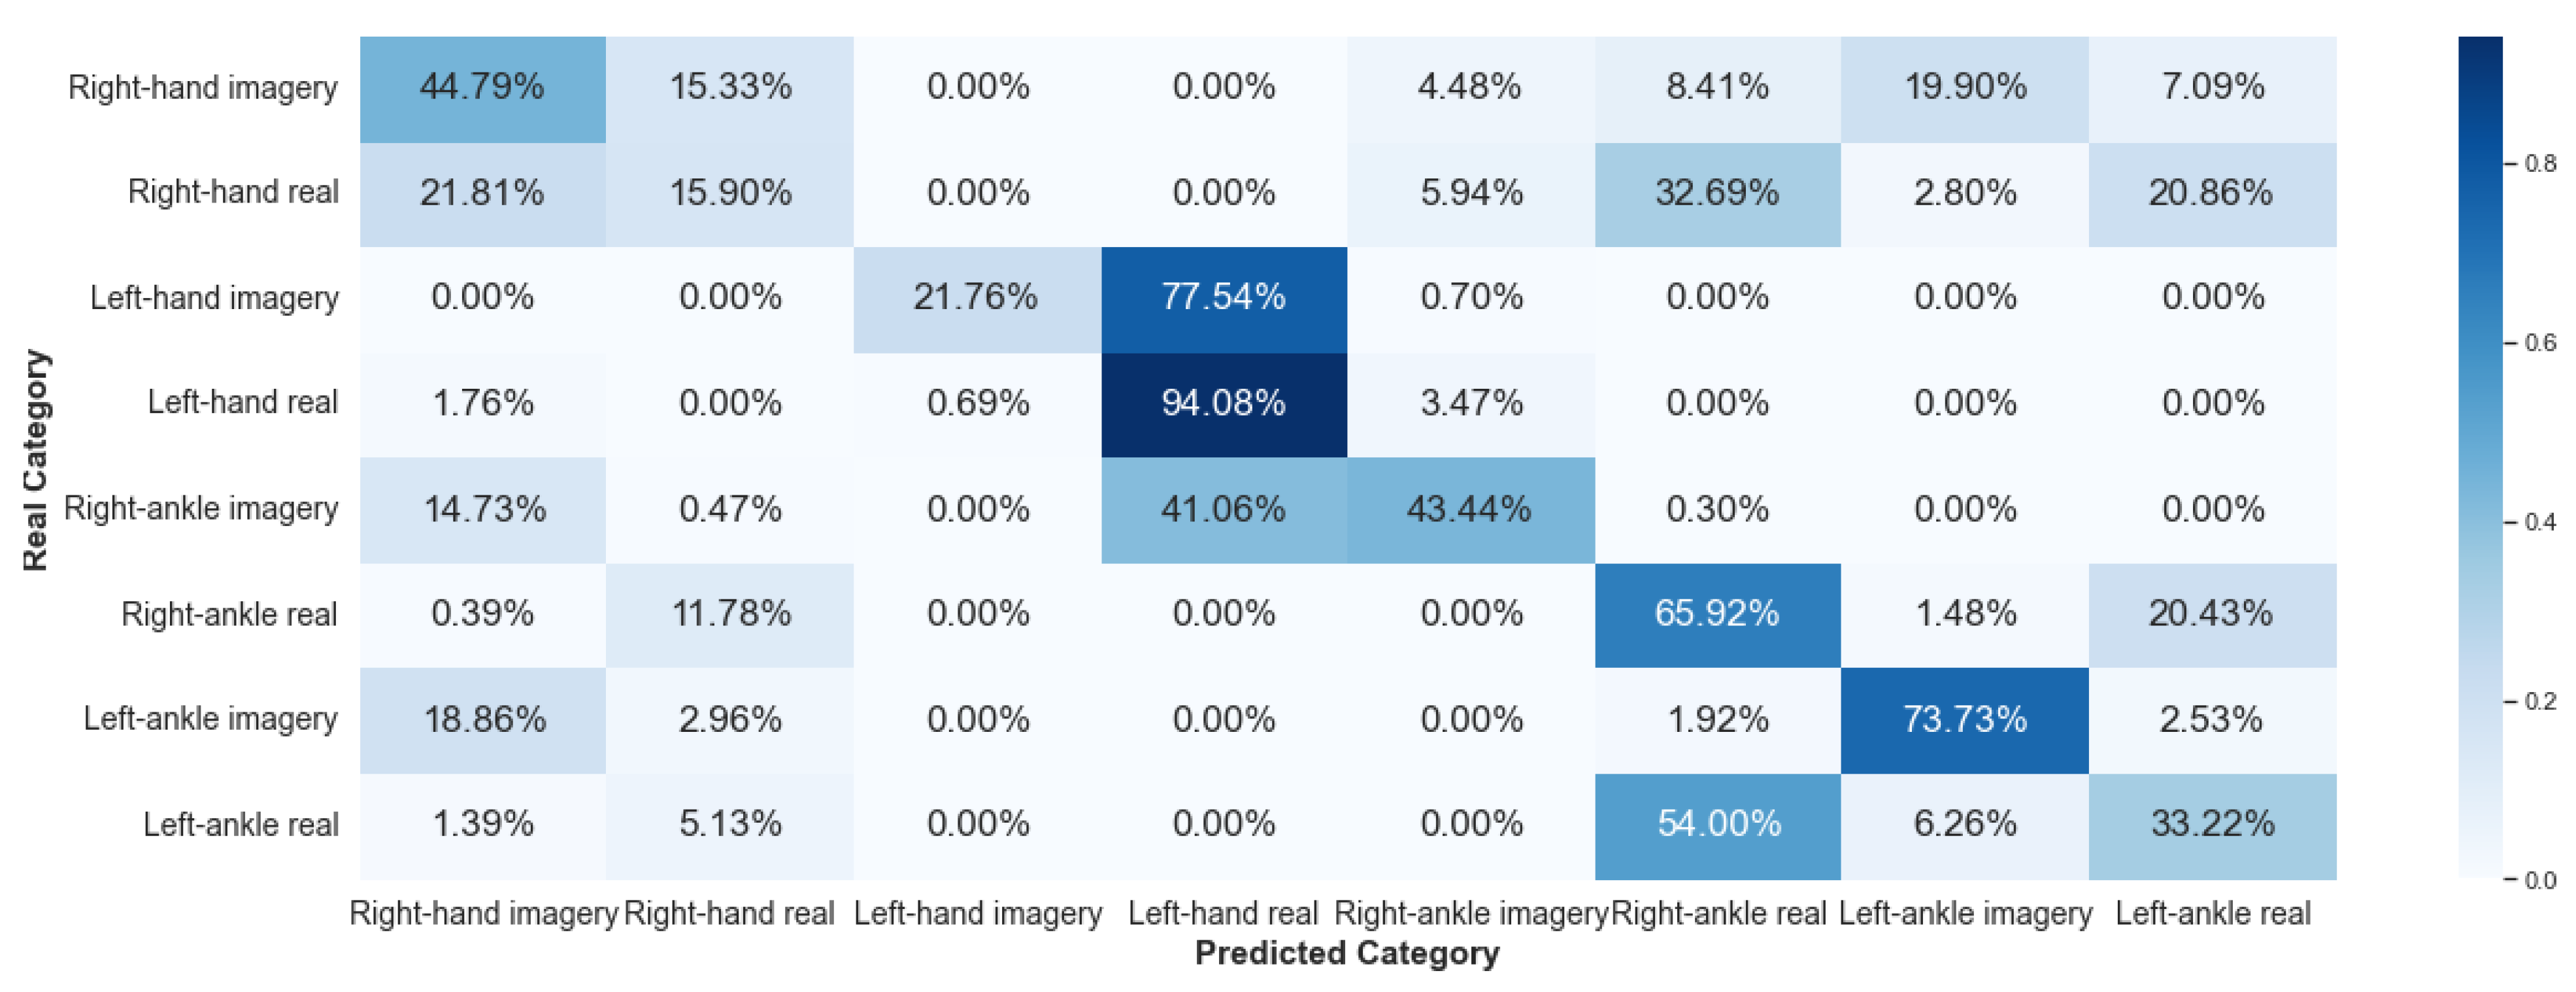
5.2.2. Framework 2
5.2.3. Framework 3
5.3. Comparison between Sensors
6. Conclusions and Final Remarks
- Does ML based on random forest algorithm classify different motor tasks (real or imagery)?
This paper showed that the EEG signals have different characteristics, considering the same subject for a given set of activities. The signal is variable over time, and its characterization process is complex. Nevertheless, ML based on random forest, such as the algorithm implemented in this work, is efficient in classifying these signals, as the results presented in Framework 1.
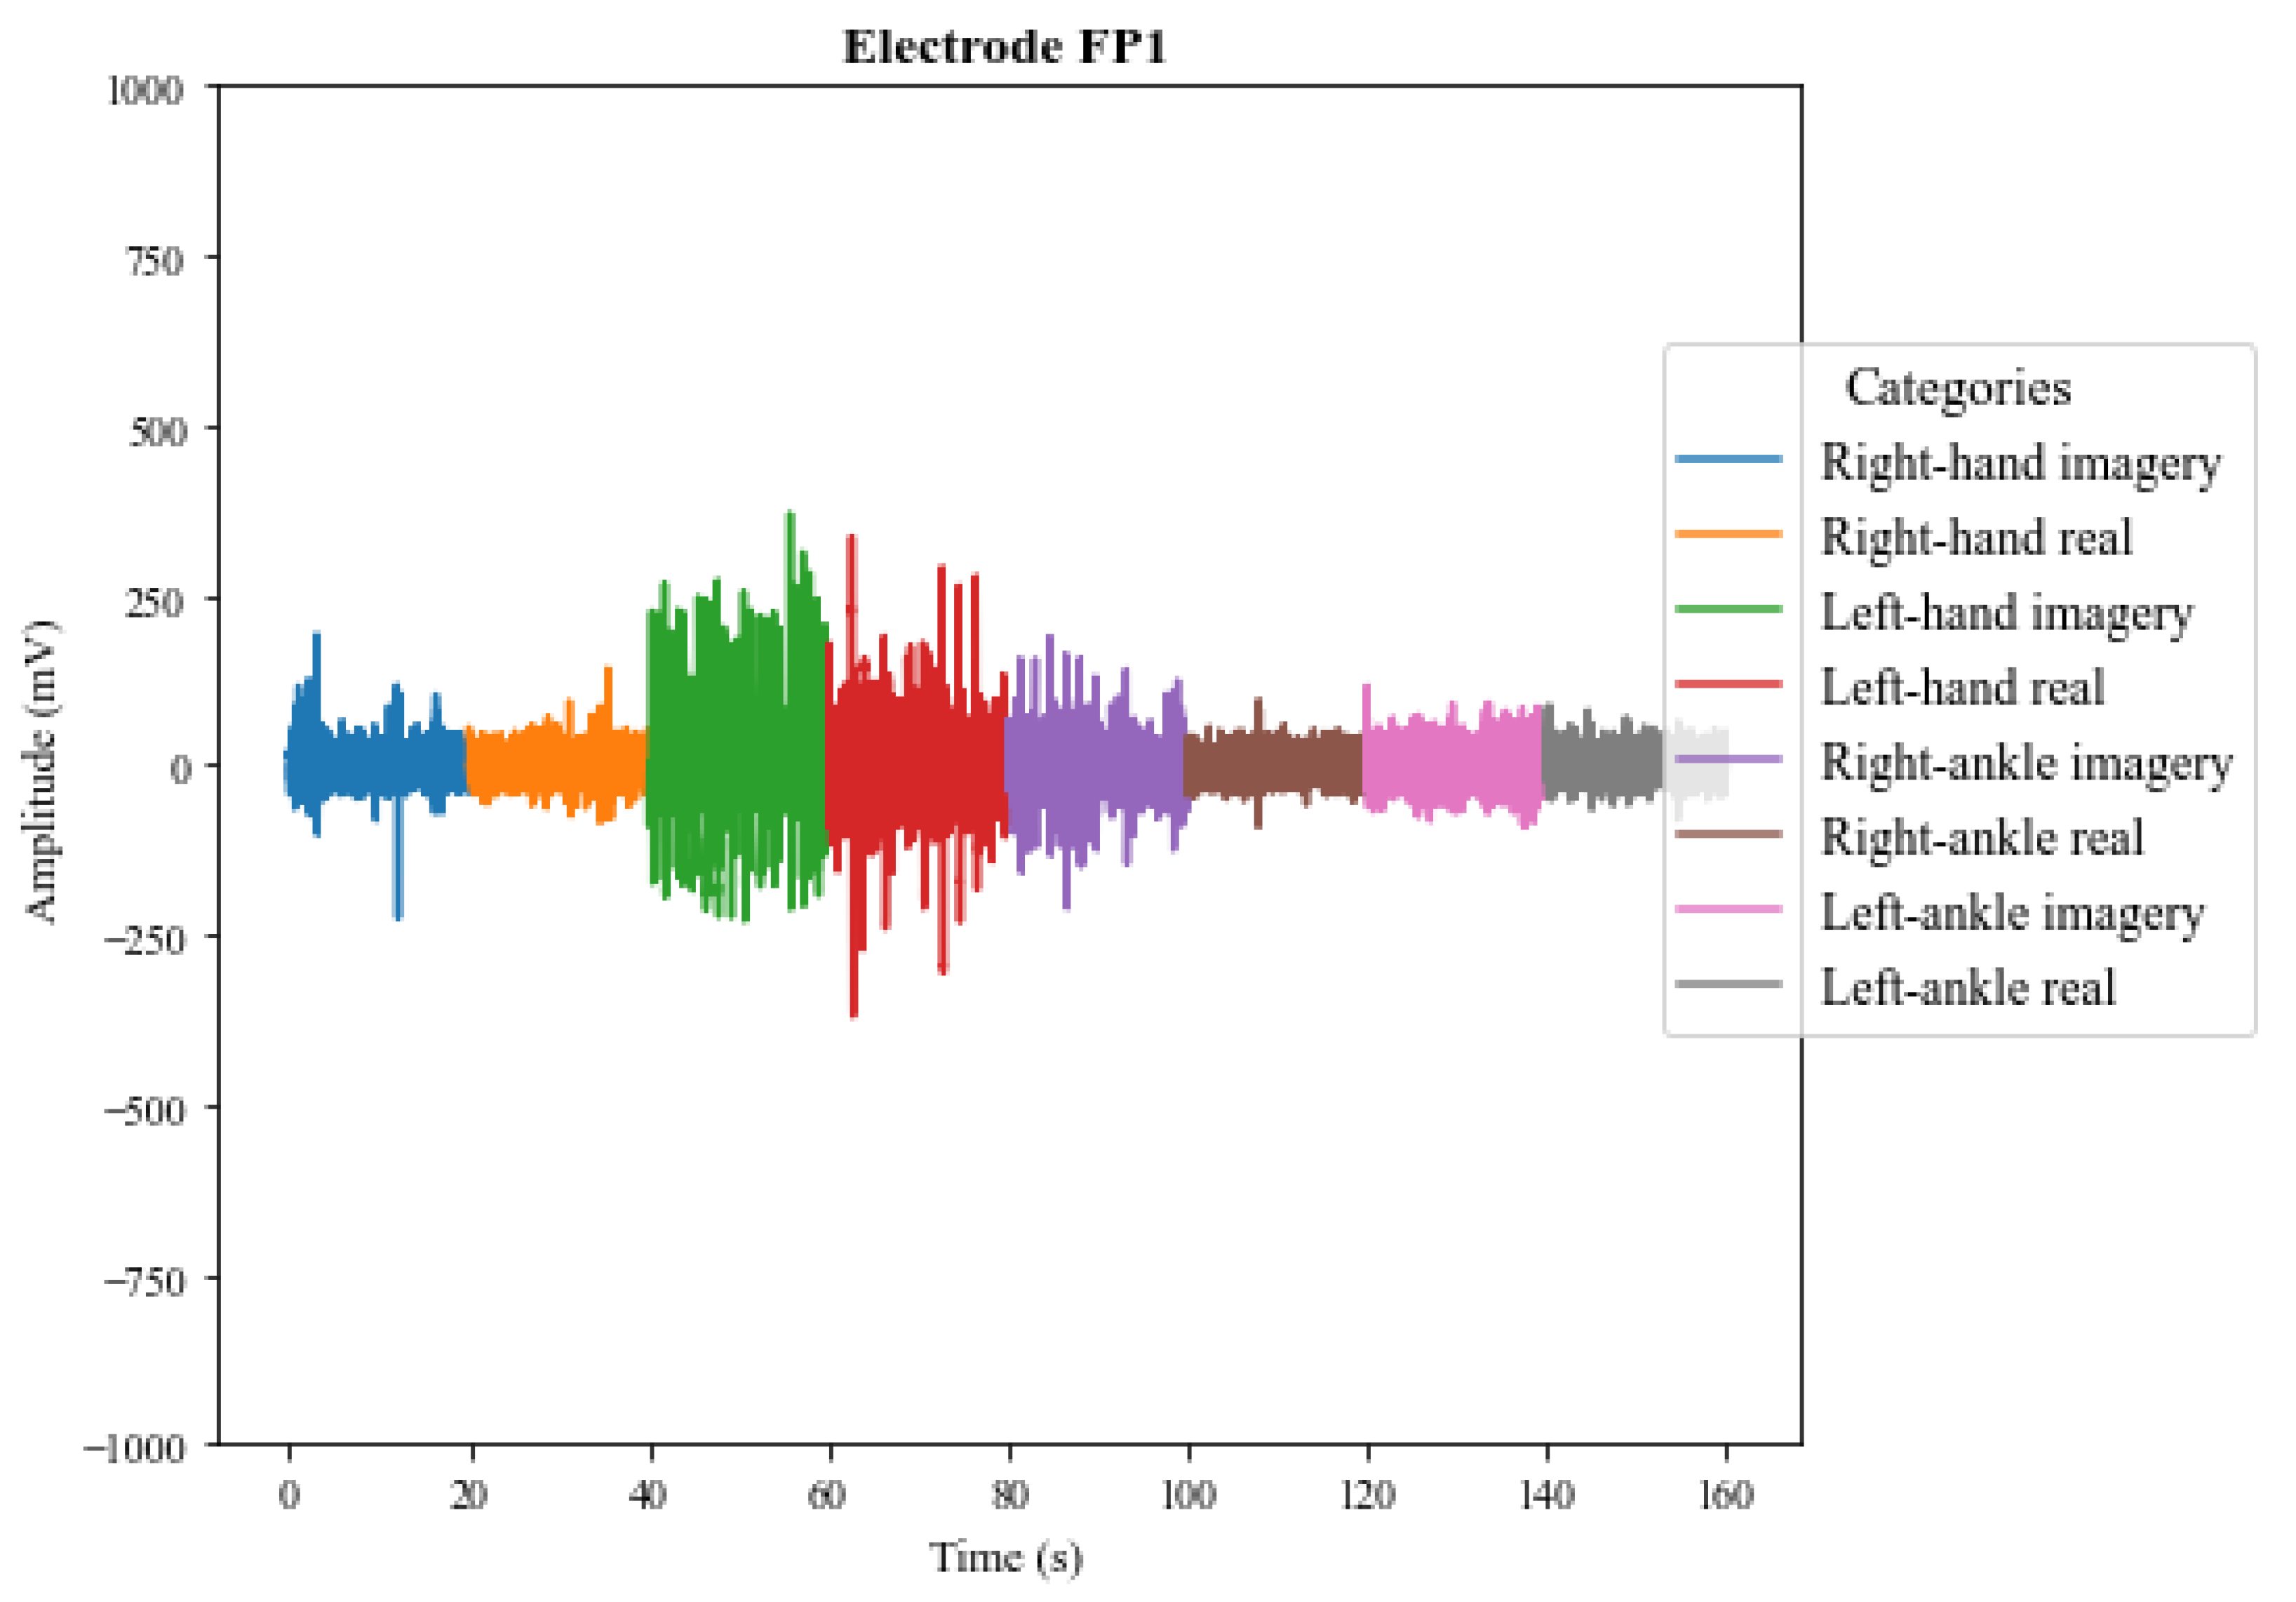
- Does ML based on random forest differentiate real and motor imagery in FP1 electrode?
It achieved satisfactory performance for Framework 1, with accuracies above 94%. However, for the other frameworks, the classification was not efficient. Therefore, these results indicate that FP1 position can be explored in research that uses the exact data for the entire training and classification process, considering the implementation of machine learning algorithms.
- What is the classification performance comparing consumer-graded and research EEG devices?
Mindwave has a lower performance when compared to V-AMP. However, it was expected that Mindwave would present lower classification accuracy. Nevertheless, results for Framework 1 supports that a consumer-graded EEG could be used in applications involving EEG data classification.
- What is the variability between EEG’s spectro-temporal and spatial distribution characteristics among subjects?
The results showed that EEG data presents temporal variability among the subjects. The best result achieved with the proposed methodology and algorithm was for Framework 1, which considered data from the same individual for the same task. However, this fact does not necessarily indicate that this is the only possibility of classification. There are projections of improvements in the algorithm that can provide the classification process with the ability to identify statistics in the signal of tasks performed by different people—suggestions for further research.
Author Contributions
Funding
Institutional Review Board Statement
Informed Consent Statement
Data Availability Statement
Conflicts of Interest
References
- World Health Organization. WHO Global Disability Action Plan 2014–2021. Better Health for All People with Disability. 2015. Available online: https://www.who.int/publications/i/item/who-global-disability-action-plan-2014-2021 (accessed on 24 January 2023).
- World Health Organization. World Report on Disability. 2011. Available online: https://apps.who.int/iris/handle/10665/44575 (accessed on 24 January 2023).
- Silva, C.D. Processamento de Sinais de EEG para Classificação de Tarefas Motoras em Sistemas de Interface Cérebro-Máquina. Ph.D Thesis, Universidade Federal de Santa Catarina, Florianópolis, Brazil, 2017. [Google Scholar]
- Shih, J.J.; Krusienski, D.J.; Wolpaw, J.R. Brain-computer interfaces in medicine. Mayo Clin. Proc. 2012, 87, 268–279. [Google Scholar] [CrossRef] [PubMed]
- Graimann, B.; Allison, B.; Pfurtscheller, G. Brain–Computer Interfaces: A Gentle Introduction. In Brain-Computer Interfaces; The Frontiers Collection; Springer: Berlin, Germany, 2010. [Google Scholar]
- Rotta, N.T.; Filho, C.A.B.; Bridi, F.R. Plasticidade Cerebral e Aprendizagem: Abordagem Multidisciplinar; Artmed Editora: Porto Alegre, Brazil, 2018; pp. 101–105. [Google Scholar]
- Wolpaw, J.R.; Birbaumer, N.; McFarland, D.J.; Pfurtscheller, G.; Vaughan, T.M. Brain computer interfaces for communication and control. Clin. Neurophysiol. 2002, 113, 767–791. [Google Scholar] [CrossRef] [PubMed]
- Fleur, K.; Cassady, K.; Doud, A.; Shades, K.; Rogin, E.; He, B. Quadcopter control in three-dimensional space using a noninvasive motor imagery-based brain-computer interface. J. Neural Eng. 2013, 10, 046003. [Google Scholar] [CrossRef]
- Vaz, Y. Extração de Características para a Classificação de Imagética Motora em Interfaces Cérebro-Computador. Master’s Thesis, Universidade de São Paulo, São Carlos, Brazil, 2016. [Google Scholar]
- Gonçalves, W.O. Um Estudo dos Sinais de Eletroencefalograma e Eletrodermal no Aprendizado por Reforço de uma Interface Cérebro-Máquina. Master’s Thesis, Universidade Federal Rural Rio de Janeiro, Seropédia, Brazil, 2017. [Google Scholar]
- Bashashati, A.; Fatourechi, M.; Ward, R.K.; Birch, G.E. A survey of signal processing algorithms in brain–computer interfaces based on electrical brain signals. J. Neural Eng. 2007, 4, R32–R57. [Google Scholar] [CrossRef] [PubMed]
- Rodriguez-Bermudez, G.; Garcia-Laencina, P.J.; Roca-Gonzalez, J.; Roca-Dorda, J. Efficient feature selection and linear discrimination of EEG signals. Neurocomputing 2013, 115, 161–165. [Google Scholar] [CrossRef]
- Baptista, I.A.C.S. Desenvolvimento de um jogo controlado através de potenciais EEG estacionários evocados visualmente. Master’s Thesis, Universidade de Coimbra, Coimbra, Portugal, 2015. [Google Scholar]
- Craik, A.; He, Y.; Contreras-Vidal, J.L. Deep learning for electroencephalogram (EEG) classification tasks: A review. J. Neural Eng. 2019, 16, 031001. [Google Scholar] [CrossRef] [PubMed]
- Andrade, M.K.S. Detecção e Classificação de Imagética Motora Utilizando Sinais de EEG e Aprendizagem de Máquina. Master’s Thesis, Programa de Pós-graduação em Engenharia Biomédica, UFPE, Recife, Brazil, 2019. [Google Scholar]
- Amin, S.U.; Alsulaiman, M.; Muhammad, G.; Mekhtiche, M.A.; Hossainc, M. Deep Learning for EEG motor imagery classification based on multi-layer CNNs feature fusion. Future Gener. Comput. Syst. 2019, 101, 542–554. [Google Scholar] [CrossRef]
- Sadiq, M.T.; Yu, X.; Yuan, Z.; Fan, Z.; Rehman, A.U.; Li, G.; Xiao, G. Motor Imagery EEG Signals Classification Based on Mode Amplitude and Frequency Components Using Empirical Wavelet Transform. IEEE Access 2019, 7, 127678–127692. [Google Scholar] [CrossRef]
- Liu, D.; Chen, W.; Lee, K.; Chavarriaga, R.; Bouri, M.; Pei, Z.; Millan, J.R. Brain-actuated gait trainer with visual and proprioceptive feedback. J. Neural Eng. 2017, 14, 056017. [Google Scholar] [CrossRef]
- Lazurenkoa, D.M.; Kiroy, V.N.; Shepelev, I.E.; Podladchikovaa, L.N. Motor Imagery-based Brain-Computer Interface: Neural Network Approach. Opt. Mem. Neural Netw. 2019, 28, 109–117. [Google Scholar] [CrossRef]
- Meziani, A.; Djouani, K.; Medkour, T.; Chibania, A. A Lasso quantile periodogram based feature extraction for EEG-based motor imagery. J. Neurosci. Methods 2019, 328, 108434. [Google Scholar] [CrossRef] [PubMed]
- Rieiro, H.; Diaz-Piedra, C.; Morales, J.M.; Catena, A.; Romero, S.; Roca-Gonzalez, J.; Fuentes, L.J.; Stasi, L.L.D. Validation of Electroencephalographic Recordings Obtained with a Consumer-Grade, Single Dry Electrode, Low-Cost Device: A Comparative Study. Sensors 2019, 19, 2808. [Google Scholar] [CrossRef] [PubMed]
- Rasheeda, B.Y.; Syed, M.; Rashmi, K.V.; Syed, Z.; Chetan, S. Mindwave based robot control and home automation. Int. J. Adv. Res. Comput. Sci. 2018, 9, 214–217. [Google Scholar]
- Girase, P.D.; Deshmukh, M.P. Mindwave Device Wheelchair Control. Int. J. Sci. Res. 2016, 5, 2172–2176. [Google Scholar] [CrossRef]
- Siswoyo, A.; Arief, Z.; Sulistijono, I.A. Application of Artificial Neural Networks in Modeling Direction Wheelchairs Using Neurosky Mindset Mobile (EEG) Device. Int. J. Eng. Technol. 2017, 5, 170–191. [Google Scholar] [CrossRef]
- Berlin Brain-Computer Interface Website. Available online: http://www.bbci.de/about (accessed on 24 January 2023).
- Teplan, M. Fundamental of EEG Measurement. Meas. Sci. Rev. 2002, 2, 1–11. [Google Scholar]
- Correia, A.G.G. Filtro Notch para Aplicações em EEGs e ECGs, com Recurso a Técnicas de F&H em CMOS. Master’s Thesis, Faculdade de Engenharia—Universidade do Porto, Porto, Portugal, 2010. [Google Scholar]
- Lo, P.C.; Leu, J.S. Adaptive Baseline Correction of Meditation EEG. Am. J. Electroneurodiagnostic Technol. 2001, 41, 142–155. [Google Scholar] [CrossRef]
- Goodfellow, I.; Bengio, Y.; Courville, A. Deep Learning; MIT Press: Cambridge, MA, USA, 2016. [Google Scholar]
- Sutton, R.; Barto, A. Reinforcement Learning: An Introduction; MIT Press: Cambridge, MA, USA, 2018. [Google Scholar]
- Breiman, L.; Friedman, J.H.; Olshen, R.A.; Stone, C.J. Classification and Regression Trees; Routledge: New York, NY, USA, 2017. [Google Scholar]
- Brito Guerra, T.C. Machine Learning Based Handover Management for LTE Networks with Coverage Holes. Master’s Thesis, Programa de Pós-graduação em Engenharia Elétrica e da Computação—UFRN, Natal, Brazil, 2018. [Google Scholar]
- Russell, S.; Norvig, P. Artificial Intelligence: A Modern Approach, 3rd ed.; Prentice Hall Press: Upper Saddle River, NJ, USA, 2009. [Google Scholar]
- Richards, K. Machine Learning: For Beginners—Your Comprehensive Guide For Markov Models, Reinforced Learning, Model Evaluation, SVM, Naïves Bayes Classifier; CreateSpace Independent Publishing Platform: Scotts Valley, CA, USA, 2018. [Google Scholar]
- Brain Products Website. Available online: https://www.brainproducts.com/productdetails.php?id=15 (accessed on 24 January 2023).
- Mindwave Website. Available online: http://neurosky.com/biosensors/eeg-sensor/biosensors/ (accessed on 24 January 2023).
- Open VIBE Website. Available online: http://openvibe.inria.fr (accessed on 24 January 2023).
- Cedrus Website. Available online: https://cedrus.com/stimtracker/index.htm (accessed on 24 January 2023).


| Reference | Motor Imagery | Data Acquisition | ML Technique |
|---|---|---|---|
| Amin et al. [16] | Yes | Public dataset | Convolutional Neural Networks |
| Banu et al. [22] | No | Mindwave | - |
| Girase et al. [23] | Yes | Mindwave | - |
| Lazurenko et al. [19] | Yes | EEG monopolarly from 13 standard leads | Neural Networks |
| Liu et al. [18] | Yes | BioSemi | Random Forest |
| Meziani et al. [20] | Yes | 32 active dry electrode kit | Random Forest, K-Nearest Neighbors, Neural Networks, Support Vector Machines and Linear Discriminant Analysis |
| Rieiro et al. [21] | No | Mindwave and SOMNOwatch | - |
| Sadiq et al. [17] | Yes | Public dataset | Support Vector Machines |
| Siswoyo et al. [24] | No | Neurosky mindset | Neural Networks |
| Machine | Moments | Channels |
|---|---|---|
| A | 2 and 4 | Fp2 and F4 |
| B0 | 6 | C3 and O2 |
| B1 | 2, 4 and 6 | F3 and P3 |
| C0 | 3, 5, 7, 8, 9 and 10 | Cz, C4 and Pz |
| C1 | 4, 6, 8 and 10 | F3 and F4 |
| C2 | 8 | O2 |
| C3 | 2, 4, 6, 8 and 10 | P3, Pz, P4, O1 and O2 |
| Machine | Moments |
|---|---|
| A | 2, 3, 4, 5, 6 and 7 |
| B0 | 2 e 4 |
| B1 | 2, 3, 4, and 6 |
| C0 | 2, 3, 4, 5, 6, 7 and 8 |
| C1 | 2, 4, 5, 7, and 9 |
| C2 | 6 and 8 |
| C3 | 2, 4, 6, 7 and 8 |
Disclaimer/Publisher’s Note: The statements, opinions and data contained in all publications are solely those of the individual author(s) and contributor(s) and not of MDPI and/or the editor(s). MDPI and/or the editor(s) disclaim responsibility for any injury to people or property resulting from any ideas, methods, instructions or products referred to in the content. |
© 2023 by the authors. Licensee MDPI, Basel, Switzerland. This article is an open access article distributed under the terms and conditions of the Creative Commons Attribution (CC BY) license (https://creativecommons.org/licenses/by/4.0/).
Share and Cite
de Brito Guerra, T.C.; Nóbrega, T.; Morya, E.; de M. Martins, A.; de Sousa, V.A., Jr. Electroencephalography Signal Analysis for Human Activities Classification: A Solution Based on Machine Learning and Motor Imagery. Sensors 2023, 23, 4277. https://doi.org/10.3390/s23094277
de Brito Guerra TC, Nóbrega T, Morya E, de M. Martins A, de Sousa VA Jr. Electroencephalography Signal Analysis for Human Activities Classification: A Solution Based on Machine Learning and Motor Imagery. Sensors. 2023; 23(9):4277. https://doi.org/10.3390/s23094277
Chicago/Turabian Stylede Brito Guerra, Tarciana C., Taline Nóbrega, Edgard Morya, Allan de M. Martins, and Vicente A. de Sousa, Jr. 2023. "Electroencephalography Signal Analysis for Human Activities Classification: A Solution Based on Machine Learning and Motor Imagery" Sensors 23, no. 9: 4277. https://doi.org/10.3390/s23094277
APA Stylede Brito Guerra, T. C., Nóbrega, T., Morya, E., de M. Martins, A., & de Sousa, V. A., Jr. (2023). Electroencephalography Signal Analysis for Human Activities Classification: A Solution Based on Machine Learning and Motor Imagery. Sensors, 23(9), 4277. https://doi.org/10.3390/s23094277