


Decentralized Real-Time Anomaly Detection in Cyber-Physical Production Systems under Industry Constraints


Abstract
1. Introduction
2. Related Work
3. Problem Statement
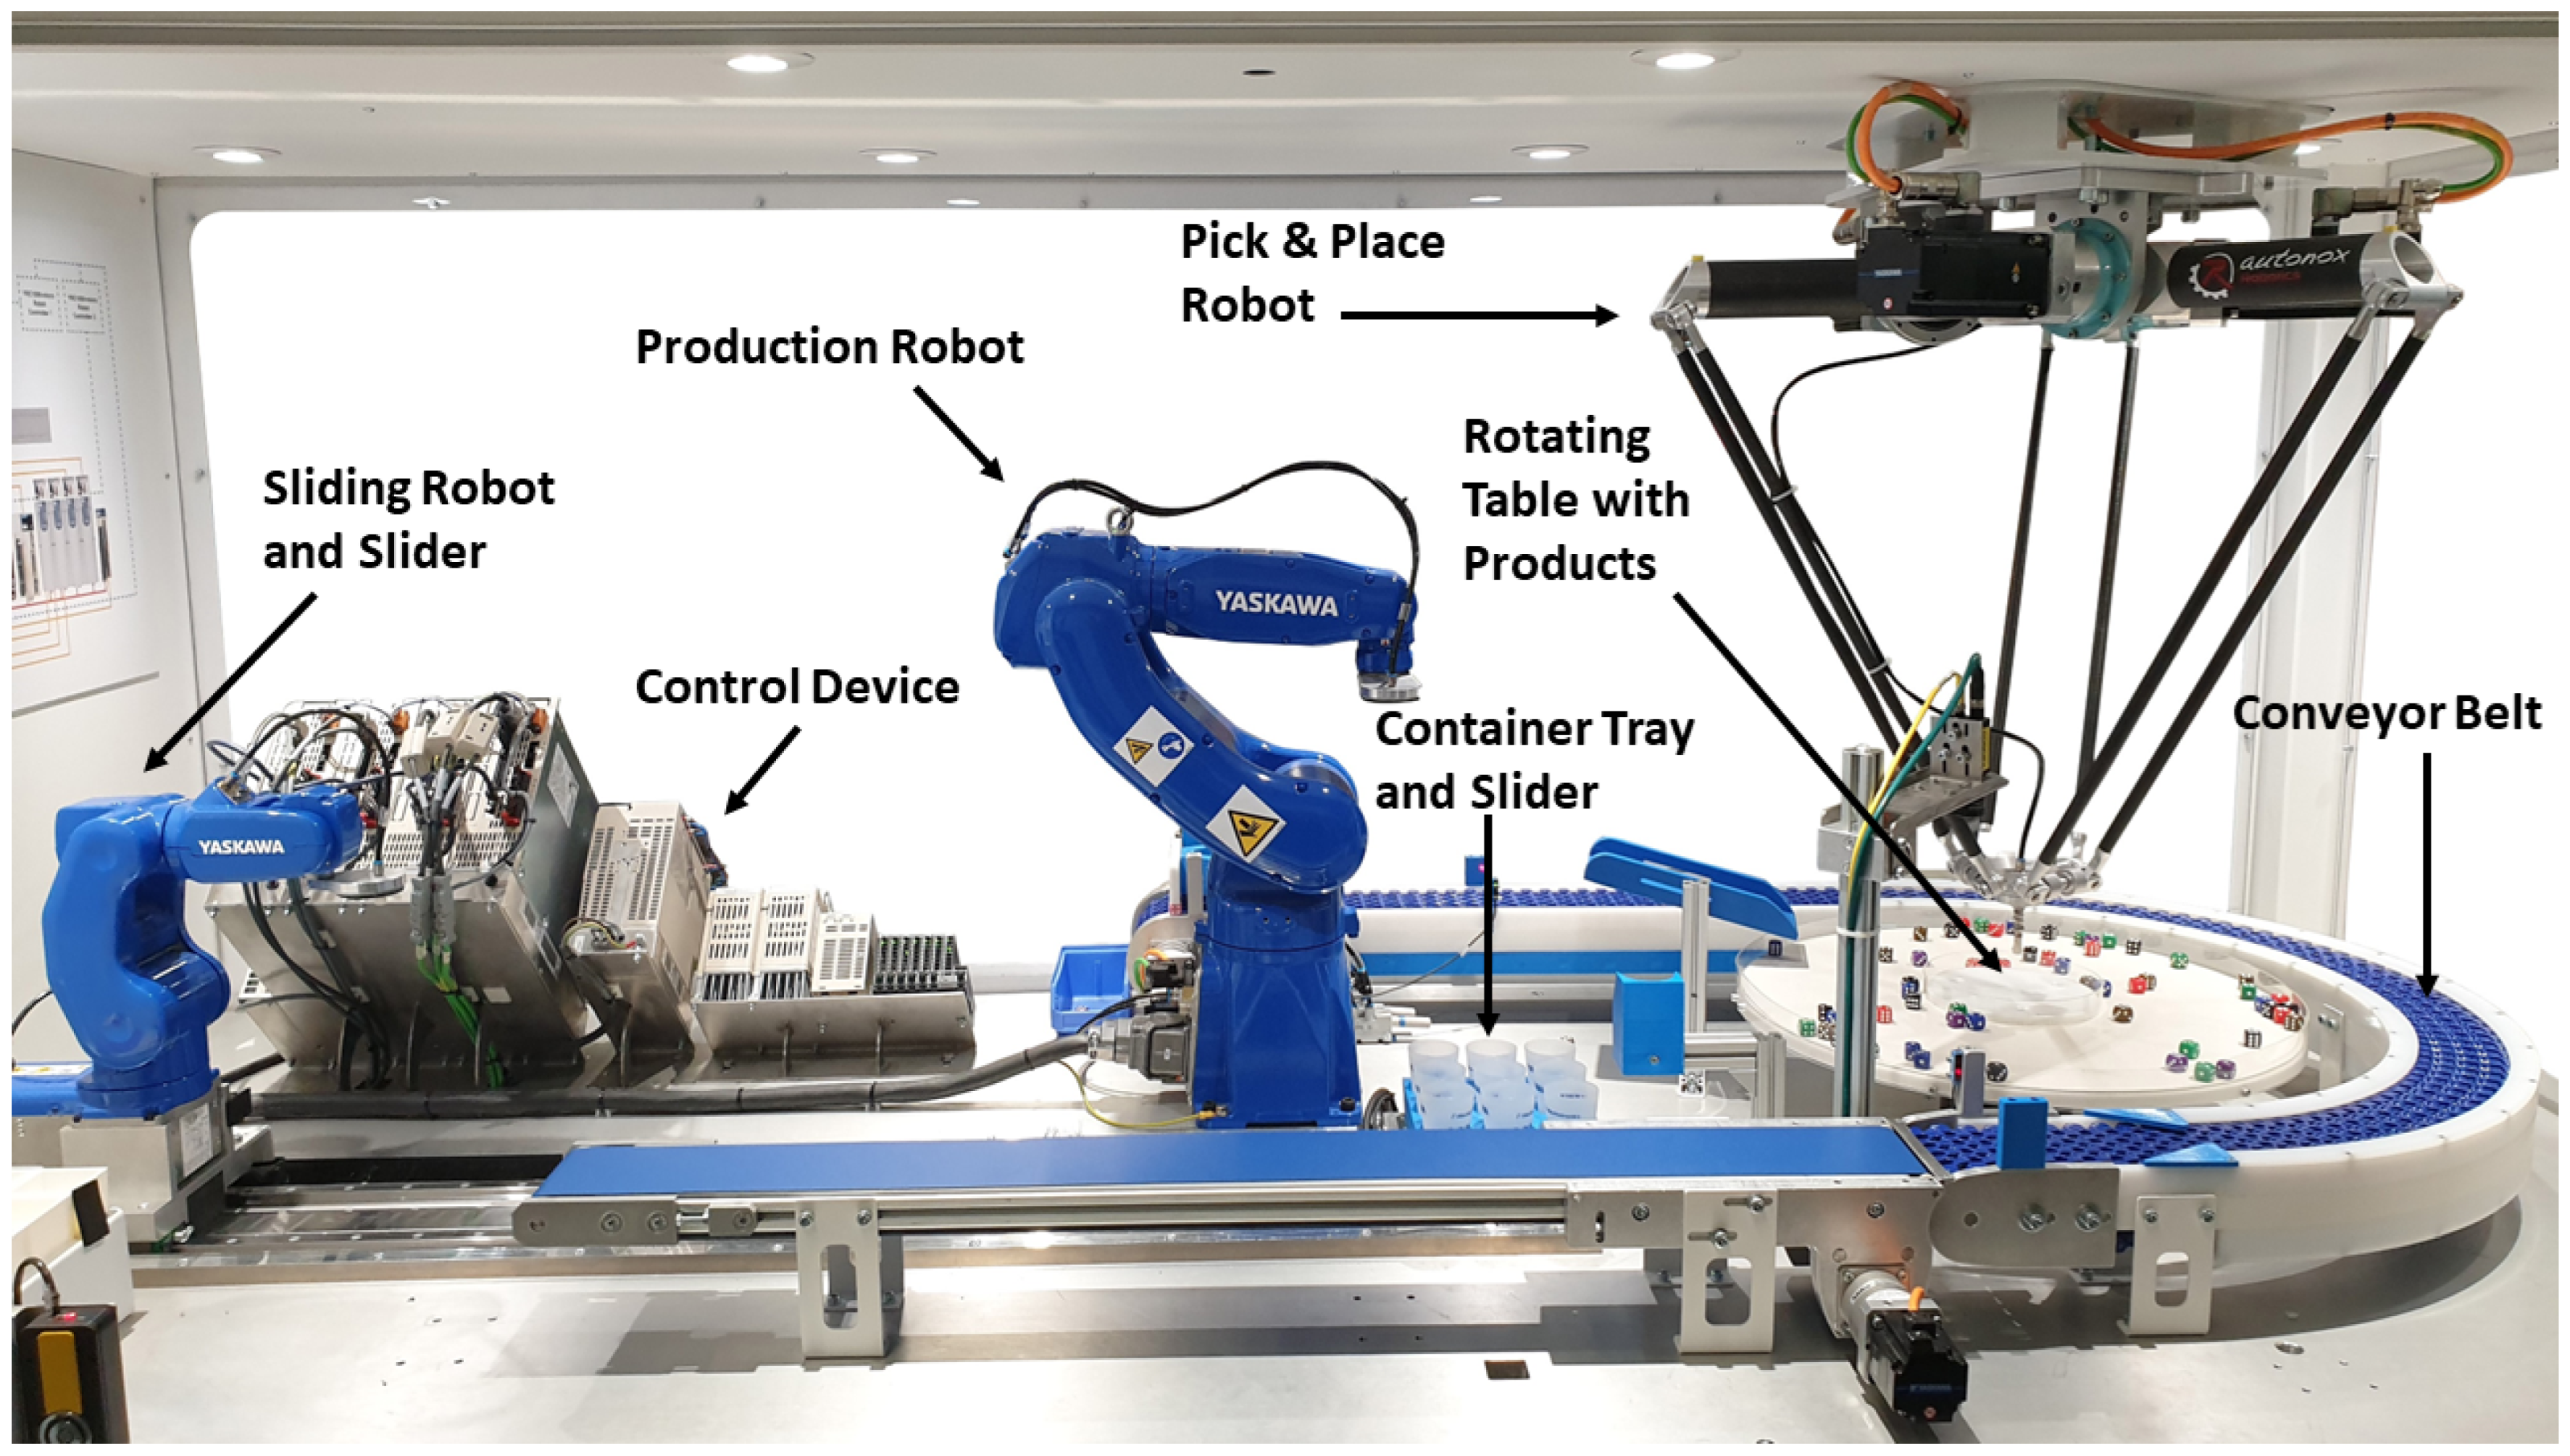
- Anomaly detection: An anomaly detection for a CPPS, such as an industrial production system, shall be performed. The CPPS consists of multiple CPSs producing multivariate time series data over variable process lengths, for example, the sliding robot from the CPPS in Figure 2, combining a robot with several axes and a robotic controller to move containers on a conveyor belt.
- Real-time: To cover all different kinds of anomalies and react even in time-critical scenarios, such as detecting collisions in the production system, the result and reaction of the anomaly detection should be available as quickly as possible. Therefore, the execution of the anomaly should be performed during production, and the results must be immediately provided after new data from sensors and actors are available, e.g., a few milliseconds after the data is received.
- Prediction quality: For an AD application in an industrial environment, adequate prediction performance is required. This depends on the different use cases for which the anomaly detection is applied, e.g., an F1 score of 0.95 or better for each CPS in the CPPS.
- Configurable: To apply AD on different CPPSs in different applications, the anomaly detection should be adaptable to various CPSs and use cases. The possibility of using the technique for varied time series data with different variable types and diverse time lengths should be given, for instance, robots or transportation systems with features such as torque, position, and speed.
- Data-driven: As mentioned before, manually creating models is time-consuming and requires deep expert knowledge. Simultaneously recording anomalous data from CPPS can be dangerous for the system itself. Therefore, the AD should only be trained with regular production data and without expert knowledge.
- Feasible: The AD should be compatible with current technological standards in industrial environments to realize a generalist integration for various scenarios. This includes constraints and limitations of commonly used CPPSs in production settings:
- (a)
- Process limitations, due to the design of CPSs in industry, that are unable to execute process-intensive tasks in parallel to control and monitor the physical process, e.g., limited available RAM and processing power.
- (b)
- Communication interface constraints of commonly available CPSs in industry, e.g., OPC UA Communication, to transfer the high amount of production data at a sample rate of 2 ms during the sampling process to a database.
4. A Concept for a Fast, Decentralized, and Unsupervised Anomaly Detection in CPPSs
4.1. Overview
4.2. AD Installation
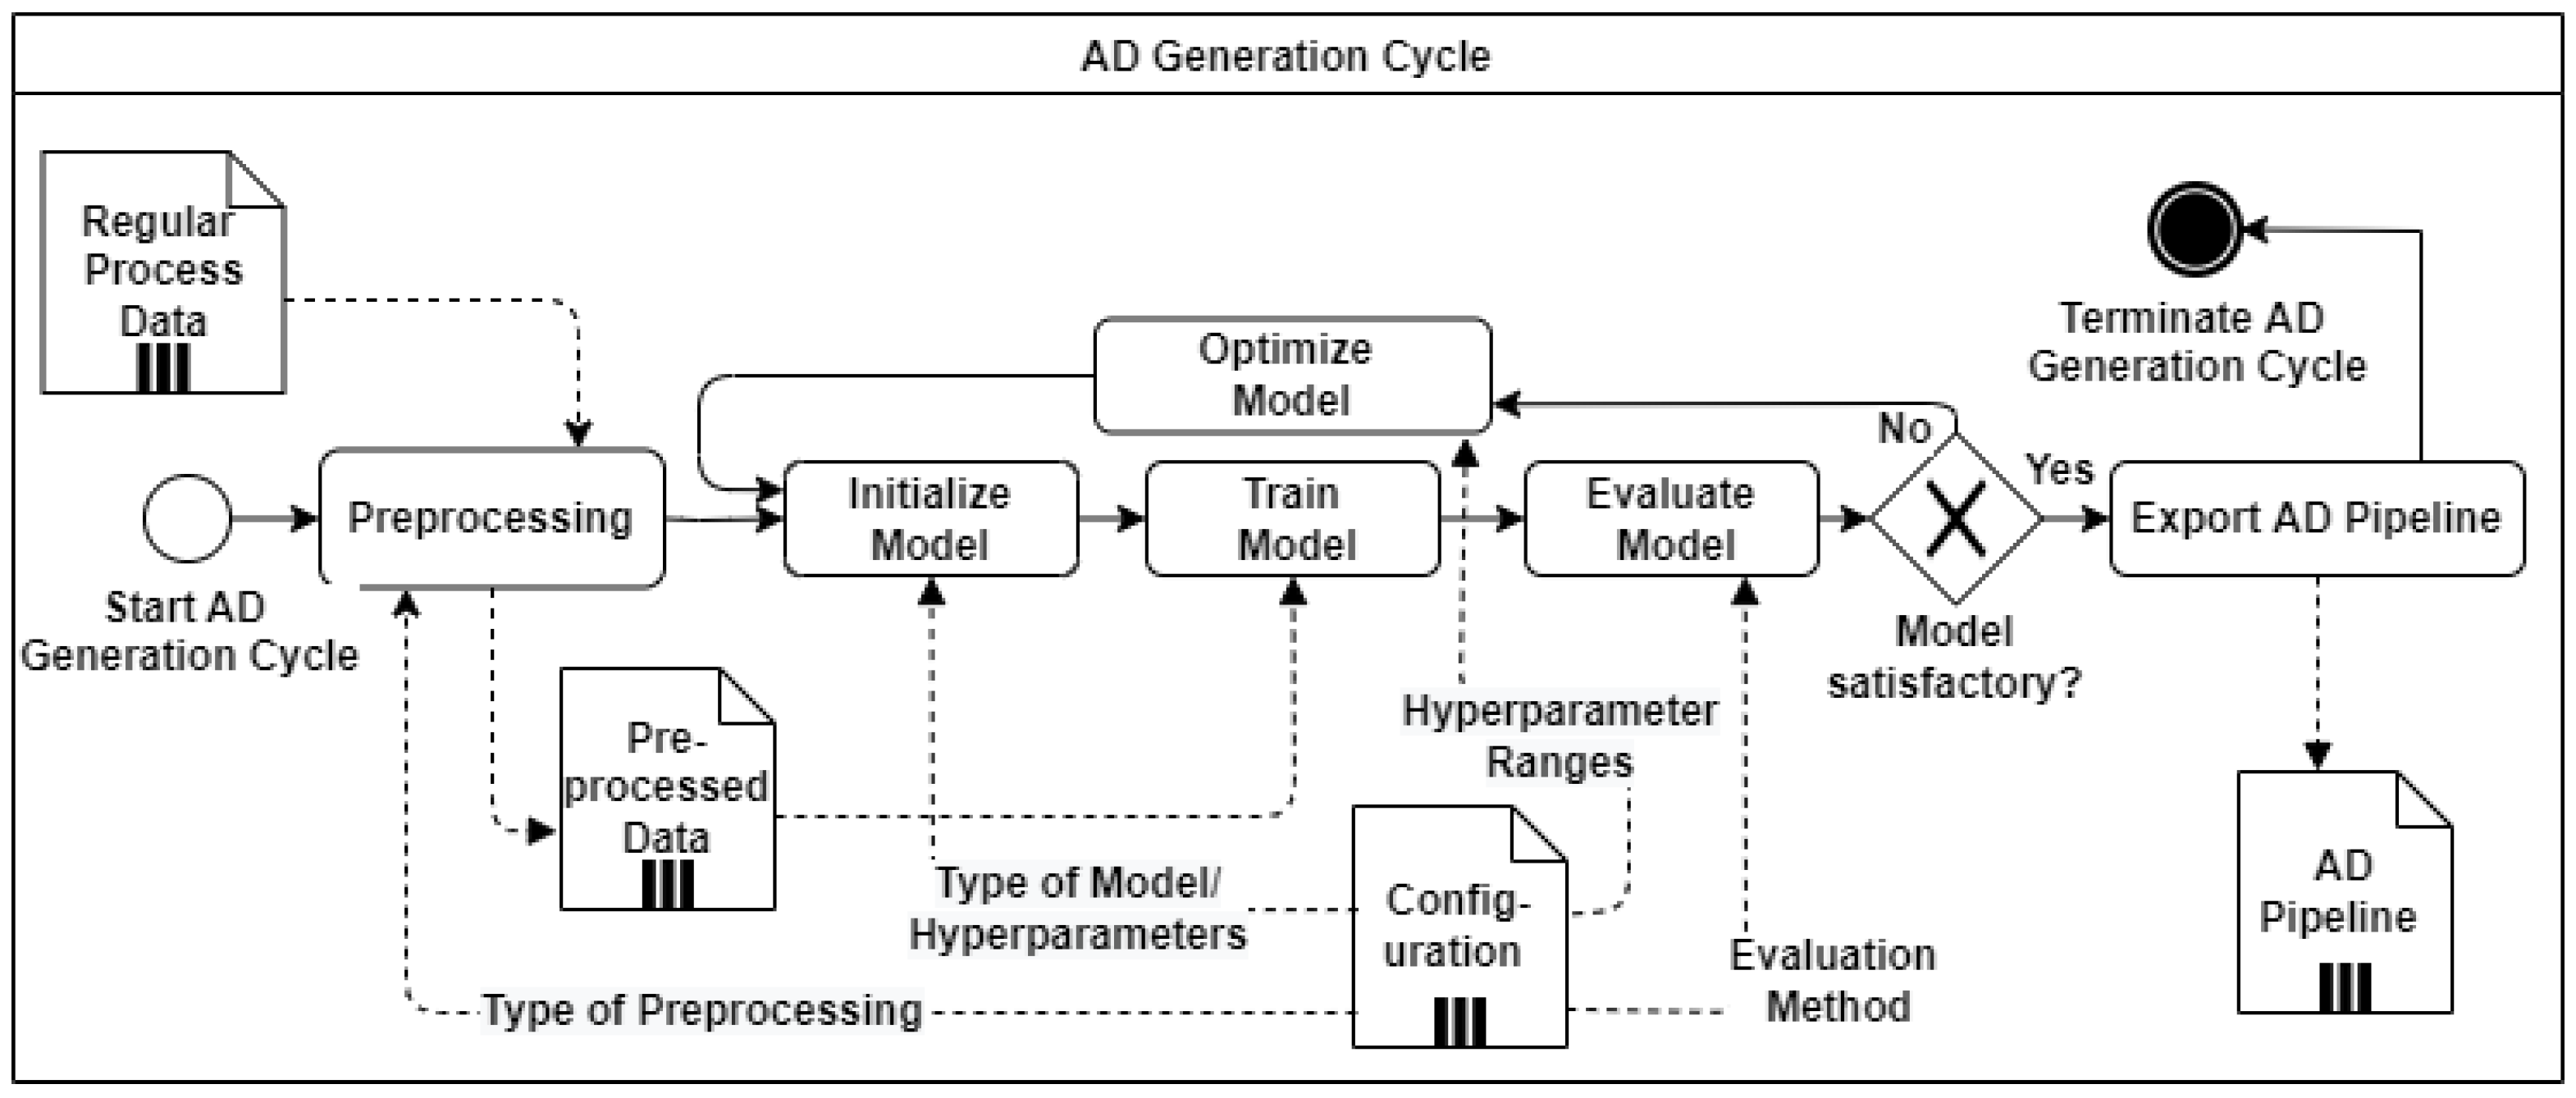
4.3. AD Generation Cycle
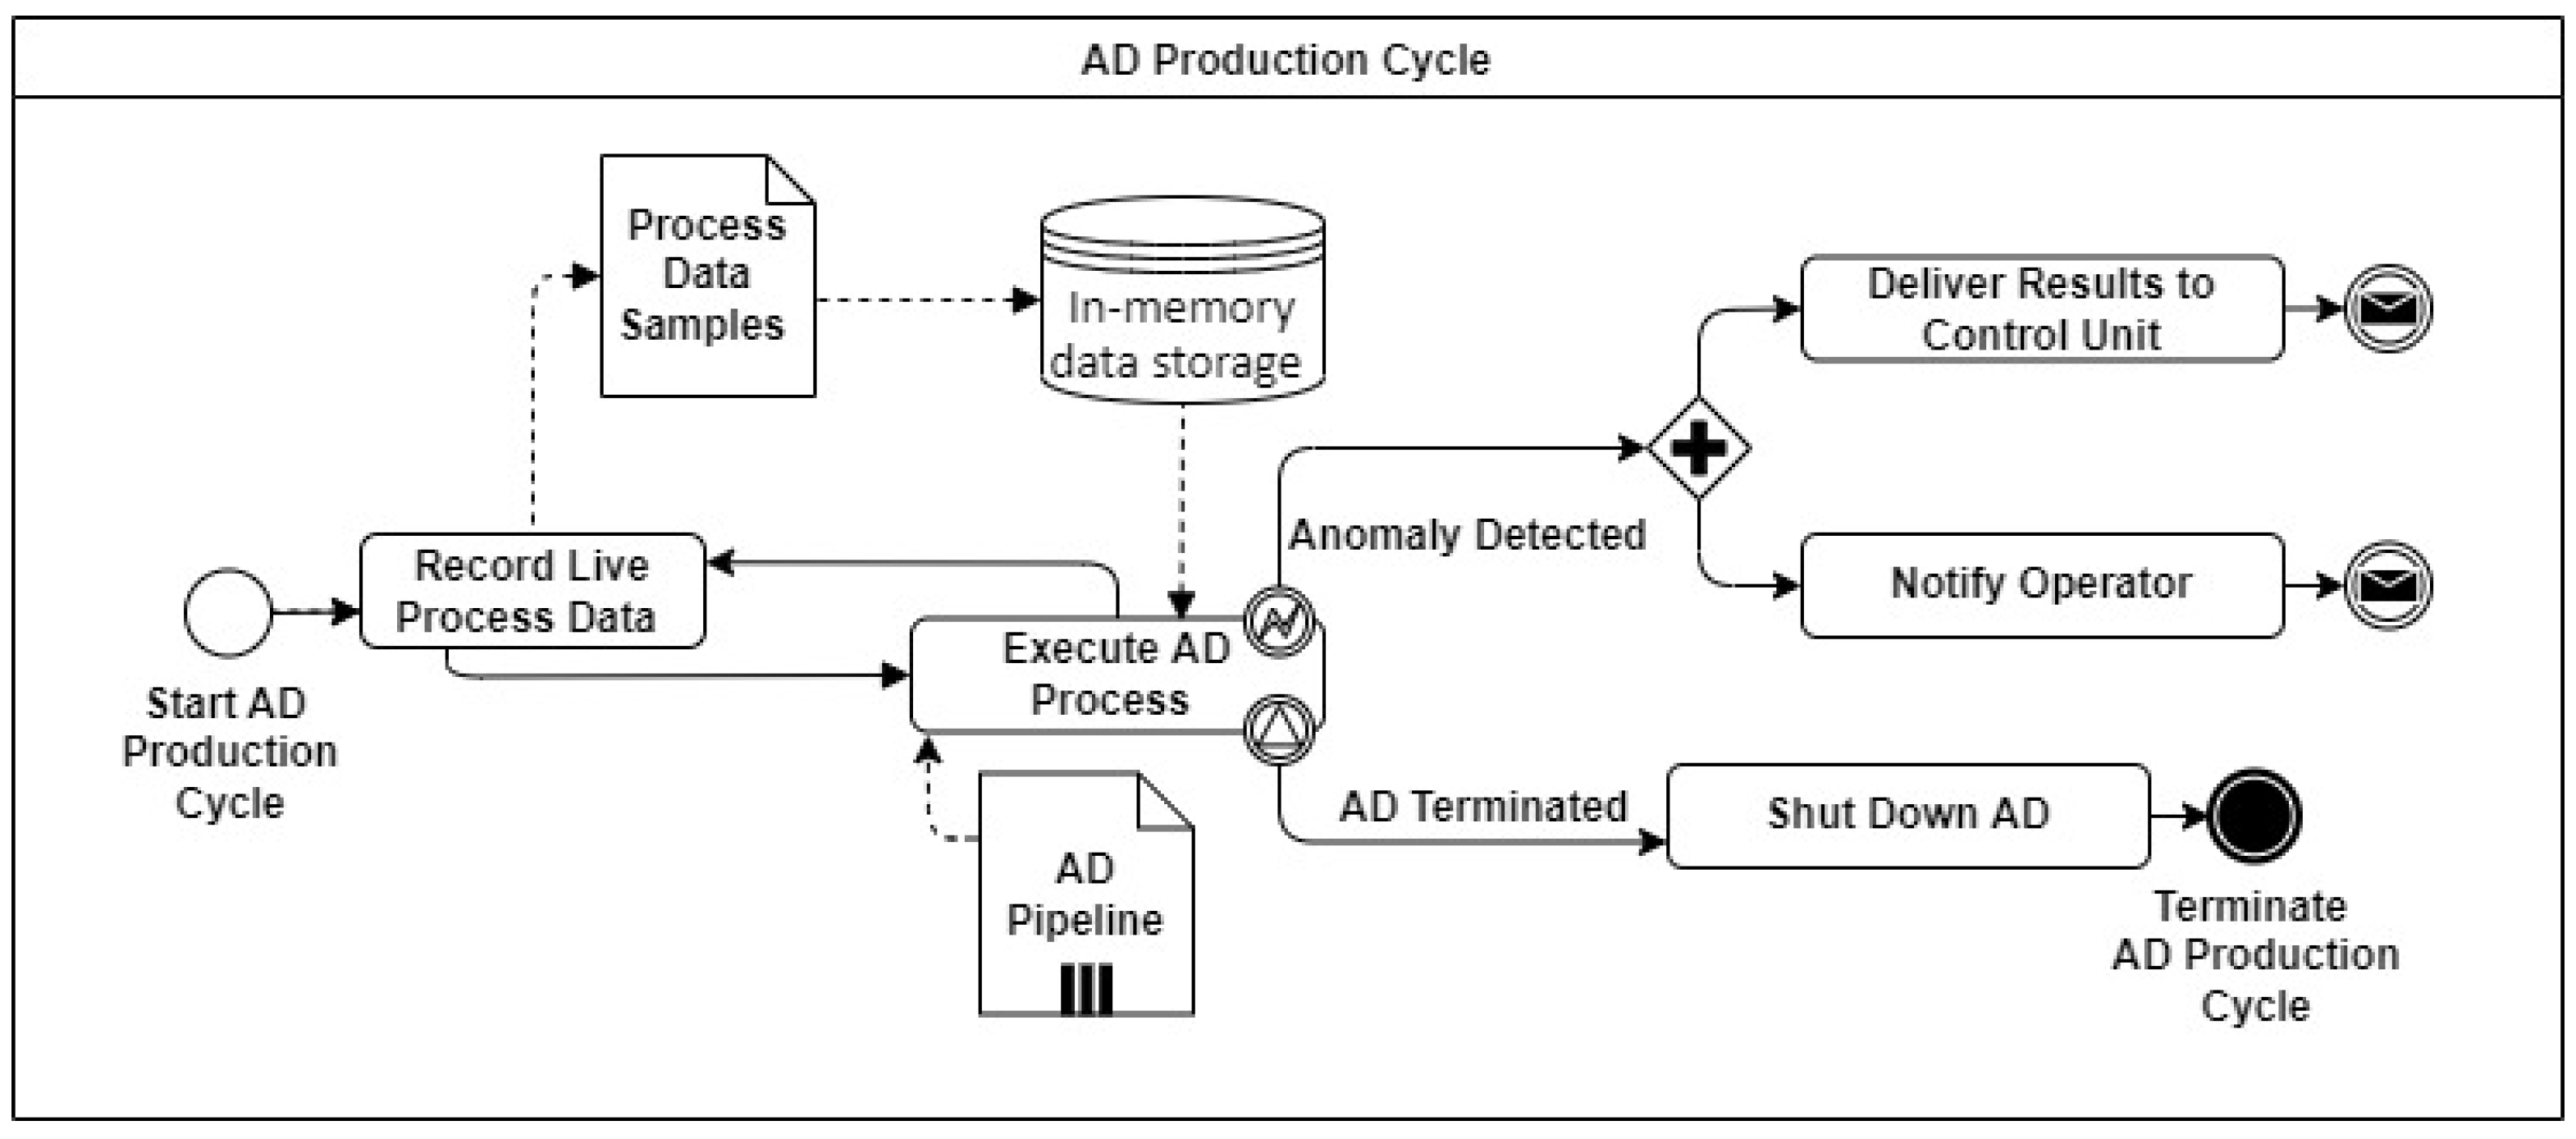
4.4. AD Production Cycle
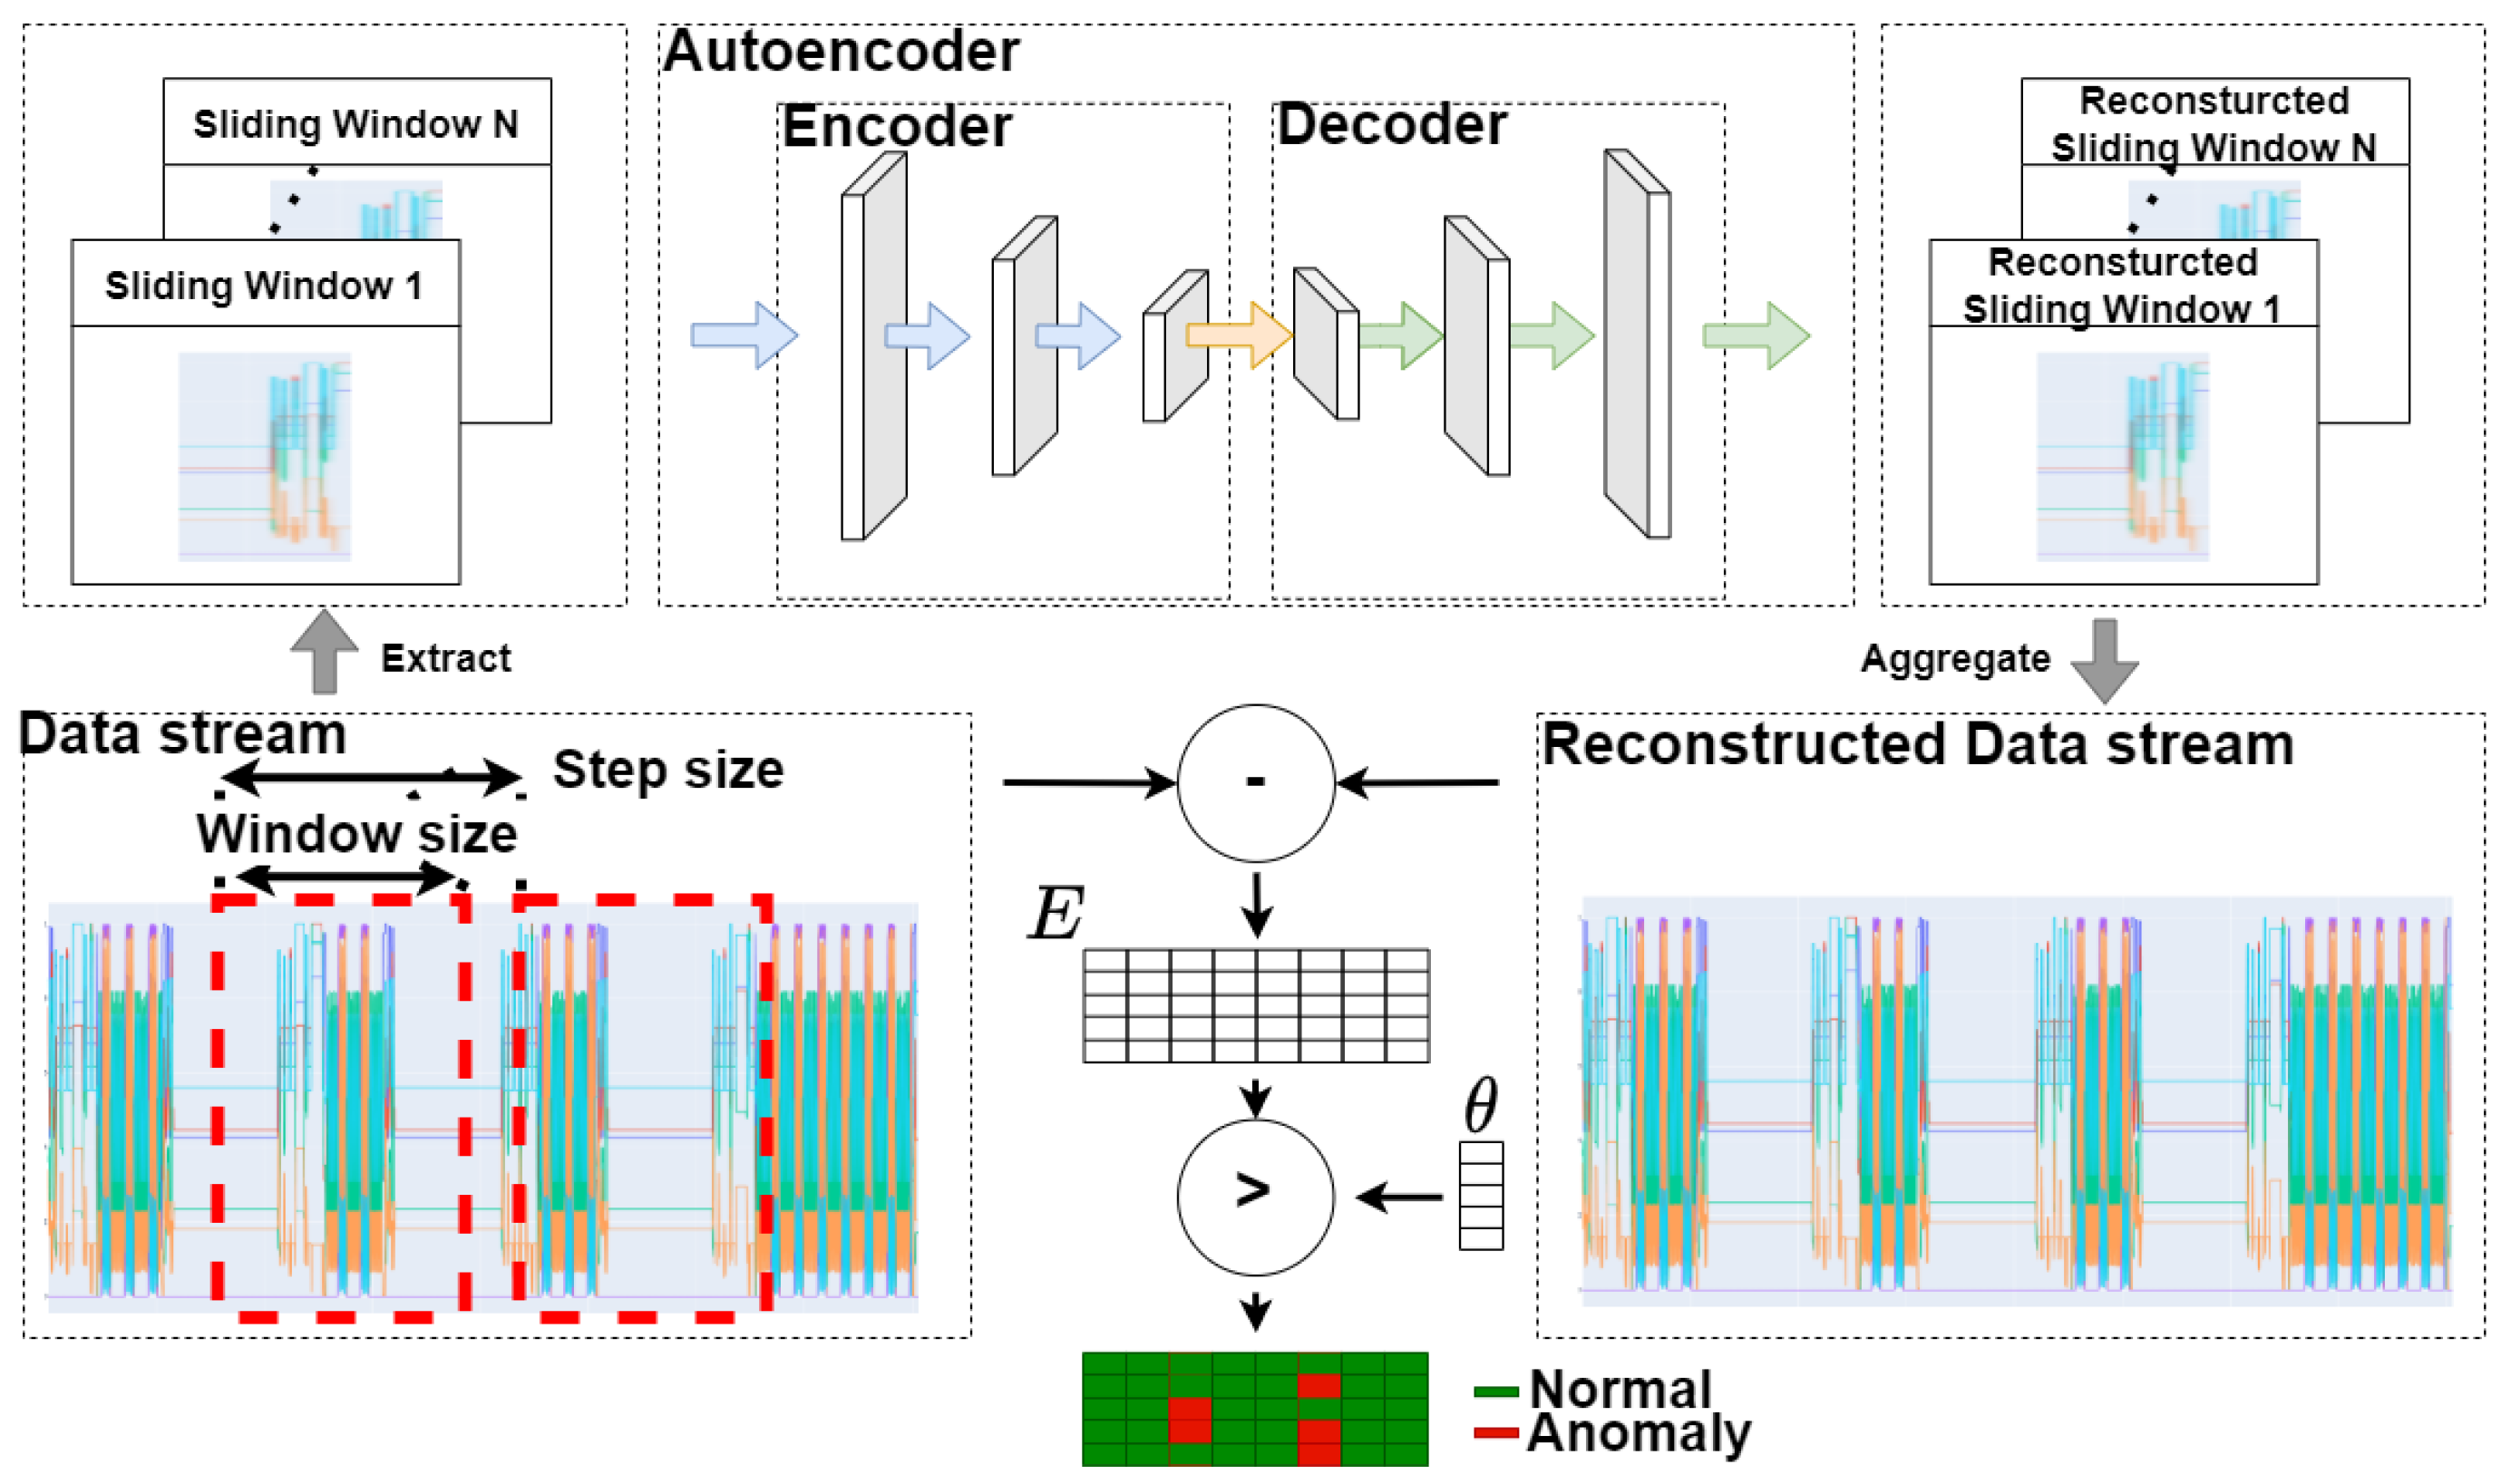
4.5. Sliding Window Convolutional Autoencoder
4.6. Anomaly Detection
5. Prototype Implementation
6. Evaluation
6.1. Experimental Setup
6.2. Data Recording
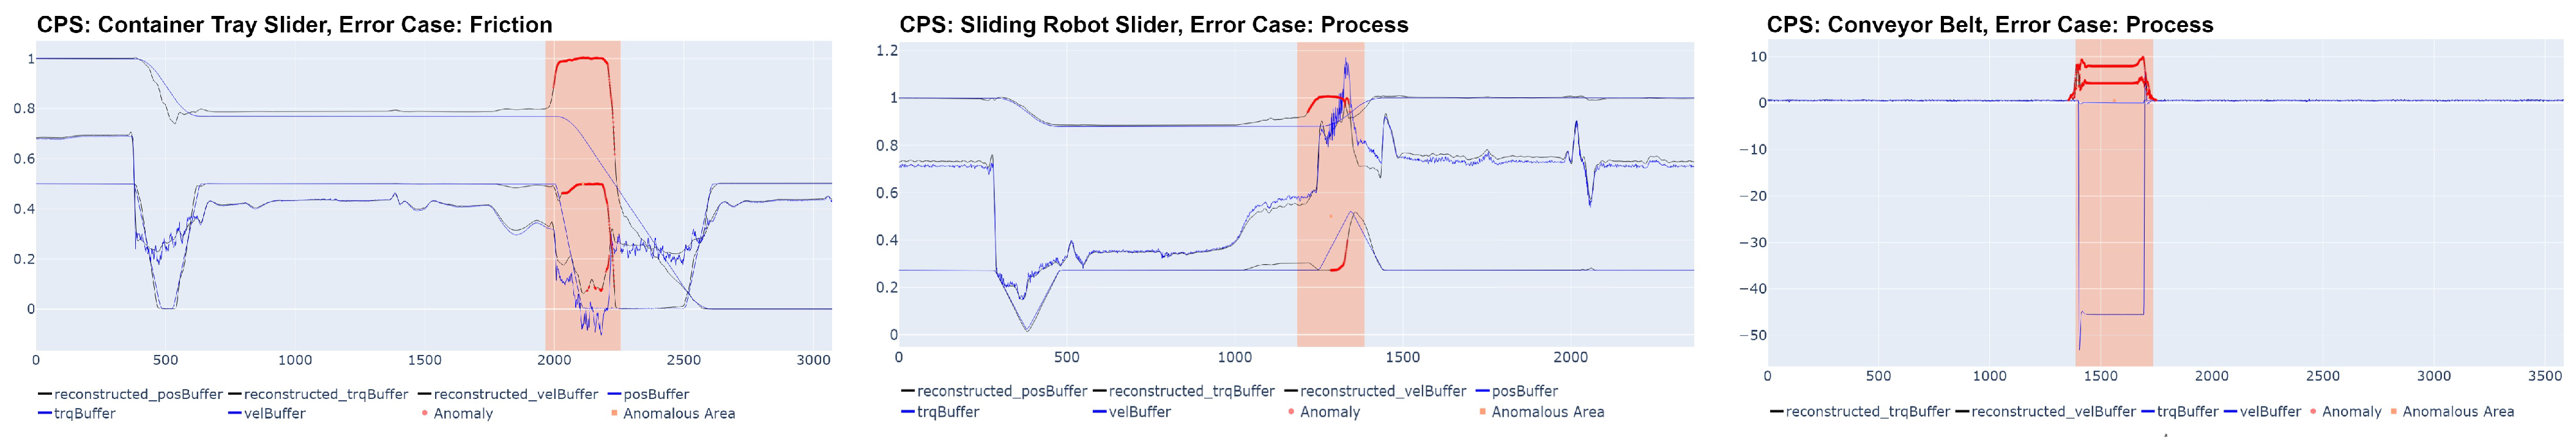
- Friction: To simulate friction, which can result from abrasion of used mechanical components, delayed maintenance, or broken parts, external forces were applied to the mechanical systems of the different CPSs, e.g., against the rotation direction of the conveyor belt or the movement of the linear sliders. This results in increased torque values at the applied CPS.
- Vibration: Undefined vibration, which can be caused by broken bearings or loose attachments, was applied to the mechanical system of the CPS. The simulation was done by manually applying shocks to the rotating table.
- Defect components: Another industry-related anomaly can be caused by defect components in the production process, such as a broken container. To examine this type of anomaly, different containers were manipulated in such a way that they could not be picked by the robots anymore, resulting in an undefined status of the whole production line.
- Incorrect process: In addition, external manipulations can influence industrial production lines. These injections in the normal process can result in some undefined behavior of the system, which can cause damage to the products or the system itself. To simulate this kind of anomaly, the placement of the containers on the belt was changed in the running process. Therefore, the real positions differ from the fixed pre-defined positions in the machine scope.
- Collision: Due to external influences or process errors, even in modern industrial systems, collisions may occur. The system typically detects heavy collisions, whereas smaller collisions resulting in damaged products or fragile components are mostly not recognized by the internal system. This can be, for example, a collision with an obstacle in the moving path of the linear sliders or a displaced product on the conveyor.
6.3. Model Configuration
6.4. Experimental Results
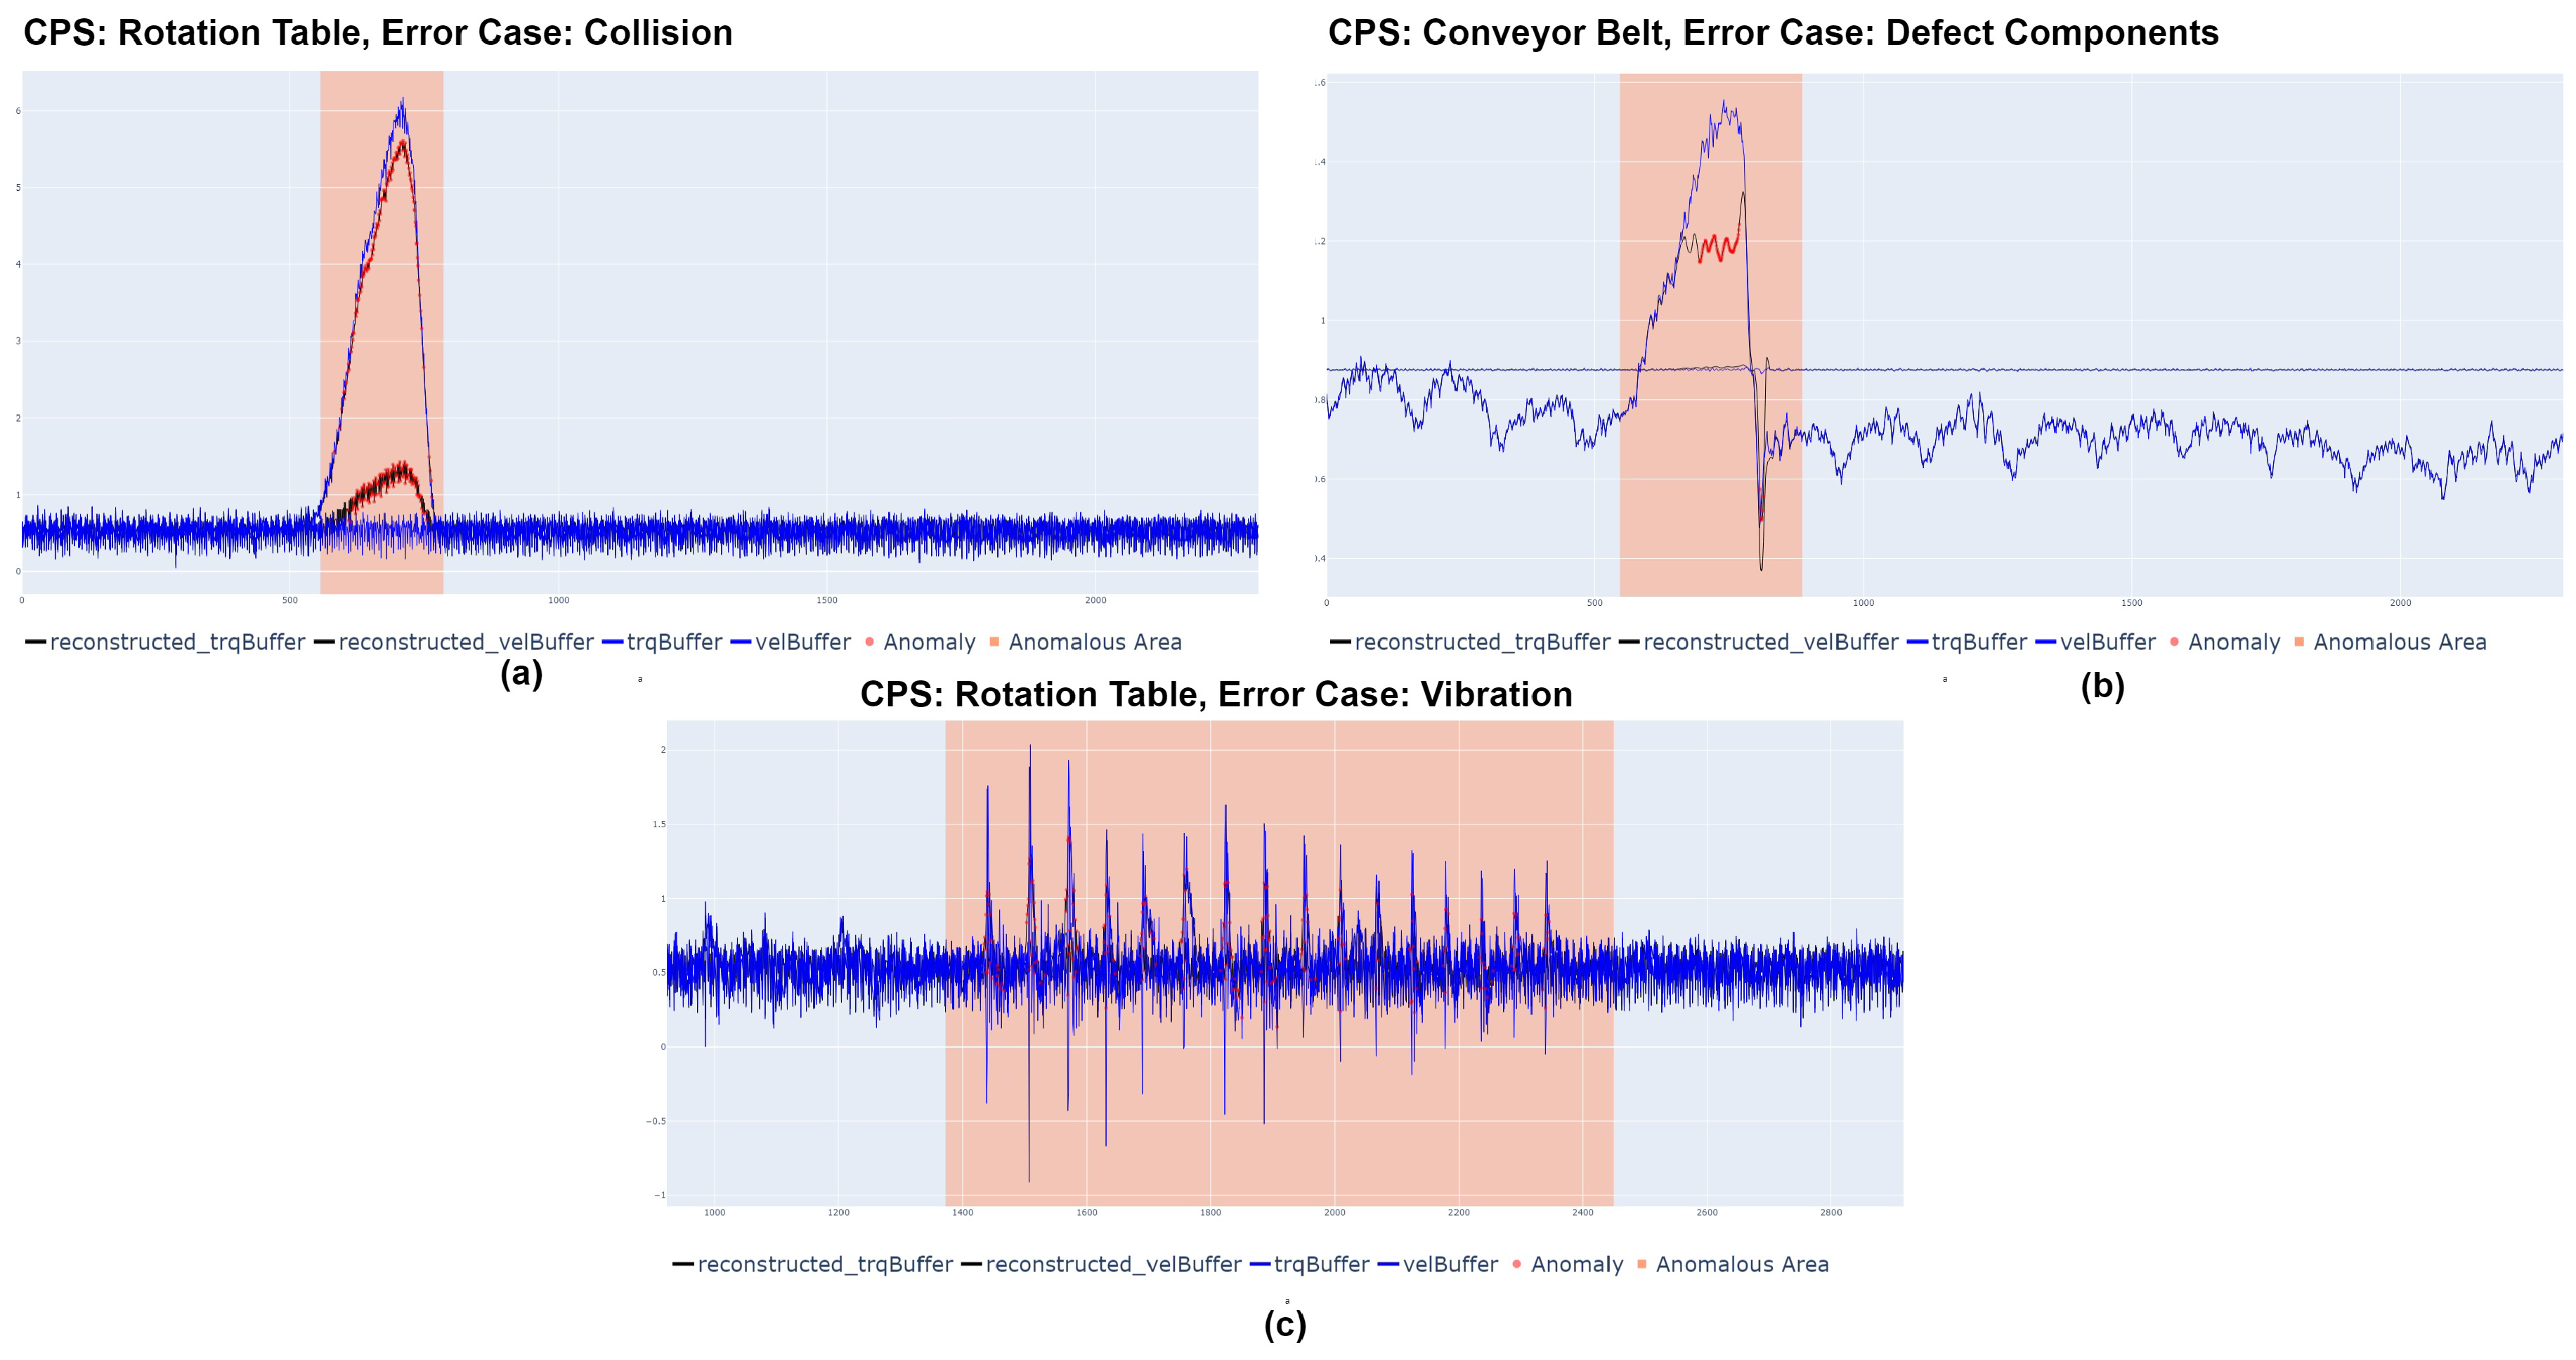
- Anomaly detection:Figure 8 shows some of the forced anomalies in the experimental setup, illustrating the detection performance of the generated models. In the pictures, the detected anomalies are marked with red points, while the pre-defined anomalous areas are indicated by the red background color of the figure. Combined with the results in Table 2, this confirms that the different models can be successfully applied to detect anomalies in the CPSs.
- Real-time: The evaluated sliding window sizes from the hyperparameter tuning were between 32–64, resulting in comparably small windows. To ensure a fast detection in the real process, each generated sliding window was treated as a data stream and evaluated immediately. With a sample rate of 2 ms, the overall time to collect one window as input data for the model is between 64 and 128 ms. The average execution time per reconstruction and verification for anomalies was around 34 ms, with a maximum of 49 ms and a minimum of 22 ms. Therefore, anomaly detection can be carried out with a maximum delay of 177 ms at our setup, which allows an immediate reaction of the system on detected anomalies.
- Prediction quality: The F1 Score is used to evaluate the model performance. The detailed performance for each CPS is shown in Table 2. To calculate the F1 Score, the manually forced anomalies were classified as anomalous areas. If an anomaly in a window was detected, the used window was assigned as anomalous and evaluated against the area. By reaching high F1 Scores above 0.95, adequate prediction performances for every single CPS are realized. This confirms that the automatically created models for each CPS can reliably detect anomalies in the given CPPS.
- Configurable: The described concept and resulting anomaly detection can be configurated for various applications. Only minor changes must be made to the motion controller to enable the sampling process. The automatically generated configuration files can be manually changed, or the default values can be used.
- Data-driven: The models are trained only with the regular process data. Therefore, no anomalous data or feature engineering is needed. No values are added or changed. All removed features are automatically declared. Only the data from the sensors and actors of the CPSs are used. The model is created in an automated way by the configuration file without the need for expert knowledge.
- Feasible: The method utilized standard communication technologies of common industrial setups. By outsourcing the process-intensive tasks to the processing unit backend, the concept enables the application of anomaly detection for the CPPS, even with the processing limitation and constraints of each CPS. In our experimental setup, the simulated process reaches a maximum consumption of 350MB while not exceeding a maximum of 12% CPU load.
7. Conclusions and Future Work
Author Contributions
Funding
Institutional Review Board Statement
Informed Consent Statement
Data Availability Statement
Conflicts of Interest
Appendix A

| Item | Definition |
|---|---|
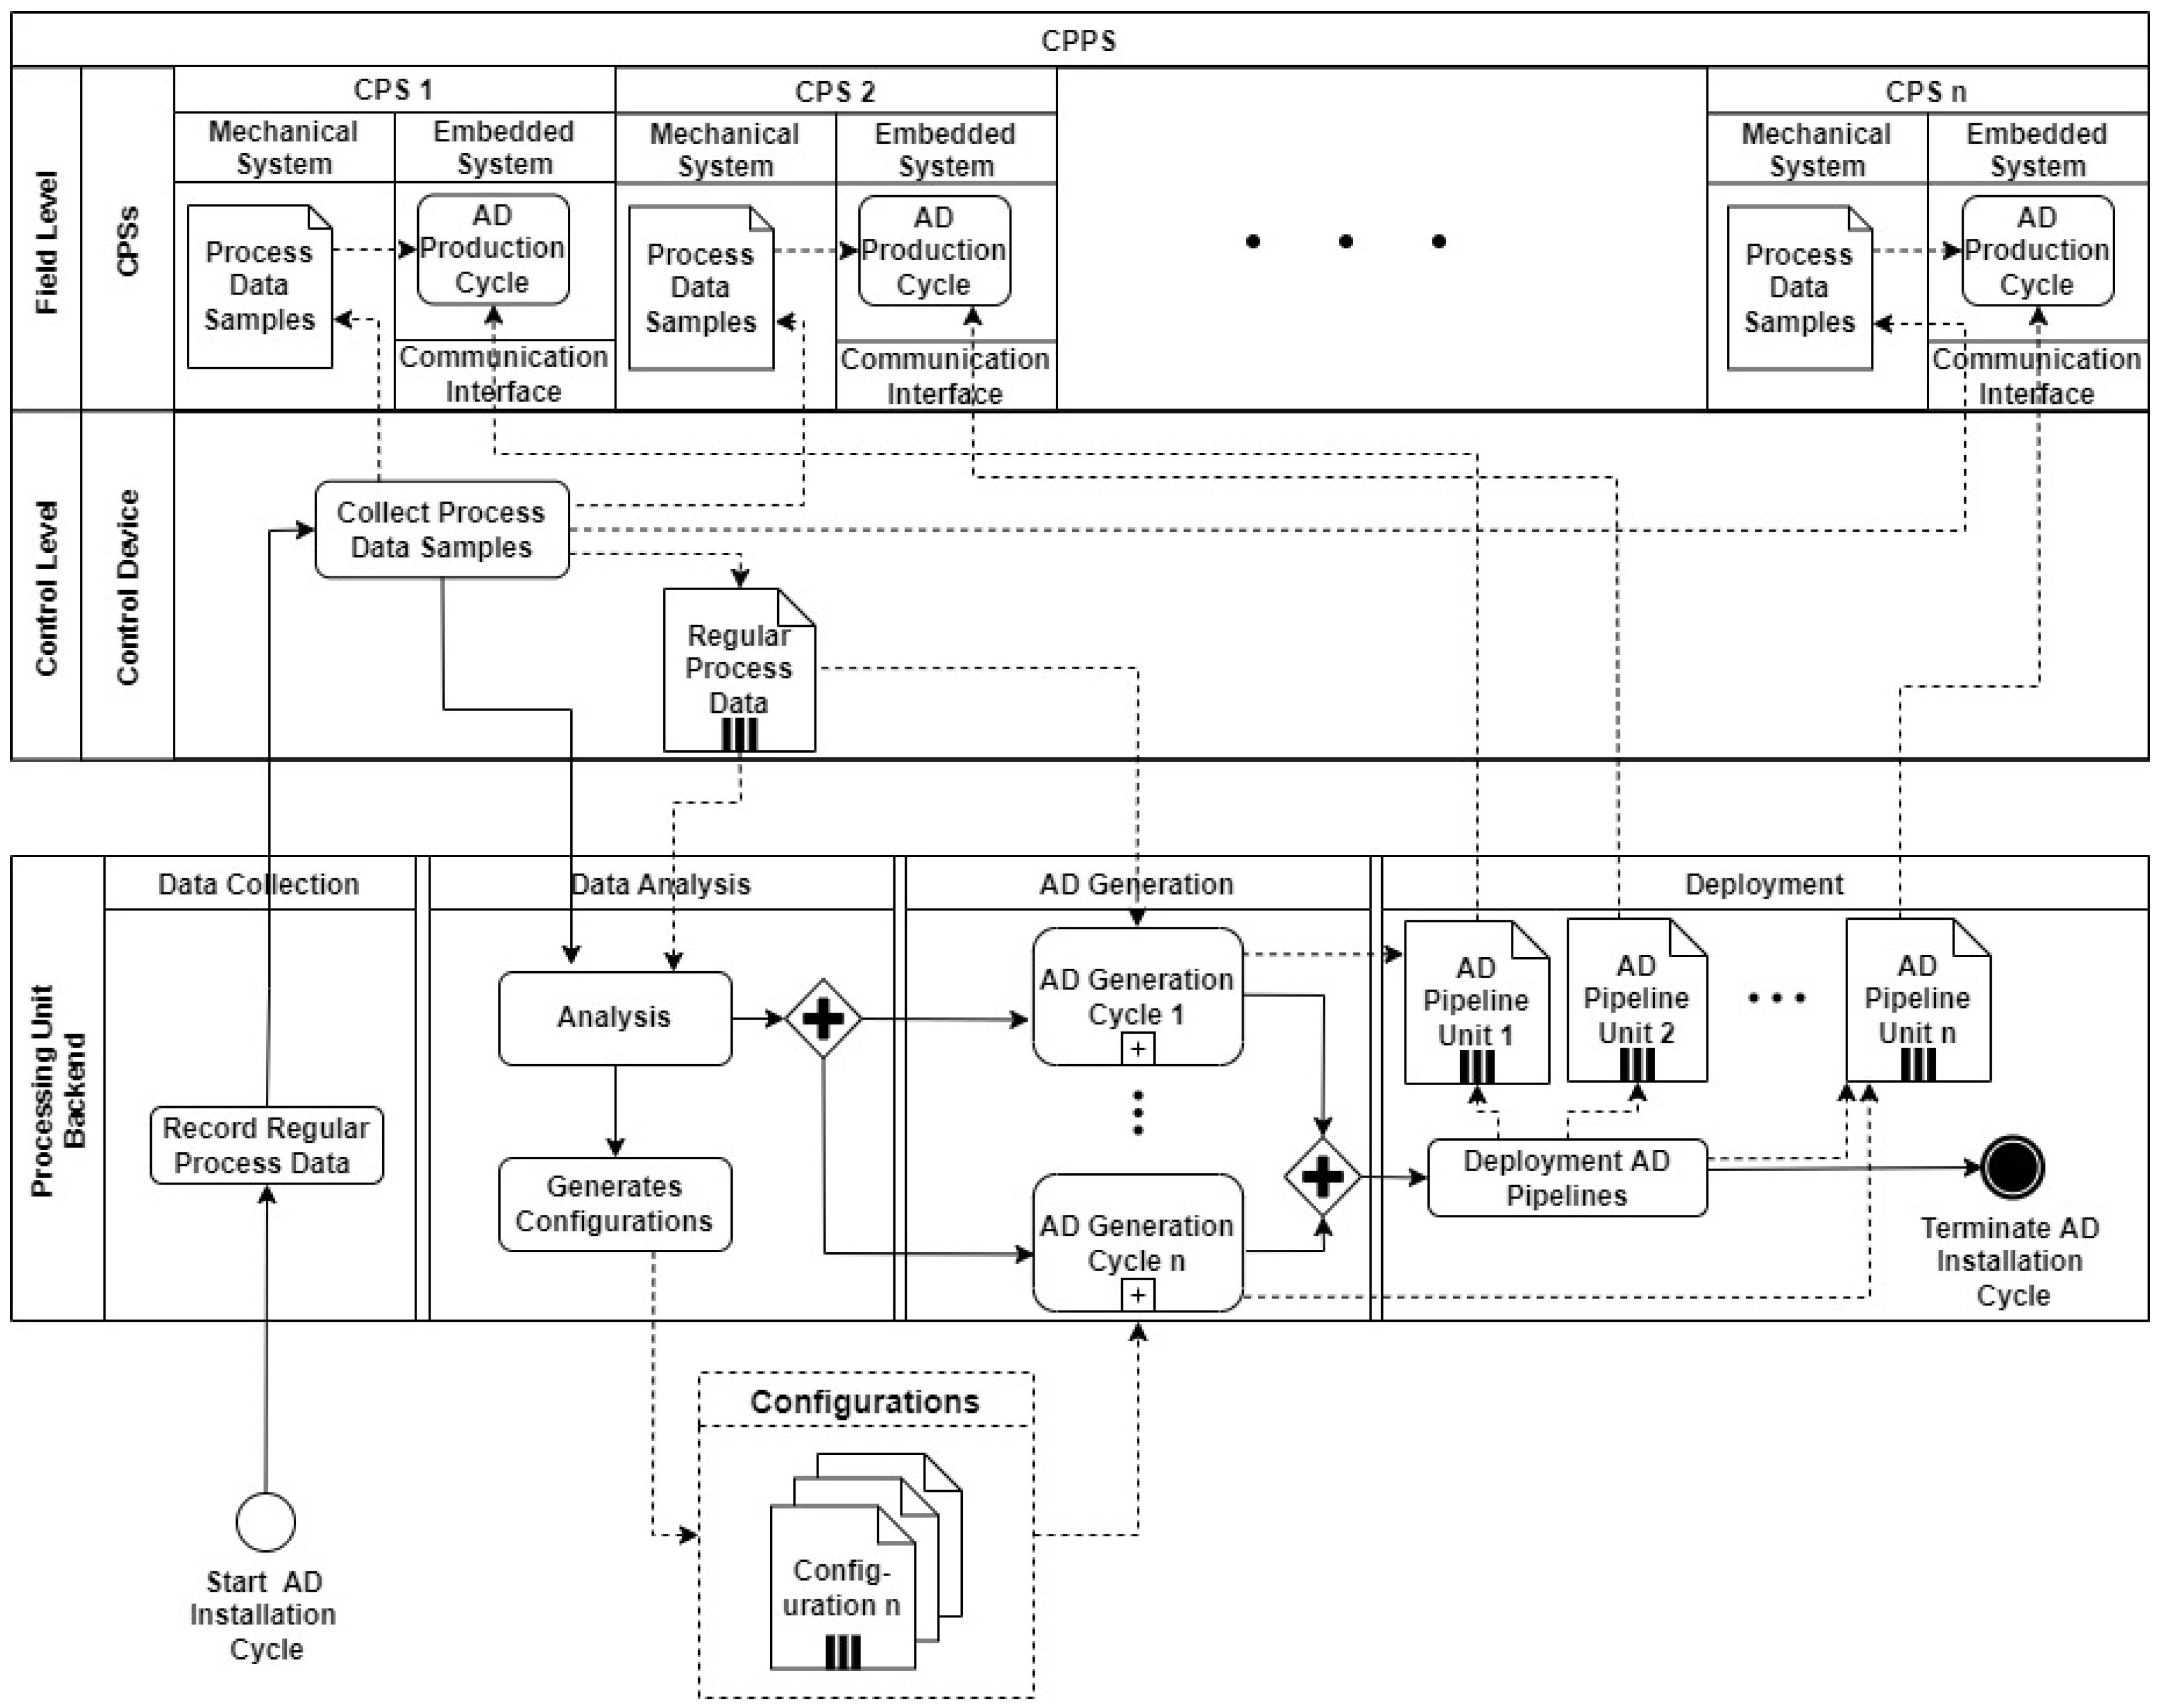
| Processing Unit Backend | The processing unit backend, an external device that can be removed after the installation process is finished, performs all heavy processing tasks in the AD Installation cycle to meet the previously explained industrial constraints of the CPPS. |
| Control Device | Unit which typically controls the industrial process. |
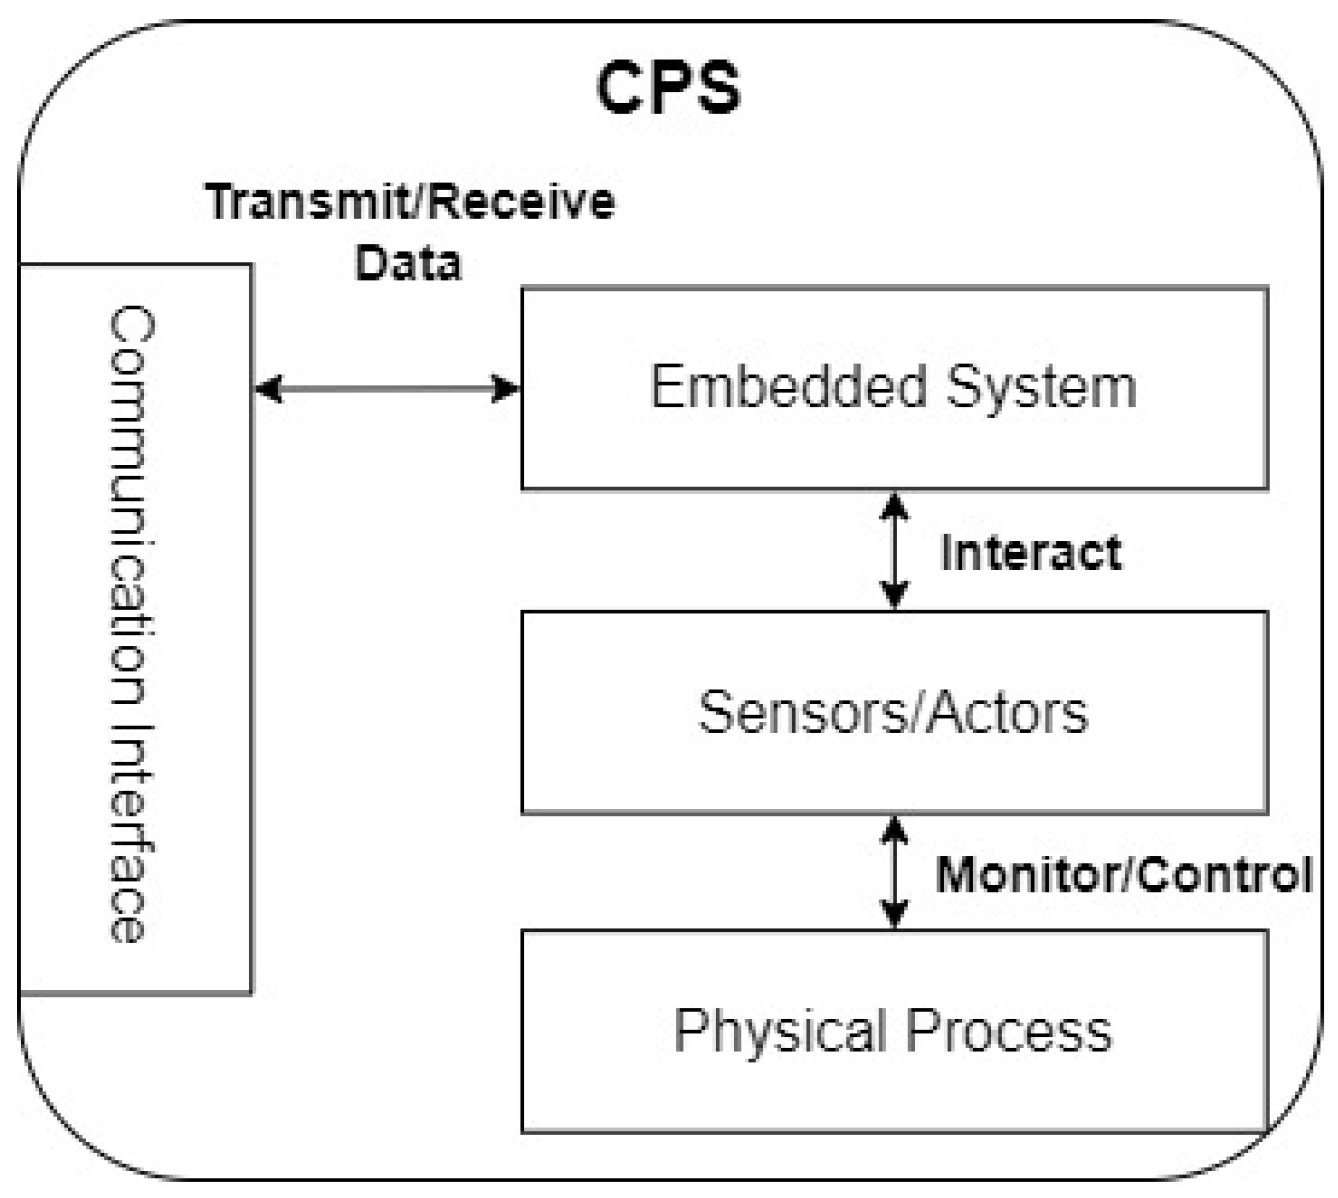
| Communication Interface | The interface of the embedded system to exchange data with the control device or the processing unit backend. |
| Embedded System | Part of the CPS which interacts with sensors and actors to monitor and control the mechanical system. |
| Mechanical System | Summarizes all mechanical components of the system. |
| Process data samples | Single packages of time series data from the individual CPS. Process data samples consist of features like position, torque, and speed sampled as time series data from the CPS. |
| Record Regular Process Data | Combined process data samples of all CPS collected from the normal process sampled over a defined time. |
| Collect Process Data Samples | Process data samples at a high sample rate are collected from the different CPS, combined, and sent to the control device as a data package. |
| Analysis | In the analysis, unnecessary features are automatically removed from the data, and important information like feature range and data types are collected. |
| Generate Configurations | Based on the analysis, configuration files are generated. The operator can manually tune this information, or the default values can be used. |
| AD Generation Cycle | Main cycle to create the preprocessor and train the model. |
| Deployment AD Pipelines | Each generated AD pipeline is exported and deployed to a separate CPS. |
| AD Production Cycle | Live integration and execution of the AD pipeline in the individual CPS. |
| Item | Definition |
|---|---|
| In-memory data storage | A fast and effective data store that caches live data until it is passed to the AD pipeline for processing. |
| Record Live Process Data | Live process data is sampled at a high sample rate to an in-memory data storage to collect the needed data to execute the AD pipeline. |
| Execute AD Process Step | The collected live data is preprocessed and evaluated by the AD pipeline. |
| Deliver Results to Control Unit | The AD output can be delivered from the CPS to the control unit. |
| Notify Operator | Depending on the CPS, the Operator can be immediately notified by the separate CPS. |
| Shut Down AD | In this step, the whole AD production cycle can be switched off to free resources and stop the anomaly detection. |
| Item | Definition |
|---|---|
| Regular Process Data | Data collected from the normal process of the CPS over a defined time. |
| Preprocessed Data | Transformed and scaled regular process data by the chosen Preprocessor. |
| AD Pipeline | A combination of initialised Preprocessor and trained model. |
| Configuration | Contains necessary parameters for the separate steps of the generation cycle, e.g., the number of layers, filters per layer, loss function, and type of optimizer. Default parameters are automatically provided but can also be manually changed and tuned. |
| Preprocessing | In the preprocessing step, the regular process data is transformed by the chosen preprocessor. This scales the data provided, which normally consists of different ranges and units, to an equal numerical range. |
| Initialize Model | Here, the model is built based on the configuration. Therefore, the number of layers, filter, and type of each layer and the optimizer and loss function are set. |
| Train Model | In this step, the initialized model is trained with the preprocessed regular process data. |
| Evaluate Model | Depending on the evaluation method defined in the configuration step, the model is tested, the results are tracked, and the complete experiment is saved. |
| Optimize Model | In the optimization step, the hyperparameters are changed, influenced by the defined ranges and tuning parameters. The search algorithm declared in the configuration file searches over a generated search space for the best possible parameters. |
| Export AD Pipeline | Normally, after the tuning is finished, the AD pipeline is exported to the deployment step. |
Appendix B
| Model | Performance | Size | Avg. Time [ms] | |||||||
|---|---|---|---|---|---|---|---|---|---|---|
| TP | FP | TN | FN | Recall | Precision | F1 | Compelxity | Training | Evaluation | |
| OCSVM | 400 | 25,005 | 19,633 | 138 | 0.7434 | 0.0157 | 0.0308 | Low | 37,041.6 | 36,811.1 |
| iForest | 467 | 13,709 | 30,865 | 71 | 0.8680 | 0.0329 | 0.0634 | Low | 1874.9 | 574.1 |
| LSTMAE | 8 | 1 | 693 | 1 | 0.8888 | 0.8888 | 0.8888 | High | 372,029.5 | 23,491.3 |
| AE | 8 | 2 | 692 | 1 | 0.8888 | 0.8 | 0.8421 | Medium | 13,151.2 | 18,720 |
| 1D-ConvAE | 8 | 0 | 694 | 2 | 0.8 | 1 | 0.8888 | Medium | 113,227.6 | 20,045.2 |
Appendix C

References
- Marwedel, P. Embedded System Design: Embedded Systems Foundations of Cyber-Physical Systems, and the Internet of Things; Springer: Cham, Switzerland, 2021; pp. 1–15. [Google Scholar]
- Jazdi, N. Cyber physical systems in the context of Industry 4.0. In Proceedings of the 2014 IEEE International Conference on Automation, Quality and Testing, Robotics, Cluj-Napoca, Romania, 22–24 May 2014; pp. 14–16. [Google Scholar] [CrossRef]
- Rajkumar, R.; Lee, I.; Sha, L.; Stankovic, J. Cyber-Physical Systems: The Next Computing Revolution. In Proceedings of the Design Automation Conference, Anaheim, CA, USA, 13–18 June 2010; pp. 731–736. [Google Scholar] [CrossRef]
- Müller, T.; Jazdi, N.; Schmidt, J.; Weyrich, M. Cyber-physical production systems: Enhancement with a self-organized reconfiguration management. Procedia CIRP 2021, 9, 549–554. [Google Scholar] [CrossRef]
- Monostori, L. Cyber-physical Production Systems: Roots, Expectations and R & D Challenges. Procedia CIRP 2014, 17, 9–13. [Google Scholar] [CrossRef]
- Ali, N.; Hussain, M.; Hong, J.-E. SafeSoCPS: A Composite Safety Analysis Approach for System of Cyber-Physical Systems. Sensors 2022, 22, 4474. [Google Scholar] [CrossRef]
- Eiteneuer, B.; Hranisavljevic, N.; Niggemann, O. Dimensionality Reduction and Anomaly Detection for CPPS Data using Autoencoder. In Proceedings of the 2019 IEEE International Conference on Industrial Technology (ICIT), Melbourne, VIC, Australia, 13–15 February 2019; pp. 1286–1292. [Google Scholar] [CrossRef]
- Adepu, S.; Mathur, A. Distributed Attack Detection in a Water Treatment Plant: Method and Case Study. IEEE Trans. Dependable Secur. Comput. 2021, 18, 86–99. [Google Scholar] [CrossRef]
- Chandola, V.; Banerjee, A.; Kumar, V. Anomaly detection: A survey. ACM Comput. Surv. 2009, 41, 58. [Google Scholar] [CrossRef]
- Stojanovic, L.; Dinic, M.; Stojanovic, N.; Stojadinovic, A. Big-data-driven anomaly detection in industry (4.0): An approach and a case study. In Proceedings of the 2016 IEEE International Conference on Big Data (Big Data), Washington, DC, USA, 5–8 December 2016; pp. 1647–1652. [Google Scholar] [CrossRef]
- Ruff, L.; Kauffmann, J.R.; Vandermeulen, R.A.; Montavon, G.; Samek, W.; Kloft, M.; Dietterich, T.G.; Muller, K.-R. A Unifying Review of Deep and Shallow Anomaly Detection. Proc. IEEE 2021, 109, 756–795. [Google Scholar] [CrossRef]
- Gerz, F.; Bastürk, T.R.; Kirchhoff, J.; Denker, J.; Al-Shrouf, L.; Jelali, M. Comparative Study and a New Industrial Platform for Decentralized Anomaly Detection Using Machine Learning Algorithms. In Proceedings of the 2022 International Joint Conference on Neural Networks (IJCNN), Padua, Italy, 18–23 July 2022; pp. 1–8. [Google Scholar] [CrossRef]
- Bulusu, S.; Kailkhura, B.; Li, B.; Varshney, P.K.; Song, D. Anomalous Example Detection in Deep Learning: A Survey. IEEE Access 2020, 8, 132330–132347. [Google Scholar] [CrossRef]
- Mishra, P.; Varadharajan, V.; Tupakula, U.; Pilli, E.S. A Detailed Investigation and Analysis of Using Machine Learning Techniques for Intrusion Detection. IEEE Commun. Surv. Tutor. 2019, 21, 686–728. [Google Scholar] [CrossRef]
- Thudumu, S.; Branch, P.; Jin, J.; Singh, J. A comprehensive survey of anomaly detection techniques for high dimensional big data. Big Data 2020, 7, 1–30. [Google Scholar] [CrossRef]
- Cook, A.A.; Mısırlı, G.; Fan, Z. Anomaly Detection for IoT Time-Series Data: A Survey. IEEE Internet Things J. 2020, 7, 6481–6494. [Google Scholar] [CrossRef]
- Goldstein, M.; Uchida, S. A Comparative Evaluation of Unsupervised Anomaly Detection Algorithms for Multivariate Data. PLoS ONE 2016, 11, e0152173. [Google Scholar] [CrossRef] [PubMed]
- Oza, P.; Patel, V.M. One-Class Convolutional Neural Network. IEEE Signal Process. Lett. 2019, 26, 277–281. [Google Scholar] [CrossRef]
- Erfani, S.M.; Rajasegarar, S.; Karunasekera, S.; Leckie, C. High-dimensional and large-scale anomaly detection using a linear one-class SVM with deep learning. Pattern Recognit. 2016, 58, 121–134. [Google Scholar] [CrossRef]
- Smets, K.; Verdonk, B.; Jordaan, E.M. Discovering novelty in spatio/temporal data using one-class support vector machines. In Proceedings of the 2009 International Joint Conference on Neural Networks, Atlanta, GA, USA, 14–19 June 2009; pp. 2956–2963. [Google Scholar] [CrossRef]
- Zong, B.; Song, Q.; Min, M.R.; Cheng, W.; Lumezanu, C.; Cho, D.; Chen, H. Deep autoencoding gaussian mixture model for unsupervised anomaly detection. In Proceedings of the International Conference on Learning Representations, Vancouver, BC, Canada, 30 April–3 May 2018. [Google Scholar]
- Xiaoyi, G.; Akoglu, L.; Rinaldo, A. Statistical analysis of nearest neighbor methods for anomaly detection. arXiv 2019, arXiv:1907.03813. [Google Scholar]
- Elnour, M.; Meskin, N.; Khan, K.; Jain, R. A dual-isolation-forests-based attack detection framework for industrial control systems. IEEE Access 2020, 8, 36639–36651. [Google Scholar] [CrossRef]
- Pang, G.; Shen, C.; Cao, L.; Van Den Hengel, A. Deep Learning for Anomaly Detection: A Review. ACM Comput. Surv. 2022, 54, 1–38. [Google Scholar] [CrossRef]
- Li, D.; Chen, D.; Jin, B.; Shi, L.; Goh, J.; Ng, S.K. MAD-GAN: Multivariate Anomaly Detection for Time Series Data with Generative Adversarial Networks. In Artificial Neural Networks and Machine Learning—ICANN 2019: Text and Time Series ICANN 2019 Lecture Notes in Computer Science; Springer: Cham, Switzerland, 2019; Volume 11730, pp. 703–716. [Google Scholar] [CrossRef]
- Choi, Y.; Lim, H.; Choi, H.; Kim, I.-J. GAN-Based Anomaly Detection and Localization of Multivariate Time Series Data for Power Plant. In Proceedings of the 2020 IEEE International Conference on Big Data and Smart Computing (BigComp), Busan, Republic of Korea, 19–22 February 2020; pp. 71–74. [Google Scholar] [CrossRef]
- Jiang, W.; Hong, Y.; Zhou, B.; He, X.; Cheng, C. A GAN-Based Anomaly Detection Approach for Imbalanced Industrial Time Series. IEEE Access 2019, 7, 143608–143619. [Google Scholar] [CrossRef]
- Heiko, H. Kernel PCA for novelty detection. Pattern Recognit. 2007, 40, 863–874. [Google Scholar]
- Zhao, Y.; Deng, B.; Shen, C.; Liu, Y.; Lu, H.; Hua, X.S. Spatio-temporal autoencoder for video anomaly detection. In Proceedings of the 25th ACM International Conference on Multimedia, Mountain View, CA, USA, 23–27 October 2017. [Google Scholar]
- Gong, D.; Liu, L.; Le, V.; Saha, B.; Mansour, M.R.; Venkatesh, S.; Hengel, A.V.D. Memorizing normality to detect anomaly: Memory-augmented deep autoencoder for unsupervised anomaly detection. In Proceedings of the IEEE/CVF International Conference on Computer Vision, Seoul, Republic of Korea, 27 October–2 November 2019. [Google Scholar]
- Meidan, Y.; Bohadana, M.; Mathov, Y.; Mirsky, Y.; Shabtai, A.; Breitenbacher, D.; Elovici, Y. N-baiot-network-based detection of iot botnet attacks using deep autoencoders. IEEE Pervasive Comput. 2018, 17, 12–22. [Google Scholar] [CrossRef]
- Park, S.; Adosoglou, G.; Pardalos, P.M. Interpreting rate-distortion of variational autoencoder and using model uncertainty for anomaly detection. Ann. Math. Artif. Intell. 2022, 90, 735–752. [Google Scholar] [CrossRef]
- Jinwon, A.; Cho, S. Variational autoencoder based anomaly detection using reconstruction probability. Spec. Lect. IE 2015, 2, 1–18. [Google Scholar]
- Munir, M.; Siddiqui, S.A.; Dengel, A.; Ahmed, S. DeepAnT: A Deep Learning Approach for Unsupervised Anomaly Detection in Time Series. IEEE Access 2019, 7, 1991–2005. [Google Scholar] [CrossRef]
- Gong, W.; Chen, H.; Zhang, Z.; Zhang, M.; Gao, H. A Data-Driven-Based Fault Diagnosis Approach for Electrical Power DC-DC Inverter by Using Modified Convolutional Neural Network With Global Average Pooling and 2-D Feature Image. IEEE Access 2020, 8, 73677–73697. [Google Scholar] [CrossRef]
- Gong, W.; Wang, Y.; Zhang, M.; Mihankhah, E.; Chen, H.; Wang, D. A Fast Anomaly Diagnosis Approach Based on Modified CNN and Multisensor Data Fusion. IEEE Trans. Ind. Electron. 2022, 69, 13636–13646. [Google Scholar] [CrossRef]
- Qu, C.; Zhou, Z.; Liu, Z.; Jia, S. Predictive anomaly detection for marine diesel engine based on echo state network and autoencoder. Energy Rep. 2022, 8 (Suppl. 4), 998–1003. [Google Scholar] [CrossRef]
- Malviya, V.; Mukherjee, I.; Tallur, S. Edge-Compatible Convolutional Autoencoder Implemented on FPGA for Anomaly Detection in Vibration Condition-Based Monitoring. IEEE Sens. Lett. 2022, 6, 1–4. [Google Scholar] [CrossRef]
- Guo, X.; Liu, X.; Zhu, E.; Yin, J. Deep Clustering with Convolutional Autoencoders. In Neural Information Processing: 24th International Conference, ICONIP 2017, Guangzhou, China, 14–18 November 2017; Proceedings, Part II 24; Springer: Cham, Switzerland, 2017; p. 10635. [Google Scholar] [CrossRef]
- Lee, G.; Jung, M.; Song, M.; Choo, J. Unsupervised anomaly detection of the gas turbine operation via convolutional auto-encoder. In Proceedings of the 2020 IEEE International Conference on Prognostics and Health Management (ICPHM), Detroit, MI, USA, 8–10 June 2020; pp. 1–6. [Google Scholar] [CrossRef]
- Yu, J.; Zhou, X. One-Dimensional Residual Convolutional Autoencoder Based Feature Learning for Gearbox Fault Diagnosis. IEEE Trans. Ind. Inform. 2020, 16, 6347–6358. [Google Scholar] [CrossRef]
- Chen, T.; Liu, X.; Xia, B.; Wang, W.; Lai, Y. Unsupervised Anomaly Detection of Industrial Robots Using Sliding-Window Convolutional Variational Autoencoder. IEEE Access 2020, 8, 47072–47081. [Google Scholar] [CrossRef]
- Kwak, M.; Kim, S.B. Unsupervised Abnormal Sensor Signal Detection With Channelwise Reconstruction Errors. IEEE Access 2021, 9, 39995–40007. [Google Scholar] [CrossRef]
- Lai, Y.; Liu, Z.; Song, Z.; Wang, Y.; Gao, Y. Anomaly detection in Industrial Autonomous Decentralized System based on time series. Simul. Model. Pract. Theory 2016, 65, 57–71. [Google Scholar] [CrossRef]
- Sanjith, S.L.; Prakash Raj, E.G.D. Decentralized Time-Window Based Real-Time Anomaly Detection Mechanism (DTRAD) in Iot. Int. J. Recent Technol. Eng. 2019, 8, 1619–1625. [Google Scholar] [CrossRef]
- Gupta, K.; Sahoo, S.; Mohanty, R.; Panigrahi, B.K.; Blaabjerg, F. Decentralized Anomaly Identification in Cyber-Physical DC Microgrids. In Proceedings of the 2022 IEEE Energy Conversion Congress and Exposition (ECCE), Detroit, MI, USA, 9–13 October 2022; pp. 1–6. [Google Scholar] [CrossRef]
- Wilbur, M.; Dubey, A.; Leão, B.; Bhattacharjee, S. A Decentralized Approach for Real Time Anomaly Detection in Transportation Networks. In Proceedings of the 2019 IEEE International Conference on Smart Computing (SMARTCOMP), Washington, DC, USA, 12–15 June 2019; pp. 274–282. [Google Scholar] [CrossRef]
- Bosman, H.; Iacca, G.; Tejada, A.; Wörtche, H.J.; Liotta, A. Spatial anomaly detection in sensor networks using neighborhood information. Inf. Fusion 2017, 33, 41–56. [Google Scholar] [CrossRef]
- Nikolay, L.; Amizadeh, S.; Flint, I. Generic and scalable framework for automated time-series anomaly detection. In Proceedings of the 21th ACM SIGKDD International Conference on Knowledge Discovery and Data Mining, Sydney, Australia, 10–13 August 2015. [Google Scholar]
- Mayra, M.; Wu, C. An unsupervised framework for anomaly detection in a water treatment system. In Proceedings of the 2019 18th IEEE International Conference on Machine Learning And Applications (ICMLA), Boca Raton, FL, USA, 16–19 December 2019. [Google Scholar]
- Schneider, P.; Böttinger, K. High-Performance Unsupervised Anomaly Detection for Cyber-Physical System Networks. In Proceedings of the 2018 Workshop on Cyber-Physical Systems Security and PrivaCy, Toronto, ON, Canada, 15–19 October 2018. [Google Scholar]
- Goetz, C.; Humm, G.B. Unsupervised Process Anomaly Detection under Industry Constraints in Cyber-Physical Systems using Convolutional Autoencoder. In Computational Intelligence for Engineering and Management Applications, Select Proceedings of CIEMA 2022; Springer: Singapore, 2023. [Google Scholar]
- Abadi, M.; Agarwal, A.; Barham, P.; Brevdo, E.; Chen, Z.; Citro, C.; Corrado, G.; Davis, A.; Dean, J.; Devin, M.; et al. TensorFlow: Large-Scale Machine Learning on Heterogeneous Systems. 2015. Available online: tensorflow.org (accessed on 13 February 2023).
- Moritz, P.; Nishihara, R.; Wang, S.; Tumanov, A.; Liaw, R.; Liang, E.; Elibol, M.; Yang, Z.; Paul, W.; Jordan, M.; et al. Ray: A distributed framework for emerging AI applications. In Proceedings of the 13th USENIX Symposium on Operating Systems Design and Implementation (OSDI 18), Carlsbad, CA, USA, 8–10 October 2018; pp. 561–577. [Google Scholar]
- Zaharia, M.A.; Chen, A.; Davidson, A.; Ghodsi, A.; Hong, S.A.; Konwinski, A.; Murching, S.; Nykodym, T.; Ogilvie, P.; Parkhe, M.; et al. Accelerating the Machine Learning Lifecycle with MLflow. IEEE Data Eng. Bull. 2018, 41, 39–45. [Google Scholar]
- Schölkopf, B.; Williamson, R.; Smola, A.; Shawe-Taylor, J.; Platt, J. Support Vector Method for Novelty Detection. NIPS 1999, 12, 582–588. [Google Scholar]
- Liu, F.; Ting, K.; Zhou, Z. Isolation-Based Anomaly Detection. ACM Trans. Knowl. Discov. Data 2012, 6, 3. [Google Scholar] [CrossRef]
- Hochreiter, S.; Schmidhuber, J. Long Short-term Memory. Neural Comput. 1997, 9, 1735–1780. [Google Scholar] [CrossRef]
- Baldi, P. Autoencoders, unsupervised learning and deep architectures. In Proceedings of the 2011 International Conference on Unsupervised and Transfer Learning Workshop, Bellevue, DC, USA, 2 July 2011; Volume 27, pp. 37–50. [Google Scholar]


| Model Parameter | Range | Definition |
|---|---|---|
| Number of Layers | [4, 8] | Total number of layers used in the model. |
| Number of Filters in the first Layer | [32, 128] | The number of filters used in the first layer of the model. To realize the dimensionality reduction, the inner layers have fewer filters. (In the automated concept, half of the previous layer). |
| Window size | [32, 128] | Number of time steps of the sliding window. |
| Step size | [1, 64] | The length of the sequence shifted between the individual windows. |
| Patience | [1, 10] | Number of epochs with no improvement after which training will be stopped. |
| Total number of parameters | [12, 642, 208, 614] | Total number of parameters of the resulting model. |
| Mean absolute error | [0.002, 0.3] | Achieved mean absolute error between input and output at the end of training. |
| Unit | TP | TN | FP | FN | Precision | Recall | F1-Score |
|---|---|---|---|---|---|---|---|
| CB | 232 | 3938 | 7 | 10 | 0.0.9707 | 0.958 | 0.964 |
| RT | 193 | 3199 | 9 | 8 | 0.955 | 0.960 | 0.957 |
| SR | 22 | 3002 | 2 | 0 | 0.916 | 1 | 0.956 |
| PR | 22 | 3002 | 1 | 1 | 0.956 | 0.956 | 0.956 |
| P&P S | 484 | 2965 | 21 | 20 | 0.958 | 0.960 | 0.959 |
| P&P U | 484 | 2967 | 29 | 15 | 0.943 | 0.969 | 0.956 |
| P&P L | 484 | 2964 | 27 | 22 | 0.947 | 0.956 | 0.951 |
| CTS | 75 | 3199 | 3 | 3 | 0.961 | 0.961 | 0.961 |
| SRS | 231 | 3374 | 8 | 10 | 0.966 | 0.958 | 0.962 |
Disclaimer/Publisher’s Note: The statements, opinions and data contained in all publications are solely those of the individual author(s) and contributor(s) and not of MDPI and/or the editor(s). MDPI and/or the editor(s) disclaim responsibility for any injury to people or property resulting from any ideas, methods, instructions or products referred to in the content. |
© 2023 by the authors. Licensee MDPI, Basel, Switzerland. This article is an open access article distributed under the terms and conditions of the Creative Commons Attribution (CC BY) license (https://creativecommons.org/licenses/by/4.0/).
Share and Cite
Goetz, C.; Humm, B. Decentralized Real-Time Anomaly Detection in Cyber-Physical Production Systems under Industry Constraints. Sensors 2023, 23, 4207. https://doi.org/10.3390/s23094207
Goetz C, Humm B. Decentralized Real-Time Anomaly Detection in Cyber-Physical Production Systems under Industry Constraints. Sensors. 2023; 23(9):4207. https://doi.org/10.3390/s23094207
Chicago/Turabian StyleGoetz, Christian, and Bernhard Humm. 2023. "Decentralized Real-Time Anomaly Detection in Cyber-Physical Production Systems under Industry Constraints" Sensors 23, no. 9: 4207. https://doi.org/10.3390/s23094207
APA StyleGoetz, C., & Humm, B. (2023). Decentralized Real-Time Anomaly Detection in Cyber-Physical Production Systems under Industry Constraints. Sensors, 23(9), 4207. https://doi.org/10.3390/s23094207