

Reliability and Discriminative Validity of Wearable Sensors for the Quantification of Upper Limb Movement Disorders in Individuals with Dyskinetic Cerebral Palsy
 , , ,
, , ,  and
and
Abstract
:1. Introduction
2. Materials and Methods
2.1. Participants and Study Setting
2.2. Study Procedures
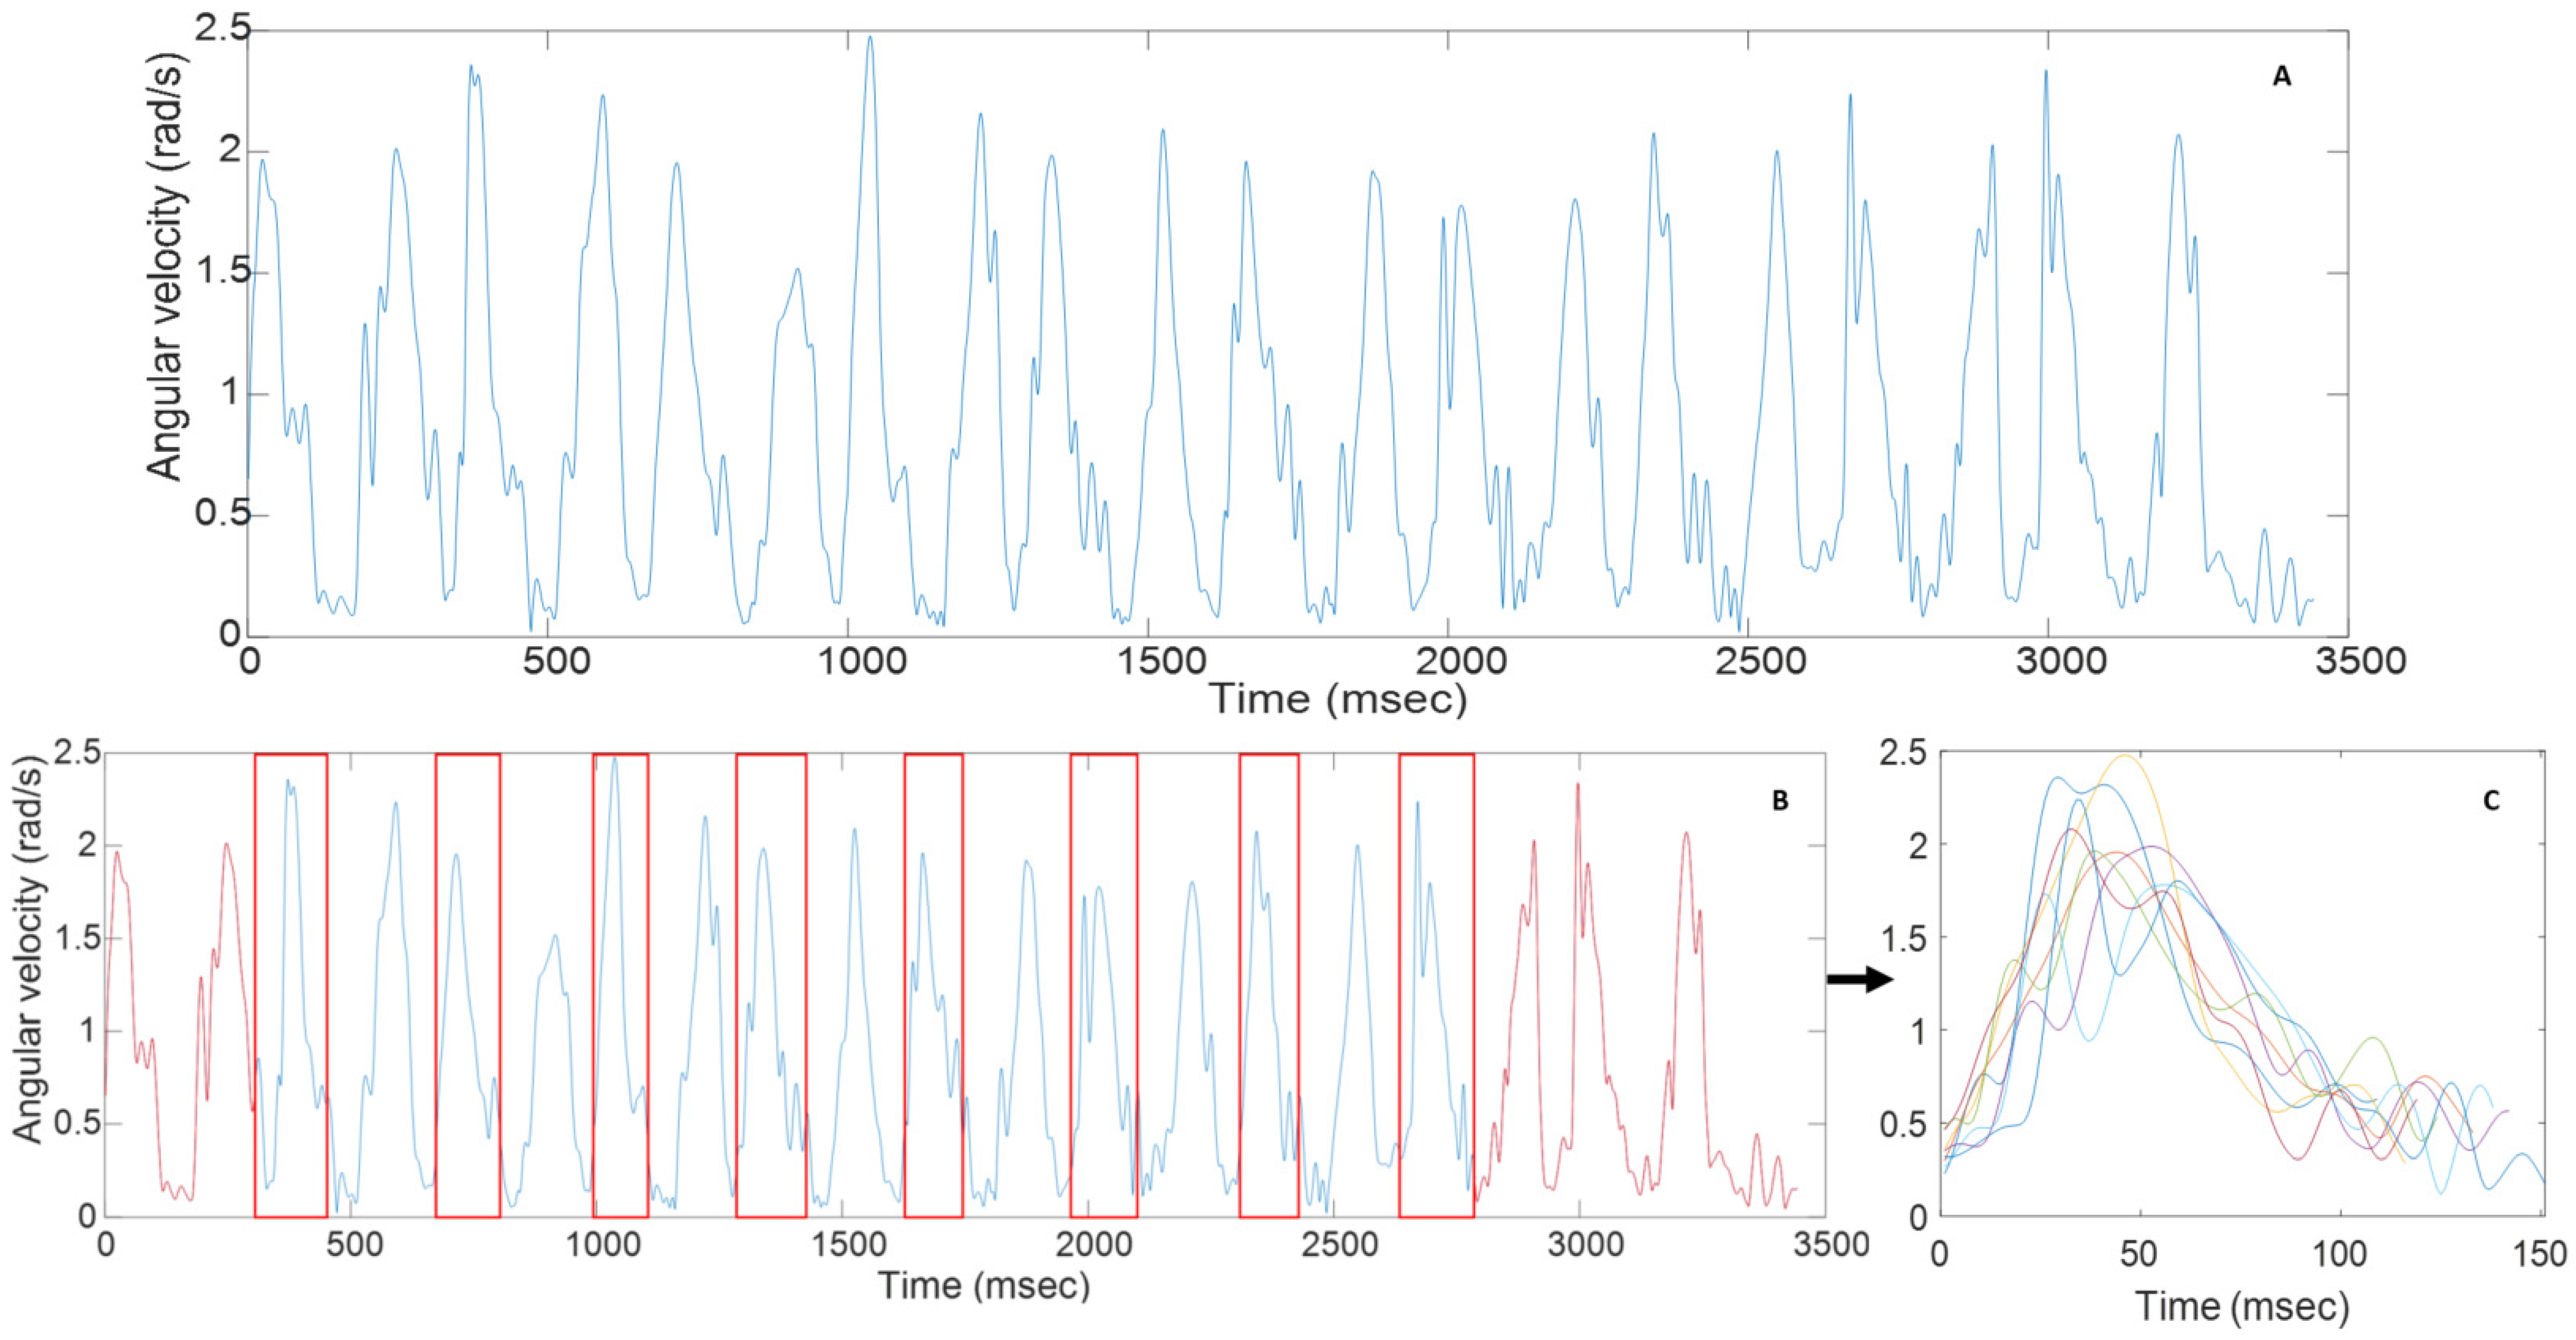
2.3. Data Analysis
2.4. Sensor Parameters
2.5. Statistical Analyses
3. Results
3.1. Participants
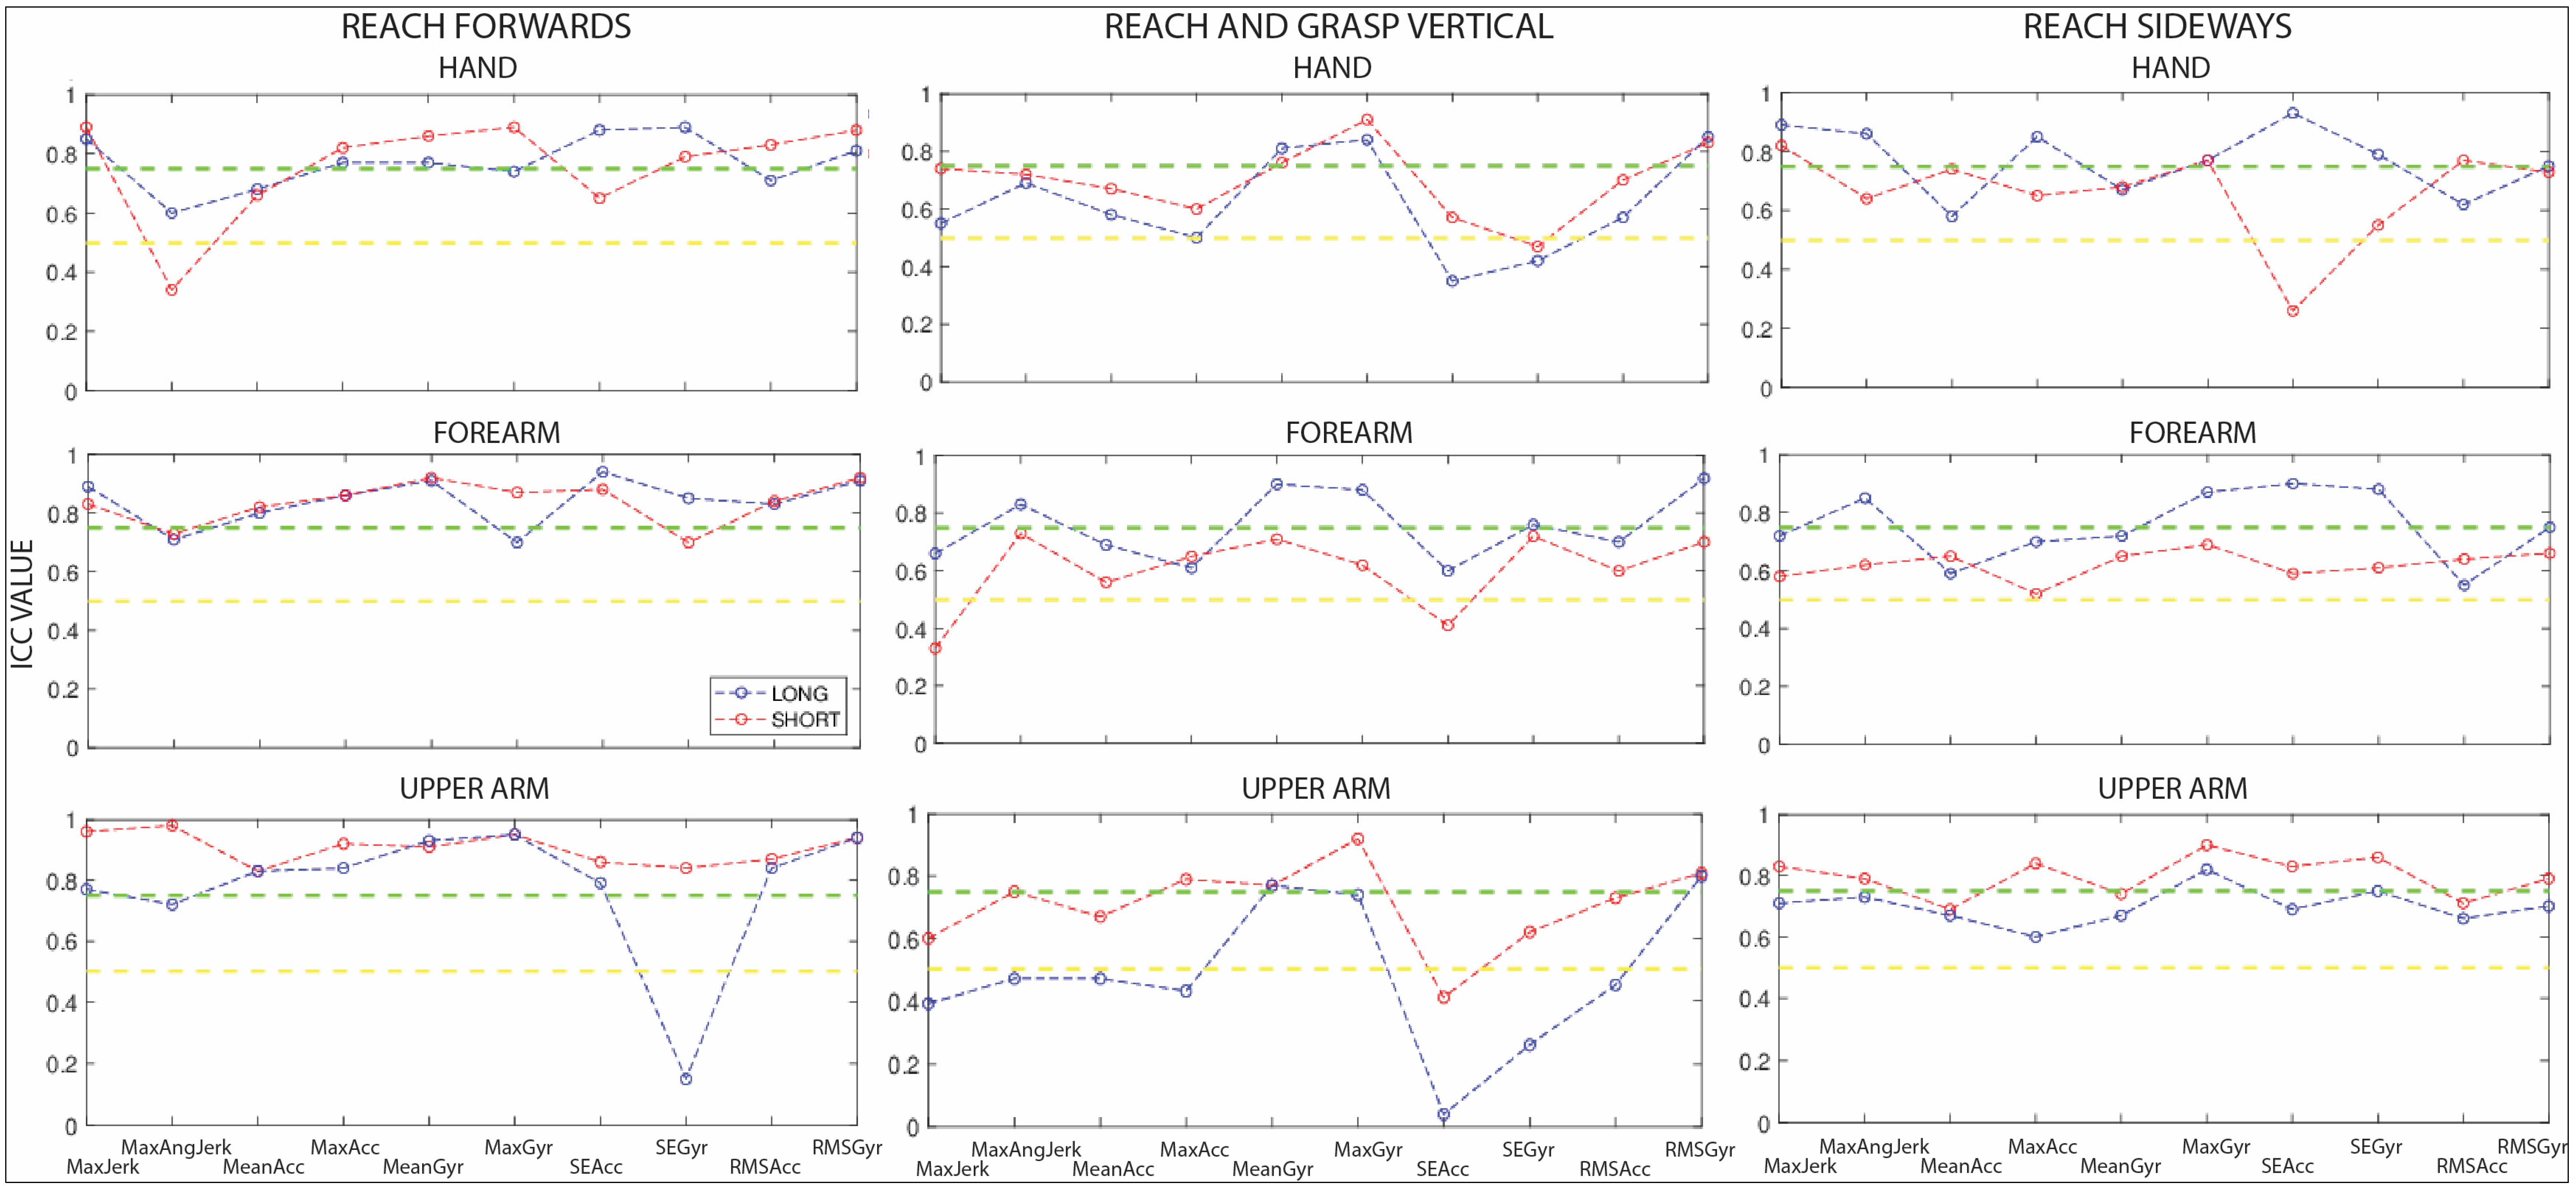
3.2. Reliability
3.3. Discriminative Validity
4. Discussion
5. Conclusions
Supplementary Materials
Author Contributions
Funding
Institutional Review Board Statement
Informed Consent Statement
Data Availability Statement
Acknowledgments
Conflicts of Interest
References
- Monbaliu, E.; Himmelmann, K.; Lin, J.-P.; Ortibus, E.; Bonouvrié, L.; Feys, H.; Vermeulen, R.J.; Dan, B. Clinical presentation and management of dyskinetic cerebral palsy. Lancet Neurol. 2017, 16, 741–749. [Google Scholar] [CrossRef]
- Rosenbaum, P.; Paneth, N.; Leviton, A.; Goldstein, M.; Bax, M.; Damiano, D.; Dan, B.; Jacobsson, B. A report: The definition and classification of cerebral palsy April 2006. Dev. Med. Child Neurol. 2007, 109, 8–14. [Google Scholar] [CrossRef]
- Himmelmann, K.; McManus, V.; Hagberg, G.; Uvebrant, P.; Krageloh-Mann, I.; Cans, C. Dyskinetic cerebral palsy in Europe: Trends in prevalence and severity. Arch. Dis. Child. 2009, 94, 921–926. [Google Scholar] [CrossRef] [PubMed]
- Aravamuthan, B.R.; Waugh, J.L. Localization of Basal Ganglia and Thalamic Damage in Dyskinetic Cerebral Palsy. Pediatr. Neurol. 2016, 54, 11–21. [Google Scholar] [CrossRef] [PubMed]
- Monbaliu, E.; De Cock, P.; Mailleux, L.; Dan, B.; Feys, H. The relationship of dystonia and choreoathetosis with activity, participation and quality of life in children and youth with dyskinetic cerebral palsy. Eur. J. Paediatr. Neurol. 2017, 21, 327–335. [Google Scholar] [CrossRef]
- Elze, M.C.; Gimeno, H.; Tustin, K.; Baker, L.; Lumsden, D.E.; Hutton, J.L.; Lin, J.P. Burke-Fahn-Marsden dystonia severity, Gross Motor, Manual Ability, and Communication Function Classification scales in childhood hyperkinetic movement disorders including cerebral palsy: A ‘Rosetta Stone’ study. Dev. Med. Child Neurol. 2016, 58, 145–153. [Google Scholar] [CrossRef]
- Monbaliu, E.; de Cock, P.; Ortibus, E.; Heyrman, L.; Klingels, K.; Feys, H. Clinical patterns of dystonia and choreoathetosis in participants with dyskinetic cerebral palsy. Dev. Med. Child Neurol. 2016, 58, 138–144. [Google Scholar] [CrossRef]
- Kukke, S.N.; Curatalo, L.A.; de Campos, A.C.; Hallett, M.; Alter, K.E.; Damiano, D.L. Coordination of Reach-to-Grasp Kinematics in Individuals With Childhood-Onset Dystonia Due to Hemiplegic Cerebral Palsy. IEEE Trans. Neural Syst. Rehabil. Eng. Publ. IEEE Eng. Med. Biol. Soc. 2016, 24, 582–590. [Google Scholar] [CrossRef]
- Butler, E.E.; Rose, J. The pediatric upper limb motion index and a temporal-spatial logistic regression: Quantitative analysis of upper limb movement disorders during the Reach & Grasp Cycle. J. Biomech. 2012, 45, 945–951. [Google Scholar] [CrossRef]
- Artilheiro, M.C.; Corrêa, J.C.; Cimolin, V.; Lima, M.O.; Galli, M.; de Godoy, W.; Lucareli, P.R. Three-dimensional analysis of performance of an upper limb functional task among adults with dyskinetic cerebral palsy. Gait Posture 2014, 39, 875–881. [Google Scholar] [CrossRef]
- Sanger, T.D. Arm trajectories in dyskinetic cerebral palsy have increased random variability. J. Child Neurol. 2006, 21, 551–557. [Google Scholar] [CrossRef] [PubMed]
- Stewart, K.; Harvey, A.; Johnston, L.M. A systematic review of scales to measure dystonia and choreoathetosis in children with dyskinetic cerebral palsy. Dev. Med. Child Neurol. 2017, 59, 786–795. [Google Scholar] [CrossRef]
- Burke, R.E.; Fahn, S.; Marsden, C.D.; Bressman, S.B.; Moskowitz, C.; Friedman, J. Validity and reliability of a rating scale for the primary torsion dystonias. Neurology 1985, 35, 73–77. [Google Scholar] [CrossRef]
- Monbaliu, E.; Ortibus, E.L.S.; de Cat, J.O.S.; Dan, B.; Heyrman, L.; Prinzie, P.; de Cock, P.; Feys, H. The Dyskinesia Impairment Scale: A new instrument to measure dystonia and choreoathetosis in dyskinetic cerebral palsy. Dev. Med. Child Neurol. 2012, 54, 278–283. [Google Scholar] [CrossRef]
- Monbaliu, E.; Ortibus, E.; Roelens, F.; Desloovere, K.; Deklerck, J.; Prinzie, P.; de Cock, P.; Feys, H. Rating scales for dystonia in cerebral palsy: Reliability and validity. Dev. Med. Child Neurol. 2010, 52, 570–575. [Google Scholar] [CrossRef] [PubMed]
- Jaspers, E.; Feys, H.; Bruyninckx, H.; Cutti, A.; Harlaar, J.; Molenaers, G.; Desloovere, K. The reliability of upper limb kinematics in children with hemiplegic cerebral palsy. Gait Posture 2011, 33, 568–575. [Google Scholar] [CrossRef] [PubMed]
- Jaspers, E.; Feys, H.; Bruyninckx, H.; Harlaar, J.; Molenaers, G.; Desloovere, K. Upper limb kinematics: Development and reliability of a clinical protocol for children. Gait Posture 2011, 33, 279–285. [Google Scholar] [CrossRef]
- Butler, E.E.; Ladd, A.L.; Louie, S.A.; Lamont, L.E.; Wong, W.; Rose, J. Three-dimensional kinematics of the upper limb during a Reach and Grasp Cycle for children. Gait Posture 2010, 32, 72–77. [Google Scholar] [CrossRef]
- Vanmechelen, I.; Bekteshi, S.; Konings, M.; Feys, H.; Desloovere, K.; Aerts, J.-M.; Monbaliu, E. Psychometric properties of upper limb kinematics during functional tasks in children and adolescents with dyskinetic cerebral palsy. PLoS ONE 2022, 17, e0266294. [Google Scholar] [CrossRef]
- Vanmechelen, I.; Haberfehlner, H.; De Vleeschhauwer, J.; Van Wonterghem, E.; Feys, H.; Desloovere, K.; Aerts, J.-M.; Monbaliu, E. Assessment of upper limb movement disorders using wearable sensors during functional tasks: A systematic review. medRxiv 2022. [Google Scholar] [CrossRef]
- Goetz, C.G.; Tilley, B.C.; Shaftman, S.R.; Stebbins, G.T.; Fahn, S.; Martinez-Martin, P.; Poewe, W.; Sampaio, C.; Stern, M.B.; Dodel, R.; et al. Movement Disorder Society-sponsored revision of the Unified Parkinson’s Disease Rating Scale (MDS-UPDRS): Scale presentation and clinimetric testing results. Mov. Disord. 2008, 23, 2129–2170. [Google Scholar] [CrossRef] [PubMed]
- Parnandi, A.; Wade, E.; Mataric, M. Motor function assessment using wearable inertial sensors. In Proceedings of the 2010 Annual International Conference of the IEEE Engineering in Medicine and Biology, Buenos Aires, Argentina, 31 August–4 September 2010; Volume 2010, pp. 86–89. [Google Scholar] [CrossRef]
- Patel, S.; Hughes, R.; Hester, T.; Stein, J.; Akay, M.; Dy, J.; Bonato, P. Tracking motor recovery in stroke survivors undergoing rehabilitation using wearable technology. In Proceedings of the 2010 Annual International Conference of the IEEE Engineering in Medicine and Biology, Buenos Aires, Argentina, 31 August–4 September 2010; Volume 2010, pp. 6858–6861. [Google Scholar] [CrossRef]
- Strohrmann, C.; Labruyère, R.; Gerber, C.N.; van Hedel, H.J.; Arnrich, B.; Tröster, G. Monitoring motor capacity changes of children during rehabilitation using body-worn sensors. J. Neuroeng. Rehabil. 2013, 10, 83. [Google Scholar] [CrossRef]
- den Hartog, D.; van der Krogt, M.M.; van der Burg, S.; Aleo, I.; Gijsbers, J.; Bonouvrié, L.A.; Harlaar, J.; Buizer, A.I.; Haberfehlner, H. Home-Based Measurements of Dystonia in Cerebral Palsy Using Smartphone-Coupled Inertial Sensor Technology and Machine Learning: A Proof-of-Concept Study. Sensors 2022, 22, 4386. [Google Scholar] [CrossRef] [PubMed]
- Newman, C.J.; Bruchez, R.; Roches, S.; Jequier Gygax, M.; Duc, C.; Dadashi, F.; Massé, F.; Aminian, K. Measuring upper limb function in children with hemiparesis with 3D inertial sensors. Child’s Nerv. Syst. ChNS Off. J. Int. Soc. Pediatr. Neurosurg. 2017, 33, 2159–2168. [Google Scholar] [CrossRef]
- Spasojević, S.; Ilić, T.V.; Stojković, I.; Potkonjak, V.; Rodić, A.; Santos-Victor, J. Quantitative Assessment of the Arm/Hand Movements in Parkinson’s Disease Using a Wireless Armband Device. Front. Neurol. 2017, 8, 388. [Google Scholar] [CrossRef]
- Gupta, A.S.; Luddy, A.C.; Khan, N.C.; Reiling, S.; Thornton, J.K. Real-life Wrist Movement Patterns Capture Motor Impairment in Individuals with Ataxia-Telangiectasia. Cerebellum 2022, 1–11. [Google Scholar] [CrossRef] [PubMed]
- Oubre, B.; Daneault, J.F.; Whritenour, K.; Khan, N.C.; Stephen, C.D.; Schmahmann, J.D.; Lee, S.I.; Gupta, A.S. Decomposition of Reaching Movements Enables Detection and Measurement of Ataxia. Cerebellum 2021, 20, 811–822. [Google Scholar] [CrossRef]
- Eliasson, A.C.; Krumlinde-Sundholm, L.; Rösblad, B.; Beckung, E.; Arner, M.; Ohrvall, A.M.; Rosenbaum, P. The Manual Ability Classification System (MACS) for children with cerebral palsy: Scale development and evidence of validity and reliability. Dev. Med. Child Neurol. 2006, 48, 549–554. [Google Scholar] [CrossRef]
- Morris, C.; Kurinczuk, J.J.; Fitzpatrick, R.; Rosenbaum, P.L. Reliability of the manual ability classification system for children with cerebral palsy. Dev. Med. Child Neurol. 2006, 48, 950–953. [Google Scholar] [CrossRef]
- Xie, H.-B.; He, W.-X.; Liu, H. Measuring time series regularity using nonlinear similarity-based sample entropy. Phys. Lett. A 2008, 372, 7140–7146. [Google Scholar] [CrossRef]
- Lee, K. Sample Entropy. 2021. Available online: https://www.mathworks.com/matlabcentral/fileexchange/35784-sample-entropy (accessed on 1 October 2022).
- Portney, L.G.; Watkins, M.P. Foundations of Clinical Research: Applications to Practice; Pearson/Prentice Hall: Hoboken, NJ, USA, 2009. [Google Scholar]
- Schwartz, M.H.; Trost, J.P.; Wervey, R.A. Measurement and management of errors in quantitative gait data. Gait Posture 2004, 20, 196–203. [Google Scholar] [CrossRef]
- Koo, T.K.; Li, M.Y. A Guideline of Selecting and Reporting Intraclass Correlation Coefficients for Reliability Research. J. Chiropr. Med. 2016, 15, 155–163. [Google Scholar] [CrossRef] [PubMed]
- Kluge, F.; Gaßner, H.; Hannink, J.; Pasluosta, C.; Klucken, J.; Eskofier, B.M. Towards Mobile Gait Analysis: Concurrent Validity and Test-Retest Reliability of an Inertial Measurement System for the Assessment of Spatio-Temporal Gait Parameters. Sensors 2017, 17, 1522. [Google Scholar] [CrossRef] [PubMed]
- Aqueveque, P.; Gómez, B.A.; Saavedra, F.; Canales, C.; Contreras, S.; Ortega-Bastidas, P.; Cano-de-la-Cuerda, R. Validation of a portable system for spatial-temporal gait parameters based on a single inertial measurement unit and a mobile application. Eur. J. Transl. Myol. 2020, 30, 9002. [Google Scholar] [CrossRef]
- Bravi, M.; Gallotta, E.; Morrone, M.; Maselli, M.; Santacaterina, F.; Toglia, R.; Foti, C.; Sterzi, S.; Bressi, F.; Miccinilli, S. Concurrent validity and inter trial reliability of a single inertial measurement unit for spatial-temporal gait parameter analysis in patients with recent total hip or total knee arthroplasty. Gait Posture 2020, 76, 175–181. [Google Scholar] [CrossRef] [PubMed]
- Rigoni, M.; Gill, S.; Babazadeh, S.; Elsewaisy, O.; Gillies, H.; Nguyen, N.; Pathirana, P.N.; Page, R. Assessment of Shoulder Range of Motion Using a Wireless Inertial Motion Capture Device-A Validation Study. Sensors 2019, 19, 1781. [Google Scholar] [CrossRef]
- Bravi, R.; Caputo, S.; Jayousi, S.; Martinelli, A.; Biotti, L.; Nannini, I.; Cohen, E.J.; Quarta, E.; Grasso, S.; Lucchesi, G.; et al. An Inertial Measurement Unit-Based Wireless System for Shoulder Motion Assessment in Patients with Cervical Spinal Cord Injury: A Validation Pilot Study in a Clinical Setting. Sensors 2021, 21, 1057. [Google Scholar] [CrossRef]
- Van Meulen, F.B.; van Beijnum, B.J.; Buurke, J.H.; Veltink, P.H. Assessment of lower arm movements using one inertial sensor. In Proceedings of the 2017 International Conference on Rehabilitation Robotics (ICORR), London, UK, 17–20 July 2017. [Google Scholar]
- Lakerveld, I. Test-Retest Reliability of an IMU Sensor-Base Method for Measuring Quality Metrics during Reach to Grasp Movement in Healthy Adults. Master’s Thesis, University of Twente, Enschede, The Netherlands, 2021. [Google Scholar]
- Romano, P.; Pournajaf, S.; Ottaviani, M.; Gison, A.; Infarinato, F.; Mantoni, C.; De Pandis, M.F.; Franceschini, M.; Goffredo, M. Sensor Network for Analyzing Upper Body Strategies in Parkinson’s Disease versus Normative Kinematic Patterns. Sensors 2021, 21, 3823. [Google Scholar] [CrossRef]
- Simon-Martinez, C.; Dos Santos, G.L.; Jaspers, E.; Vanderschueren, R.; Mailleux, L.; Klingels, K.; Ortibus, E.; Desloovere, K.; Feys, H. Age-related changes in upper limb motion during typical development. PLoS ONE 2018, 13, e0198524. [Google Scholar] [CrossRef]


| Hand | Forearm | Upper Arm | |||||||
|---|---|---|---|---|---|---|---|---|---|
| TD | DCP | p-Value | TD | DCP | p-Value | TD | DCP | p-Value | |
| Reach Forward | |||||||||
| Max Jerk (m/s³) | 259.60 (66.84) | 713.39 (428.07) | <0.001 | 173.18 (36.68) | 474.98 (334.60) | <0.001 | 64.18 (18.70) | 117.48 (74.70) | <0.001 |
| Max Ang Jerk (rad/s²) | 2132.77 (933.58) | 4367.23 (1992.18) | <0.001 | 1347.84 (338.62) | 2771.37 (1468.10) | <0.001 | 896.54 (268.62) | 1562.82 (809.96) | <0.001 |
| Mean Acc (m/s²) | 2.52 (0.67) | 2.67 (1.36) | 0.792 | 2.37 (0.49) | 2.44 (1.09) | 0.880 | 1.16 (0.50) | 1.39 (0.68) | 0.096 |
| Max Acc (m/s²) | 13.30 (4.89) | 31.58 (17.07) | <0.001 | 9.93 (2.35) | 23.76 (13.13) | <0.001 | 4.56 (1.70) | 7.61 (3.95) | <0.001 |
| Mean Gyr (rad/s) | 1.34 (0.39) | 1.50 (0.74) | 0.235 | 1.03 (0.30) | 1.14 (0.62) | 0.513 | 1.02 (0.31) | 0.95 (0.54) | 0.821 |
| Max Gyr (rad/s) | 4.65 (1.81) | 8.41 (3.50) | <0.001 | 3.97 (1.22) | 5.76 (2.48) | <0.001 | 3.43 (1.44) | 3.91 (1.35) | 0.144 |
| RMS Gyr (rad/s) | 1.71 (0.32) | 2.14 (1.03) | 0.101 | 1.36 (0.41) | 1.61 (0.90) | 0.392 | 1.43 (0.43) | 1.26 (0.67) | 0.860 |
| RMS Acc (m/s²) | 3.41 (0.60) | 4.26 (2.19) | 0.089 | 2.93 (0.46) | 3.49 (1.60) | 0.118 | 1.31 (0.59) | 1.69 (0.88) | 0.049 |
| SE Acc | 0.15 (0.22) | 0.15 (0.10) | 0.588 | 0.18 (0.21) | 0.18 (0.14) | 0.481 | 0.29 (0.31) | 0.26 (0.20) | 0.465 |
| SE Gyr | 0.14 (0.20) | 0.16 (0.11) | 0.989 | 0.13 (0.13) | 0.17 (0.09) | 0.546 | 0.12 (0.08) | 0.16 (0.11) | 0.066 |
| Reach and Grasp Vertical | |||||||||
| Max Jerk (m/s³) | 265.79 (125.95) | 713.80 (471.34) | <0.001 | 178.05 (58.59) | 510.68 (365.21) | <0.001 | 61.49 (18.62) | 139.02 (85.14) | <0.001 |
| Max Ang Jerk (rad/s²) | 2303.27 (825.93) | 4650.33 (2397.23) | <0.001 | 1684.83 (652.87) | 2561.37 (980.48) | <0.001 | 865.37 (272.50) | 1778.84 (1007.55) | <0.001 |
| Mean Acc (m/s²) | 2.26 (0.65) | 2.15 (0.82) | 1.000 | 2.24 (0.57) | 2.15 (0.91) | 0.958 | 1.06 (0.56) | 1.42 (0.41) | 0.054 |
| Max Acc (m/s²) | 13.62 (6.23) | 32.80 (17.02) | <0.001 | 10.76 (3.34) | 23.77 (14.45) | <0.001 | 4.15 (1.01) | 8.49 (3.50) | <0.001 |
| Mean Gyr (rad/s) | 1.33 (0.41) | 1.35 (0.52) | 1.000 | 0.93 (0.24) | 0.92 (0.70) | 0.979 | 0.92 (0.28) | 0.89 (0.37) | 1.000 |
| Max Gyr (rad/s) | 6.26 (1.36) | 9.56 (3.22) | <0.001 | 4.51 (0.82) | 6.26 (3.25) | 0.004 | 3.11 (0.95) | 4.20 (1.96) | <0.001 |
| RMS Gyr (rad/s) | 1.82 (0.33) | 2.05 (0.65) | 0.290 | 1.34 (0.37) | 1.41 (0.66) | 0.657 | 1.24 (0.40) | 1.24 (0.54) | 0.855 |
| RMS Acc (m/s²) | 2.98 (0.68) | 3.75 (1.98) | 0.067 | 2.71 (0.45) | 3.11 (1.99) | 0.118 | 1.30 (0.58) | 1.76 (0.66) | 0.009 |
| SE Acc | 0.18 (0.19) | 0.14 (0.11) | 0.133 | 0.25 (0.19) | 0.16 (0.15) | 0.192 | 0.37 (0.24) | 0.28 (0.23) | 0.106 |
| SE Gyr | 0.15 (0.17) | 0.12 (0.10) | 0.443 | 0.14 (0.14) | 0.15 (0.13) | 0.917 | 0.13 (0.06) | 0.14 (0.10) | 0.498 |
| Reach Sideways | |||||||||
| Max Jerk (m/s³) | 233.92 (58.71) | 590.64 (299.39) | <0.001 | 185.14 (84.70) | 442.08 (313.69) | <0.001 | 64.58 (27.32) | 139.74 (113.24) | <0.001 |
| Max Ang Jerk (rad/s²) | 2572.43 (1200.00) | 4926.06 (3111.24) | <0.001 | 1403.92 (613.41) | 2913.19 (2164.19) | <0.001 | 1058.38 (320.31) | 2172.85 (1033.44) | <0.001 |
| Mean Acc (m/s²) | 3.13 (0.96) | 3.00 (1.52) | 0.627 | 2.88 (0.71) | 2.92 (1.29) | 0.743 | 1.28 (0.34) | 1.57 (0.69) | 0.022 |
| Max Acc (m/s²) | 12.35 (4.09) | 27.73 (13.35) | <0.001 | 9.82 (3.56) | 22.44 (16.34) | <0.001 | 4.38 (0.97) | 8.90 (4.93) | <0.001 |
| Mean Gyr (rad/s) | 1.83 (0.66) | 1.96 (0.58) | 0.728 | 1.54 (0.59) | 1.63 (0.56) | 0.960 | 1.13 (0.41) | 1.12 (0.42) | 0.860 |
| Max Gyr (rad/s) | 5.72 (1.47) | 9.03 (4.59) | <0.001 | 5.04 (0.90) | 7.18 (3.63) | 0.002 | 4.00 (0.63) | 4.89 (1.56) | 0.034 |
| RMS Gyr (rad/s) | 2.23 (0.55) | 2.53 (0.98) | 0.461 | 1.98 (0.65) | 2.15 (0.77) | 0.940 | 1.51 (0.53) | 1.46 (0.58) | 0.513 |
| RMS Acc (m/s²) | 3.85 (0.93) | 4.65 (1.79) | 0.336 | 3.34 (0.86) | 3.85 (2.12) | 0.339 | 1.45 (0.38) | 1.89 (0.78) | 0.007 |
| SE Acc | 0.18 (0.26) | 0.17 (0.12) | 0.380 | 0.23 (0.27) | 0.22 (0.13) | 0.268 | 0.32 (0.32) | 0.27 (0.17) | 0.227 |
| SE Gyr | 0.16 (0.18) | 0.17 (0.13) | 0.647 | 0.13 (0.13) | 0.14 (0.13) | 0.208 | 0.12 (0.09) | 0.14 (0.07) | 0.190 |
Disclaimer/Publisher’s Note: The statements, opinions and data contained in all publications are solely those of the individual author(s) and contributor(s) and not of MDPI and/or the editor(s). MDPI and/or the editor(s) disclaim responsibility for any injury to people or property resulting from any ideas, methods, instructions or products referred to in the content. |
© 2023 by the authors. Licensee MDPI, Basel, Switzerland. This article is an open access article distributed under the terms and conditions of the Creative Commons Attribution (CC BY) license (https://creativecommons.org/licenses/by/4.0/).
Share and Cite
Vanmechelen, I.; Bekteshi, S.; Haberfehlner, H.; Feys, H.; Desloovere, K.; Aerts, J.-M.; Monbaliu, E. Reliability and Discriminative Validity of Wearable Sensors for the Quantification of Upper Limb Movement Disorders in Individuals with Dyskinetic Cerebral Palsy. Sensors 2023, 23, 1574. https://doi.org/10.3390/s23031574
Vanmechelen I, Bekteshi S, Haberfehlner H, Feys H, Desloovere K, Aerts J-M, Monbaliu E. Reliability and Discriminative Validity of Wearable Sensors for the Quantification of Upper Limb Movement Disorders in Individuals with Dyskinetic Cerebral Palsy. Sensors. 2023; 23(3):1574. https://doi.org/10.3390/s23031574
Chicago/Turabian StyleVanmechelen, Inti, Saranda Bekteshi, Helga Haberfehlner, Hilde Feys, Kaat Desloovere, Jean-Marie Aerts, and Elegast Monbaliu. 2023. "Reliability and Discriminative Validity of Wearable Sensors for the Quantification of Upper Limb Movement Disorders in Individuals with Dyskinetic Cerebral Palsy" Sensors 23, no. 3: 1574. https://doi.org/10.3390/s23031574
APA StyleVanmechelen, I., Bekteshi, S., Haberfehlner, H., Feys, H., Desloovere, K., Aerts, J.-M., & Monbaliu, E. (2023). Reliability and Discriminative Validity of Wearable Sensors for the Quantification of Upper Limb Movement Disorders in Individuals with Dyskinetic Cerebral Palsy. Sensors, 23(3), 1574. https://doi.org/10.3390/s23031574