
A New Method to Evaluate Pressure Distribution Using a 3D-Printed C2-C3 Cervical Spine Model with an Embedded Sensor Array

 ,
,  , , , and
Abstract
:1. Introduction
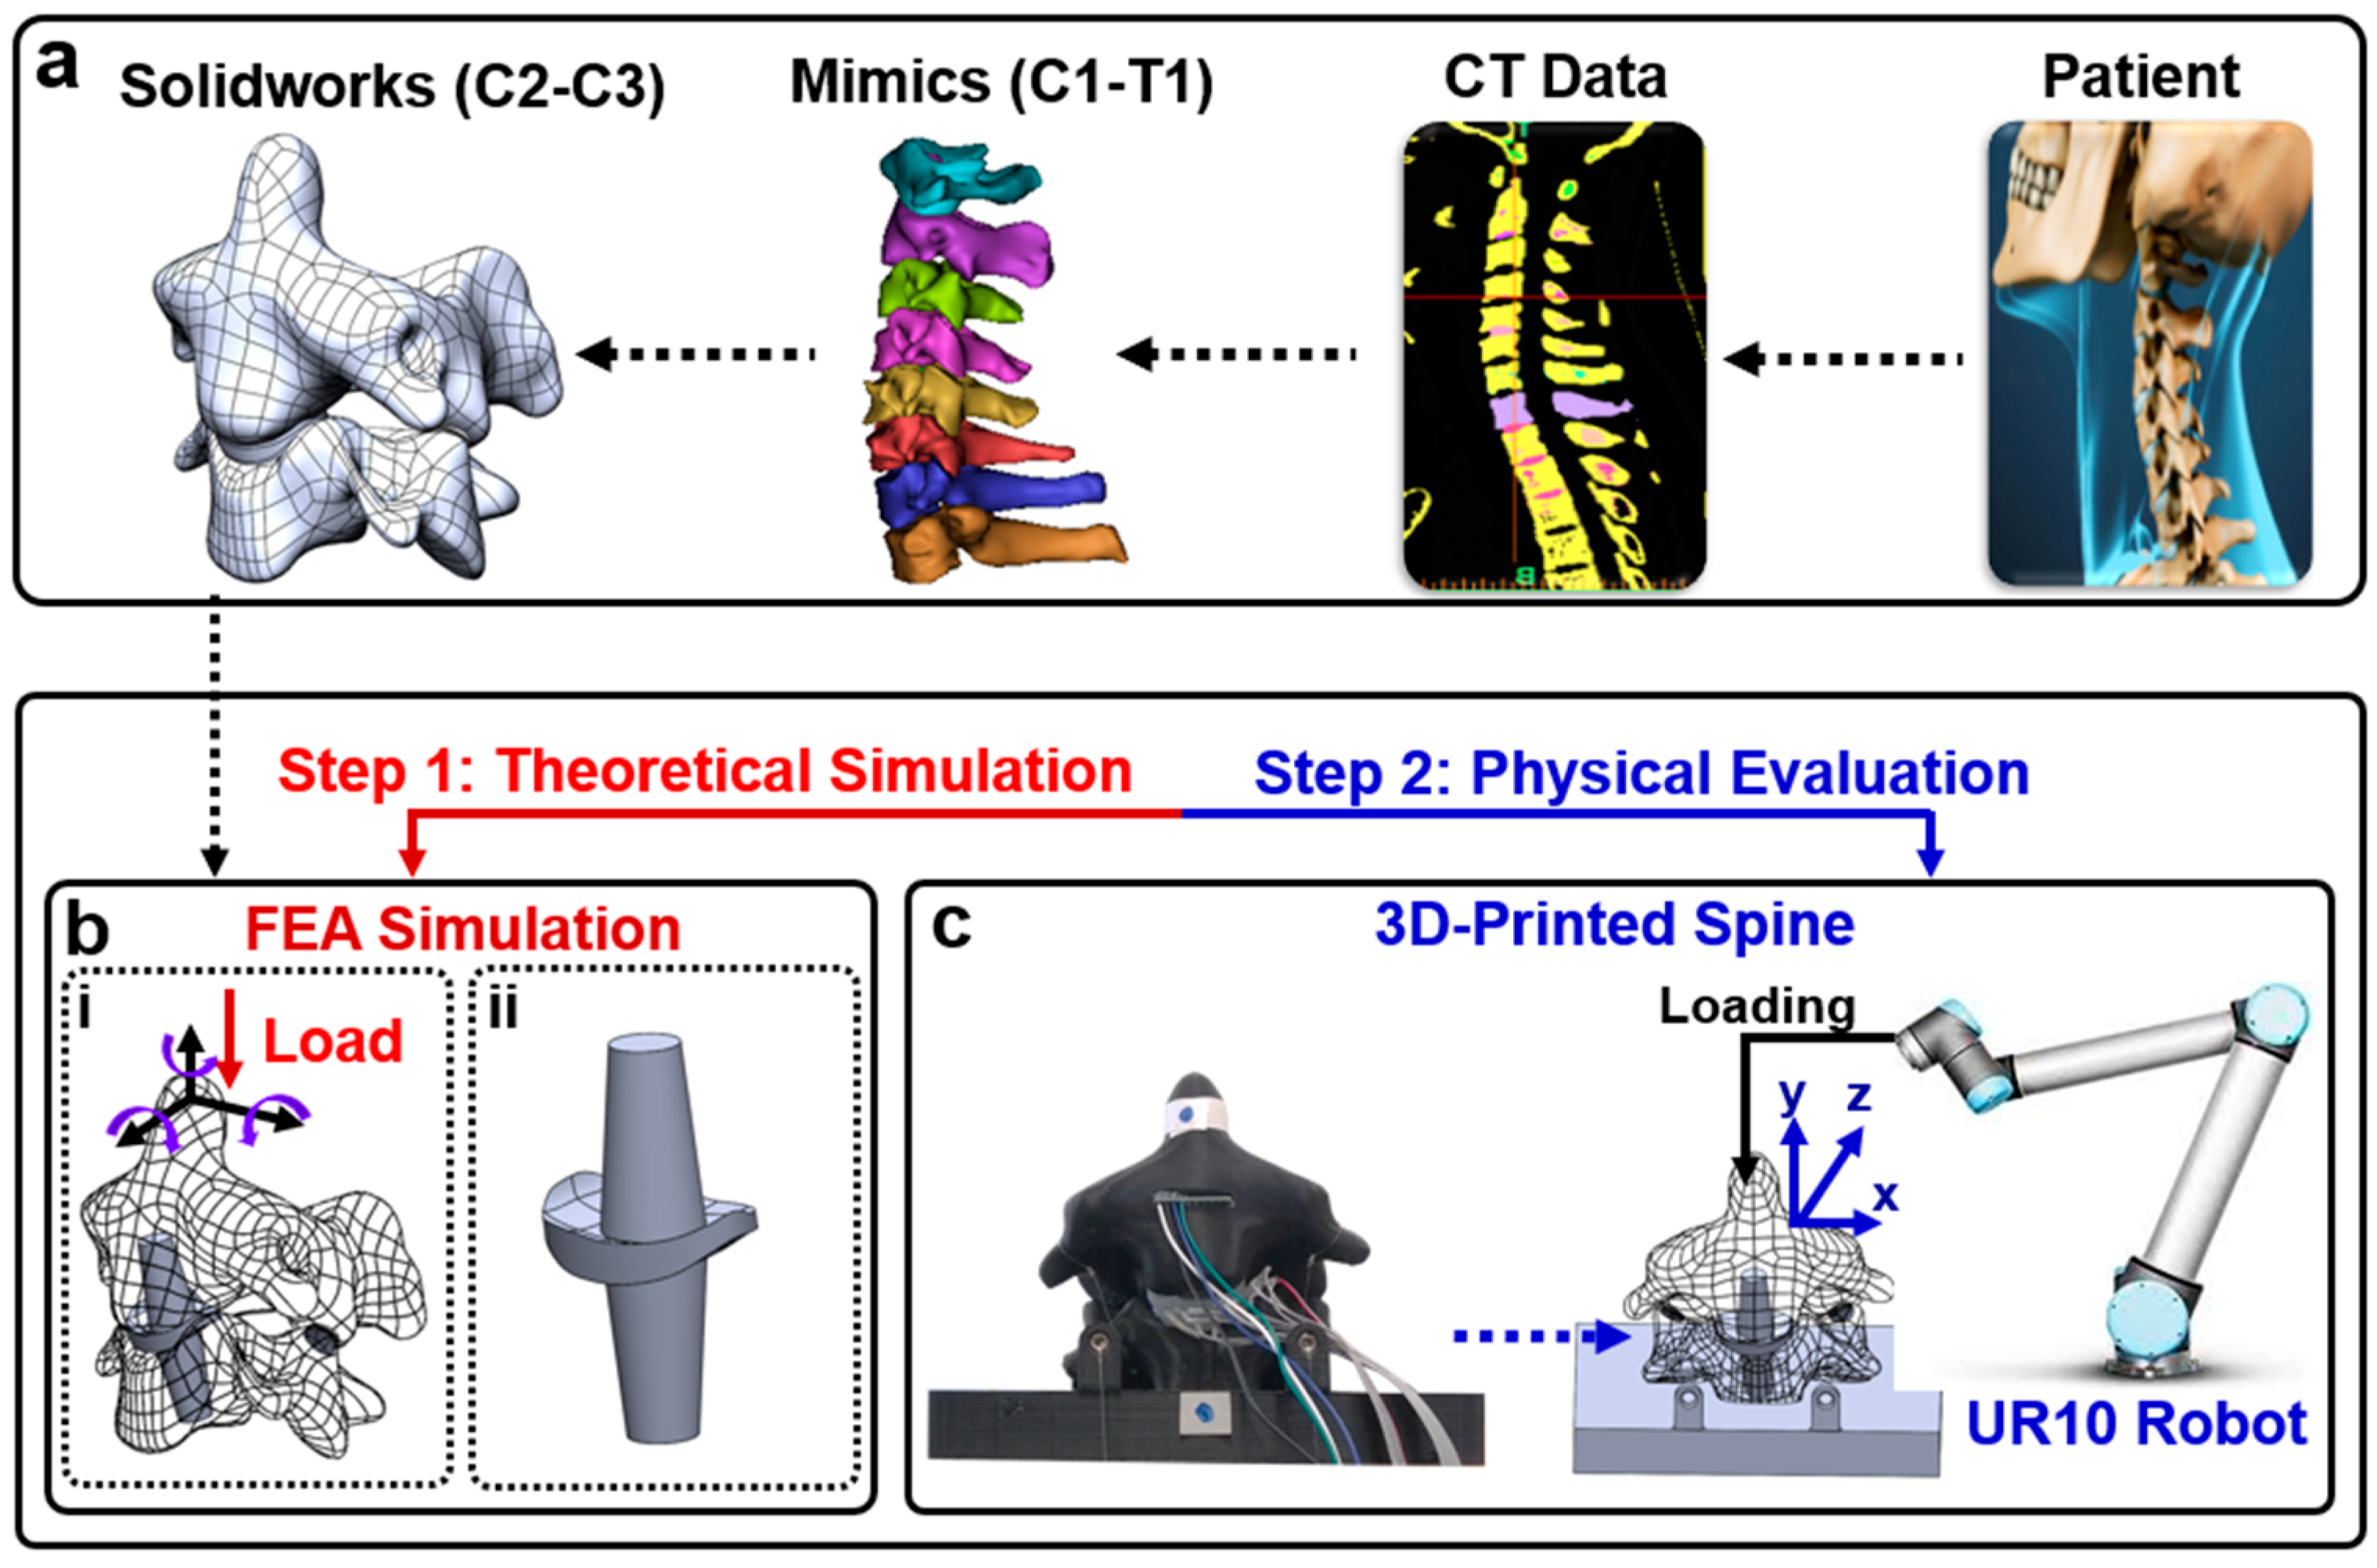
2. Materials and Methods
2.1. Fabrication
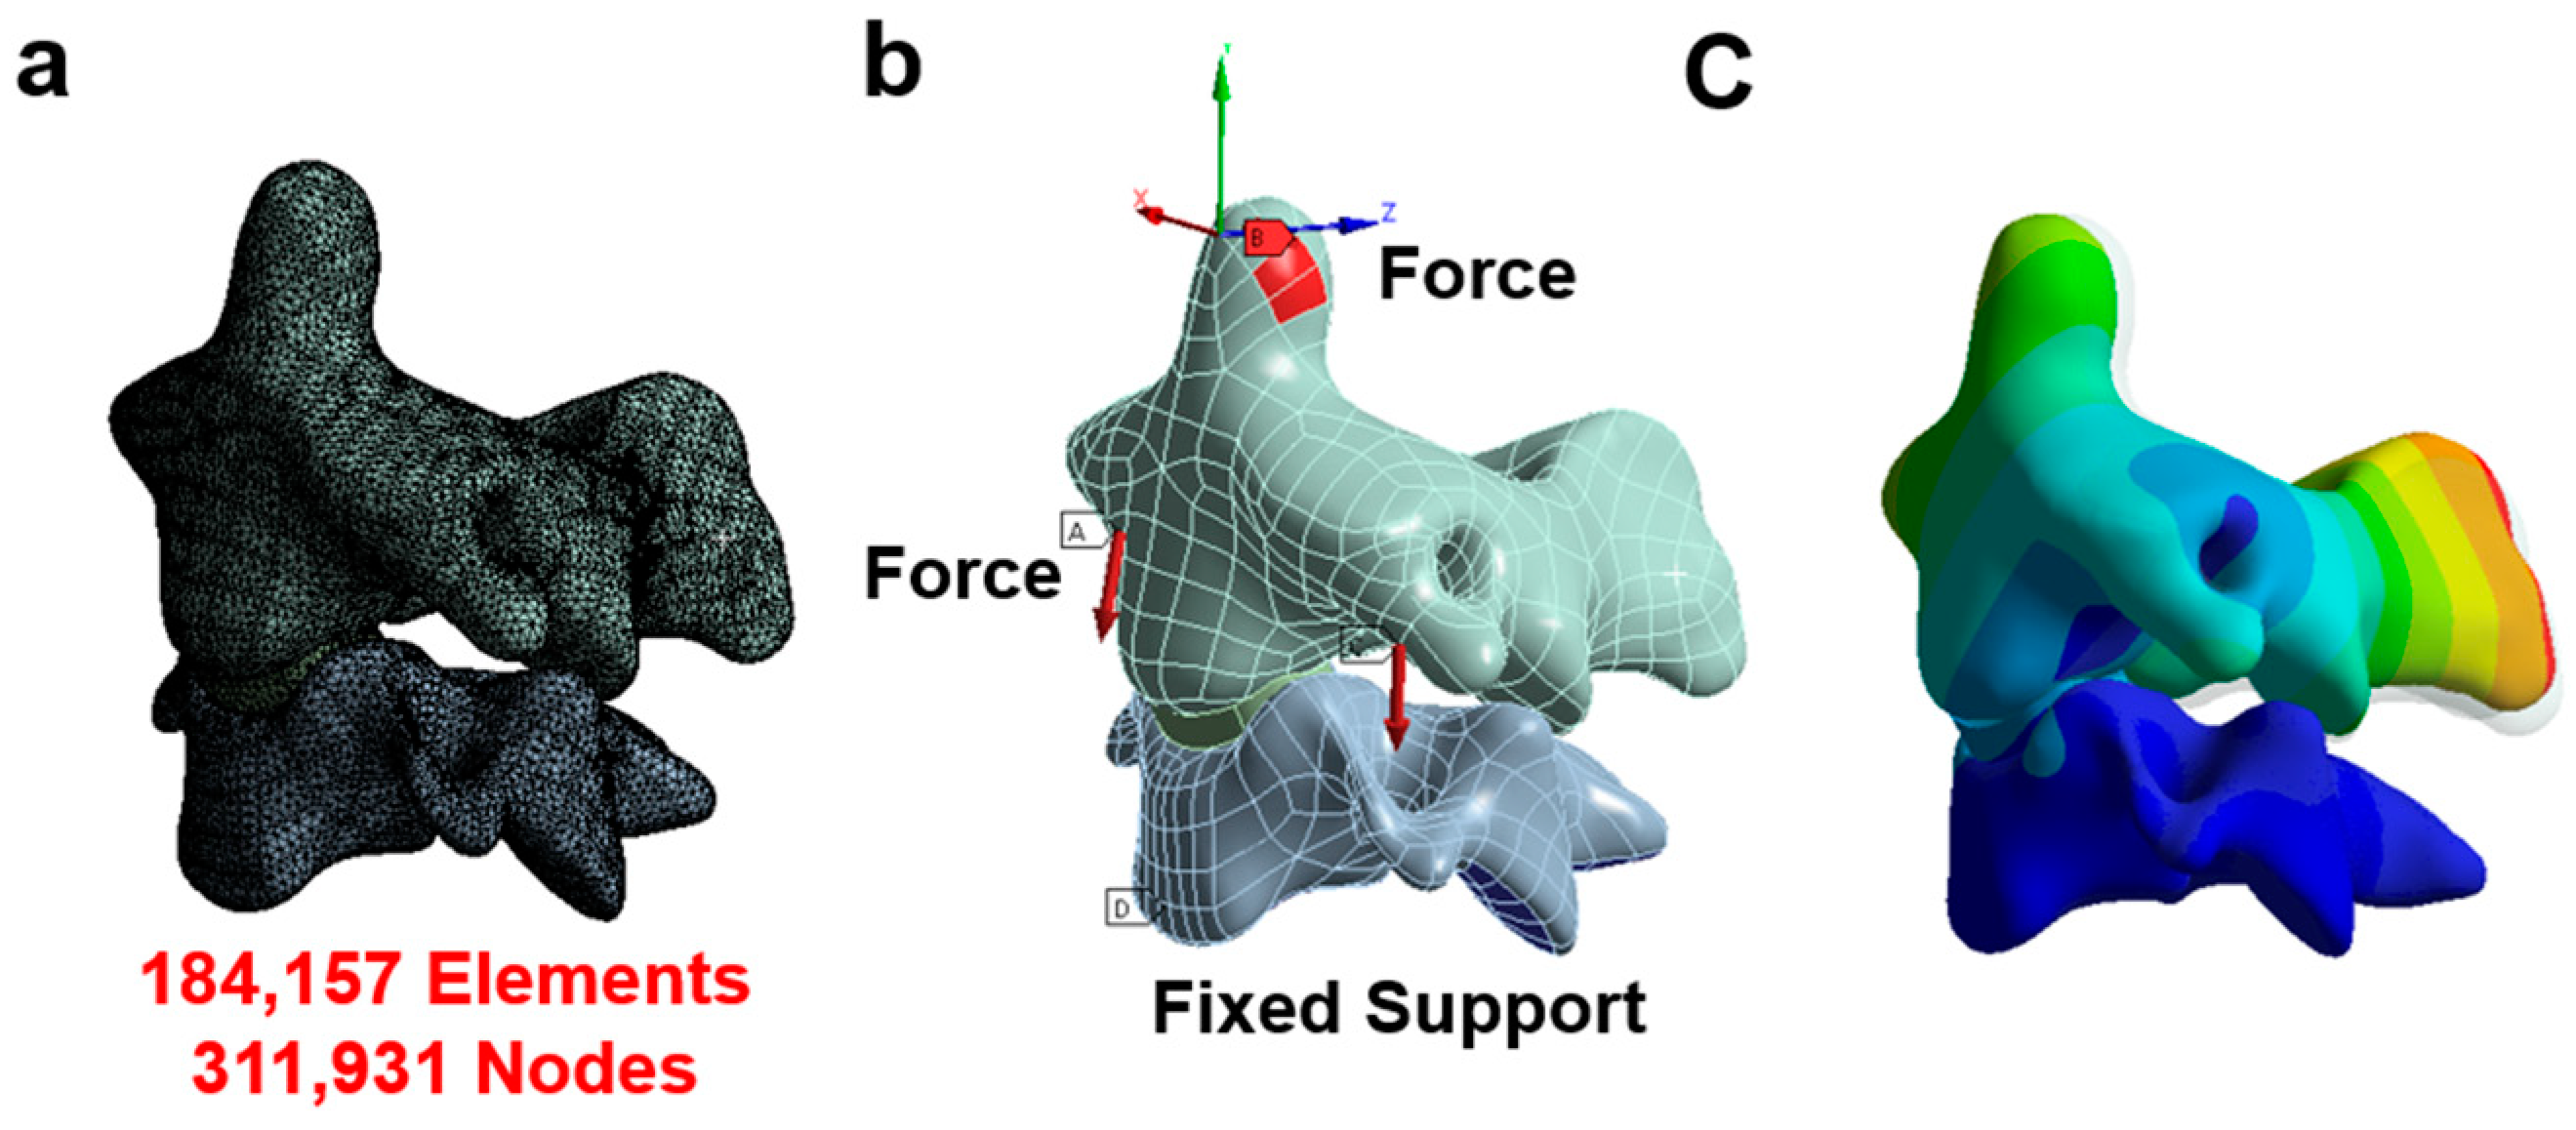
2.2. FEA Simulation
2.3. Physical Evaluation of Pressure Sensor Array and Range of Motion
2.4. Data Acquisition System
3. Results
3.1. Sensor Properties
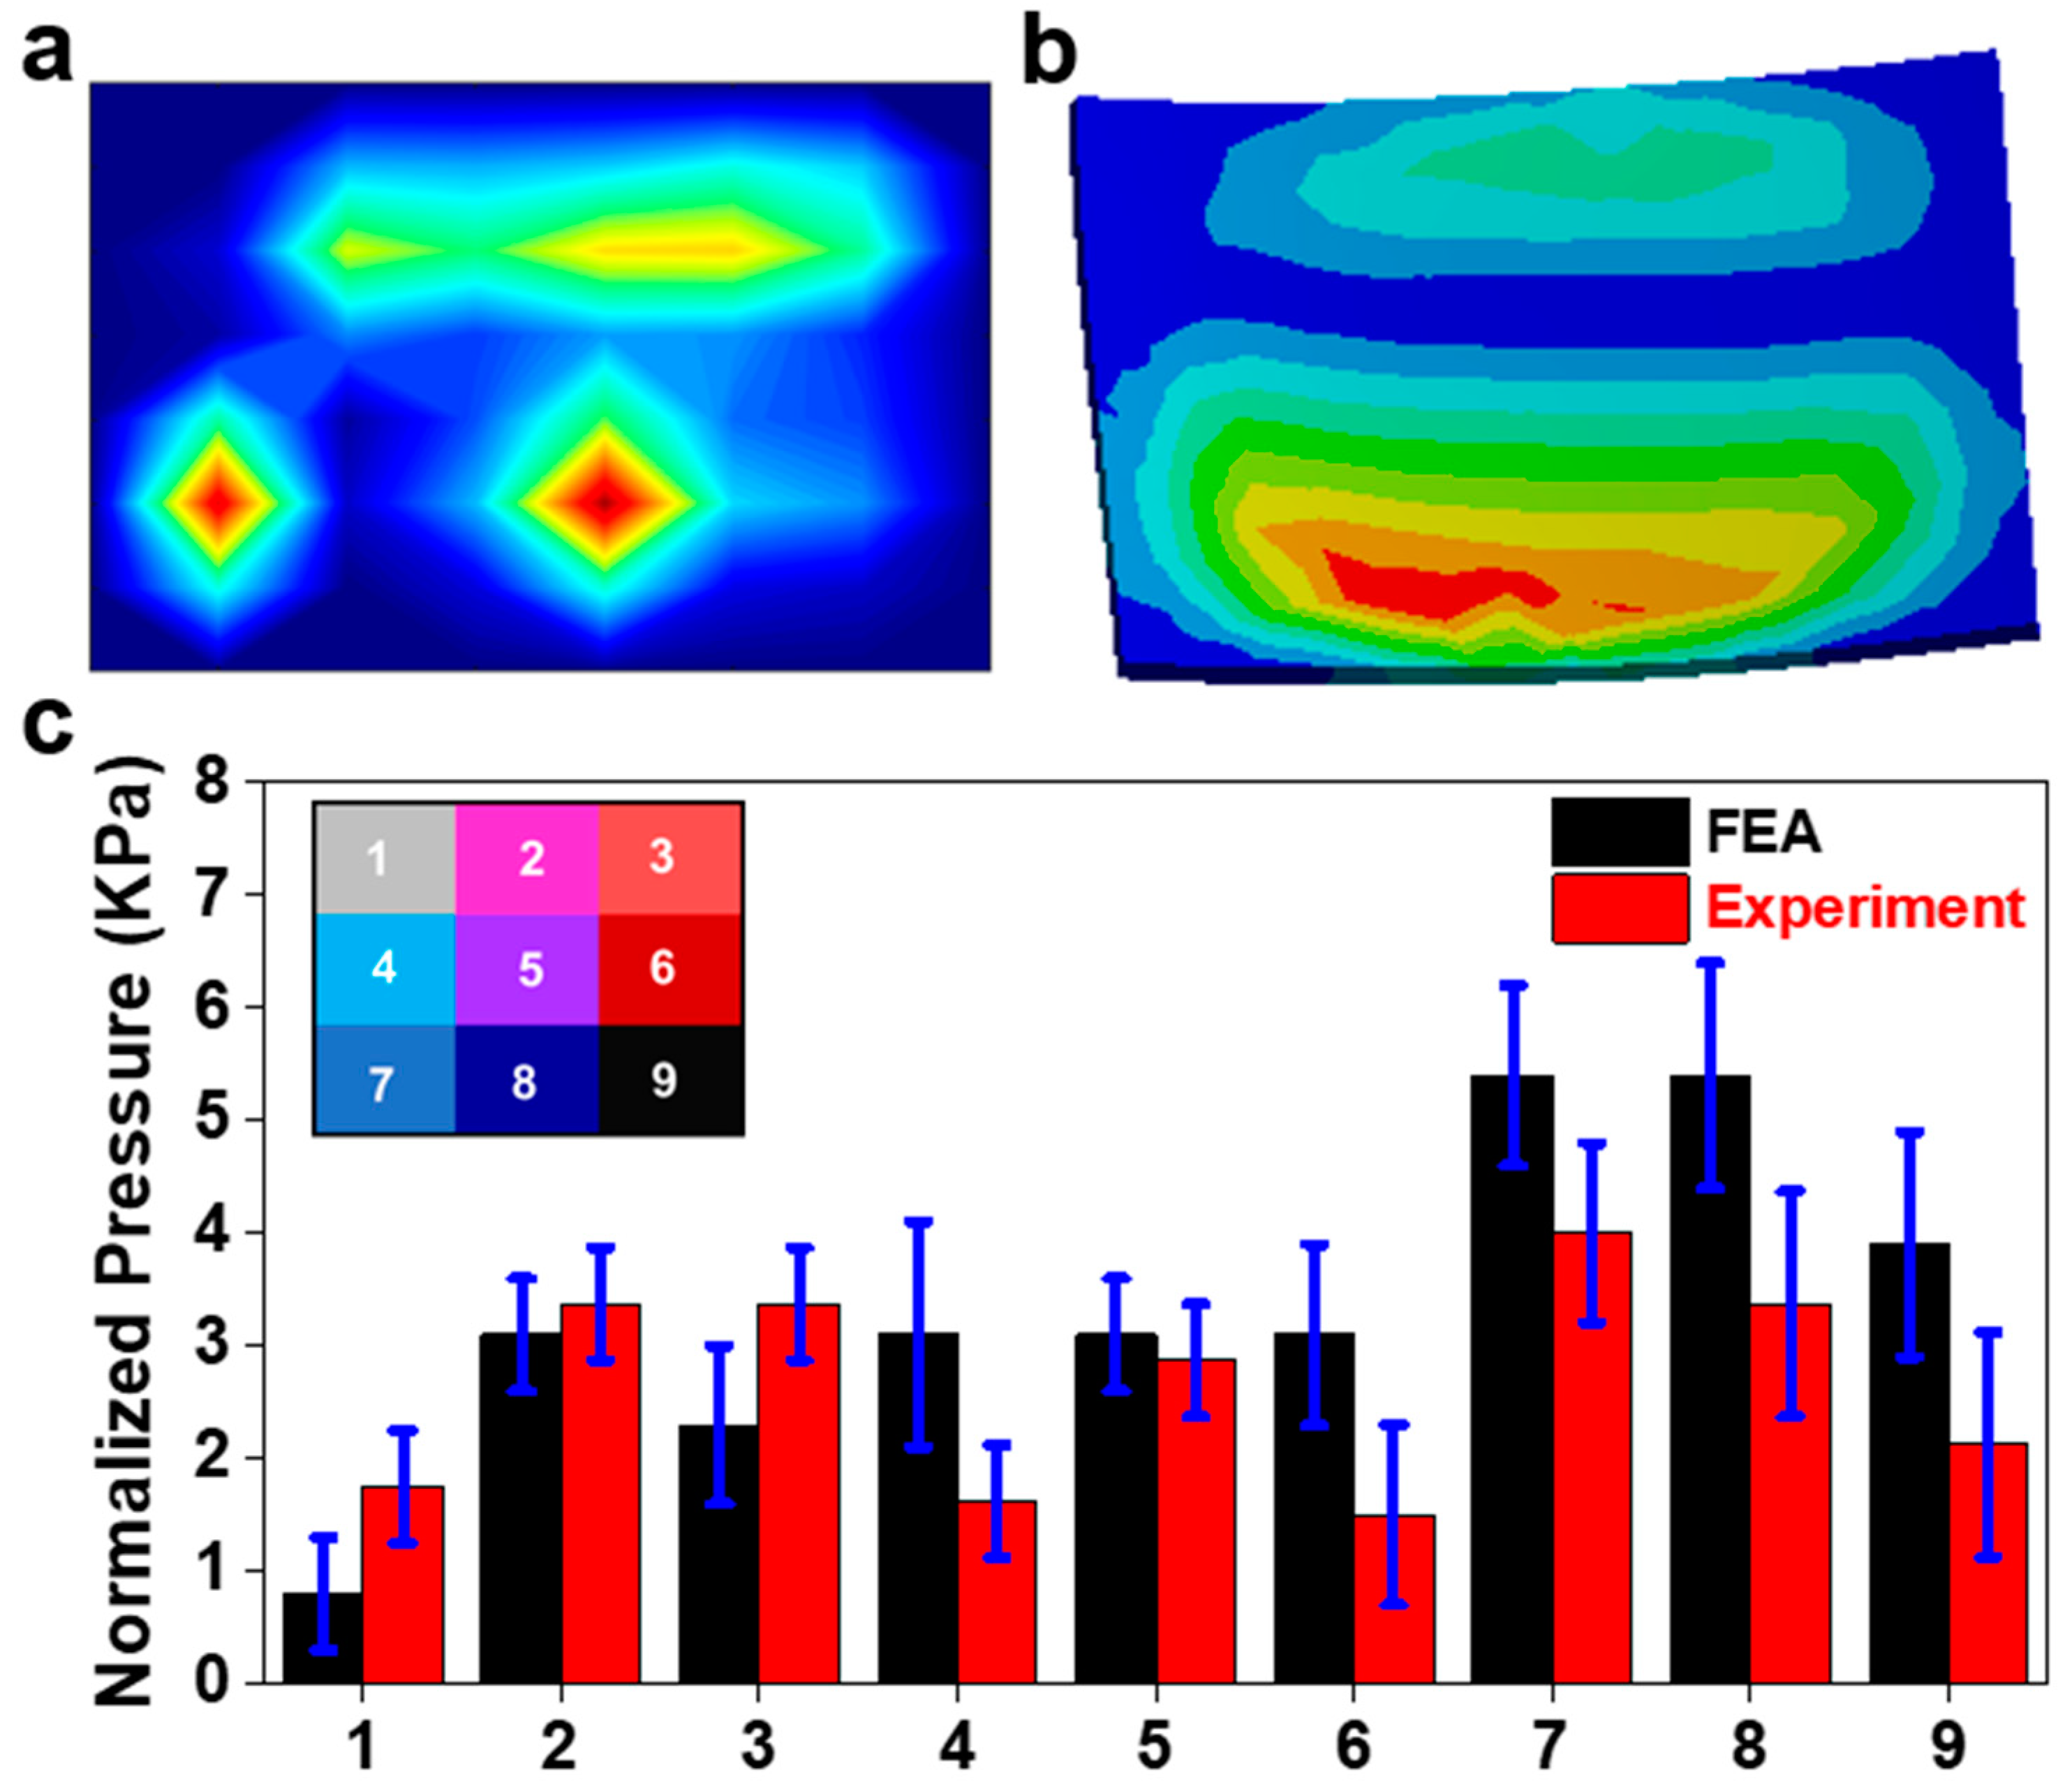
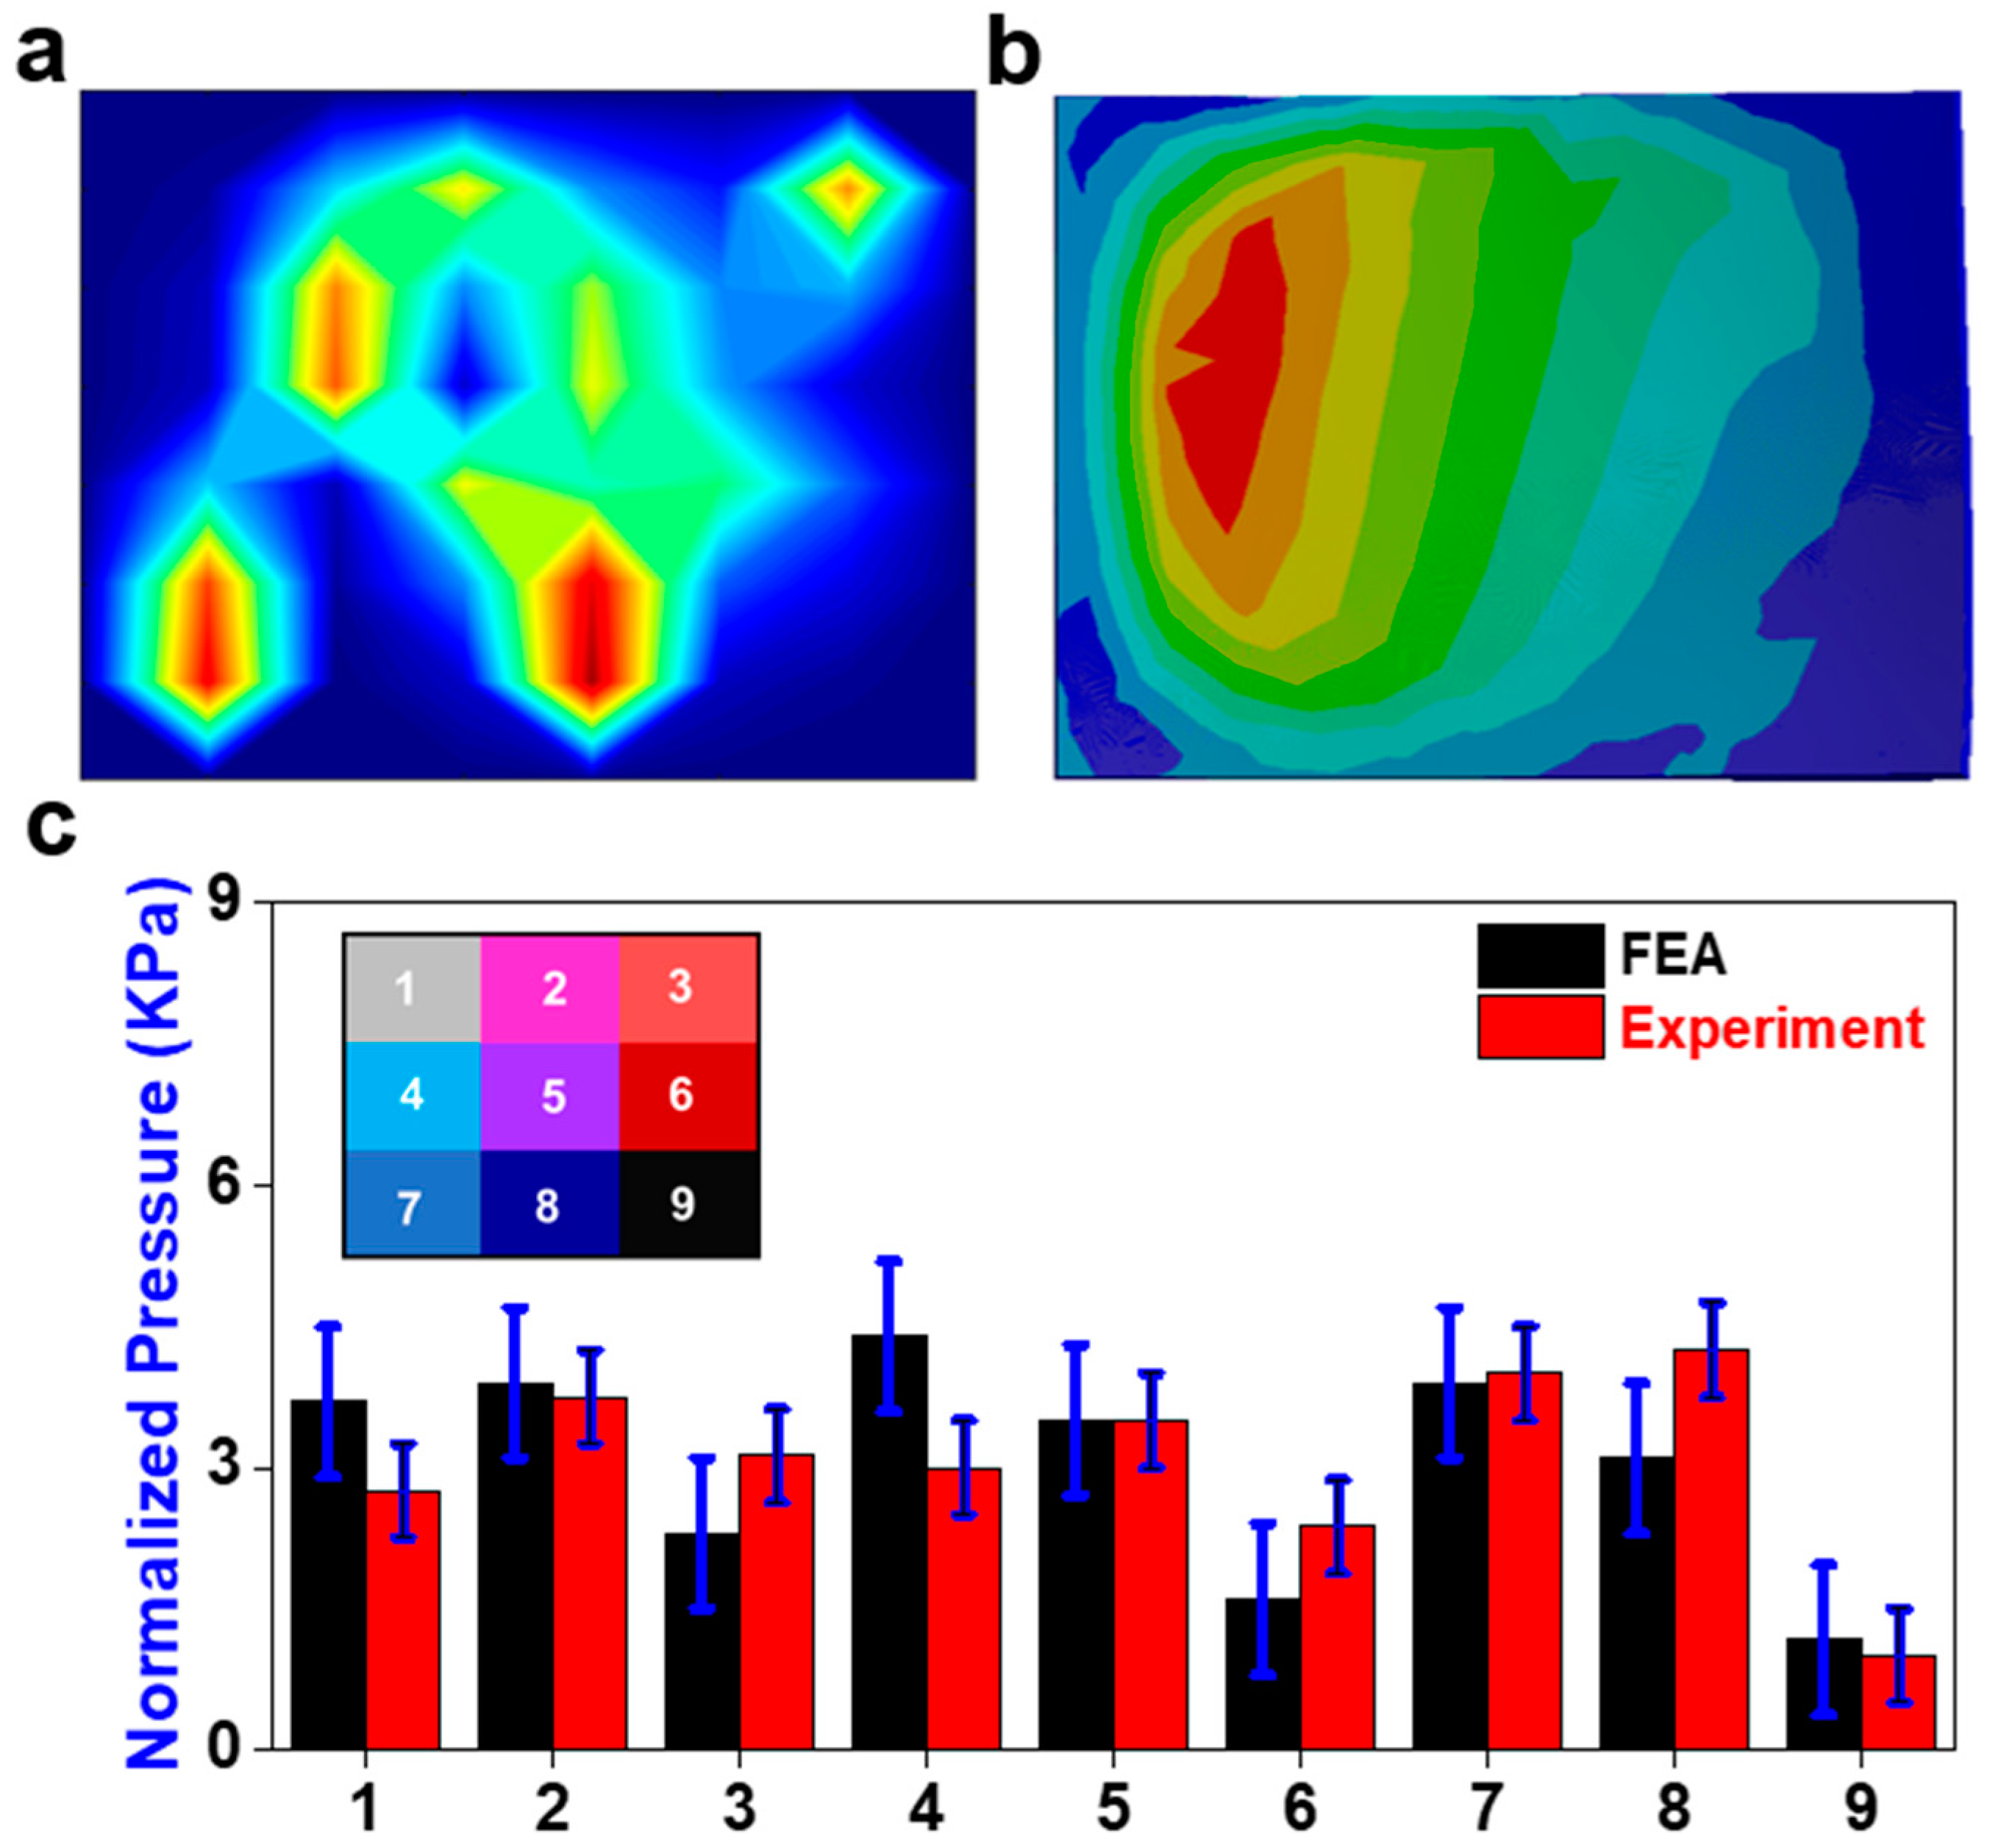
3.2. Flexion Application
3.3. Extension Application
3.4. Bending Application
3.5. Compression Application
4. Discussion
5. Conclusions
Author Contributions
Funding
Institutional Review Board Statement
Informed Consent Statement
Data Availability Statement
Conflicts of Interest
References
- Todd, A.G. Cervical spine: Degenerative conditions. Curr. Rev. Musculoskelet. Med. 2011, 4, 168. [Google Scholar] [CrossRef] [PubMed]
- McCarthy, M.H.; Weiner, J.A.; Patel, A.A. Strategies to Achieve Spinal Fusion in Multilevel Anterior Cervical Spine Surgery: An Overview. HSS J. 2019, 16, 155–161. [Google Scholar] [CrossRef] [PubMed]
- Nguyen, N.-L.M.; Kong, C.Y.; Hart, R.A. Proximal junctional kyphosis and failure—Diagnosis, revention, and treatment. Curr. Rev. Musculoskelet. Med. 2016, 9, 299–308. [Google Scholar] [CrossRef] [PubMed]
- Jacobson, R.E.; Granville, M.; Berti, A. Minimally invasive anterior cervical discectomy without fusion to treat cervical disc herniations in patients with previous cervical fusions. Cureus 2017, 9, e1131. [Google Scholar] [CrossRef] [PubMed]
- Wahood, W.; Yolcu, Y.U.; Kerezoudis, P.; Goyal, A.; Alvi, M.A.; Freedman, B.A.; Bydon, M. Artificial Discs in Cervical Disc Replacement: A Meta-Analysis for Comparison of Long-Term Outcomes. World Neurosurg. 2019, 134, 598–613.e5. [Google Scholar] [CrossRef] [PubMed]
- Bashkuev, M.; Vergroesen, P.-P.A.; Dreischarf, M.; Schilling, C.; van der Veen, A.J.; Schmidt, H.; Kingma, I. Intradiscal pressure measurements: A challenge or a routine? J. Biomech. 2016, 49, 864–868. [Google Scholar] [CrossRef] [PubMed]
- Cripton, P.A.; Dumas, G.A.; Nolte, L.P. A minimally disruptive technique for measuring intervertebral disc pressure in vitro: Application to the cervical spine. J. Biomech. 2001, 34, 545–549. [Google Scholar] [CrossRef]
- Dennison, C.R.; Wild, P.M.; Byrnes, P.W.; Saari, A.; Itshayek, E.; Wilson, D.C.; Zhu, Q.A.; Dvorak, M.F.; Cripton, P.A.; Wilson, D.R. Ex vivo measurement of lumbar intervertebral disc pressure using fibre-Bragg gratings. J. Biomech. 2008, 41, 221–225. [Google Scholar] [CrossRef]
- Dennison, C.R.; Wild, M.; Dvorak, M.F.; Wilson, D.R.; Cripton, A. Validation of a novel minimally invasive intervertebral disc pressure sensor utilizing in-fiber Bragg gratings in a porcine model: An ex vivo study. Spine 2008, 33, E589–E594. [Google Scholar] [CrossRef]
- Dennison, C.R.; Wild, M.; Wilson, D.R.; Cripton, A. A minimally invasive in-fiber Bragg grating sensor for intervertebral disc pressure measurements. Meas. Sci. Technol. 2008, 19, 085201. [Google Scholar] [CrossRef]
- Nesson, S.C.; Yu, M.; Hsieh, A.H. Transient pressure measurements in rat intervertebral discs during stress relaxation. In Proceedings of the Conference on Transactions of the 54th Annual Meeting of the Orthopaedic Research Society, San Francisco, CA, USA, 2–5 March 2008; Volume 46. [Google Scholar]
- Moore, M.K.; Fulop, S.; Tabib-Azar, M.; Hart, D.J. Piezoresistive pressure sensors in the measurement of intervertebral disc hydrostatic pressure. Spine J. 2009, 9, 1030–1034. [Google Scholar] [CrossRef] [PubMed]
- Polga, D.J.; Beaubien, B.P.; Kallemeier, P.M.; Schellhas, K.P.; Lew, W.D.; Buttermann, G.R.; Wood, K.B. Measurement of in vivo intradiscal pressure in healthy thoracic intervertebral discs. Spine 2004, 29, 1320–1324. [Google Scholar] [CrossRef] [PubMed]
- Hwang, D.; Gabai, A.S.; Yu, M.; Yew, A.G.; Hsieh, A.H. Role of load history in intervertebral disc mechanics and intradiscal pressure generation. Biomech. Model. Mechanobiol. 2012, 11, 95–106. [Google Scholar] [CrossRef] [PubMed]
- Bohl, M.A.; Mooney, M.A.; Repp, G.J.; Nakaji, P.; Chang, S.W.; Turner, J.D.; Kakarla, U.K. The Barrow Biomimetic Spine: Fluoroscopic analysis of a synthetic spine model made of variable 3D-printed materials and print parameters. Spine 2018, 43, E1368–E1375. [Google Scholar] [CrossRef] [PubMed]
- Chen, D.; Chen, C.-H.; Tang, L.; Wang, K.; Li, Y.-Z.; Phan, K.; Wu, A.-M. Three-dimensional reconstructions in spine and screw trajectory simulation on 3D digital images: A step by step approach by using Mimics software. J. Spine Surg. 2017, 3, 650–656. [Google Scholar] [CrossRef] [PubMed]
- Cheng, S.; Fletcher, D.; Hemley, S.; Stoodley, M.; Bilston, L. Effects of fluid structure interaction in a three dimensional model of the spinal subarachnoid space. J. Biomech. 2014, 47, 2826–2830. [Google Scholar] [CrossRef] [PubMed]
- Clifton, W.; Damon, A.; Soares, C.; Nottmeier, E.; Pichelmann, M. Investigation of a three-dimensional printed dynamic cervical spine model for anatomy and physiology education. Clin. Anat. 2021, 34, 30–39. [Google Scholar] [CrossRef]
- Clifton, W.; Nottmeier, E.; Damon, A.; Dove, C.; Pichelmann, M. The future of biomechanical spine research: Conception and design of a dynamic 3d printed cervical myelography phantom. Cureus 2019, 11, e4591. [Google Scholar] [CrossRef]
- Clifton, W.; Pichelmann, M.; Vlasak, A.; Damon, A.; ReFaey, K.; Nottmeier, E. Investigation and feasibility of combined 3d printed thermoplastic filament and polymeric foam to simulate the cortiocancellous interface of human vertebrae. Sci. Rep. 2020, 10, 2912. [Google Scholar] [CrossRef]
- Parr, W.C.H.; Burnard, J.L.; Wilson, P.J.; Mobbs, R.J. 3D printed anatomical (bio)models in spine surgery: Clinical benefits and value to health care providers. J. Spine Surg. 2019, 5, 549–560. [Google Scholar] [CrossRef]
- Wu, A.-M.; Lin, J.-L.; Kwan, K.Y.H.; Wang, X.-Y.; Zhao, J. 3D-printing techniques in spine surgery: The future prospects and current challenges. Expert Rev. Med. Devices 2018, 15, 399–401. [Google Scholar] [CrossRef]
- Wu, A.-M.; Shao, Z.-X.; Wang, J.-S.; Yang, X.-D.; Weng, W.-Q.; Wang, X.-Y.; Xu, H.-Z.; Chi, Y.-L.; Lin, Z.-K. The accuracy of a method for printing three-dimensional spinal models. PLoS ONE 2015, 10, e0124291. [Google Scholar] [CrossRef]
- Lee, J.K.; Desmoulin, G.T.; Khan, A.H.; Park, E.J. Comparison of 3D spinal motions during stair-climbing between individuals with and without low back pain. Gait Posture 2011, 34, 222–226. [Google Scholar] [CrossRef]
- Lee, J.K.; Park, E.J. 3D spinal motion analysis during staircase walking using an ambulatory inertial and magnetic sensing system. Med. Biol. Eng. Comput. 2011, 49, 755–764. [Google Scholar] [CrossRef]
- Stollenwerk, K.; Müller, J.; Hinkenjann, A.; Krüger, B. Analyzing Spinal Shape Changes During Posture Training Using a Wearable Device. Sensors 2019, 19, 3625. [Google Scholar] [CrossRef]
- Boutry, C.M.; Nguyen, A.; Lawal, Q.O.; Chortos, A.; Rondeau-Gagné, S.; Bao, Z. A sensitive and biodegradable pressure sensor array for cardiovascular monitoring. Adv. Mater. 2015, 27, 6954–6961. [Google Scholar] [CrossRef]
- Woo, S.-J.; Kong, J.-H.; Kim, D.-G.; Kim, J.-M. A thin all-elastomeric capacitive pressure sensor array based on micro-contact printed elastic conductors. J. Mater. Chem. C 2014, 2, 4415–4422. [Google Scholar] [CrossRef]
- Chen, D.; Cai, Y.; Huang, M.-C. Customizable pressure sensor array: Design and evaluation. IEEE Sens. J. 2018, 18, 6337–6344. [Google Scholar] [CrossRef]
- Jones, M.H.; Goubran, R.; Knoefel, F. Identifying movement onset times for a bed-based pressure sensor array. In Proceedings of the IEEE International Workshop on Medical Measurement and Applications, MeMea 2006, Benevento, Italy, 20–21 April 2006; IEEE: Piscataway, NJ, USA, 2006; pp. 111–114. [Google Scholar]
- Feng, Z.-H.; Li, X.-B.; Phan, K.; Hu, Z.-C.; Zhang, K.; Zhao, J.; Ni, W.-F.; Wu, A.-M. Design of a 3D navigation template to guide the screw trajectory in spine: A step-by-step approach using Mimics and 3-Matic software. J. Spine Surg. 2018, 4, 645–653. [Google Scholar] [CrossRef]
- Tyndyk, M.A.; Barron, V.; McHugh, P.E.; Mahoney, D.O. Generation of a finite element model of the thoracolumbar spine. Acta Bioeng. Biomech. 2007, 9, 35. [Google Scholar]
- Coombs, D.; Rao, M.; Bushelow, M.; Deacy, J.; Laz, P.; Rullkoetter, P. Simulation of lumbar spine biomechanics using Abaqus. In Proceedings of the SIMULIA Customer Conference, Barcelona, Spain, 17–19 May 2011. [Google Scholar]
- Song, M.; Zhang, Z.; Lu, M.; Zong, J.; Dong, C.; Ma, K.; Wang, S. Four lateral mass screw fixation techniques in lower cervical spine following laminectomy: A finite element analysis study of stress distribution. Biomed. Eng. Online 2014, 13, 115. [Google Scholar] [CrossRef]
- Chang, T.-K.; Hsu, C.-C.; Chen, K.-T. Optimal screw orientation for the fixation of cervical degenerative disc disease using nonlinear C3-T2 multi-level spinal models and neuro-genetic algorithms. Acta Bioeng. Biomech. 2015, 17, 59–66. [Google Scholar]
- Hsu, C.-C.; Chang, T.-K.; Huy, D.C. Biomechanical comparison of different vertebral plate designs for anterior cervical discectomy and fusion using nonlinear c3-t2 multi-level spinal models. Comput. Des. Appl. 2015, 12, 226–231. [Google Scholar] [CrossRef]
- Lin, M.; Shapiro, S.Z.; Doulgeris, J.; Engeberg, E.D.; Tsai, C.-T.; Vrionis, F.D. Cage-screw and anterior plating combination reduces the risk of micromotion and subsidence in multilevel anterior cervical discectomy and fusion—A finite element study. Spine J. 2021, 21, 874–882. [Google Scholar] [CrossRef]
- Lin, M.; Paul, R.; Shapiro, S.Z.; Doulgeris, J.; O’connor, T.E.; Tsai, C.-T.; Vrionis, F.D. Biomechanical Study of Cervical Endplate Removal on Subsidence and Migration in Multilevel Anterior Cervical Discectomy and Fusion. Asian Spine J. 2022, 16, 615–624. [Google Scholar] [CrossRef]
- Lin, M.; Shapiro, S.Z.; Engeberg, E.D.; Tsai, C.-T.; Vrionis, F.D. Finite Element Analysis of the Effect of Dynamic Plating on Two-Level Anterior Cervical Discectomy Fusion Biomechanics. World Neurosurg. 2022, 163, e43–e52. [Google Scholar] [CrossRef]
- Lin, M.; Paul, R.; Dhar, U.K.; Doulgeris, J.; O’connor, T.E.; Tsai, C.-T.; Vrionis, F.D. A Review of Finite Element Modeling for Anterior Cervical Discectomy and Fusion. Asian Spine J. 2023, 17, 949–963. [Google Scholar] [CrossRef]
- Zhang, P.; Hu, Z.; Xie, H.; Lee, G.-H.; Lee, C.-H. Friction and wear characteristics of polylactic acid (PLA) for 3D printing under reciprocating sliding condition. Ind. Lubr. Tribol. 2019, 72, 533–539. [Google Scholar] [CrossRef]
- Caulfield, D.F.; Gunderson, D. Paper testing and strength characteristics. In Proceedings of the 1988 Paper Preservation Symposium, Washington, DC, USA, 19–21 October 1988; pp. 31–40. [Google Scholar]
- Cox, H.L. The elasticity and strength of paper and other fibrous materials. Br. J. Appl. Phys. 1952, 3, 72. [Google Scholar] [CrossRef]
- Tsuang, Y.-H.; Chiang, Y.-F.; Hung, C.-Y.; Wei, H.-W.; Huang, C.-H.; Cheng, C.-K. Comparison of cage application modality in posterior lumbar interbody fusion with posterior instrumentation—A finite element study. Med. Eng. Phys. 2009, 31, 565–570. [Google Scholar] [CrossRef]
- Dhar, U.K.; Menzer, E.L.; Lin, M.; Hagerty, V.; O’Connor, T.; Tsai, C.-T.; Vrionis, F.D. Factors influencing cage subsidence in anterior cervical corpectomy and discectomy: A systematic review. Eur. Spine J. 2023, 32, 957–968. [Google Scholar] [CrossRef]
- Lin, M.; Paul, R.; Abd, M.; Jones, J.; Dieujuste, D.; Chim, H.; Engeberg, E.D. Feeling the beat: A smart hand exoskeleton for learning to play musical instruments. J Front. Robot. AI 2023, 10, 1212768. [Google Scholar] [CrossRef]
- Lin, M.; Abd, M.A.; Taing, A.; Tsai, C.-T.; Vrionis, F.D.; Engeberg, E.D. Robotic replica of a human spine uses soft magnetic sensor array to forecast intervertebral loads and posture after surgery. Sensors 2021, 22, 212. [Google Scholar] [CrossRef]


Disclaimer/Publisher’s Note: The statements, opinions and data contained in all publications are solely those of the individual author(s) and contributor(s) and not of MDPI and/or the editor(s). MDPI and/or the editor(s) disclaim responsibility for any injury to people or property resulting from any ideas, methods, instructions or products referred to in the content. |
© 2023 by the authors. Licensee MDPI, Basel, Switzerland. This article is an open access article distributed under the terms and conditions of the Creative Commons Attribution (CC BY) license (https://creativecommons.org/licenses/by/4.0/).
Share and Cite
Lin, M.; Paul, R.; Liao, X.; Doulgeris, J.; Menzer, E.L.; Dhar, U.K.; Tsai, C.-T.; Vrionis, F.D. A New Method to Evaluate Pressure Distribution Using a 3D-Printed C2-C3 Cervical Spine Model with an Embedded Sensor Array. Sensors 2023, 23, 9547. https://doi.org/10.3390/s23239547
Lin M, Paul R, Liao X, Doulgeris J, Menzer EL, Dhar UK, Tsai C-T, Vrionis FD. A New Method to Evaluate Pressure Distribution Using a 3D-Printed C2-C3 Cervical Spine Model with an Embedded Sensor Array. Sensors. 2023; 23(23):9547. https://doi.org/10.3390/s23239547
Chicago/Turabian StyleLin, Maohua, Rudy Paul, Xinqin Liao, James Doulgeris, Emma Lilly Menzer, Utpal Kanti Dhar, Chi-Tay Tsai, and Frank D. Vrionis. 2023. "A New Method to Evaluate Pressure Distribution Using a 3D-Printed C2-C3 Cervical Spine Model with an Embedded Sensor Array" Sensors 23, no. 23: 9547. https://doi.org/10.3390/s23239547
APA StyleLin, M., Paul, R., Liao, X., Doulgeris, J., Menzer, E. L., Dhar, U. K., Tsai, C.-T., & Vrionis, F. D. (2023). A New Method to Evaluate Pressure Distribution Using a 3D-Printed C2-C3 Cervical Spine Model with an Embedded Sensor Array. Sensors, 23(23), 9547. https://doi.org/10.3390/s23239547