Abstract
Slow-paced breathing is a clinical intervention used to increase heart rate variability (HRV). The practice is made more accessible via cost-free smartphone applications like Elite HRV. We investigated whether Elite HRV can accurately measure and augment HRV via its slow-paced breathing feature. Twenty young adults completed one counterbalanced cross-over protocol involving 10 min each of supine spontaneous (SPONT) and paced (PACED; 6 breaths·min−1) breathing while RR intervals were simultaneously recorded via a Polar H10 paired with Elite HRV and reference electrocardiography (ECG). Individual differences in HRV between devices were predominately skewed, reflecting a tendency for Elite HRV to underestimate ECG-derived values. Skewness was typically driven by a limited number of outliers as median bias values were ≤1.3 ms and relative agreement was ≥very large for time-domain parameters. Despite no significant bias and ≥large relative agreement for frequency-domain parameters, limits of agreement (LOAs) were excessively wide and tended to be wider during PACED for all HRV parameters. PACED significantly increased low-frequency power (LF) for Elite HRV and ECG, and between-condition differences showed very large relative agreement. Elite HRV-guided slow-paced breathing effectively increased LF values, but it demonstrated greater precision during SPONT and in computing time-domain HRV.
1. Introduction
The autonomic nervous system (ANS), composed of the sympathetic (SNS; “fight-or-flight”) and parasympathetic nervous systems (PNS; “rest-and-digest”), regulates involuntarily controlled physiological phenomena such as heart rate (HR), blood pressure, respiration, and digestion [1,2]. Increased PNS, or vagal activity, decreases HR and increases variability in the inter-beat intervals, i.e., increased heart rate variability (HRV). Higher HRV is associated with greater physiological flexibility, adaptability, and self-regulation [3] and superior health and lifestyle indicators [4]. Conversely, lower HRV is common in older adults [5] and is associated with smoking [6], physical inactivity [7], and diabetes [8]. Low HRV is also associated with increased hypertension, cardiovascular disease, and mortality risk [9,10,11,12,13,14]. Thus, practical cost-effective strategies to increase vagal-mediated HRV may help to reduce disease risk and increase lifespan [15,16,17].
HRV biofeedback (HRVB) is a clinical intervention used to increase vagally mediated HRV. During HRVB, the individual performs slow-paced breathing at a resonance frequency of ~4.5 to 7 breaths∙min−1 [18,19,20,21]. During the breath cycle, HR normally increases during inhalation and decreases during exhalation, i.e., respiratory sinus arrhythmia [21,22]. When breathing at a resonance frequency during HRVB, peak-to-trough differences in HR are maximized, which increases HRV [19,23,24,25]. Purposely altering breathing rate and depth to maintain resonance frequency during HRVB can be leveraged to improve PNS activity (HRV) and various other indicators of health [26]. For example, HRVB has been used to improve cognition while reducing perceived total stress [20], reduce symptoms of trait anxiety [27], lower blood pressure with concomitant reductions in inflammatory markers [28], and improve mood [29]. HRVB is a clinical technique, but widely available low-cost smartphone applications (apps) offering slow-paced breathing guidance and HRVB [30] could be used outside of the clinic for improving general health and well-being [31]. However, investigation into the validity of low-cost HRVB apps is necessary before they can be recommended for personal use.
Elite HRV is a cost-free smartphone app that offers daily HRV assessment [4,32] and, more recently, HRVB during slow-paced breathing. The app provides proprietary RR filtering and automatic HRV assessment after each reading, along with the option to export raw RR interval data for assessment in separate software. Multiple studies [33,34,35,36,37,38] have investigated the validity of Elite HRV, but few [35,36,38] have compared Elite HRV-derived HRV values to a gold standard (i.e., electrocardiography (ECG)), and have instead opted to compare HRV metrics generated from exported RR interval data. Several [33,34,35,36,37,38], but not all [39], studies investigating the accuracy of Elite HRV reported acceptable agreement, supporting the use of Elite HRV for measuring resting seated and supine HRV among healthy adults. However, of these investigations, none assessed the agreement between Elite HRV and a criterion during slow-paced breathing. Due to this gap in the literature, it is currently unknown whether Elite HRV can accurately measure the substantial increases in HRV expected to occur during slow-paced breathing. Therefore, we aimed to (1) assess the validity of Elite HRV for quantifying HRV parameters during spontaneous and slow-paced breathing and (2) verify the efficacy of Elite HRV-guided slow-paced breathing for increasing HRV. We hypothesized that (1) Elite HRV would provide acceptable agreement with ECG-derived HRV values during SPONT and PACED breathing and (2) Elite HRV-guided slow-paced breathing would increase HRV parameters.
2. Materials and Methods
2.1. Participants
We recruited a convenience sample of 22 healthy adults (13 M/9 F) from a college campus. The inclusion criterion was being aged between 18 and 39 years old. Exclusion criteria were the use of tobacco products; acute illness (flu, COVID-19, etc.); and/or reporting a known cardiovascular, metabolic, or neurological condition. Each participant provided written and informed consent before completing the study. All procedures were conducted in accordance with the Declaration of Helsinki and approved by the Institutional Review Board (Protocol #: H22076).
2.2. Study Design
This study used a single-visit counterbalanced cross-over design in which participants came to the laboratory between 0700 and 1000 after an overnight fast and having abstained from alcohol and structured exercise of any intensity for 24 h, caffeine for 12 h, and fluids for at least 1 h before their visit [40]. Agreement between Elite HRV and ECG-derived HRV was assessed via concurrent recordings in a supine position during 10 min of spontaneous (SPONT) and app-guided slow-paced (PACED) breathing. Ten min of supine stabilization preceded each condition, and 3 min of standing between conditions functioned as a washout period [41]. Agreement was assessed between ECG-derived HRV values and Elite HRV-derived values provided automatically by the app.
2.3. RR Interval Collection
After establishing written and informed consent, height and weight were measured and recorded. Participants were then directed to a dimly lit, temperature-controlled (21 °C) examination room for the experimental procedures. RR intervals were simultaneously recorded via ECG and Elite HRV using a Polar H10 (Polar Electro Oy, Kempele, Finland) during PACED and SPONT. The H10 was placed at the level of the xiphoid process and the strap was wetted for conductivity. The ECG electrodes were placed in a modified lead II configuration with data transmitted from the integration belt (Biopac BIONOMADIX, BIOPAC Systems Inc., Coletta, CA, USA) to the data acquisition system (Biopac MP 160, BIOPAC Systems Inc., Coletta, CA, USA). The sampling rate was set to 1000 Hz. AcqKnowledge software 5.0 (BIOPAC Systems Inc., Coletta, CA, USA) was used to integrate the ECG and respiratory belt data. For ECG analysis, raw AcqKnowledge files were exported into Kubios HRV Premium software (Version 4.2.1, University of Kuopio, Kuopio, Finland) [42]. ECG waveforms were manually inspected for abnormalities by two researchers (J.D.V., A.A.F.). Ectopic beats were de-selected as normal beats via the Kubios software creating an outlier inter-beat interval, which was subsequently removed with the lowest-threshold Kubios filter. The correction of only the identified abnormalities, and no other beats, was confirmed by visual inspection of the tachogram and by noting the number of corrected beats displayed via Kubios Premium software version 4.2.1. No RR interval detrending was applied to be consistent with Elite HRV methodology. The Polar H10 (1000 Hz) was connected via Bluetooth to Elite HRV (Version 5.5.1, Asheville, NC, USA) on an iPad (5th generation, Apple Inc., Cupertino, CA, USA). HRV results from Elite HRV displayed on the app were recorded for analysis. When Elite HRV recordings were started and stopped, a marker was placed on the ECG file in AcqKnowledge to match recording segments. Although Elite HRV performs automatic RR interval filtering, the algorithm is proprietary.
All HRV parameters were derived following standardized guidelines [1]. For time-domain HRV metrics, we compared the mean RR, the root mean square of successive differences (RMSSD), and the standard deviation of normal-to-normal RR intervals (SDNN) between Elite HRV and ECG during SPONT and PACED. For the frequency domain, we made the same comparisons for low-frequency (LF, 0.04–0.15 Hz) and high-frequency spectral power (HF, 0.15–0.4 Hz) [3]. Frequency-domain metrics were determined using the fast Fourier transformation based on Welch’s Periodogram method [43] to be consistent with Elite HRV. RMSSD and HF were considered markers of the PNS, LF a marker of baroreflex activity, and SDNN a marker of global variability [44].
2.4. Respiration Belt
A strain gauge respiration belt (BIOPAC SS5LB; BIOPAC Systems Inc., Coletta, CA, USA) was placed at the mid-point between the navel and xiphoid process. Respiration rate was transmitted from the data integration belt to the acquisition system for analysis in the AcqKnowledge software 5.0 to confirm compliance with app-guided slow-paced breathing and to quantify respiration rate differences between SPONT and PACED.
2.5. Breathing Conditions
PACED was guided by Elite HRV using the “Custom Breathing” program which involves continuous RR interval acquisition and subsequent automatic HRV calculation. The inhale and exhale duration were both set to 5 s (6 breaths·min−1) [41,45]. SPONT was assessed using the “Open HRV reading” program which also involves continuous RR interval acquisition and subsequent automatic HRV calculation. The iPad was positioned at a self-selected distance from the participant using a flexible gooseneck tablet holder (enGMOLPHY, Owosso, MI, USA) during both conditions. Before beginning PACED, participants were familiarized with the cues for inhaling and exhaling.
2.6. Statistical Analysis
Readings from the Elite HRV app are automatically rated as “good”, “okay”, or “poor” based on the quantity of artifacts corrected. If readings were rated as “poor”, the readings were excluded from the analysis. Prior to comparing the Elite HRV app to ECG, the normality of paired difference values was assessed via Shapiro–Wilks tests. Systematic bias testing was completed via paired t-tests or Wilcoxon Signed Rank tests [46]. The mean bias and 95% upper and lower (mean bias ± 1.96 × standard deviation of difference scores) limits of agreement (LOAs) were determined for comparisons that met the assumption of normally distributed difference scores. When this assumption was violated, the median bias and 95% range (2.5th, 97.5th percentiles) were used for LOA [47]. Heteroscedasticity was explored via visual inspection of Bland–Altman figures [48] and the degree of heteroscedasticity was assessed by calculating Kendall’s tau (τ) correlation between the absolute differences and corresponding means; heteroscedasticity was considered to be present when τ was >0.20 [49]. Relative agreement between ECG and Elite HRV was assessed via Lin’s concordance correlation coefficient (LCC) [50]. Agreement was further assessed using ordinary least products (OLP) regression [51]. In this analysis, the slope and intercept along with the 95% confidence interval (CI) for each were used to determine if there were proportional or fixed biases present. If the 95% CI for the slope and intercept did not contain 1 and 0, respectively, proportional and fixed biases were considered to be present [51].
To compare HRV parameters between conditions, the normality of paired difference values was assessed via Shapiro–Wilks tests. Paired t-tests or Wilcoxon Signed Rank tests were used to compare breathing rates and HRV parameters between conditions. LCC [50] was used to quantify the relative agreement between difference scores (i.e., SPONT vs. PACED). Relative agreement for all LCCs was qualitatively interpreted as <0.10 = trivial, <0.3 = small, <0.5 = moderate, <0.7 = large, <0.9 = very large, and >0.9 = near perfect [52]. The statistical significance threshold was set at α < 0.05. Statistical analysis was completed using JMP (Version 16; JMP, Cary, NC, USA), SPSS (Version 27, IBM Corp., Armon, NY, USA), and Excel (Version 16, Microsoft Corp., Redmond, WA, USA).
3. Results
Twenty-two people volunteered to participate in this study, but two were excluded. One participant was excluded because the signal quality was rated as “poor” by Elite HRV during PACED. The other participant was excluded because ECG signal quality was excessively noisy, making it difficult to classify beats as normal or abnormal. Thus, twenty participants (13 M/7 F; 23 ± 3.7 years; 23 ± 2.0 kg/m2) were included in the final analysis. The target breathing rate during PACED was achieved (6.1 ± 0.4 breaths∙min−1) and was significantly slower (p < 0.001) than SPONT (10.7 ± 1.3 breaths∙min−1).
Of the 40 total ECG recordings (20 participants x 2 conditions), 36 required no correction of ectopic beats or R-peak identification (Table 1).

Table 1.
Beat correction by participant.
3.1. Mean RR
Summary and agreement statistics for the between-device (ECG vs. Elite HRV) comparison of the mean RR are reported in Table 2 and Bland–Altman plots are displayed in Figure 1a,d. The mean RR differences between ECG and Elite HRV during SPONT were non-significant (p > 0.05), with near-perfect relative agreement and no evidence of fixed or proportional biases based on OLP results. However, there was evidence of heteroscedasticity based on τ. For PACED, a significant difference in mean RR was observed between ECG and Elite HRV (p < 0.05). However, there was near-perfect relative agreement and no evidence of fixed or proportional biases based on OLP results.
Table 2.
Device comparison summary and agreement statistics: time domain.
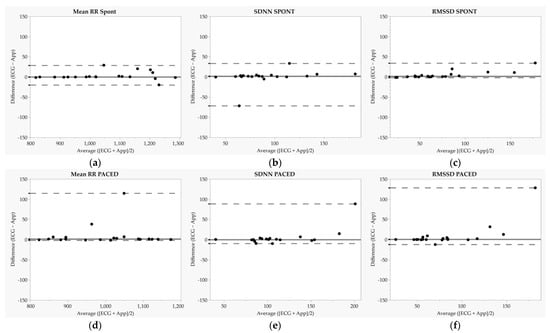
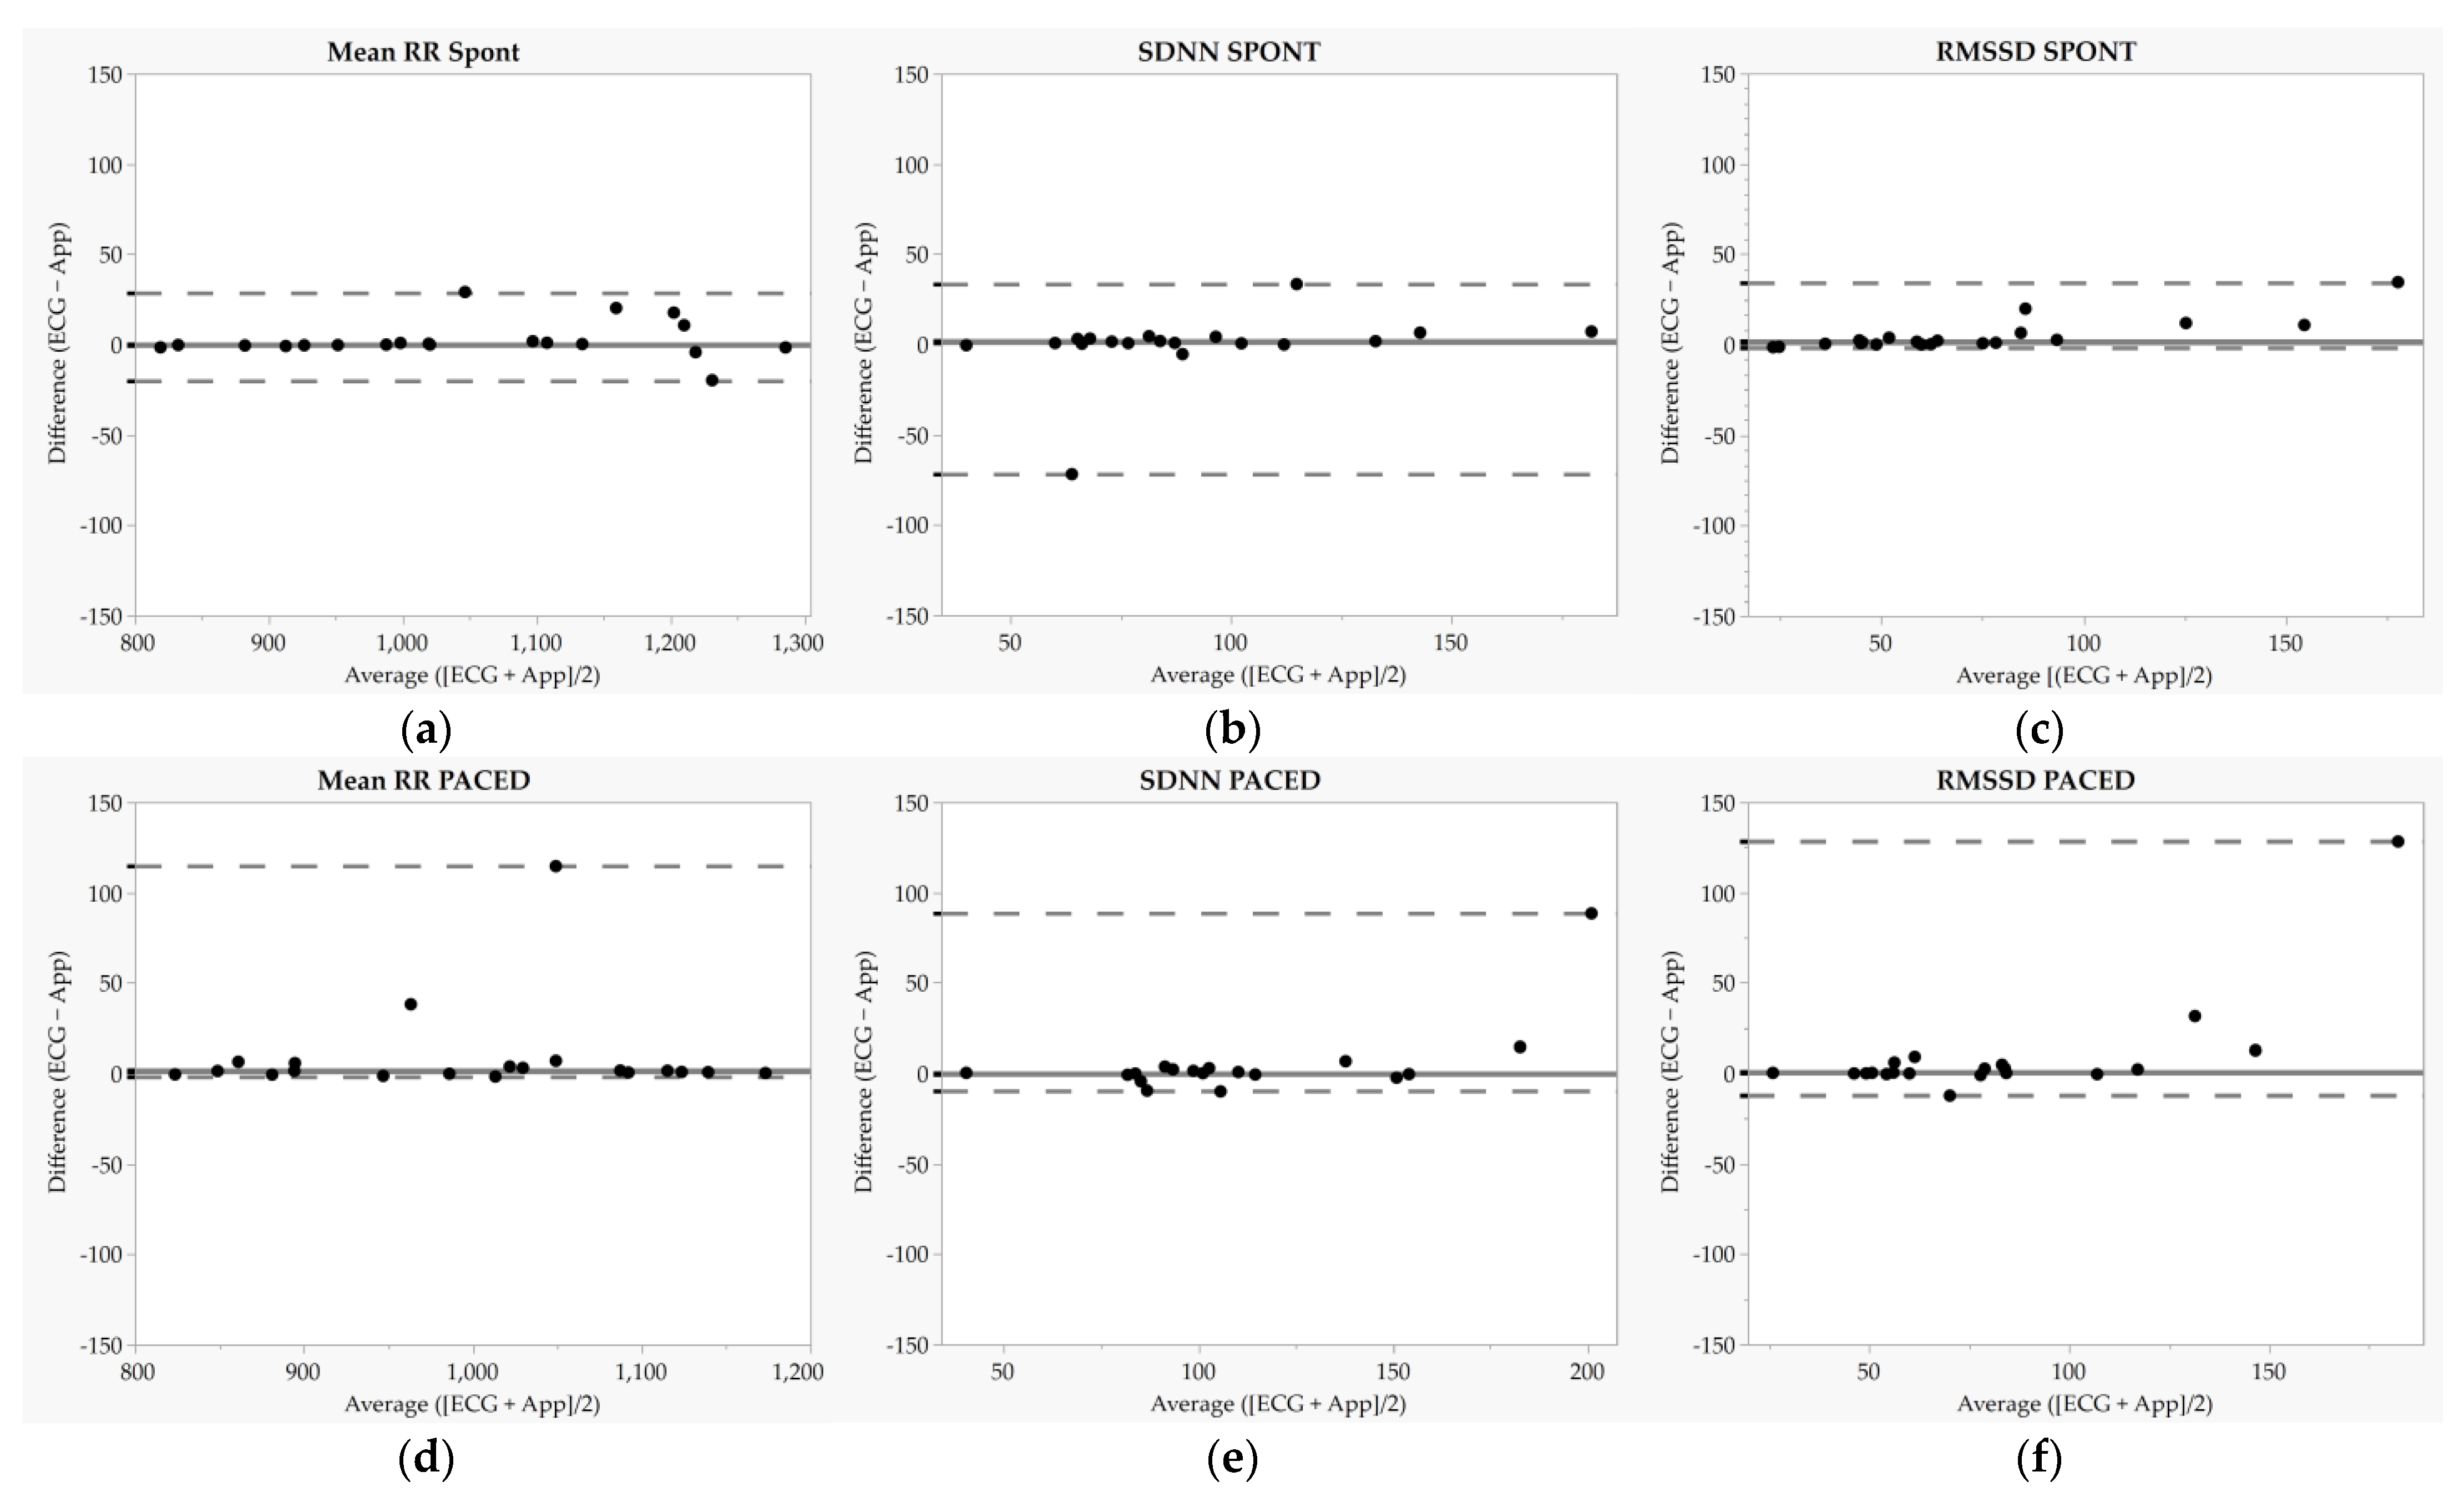
Figure 1.
Bland–Altman plots for mean RR, standard deviation of normal-to-normal intervals (SDNN), and root mean square of successive differences (RMSSD). Each dot represents one participant. (a–c) represent Bland-Altman plots during the spontaneous breathing condition while (d–f) represent Bland-Altman plots during the paced breathing (6 breaths·min−1) condition. SPONT = spontaneous breathing; PACED = paced breathing (6 breaths·min−1); solid lines represent median biases, and dashed lines represent 2.5th and 97.5th percentiles.
Summary statistics for the between-condition comparison (PACED vs. SPONT) of the mean RR are reported in Table 3. For both ECG and Elite HRV, the mean RR was significantly shorter during PACED compared to SPONT (ps < 0.05). Mean RR difference values for ECG and Elite HRV between conditions demonstrated near-perfect relative agreement (p < 0.05).
Table 3.
Condition comparison summary and agreement statistics.
3.2. SDNN
Summary and agreement statistics for the between-device comparison of SDNN are reported in Table 2, and Bland–Altman plots are displayed in Figure 1b,e. SDNN differences between ECG and Elite HRV were significant during SPONT (p > 0.05) but not PACED (p > 0.05), and relative agreement was near perfect for each condition. Moreover, there was evidence of heteroscedasticity for SPONT and PACED SDNN based on τ, but there was no evidence of fixed or proportional biases based on OLP results.
Summary statistics for the between-condition comparison (PACED vs. SPONT) of SDNN are reported in Table 3. There was a significant increase in SDNN (p < 0.05) when measured by ECG, but not Elite HRV (p = 0.05). Between-condition SDNN difference values demonstrated very large relative agreement (p < 0.05).
3.3. RMSSD
Summary and agreement statistics for the between-device comparison of RMSSD are reported in Table 2, and Bland–Altman plots are displayed in Figure 1c,f. There were significant differences in RMSSD between ECG and Elite HRV during SPONT (p < 0.05), although relative agreement was near perfect. There was evidence of heteroscedasticity based on τ, and OLP results showed that Elite HRV tended to underestimate RMSSD. During PACED, there was also a significant difference (p > 0.05) observed between ECG and Elite HRV for RMSSD, with very large relative agreement. There was evidence of heteroscedasticity based on τ but no evidence of fixed or proportional biases based on OLP results.
Summary statistics for the between-condition comparison (PACED vs. SPONT) of RMSSD are reported in Table 3. When measured by ECG and Elite HRV, RMSSD was not different during PACED compared to SPONT (p > 0.05). The between-condition RMSSD difference values for ECG and Elite HRV demonstrated large relative agreement (p < 0.05).
3.4. LF
Summary and agreement statistics for the between-device comparison of LF are reported in Table 4, and Bland–Altman plots are displayed in Figure 2a,c. The LF differences between ECG and Elite HRV during SPONT and PACED were non-significant (p > 0.05), with very large to near perfect relative agreement. There was evidence of heteroscedasticity for SPONT and PACED LF based on τ, but no evidence of fixed or proportional biases based on OLP results. Notably for LF, LOAs were excessively wide due to large inter-individual variation in difference values.
Table 4.
Device comparison summary and agreement statistics: frequency domain.
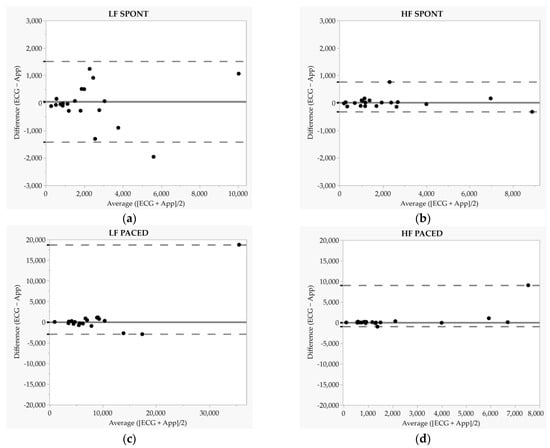
Figure 2.
Bland–Altman plots for low-frequency (LF) and high-frequency (HF) power. Each dot represents one participant. (a,b) represent Bland-Altman plots during the spontaneous breathing condition while (c,d) represent Bland-Altman plots during the paced breathing (6 breaths·min−1) condition. SPONT = spontaneous breathing; PACED = paced breathing (6 breaths·min−1). Solid lines represent median biases, and dashed lines represent 2.5th and 97.5th percentiles. In panel a (LF SPONT), the dashed line represents mean bias and dashed lines represent 95% limits of agreement.
Summary statistics for the between-condition comparison (PACED vs. SPONT) of LF are reported in Table 3. When measured by ECG and Elite HRV, LF was significantly greater during PACED (p < 0.05). Between-condition LF difference values demonstrated very large relative agreement (p < 0.05).
3.5. HF
Summary and agreement statistics for the between-device comparison of HF are reported in Table 4, and Bland–Altman plots are displayed in Figure 2b,d. The HF differences between ECG and Elite HRV during SPONT and PACED were non-significant (p < 0.05) with relative agreement rated as near perfect for SPONT and moderate for PACED. There was evidence of heteroscedasticity based on τ during SPONT and PACED, but no evidence of fixed or proportional biases based on OLP results. Notably for HF, LOAs were excessively wide due to large inter-individual variation in difference values.
Summary statistics for the between-condition comparison (PACED vs. SPONT) of HF are reported in Table 3. When measured by ECG and Elite HRV, HF was not different during PACED compared to SPONT (p > 0.05). The between-condition HF difference values demonstrated moderate relative agreement (p < 0.05).
4. Discussion
The purpose of this investigation was to (1) assess the validity of Elite HRV for quantifying HRV parameters during spontaneous (SPONT) and slow-paced (PACED) breathing and (2) verify the efficacy of Elite HRV-guided slow-paced breathing as a method to increase HRV. The main findings for our first aim were that Elite HRV demonstrated much stronger agreement with ECG for time-domain relative to frequency-domain parameters, as well as a tendency for stronger agreement during SPONT versus PACED. Regarding our second aim, Elite HRV-guided breathing effectively increased LF, as measured by ECG and Elite HRV, and individual changes in LF demonstrated very large relative agreement between measurement tools.
4.1. Comparison of ECG- and Elite HRV-Derived HRV
We observed excellent agreement between the ECG- and Elite HRV-derived mean RR during SPONT with median bias and LOA values comparable with parametric comparisons in previous investigations [35]. Some heteroscedasticity was noted such that difference scores tended to scatter with increasing mean RR (i.e., lower heart rate). Poorer agreement for mean RR during PACED, reflected in a significant median bias, was largely driven by two outlier data points, as 18/20 participants demonstrated individual difference values of ≤7 ms. RMSSD measured by Elite HRV was significantly different than ECG-derived values during SPONT and PACED, which agrees with work by Guzik et al. [39] (mean 4 ms underestimation of ECG-derived RMSSD; significant correlation coefficient of 0.67), but we did observe ≥very large relative agreement. Some heteroscedasticity was noted such that difference scores tended to scatter upwards with increasing RMSSD, which was more notable during PACED. Prior studies that reported excellent agreement for Elite HRV-derived RMSSD used the natural logarithm of RMSSD [35,36], which limits skewness, or they exported RR intervals for analysis (i.e., did not use Elite HRV-derived values) [34], which may help explain our discrepant findings. Despite near-perfect relative agreement for SDNN, we observed a significant difference between ECG and Elite HRV during SPONT, and heteroscedasticity was more strongly noted during PACED. However, similar to results for RMSSD, a limited number of outliers were driving sub-optimal agreement for SDNN, as demonstrated in the Bland–Altman plots. To our knowledge, only one previous study examined Elite HRV-derived SDNN and reported a significant mean bias (mean 5.2 ms underestimation of ECG-derived SDNN; significant correlation coefficient of 0.73) [39]. Interestingly, in all but one case in the current study (SDNN during SPONT), upper LOAs were substantially greater than the lower LOAs. This reflects the non-normality of difference scores and may indicate some level of consistency in Elite HRV erring towards the underestimation of ECG-derived parameters, most often when values were higher. Although parametric procedures were performed previously, visual inspections of Bland–Altman plots from Gurzik et al. suggest that similar non-normality in difference values were observed for RMSSD and SDNN [39].
Frequency-domain parameters (HF and LF) demonstrated excessively wide LOAs, especially during PACED, and heteroscedasticity was observed for each comparison. Relative agreement was ≥large for each comparison. We are aware of only one previous investigation that explored agreement for frequency-domain parameters [31], but LF and HF were computed after RR data were exported into Kubios (i.e., did not use Elite HRV-derived values). Despite using the same RR processing and HRV computation method, wide LOAs for LF and HF were reported, particularly when assessed in the standing position [34]. Mean bias values were also non-trivial (≥111.2 ms2) despite being non-significant (p > 0.05) [34]. In line with our findings of greater LOAs during PACED, Menghini et al. [53] compared PPG- and ECG-derived LF and HF and found that LOAs were wider during paced versus spontaneous breathing.
Potential sources of error between ECG- and Elite HRV-derived HRV using a Polar H10 have been previously described [54]. Discrepant values could be related to differences in ECG electrode placement versus Polar H10 chest strap location [55]. Differences in signal processing algorithms could also affect HRV results [56]. Additionally, HRV smartphone applications often use a threshold-based RR interval correction algorithm that corrects inter-beat intervals that exceed pre-determined values [57]. Thus, Elite HRV’s proprietary filtering method may be correcting long RR intervals of sinus node origin, which could help explain its tendency to underestimate ECG-derived results, particularly at higher HRV values, and during PACED. Finally, inter-individual differences in physical characteristics (e.g., cardiac dimensions, body composition), or underlying cardiac pathologies could also impact QRS complexes and the timing of inter-beat interval detection between measurement tools [54].
4.2. Comparison of SPONT and PACED HRV
The ECG- and Elite HRV-derived values for mean RR, SDNN, RMSSD, and HF provided comparable absolute differences between SPONT and PACED (Table 3). Additionally, there was ≥large relative agreement between difference scores for mean RR, SDNN, and RMSSD, but HF showed only moderate relative agreement. Our findings for mean RR, SDNN, RMSSD, and HF are in line with some, but not all, previous research on HRV responses to slow-paced breathing. For example, when comparing breathing at 6 breaths·min−1 with and without biofeedback, RMSSD and SDNN increased, HF increased at the group level with a wide range of error, and the mean RR increased [41]. We observed similar changes in SDNN (ECG-derived only), but RMSSD did not significantly change, and we noted a decrease in mean RR. Melo et al. [58] found that participants had higher RMSSD and SDNN during slow-paced breathing (6 breaths·min−1), which only matches our results for SDNN. A possible explanation for the reduction in mean RR and limited increases in RMSSD and HF in the current study could be that participants were more relaxed during SPONT versus PACED. Lack of familiarity with slow-paced breathing possibly kept them vigilant in adhering to the breathing cadence, resulting in stronger inhalations which contribute to HR accelerations and collectively may have limited the magnitude of decelerations.
LF was significantly increased irrespective of the HRV measurement tool, and difference scores demonstrated very large relative agreement. The observed increase in LF matches many previous investigations [41,58,59] and is pertinent to assessing the accuracy of Elite HRV during slow-paced breathing or HRVB. This is because LF is the primary HRV parameter of interest during breathing practices [25,60,61]. LF reliably increases during slow breathing in various populations [26] and is a key metric used to determine one’s resonance breathing frequency [25]. The increase in LF for both devices supports the utility of Elite HRV’s guided breathing feature for acutely increasing LF HRV.
4.3. Limitations
This study was not without limitations. The ECG recordings were marked at the moment that Elite HRV recordings started, but there was a possibility of very minor error in synchronizing the RR interval collection (e.g., <1 s). Participants completed this study in a quiet and temperature-controlled room, but the environment may not represent a comfortable at-home setting in which app-guided breathing would regularly be performed. Moreover, although participants were familiarized with the breathing cadence for PACED, they may not have been adequately familiarized with appropriate relaxation during slow-paced breathing which could have affected HRV responses to PACED versus SPONT. Sample size could also be considered another limitation. This study also had a few notable strengths. The testing procedures were in the morning after an overnight fast which created standardized conditions, and male and female participants were included in the study. Also, slow-paced breathing had not been previously used to validate Elite HRV or similar apps.
5. Conclusions
The current investigation revealed novel information pertaining to the validity and efficacy of the Elite HRV smartphone application. Elite HRV’s slow-paced breathing feature produced expected increases in LF HRV, supporting its efficacy as a cost-free option for transiently altering cardiac autonomic modulation. However, its agreement with reference ECG results varied between time- and frequency-domain parameters and between paced and spontaneous breathing conditions. Strong agreement was generally observed for time-domain HRV parameters with the exception of a small number of outliers that were observed most commonly at higher values. Thus, practitioners should be aware that Elite HRV may underestimate time-domain values in individuals with higher HRV. Contrastingly, although frequency-domain values tended to show acceptable relative agreement, individual bias values were generally large and heterogeneous, contributing to excessively wide agreement limits. Thus, caution should be used when examining Elite HRV-derived spectral HRV. Ongoing investigation is encouraged to keep up with application updates which can include modifications to RR filtering and HRV computation procedures and thus improve upon its agreement with reference ECG.
Author Contributions
Conceptualization, J.D.V., G.J.G. and A.A.F.; data curation, J.D.V., B.L.R. and A.A.F.; formal analysis, J.D.V., B.L.R. and A.A.F.; investigation, J.D.V. and A.A.F.; methodology, J.D.V., G.J.G. and A.A.F.; project administration, J.D.V.; resources, B.L.R., G.J.G. and A.A.F.; supervision, B.L.R., G.J.G. and A.A.F.; validation, J.D.V., B.L.R., G.J.G. and A.A.F.; visualization, J.D.V.; writing—original draft, J.D.V. and A.A.F.; writing—review and editing, J.D.V., B.L.R., G.J.G. and A.A.F. All authors have read and agreed to the published version of the manuscript.
Funding
This research received no external funding.
Institutional Review Board Statement
The study was conducted in accordance with the Declaration of Helsinki and approved by the Institutional Review Board of Georgia Southern University (Protocol #: H22076; date of approval: 17 September 2021).
Informed Consent Statement
Informed consent was obtained from all subjects involved in the study.
Data Availability Statement
Data are available upon request from the corresponding author.
Conflicts of Interest
The authors declare no conflict of interest.
References
- Malik, M.; Bigger, J.T.; Camm, A.J.; Kleiger, R.E.; Malliani, A.; Moss, A.J.; Schwartz, P.J. Heart rate variability: Standards of measurement, physiological interpretation, and clinical use. Eur. Heart J. 1996, 17, 354–381. [Google Scholar] [CrossRef]
- Waxenbaum, J.A.; Reddy, V.; Varacallo, M. Anatomy, Autonomic Nervous System. In StatPearls; StatPearls Publishing LLC: Treasure Island, FL, USA, 2022. [Google Scholar]
- Shaffer, F.; McCraty, R.; Zerr, C.L. A healthy heart is not a metronome: An integrative review of the heart’s anatomy and heart rate variability. Front. Psychol. 2014, 5, 1040. [Google Scholar] [CrossRef]
- Grosicki, G.J.; Culver, M.N.; McMillan, N.K.; Cross, B.L.; Montoye, A.H.K.; Riemann, B.L.; Flatt, A.A. Self-recorded heart rate variability profiles are associated with health and lifestyle markers in young adults. Clin. Auton. Res. 2022, 32, 507–518. [Google Scholar] [CrossRef] [PubMed]
- Natarajan, A.; Pantelopoulos, A.; Emir-Farinas, H.; Natarajan, P. Heart rate variability with photoplethysmography in 8 million individuals: A cross-sectional study. Lancet Digit. Health 2020, 2, e650–e657. [Google Scholar] [CrossRef]
- Hayano, J.; Yamada, M.; Sakakibara, Y.; Fujinami, T.; Yokoyama, K.; Watanabe, Y.; Takata, K. Short- and long-term effects of cigarette smoking on heart rate variability. Am. J. Cardiol. 1990, 65, 84–88. [Google Scholar] [CrossRef] [PubMed]
- Rennie, K.L.; Hemingway, H.; Kumari, M.; Brunner, E.; Malik, M.; Marmot, M. Effects of moderate and vigorous physical activity on heart rate variability in a British study of civil servants. Am. J. Epidemiol. 2003, 158, 135–143. [Google Scholar] [CrossRef] [PubMed]
- Singh, J.P.; Larson, M.G.; O’Donnell, C.J.; Wilson, P.F.; Tsuji, H.; Lloyd-Jones, D.M.; Levy, D. Association of hyperglycemia with reduced heart rate variability (The Framingham Heart Study). Am. J. Cardiol. 2000, 86, 309–312. [Google Scholar] [CrossRef] [PubMed]
- Gerritsen, J.; Dekker, J.M.; TenVoorde, B.J.; Kostense, P.J.; Heine, R.J.; Bouter, L.M.; Heethaar, R.M.; Stehouwer, C.D.A. Impaired Autonomic Function Is Associated With Increased Mortality, Especially in Subjects With Diabetes, Hypertension, or a History of Cardiovascular Disease: The Hoorn Study. Diabetes Care 2001, 24, 1793–1798. [Google Scholar] [CrossRef] [PubMed]
- Kleiger, R.E.; Miller, J.P.; Bigger, J.T.; Moss, A.J. Decreased heart rate variability and its association with increased mortality after acute myocardial infarction. Am. J. Cardiol. 1987, 59, 256–262. [Google Scholar] [CrossRef]
- Liao, D.; Cai, J.; Barnes, R.W.; Tyroler, H.A.; Rautaharju, P.; Holme, I.; Heiss, G. Association of cardiac automatic function and the development of hypertension: The ARIC study. Am. J. Hypertens. 1996, 9, 1147–1156. [Google Scholar] [CrossRef]
- Schroeder, E.B.; Liao, D.; Chambless, L.E.; Prineas, R.J.; Evans, G.W.; Heiss, G. Hypertension, blood pressure, and heart rate variability: The Atherosclerosis Risk in Communities (ARIC) study. Hypertension 2003, 42, 1106–1111. [Google Scholar] [CrossRef]
- Singh, J.P.; Larson, M.G.; Tsuji, H.; Evans, J.C.; O’Donnell, C.J.; Levy, D. Reduced heart rate variability and new-onset hypertension: Insights into pathogenesis of hypertension: The Framingham Heart Study. Hypertension 1998, 32, 293–297. [Google Scholar] [CrossRef]
- Tsuji, H.; Venditti, F.J., Jr.; Manders, E.S.; Evans, J.C.; Larson, M.G.; Feldman, C.L.; Levy, D. Reduced heart rate variability and mortality risk in an elderly cohort. The Framingham Heart Study. Circulation 1994, 90, 878–883. [Google Scholar] [CrossRef]
- Hernández-Vicente, A.; Hernando, D.; Santos-Lozano, A.; Rodríguez-Romo, G.; Vicente-Rodríguez, G.; Pueyo, E.; Bailón, R.; Garatachea, N. Heart Rate Variability and Exceptional Longevity. Front. Physiol. 2020, 11, 566399. [Google Scholar] [CrossRef]
- Zulfiqar, U.; Jurivich, D.A.; Gao, W.; Singer, D.H. Relation of high heart rate variability to healthy longevity. Am. J. Cardiol. 2010, 105, 1181–1185. [Google Scholar] [CrossRef]
- Kay, M.W.; Jain, V.; Panjrath, G.; Mendelowitz, D. Targeting Parasympathetic Activity to Improve Autonomic Tone and Clinical Outcomes. Physiology 2022, 37, 39–45. [Google Scholar] [CrossRef]
- Frank, D.L.; Khorshid, L.; Kiffer, J.F.; Moravec, C.S.; McKee, M.G. Biofeedback in medicine: Who, when, why and how? Ment. Health Fam. Med. 2010, 7, 85–91. [Google Scholar] [PubMed]
- Lehrer, P. How does heart rate variability biofeedback work? Resonance, the baroreflex, and other mechanisms. Biofeedback 2013, 41, 26–31. [Google Scholar] [CrossRef]
- Chaitanya, S.; Datta, A.; Bhandari, B.; Sharma, V.K. Effect of Resonance Breathing on Heart Rate Variability and Cognitive Functions in Young Adults: A Randomised Controlled Study. Cureus 2022, 14, e22187. [Google Scholar] [CrossRef] [PubMed]
- Larsen, P.D.; Tzeng, Y.C.; Sin, P.Y.W.; Galletly, D.C. Respiratory sinus arrhythmia in conscious humans during spontaneous respiration. Respir. Physiol. Neurobiol. 2010, 174, 111–118. [Google Scholar] [CrossRef]
- Hirsch, J.A.; Bishop, B. Respiratory sinus arrhythmia in humans: How breathing pattern modulates heart rate. Am. J. Physiol. 1981, 241, H620–H629. [Google Scholar] [CrossRef]
- Dick, T.E.; Hsieh, Y.H.; Dhingra, R.R.; Baekey, D.M.; Galán, R.F.; Wehrwein, E.; Morris, K.F. Cardiorespiratory coupling: Common rhythms in cardiac, sympathetic, and respiratory activities. Prog. Brain Res. 2014, 209, 191–205. [Google Scholar] [CrossRef] [PubMed]
- McCraty, R.; Atkinson, M.; Tomasino, D.; Bradley, R.T. The coherent heart heart-brain interactions, psychophysiological coherence, and the emergence of system-wide order. Integral Rev. A Transdiscipl. Transcult. J. New Thought Res. Prax. 2009, 5, 24. [Google Scholar]
- Shaffer, F.; Meehan, Z.M. A Practical Guide to Resonance Frequency Assessment for Heart Rate Variability Biofeedback. Front. Neurosci. 2020, 14, 570400. [Google Scholar] [CrossRef] [PubMed]
- Laborde, S.; Allen, M.S.; Borges, U.; Dosseville, F.; Hosang, T.J.; Iskra, M.; Mosley, E.; Salvotti, C.; Spolverato, L.; Zammit, N.; et al. Effects of voluntary slow breathing on heart rate and heart rate variability: A systematic review and a meta-analysis. Neurosci. Biobehav. Rev. 2022, 138, 104711. [Google Scholar] [CrossRef] [PubMed]
- Lee, J.; Kim, J.K.; Wachholtz, A. The benefit of heart rate variability biofeedback and relaxation training in reducing trait anxiety. Hanguk Simni Hakhoe Chi Kongang 2015, 20, 391–408. [Google Scholar] [CrossRef]
- Wang, C.H.; Yang, H.W.; Huang, H.L.; Hsiao, C.Y.; Jiu, B.K.; Lin, C.; Lo, M.T. Long-Term Effect of Device-Guided Slow Breathing on Blood Pressure Regulation and Chronic Inflammation in Patients with Essential Hypertension Using a Wearable ECG Device. Acta Cardiol. Sin. 2021, 37, 195–203. [Google Scholar] [CrossRef]
- Steffen, P.R.; Austin, T.; DeBarros, A.; Brown, T. The Impact of Resonance Frequency Breathing on Measures of Heart Rate Variability, Blood Pressure, and Mood. Front. Public Health 2017, 5, 222. [Google Scholar] [CrossRef]
- Goessl, V.C.; Curtiss, J.E.; Hofmann, S.G. The effect of heart rate variability biofeedback training on stress and anxiety: A meta-analysis. Psychol. Med. 2017, 47, 2578–2586. [Google Scholar] [CrossRef]
- Laborde, S.; Hosang, T.; Mosley, E.; Dosseville, F. Influence of a 30-Day Slow-Paced Breathing Intervention Compared to Social Media Use on Subjective Sleep Quality and Cardiac Vagal Activity. J. Clin. Med. 2019, 8, 193. [Google Scholar] [CrossRef]
- Flatt, A.A.; Howells, D. Effects of Long-Haul Travel and the Olympic Games on Heart-Rate Variability in Rugby Sevens Medalists. Int. J. Sports Physiol. Perform. 2022, 17, 951–960. [Google Scholar] [CrossRef] [PubMed]
- Chhetri, P.; Shrestha, L.; Mahotra, N.B. Validity of Elite-HRV Smartphone Application for Measuring Heart Rate Variability Compared to Polar V800 Heart Rate Monitor. J. Nepal. Health Res. Counc. 2021, 19, 809–813. [Google Scholar]
- Gambassi, B.B.; Neves, V.R.; Brito, E.Z.A.; da Silva Fernandes, D.S.; Sá, C.A.; da Rocha Nogueira, R.M.; de Jesus Furtado Almeida, F.; de Araújo Cavalcanti, P.A.; Gomes Gonçalves, E.S.D.C.; Neto, D.S.; et al. A validation study of a smartphone application for heart rate variability assessment in asymptomatic adults. Am. J. Cardiovasc. Dis. 2020, 10, 219–229. [Google Scholar] [PubMed]
- Himariotis, A.T.; Coffey, K.F.; Noel, S.E.; Cornell, D.J. Validity of a Smartphone Application in Calculating Measures of Heart Rate Variability. Sensors 2022, 22, 9883. [Google Scholar] [CrossRef] [PubMed]
- Moya-Ramon, M.; Mateo-March, M.; Peña-González, I.; Zabala, M.; Javaloyes, A. Validity and reliability of different smartphones applications to measure HRV during short and ultra-short measurements in elite athletes. Comput. Methods Programs Biomed. 2022, 217, 106696. [Google Scholar] [CrossRef] [PubMed]
- Perrotta, A.S.; Jeklin, A.T.; Hives, B.A.; Meanwell, L.E.; Warburton, D.E.R. Validity of the Elite HRV Smartphone Application for Examining Heart Rate Variability in a Field-Based Setting. J. Strength Cond. Res. 2017, 31, 2296–2302. [Google Scholar] [CrossRef]
- Stone, J.D.; Ulman, H.K.; Tran, K.; Thompson, A.G.; Halter, M.D.; Ramadan, J.H.; Stephenson, M.; Finomore, V.S.; Galster, S.M.; Rezai, A.R.; et al. Assessing the Accuracy of Popular Commercial Technologies That Measure Resting Heart Rate and Heart Rate Variability. Front. Sports Act. Living 2021, 3, 585870. [Google Scholar] [CrossRef]
- Guzik, P.; Piekos, C.; Pierog, O.; Fenech, N.; Krauze, T.; Piskorski, J.; Wykretowicz, A. Classic electrocardiogram-based and mobile technology derived approaches to heart rate variability are not equivalent. Int. J. Cardiol. 2018, 258, 154–156. [Google Scholar] [CrossRef]
- Christiani, M.; Grosicki, G.J.; Flatt, A.A. Cardiac-autonomic and hemodynamic responses to a hypertonic, sugar-sweetened sports beverage in physically active men. Appl. Physiol. Nutr. Metab. 2021, 46, 1189–1195. [Google Scholar] [CrossRef]
- Laborde, S.; Allen, M.S.; Borges, U.; Iskra, M.; Zammit, N.; You, M.; Hosang, T.; Mosley, E.; Dosseville, F. Psychophysiological effects of slow-paced breathing at six cycles per minute with or without heart rate variability biofeedback. Psychophysiology 2022, 59, e13952. [Google Scholar] [CrossRef]
- Lipponen, J.A.; Tarvainen, M.P. A robust algorithm for heart rate variability time series artefact correction using novel beat classification. J. Med. Eng. Technol. 2019, 43, 173–181. [Google Scholar] [CrossRef] [PubMed]
- Li, K.; Rüdiger, H.; Ziemssen, T. Spectral Analysis of Heart Rate Variability: Time Window Matters. Front. Neurol. 2019, 10, 545. [Google Scholar] [CrossRef] [PubMed]
- Shaffer, F.; Ginsberg, J.P. An Overview of Heart Rate Variability Metrics and Norms. Front. Public Health 2017, 5, 258. [Google Scholar] [CrossRef] [PubMed]
- Lehrer, P.M.; Gevirtz, R. Heart rate variability biofeedback: How and why does it work? Front. Psychol. 2014, 5, 756. [Google Scholar] [CrossRef]
- Atkinson, G.; Nevill, A.M. Statistical methods for assessing measurement error (reliability) in variables relevant to sports medicine. Sports Med. 1998, 26, 217–238. [Google Scholar] [CrossRef]
- Smith, R.; Chase, J.G.; Pretty, C.G.; Davidson, S.; Shaw, G.M.; Desaive, T. Preload & Frank-Starling curves, from textbook to bedside: Clinically applicable non-additionally invasive model-based estimation in pigs. Comput. Biol. Med. 2021, 135, 104627. [Google Scholar] [CrossRef]
- Bland, J.M.; Altman, D.G. Statistical methods for assessing agreement between two methods of clinical measurement. Lancet 1986, 1, 307–310. [Google Scholar] [CrossRef]
- Brehm, M.A.; Scholtes, V.A.; Dallmeijer, A.J.; Twisk, J.W.; Harlaar, J. The importance of addressing heteroscedasticity in the reliability analysis of ratio-scaled variables: An example based on walking energy-cost measurements. Dev. Med. Child. Neurol. 2012, 54, 267–273. [Google Scholar] [CrossRef]
- Lawrence, I.; Lin, K. A concordance correlation coefficient to evaluate reproducibility. Biometrics 1989, 45, 255–268. [Google Scholar]
- Ludbrook, J. A primer for biomedical scientists on how to execute model II linear regression analysis. Clin. Exp. Pharmacol. Physiol. 2012, 39, 329–335. [Google Scholar] [CrossRef]
- Hopkins, W.G.; Marshall, S.W.; Batterham, A.M.; Hanin, J. Progressive Statistics for Studies in Sports Medicine and Exercise Science. Med. Sci. Sports Exerc. 2009, 41, 3–12. [Google Scholar] [CrossRef]
- Menghini, L.; Gianfranchi, E.; Cellini, N.; Patron, E.; Tagliabue, M.; Sarlo, M. Stressing the accuracy: Wrist-worn wearable sensor validation over different conditions. Psychophysiology 2019, 56, e13441. [Google Scholar] [CrossRef] [PubMed]
- Schaffarczyk, M.; Rogers, B.; Reer, R.; Gronwald, T. Validity of the Polar H10 Sensor for Heart Rate Variability Analysis during Resting State and Incremental Exercise in Recreational Men and Women. Sensors 2022, 22, 6536. [Google Scholar] [CrossRef] [PubMed]
- Jeyhani, V.; Mantysalo, M.; Noponen, K.; Seppanen, T.; Vehkaoja, A. Effect of Different ECG Leads on Estimated R-R Intervals and Heart Rate Variability Parameters. Annu. Int. Conf. IEEE Eng. Med. Biol. Soc. 2019, 2019, 3786–3790. [Google Scholar] [CrossRef] [PubMed]
- Apandi, Z.F.M.; Ikeura, R.; Hayakawa, S.; Tsutsumi, S. An Analysis of the Effects of Noisy Electrocardiogram Signal on Heartbeat Detection Performance. Bioengineering 2020, 7, 53. [Google Scholar] [CrossRef]
- Flatt, A.A.; Esco, M.R.; Allen, J.R.; Robinson, J.B.; Bragg, A.; Keith, C.M.; Fedewa, M.V.; Earley, R.L. Cardiac-Autonomic Responses to In-Season Training Among Division-1 College Football Players. J. Strength Cond. Res. 2020, 34, 1649–1656. [Google Scholar] [CrossRef] [PubMed]
- Melo, H.M.; Martins, T.C.; Nascimento, L.M.; Hoeller, A.A.; Walz, R.; Takase, E. Ultra-short heart rate variability recording reliability: The effect of controlled paced breathing. Ann. Noninvasive Electrocardiol. 2018, 23, e12565. [Google Scholar] [CrossRef] [PubMed]
- Saboul, D.; Pialoux, V.; Hautier, C. The impact of breathing on HRV measurements: Implications for the longitudinal follow-up of athletes. Eur. J. Sport. Sci. 2013, 13, 534–542. [Google Scholar] [CrossRef]
- Sakakibara, M.; Kaneda, M.; Oikawa, L.O. Efficacy of Paced Breathing at the Low-frequency Peak on Heart Rate Variability and Baroreflex Sensitivity. Appl. Psychophysiol. Biofeedback 2020, 45, 31–37. [Google Scholar] [CrossRef]
- Sevoz-Couche, C.; Laborde, S. Heart rate variability and slow-paced breathing:when coherence meets resonance. Neurosci. Biobehav. Rev. 2022, 135, 104576. [Google Scholar] [CrossRef]

Disclaimer/Publisher’s Note: The statements, opinions and data contained in all publications are solely those of the individual author(s) and contributor(s) and not of MDPI and/or the editor(s). MDPI and/or the editor(s) disclaim responsibility for any injury to people or property resulting from any ideas, methods, instructions or products referred to in the content. |
© 2023 by the authors. Licensee MDPI, Basel, Switzerland. This article is an open access article distributed under the terms and conditions of the Creative Commons Attribution (CC BY) license (https://creativecommons.org/licenses/by/4.0/).