

Ultrafast Laser-Excited Optical Emission of Xe under Loose-Focusing Conditions
 , ,
, ,  and
and
Abstract
:1. Introduction
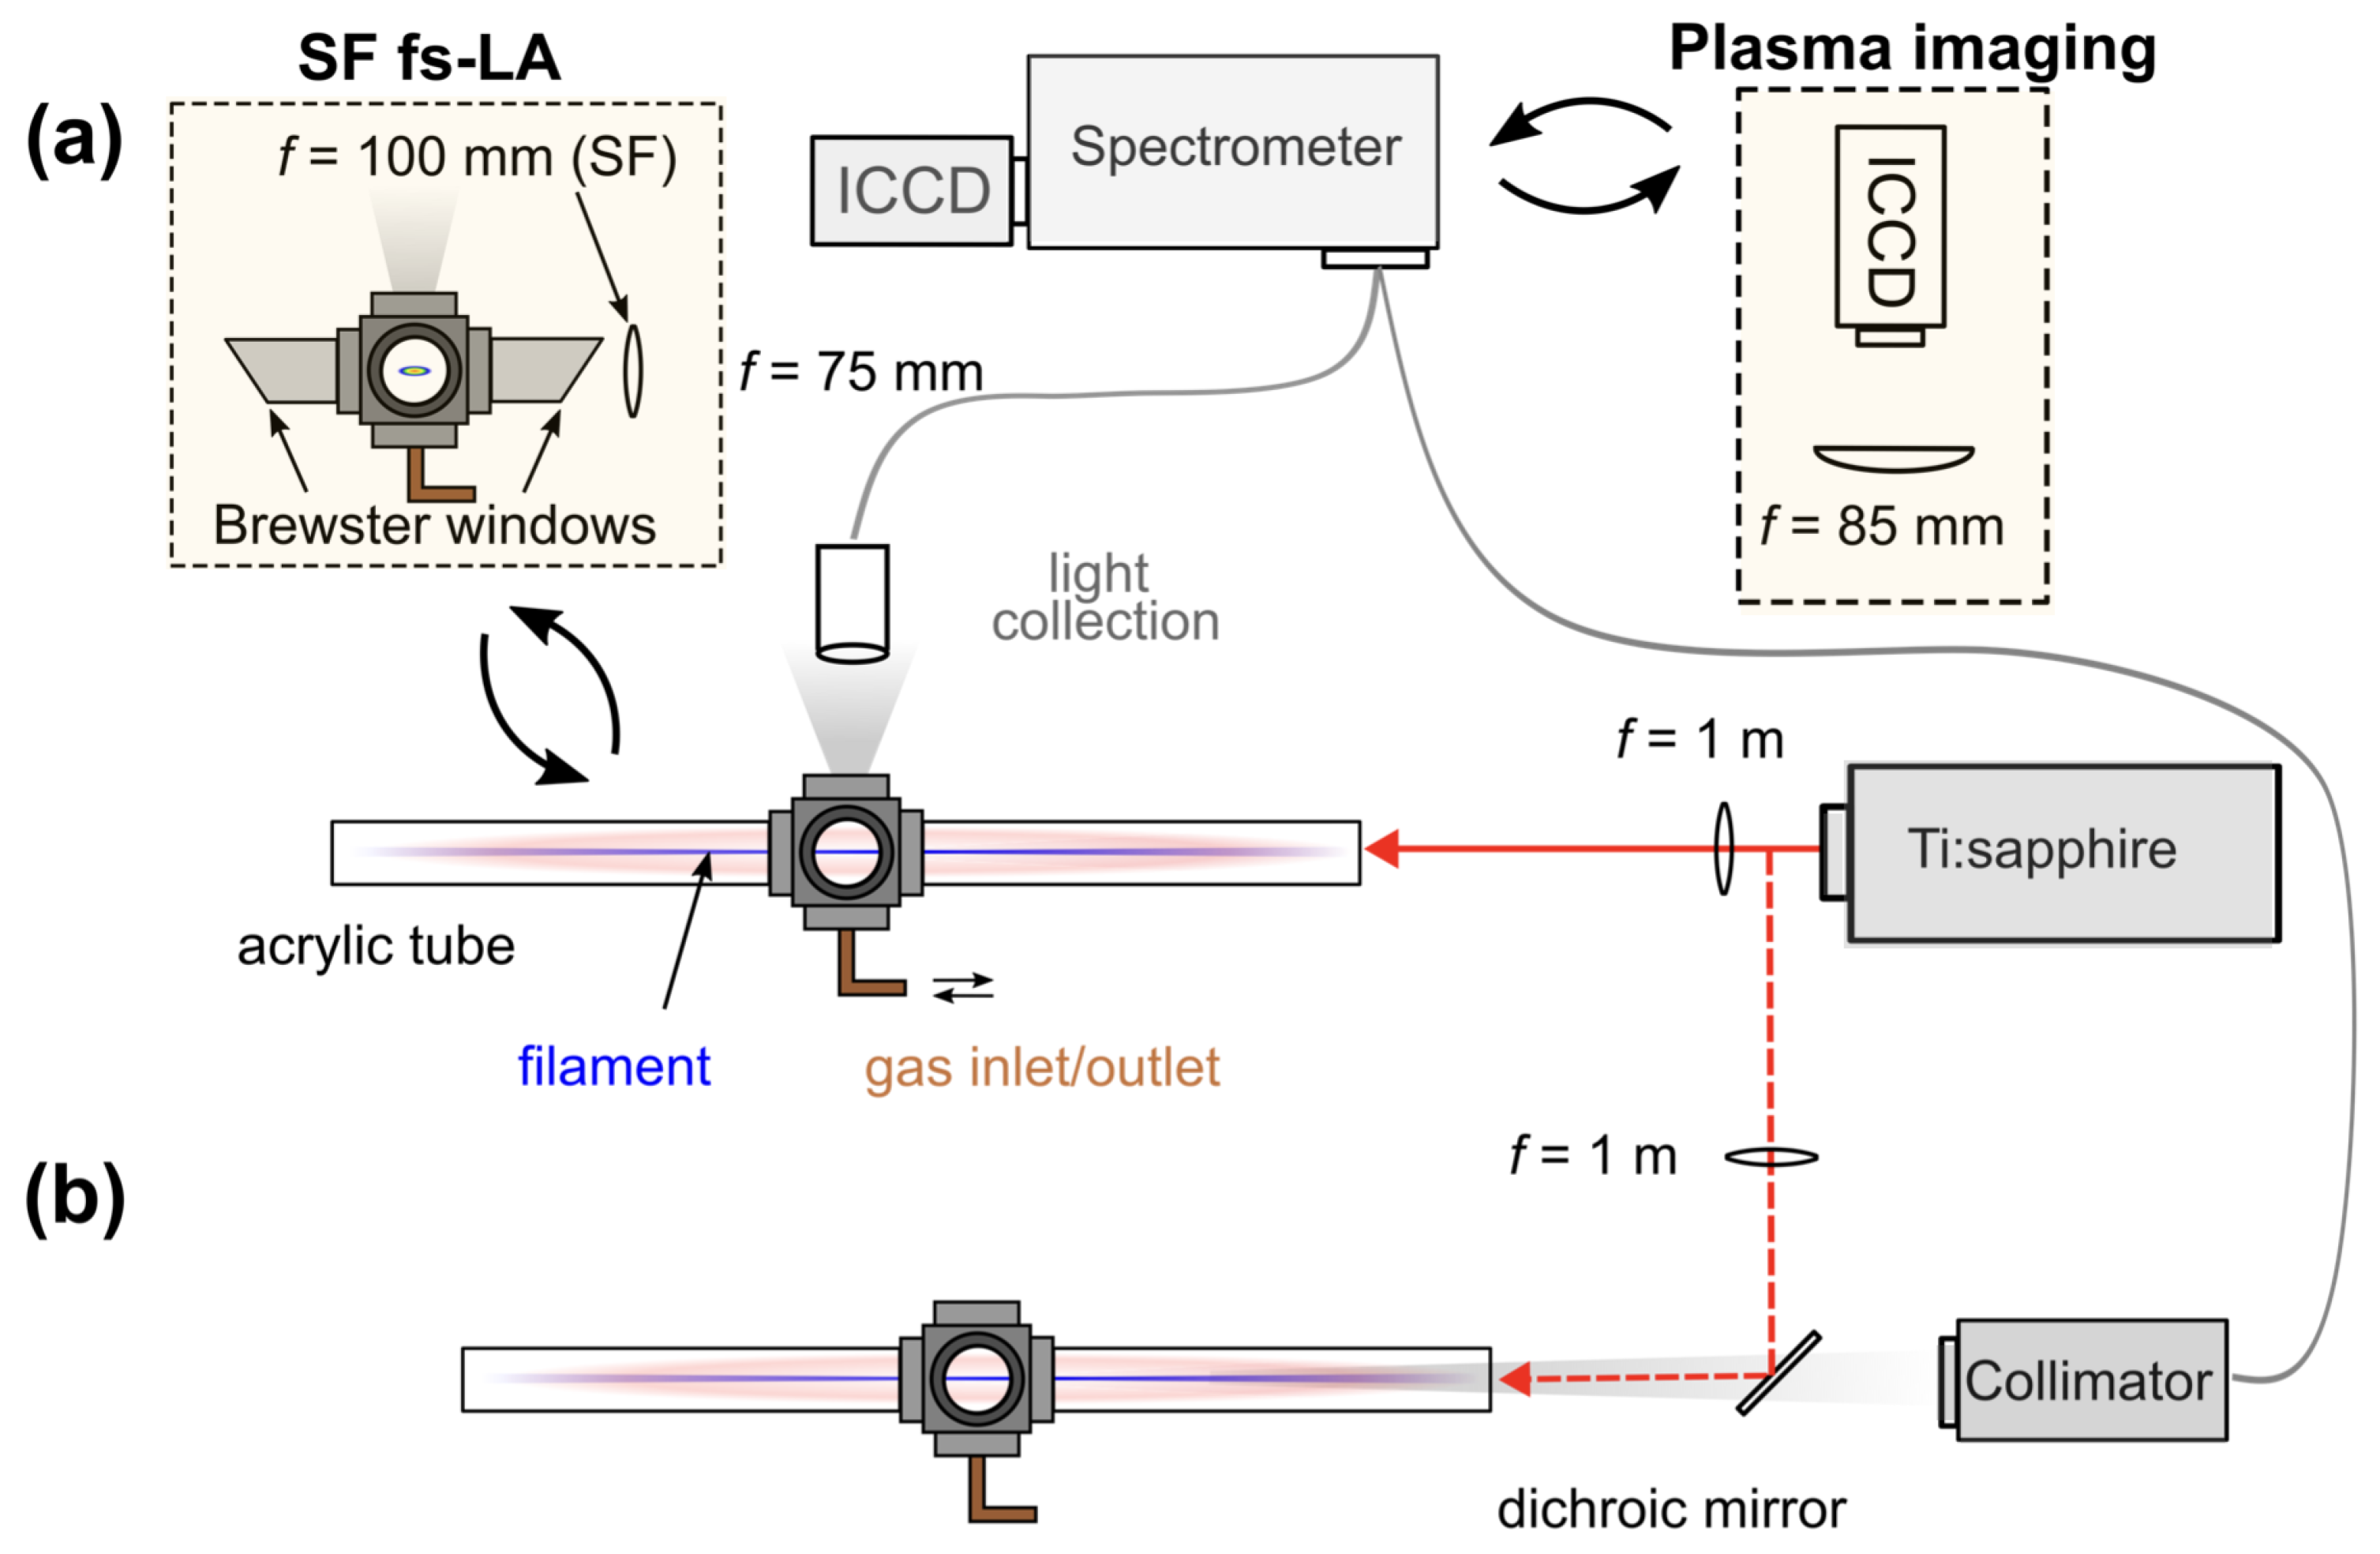
2. Experimental Methods
3. Results and Discussion
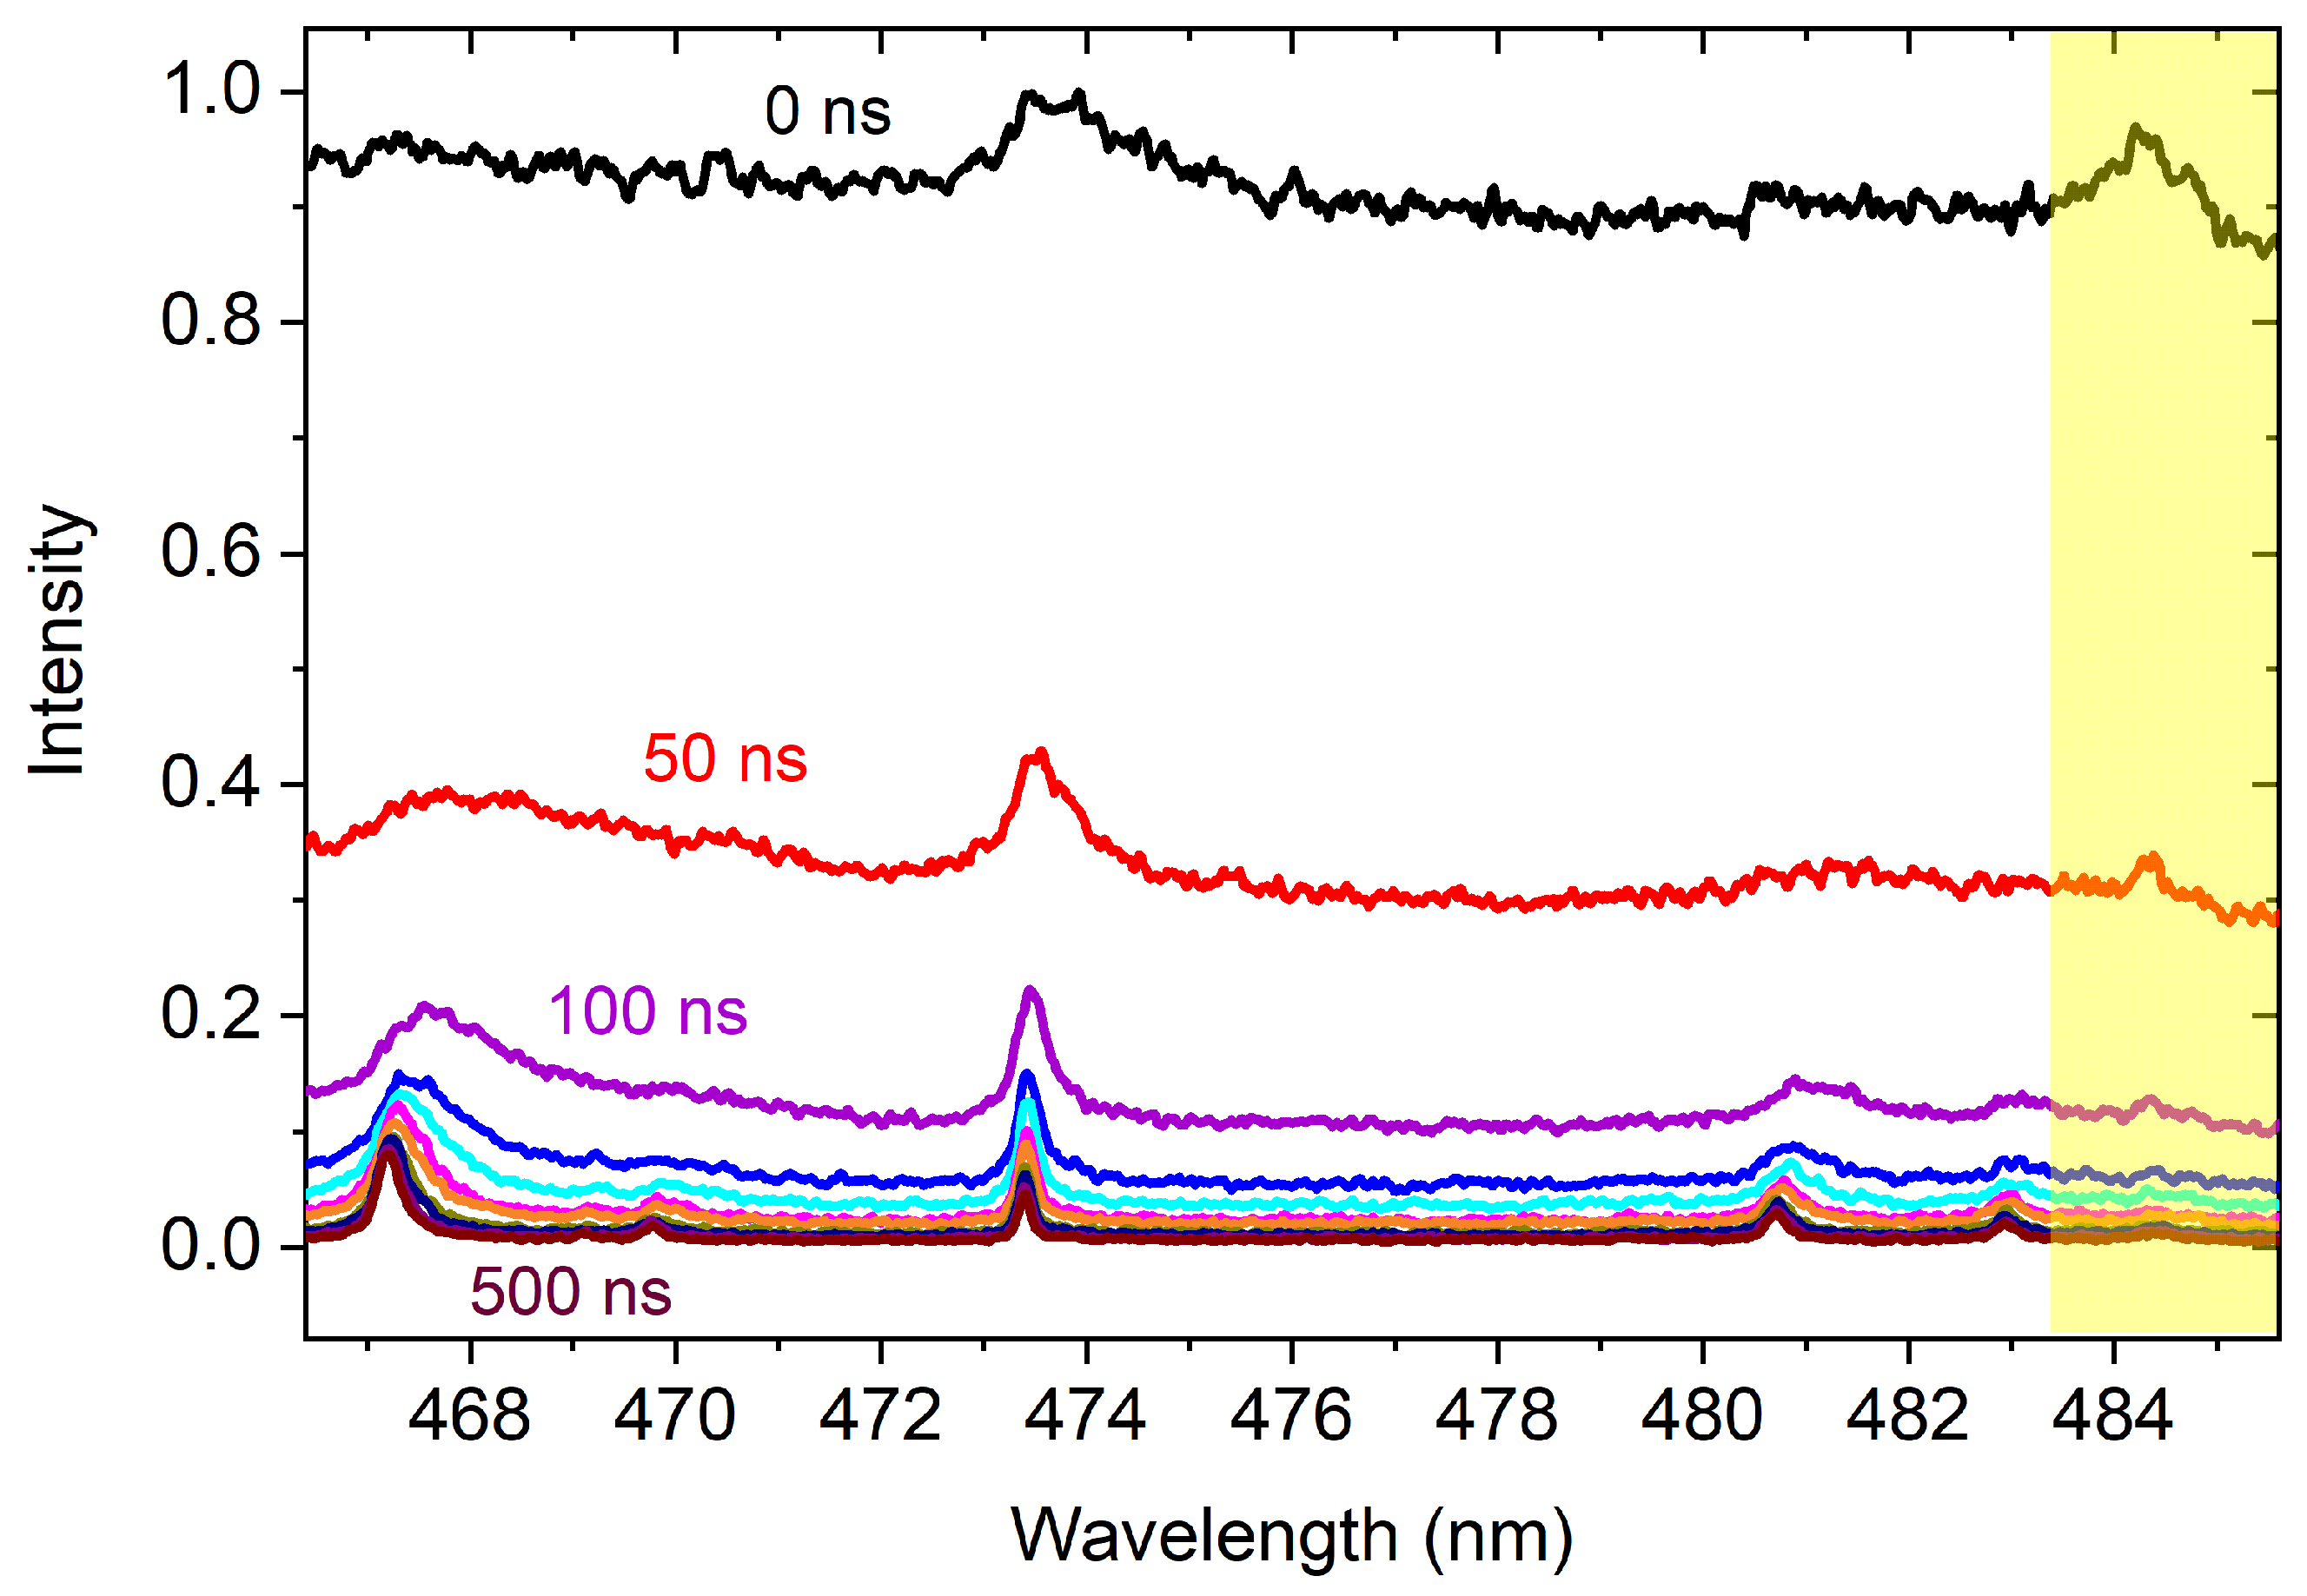
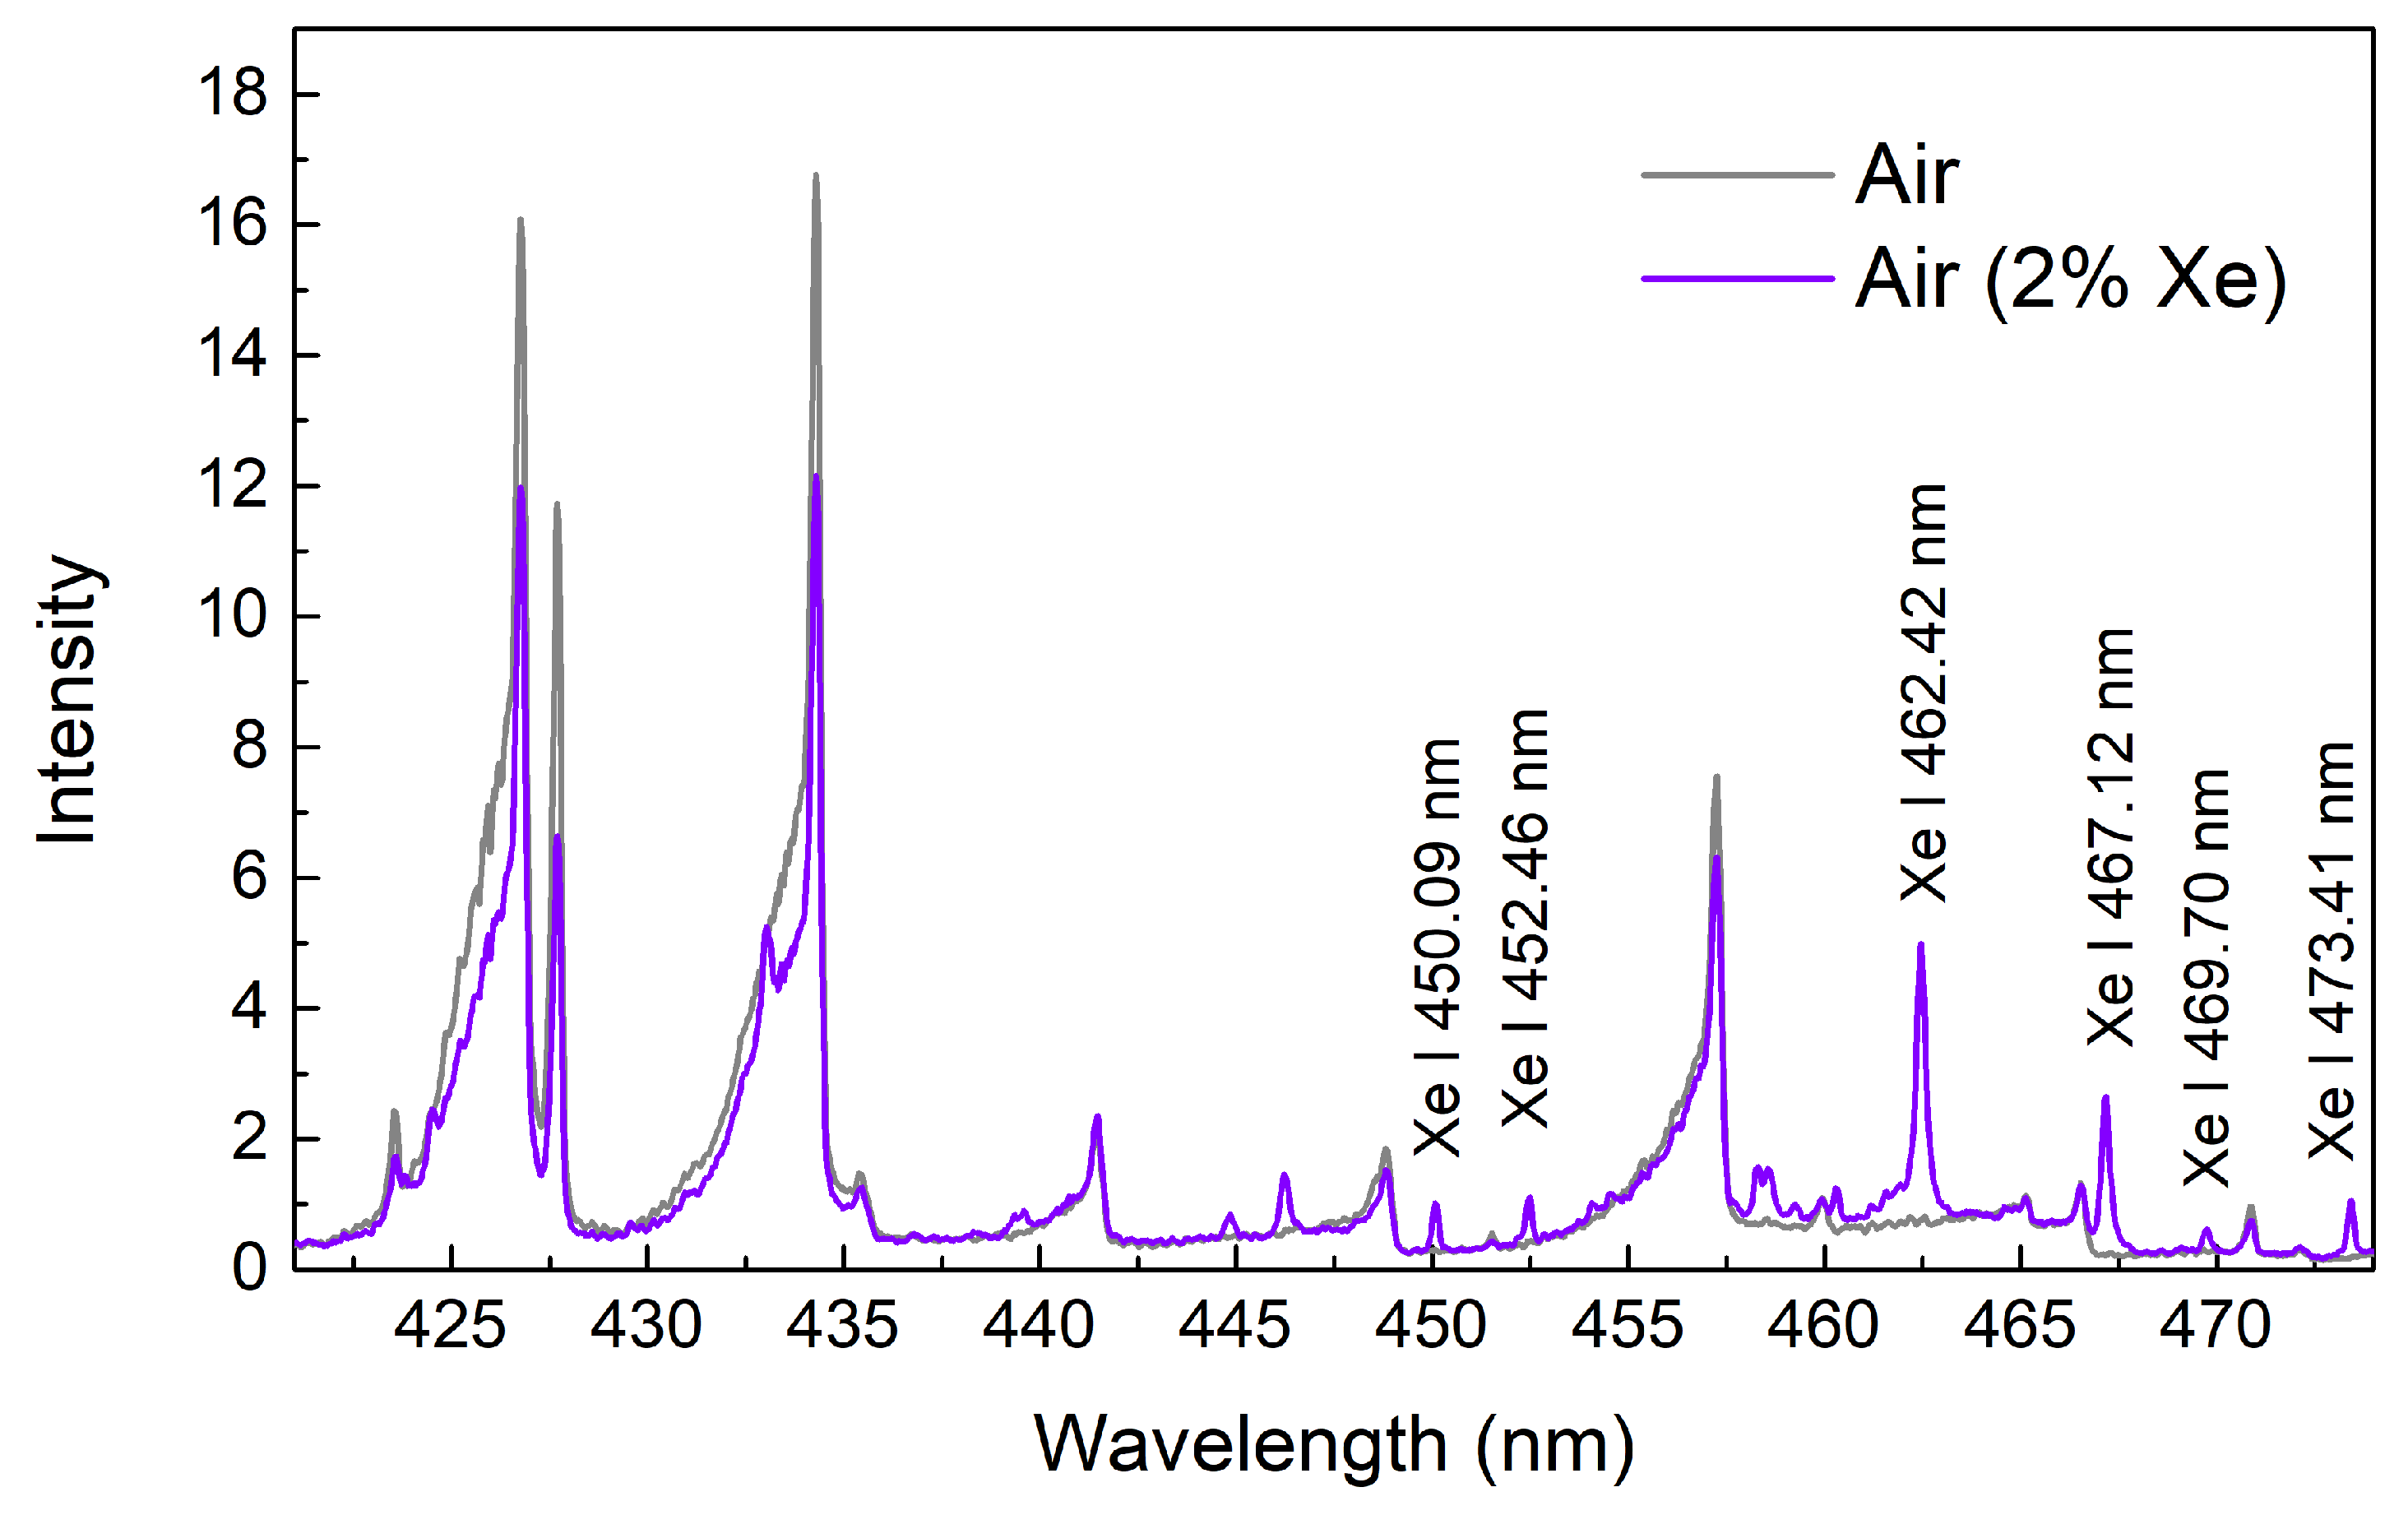
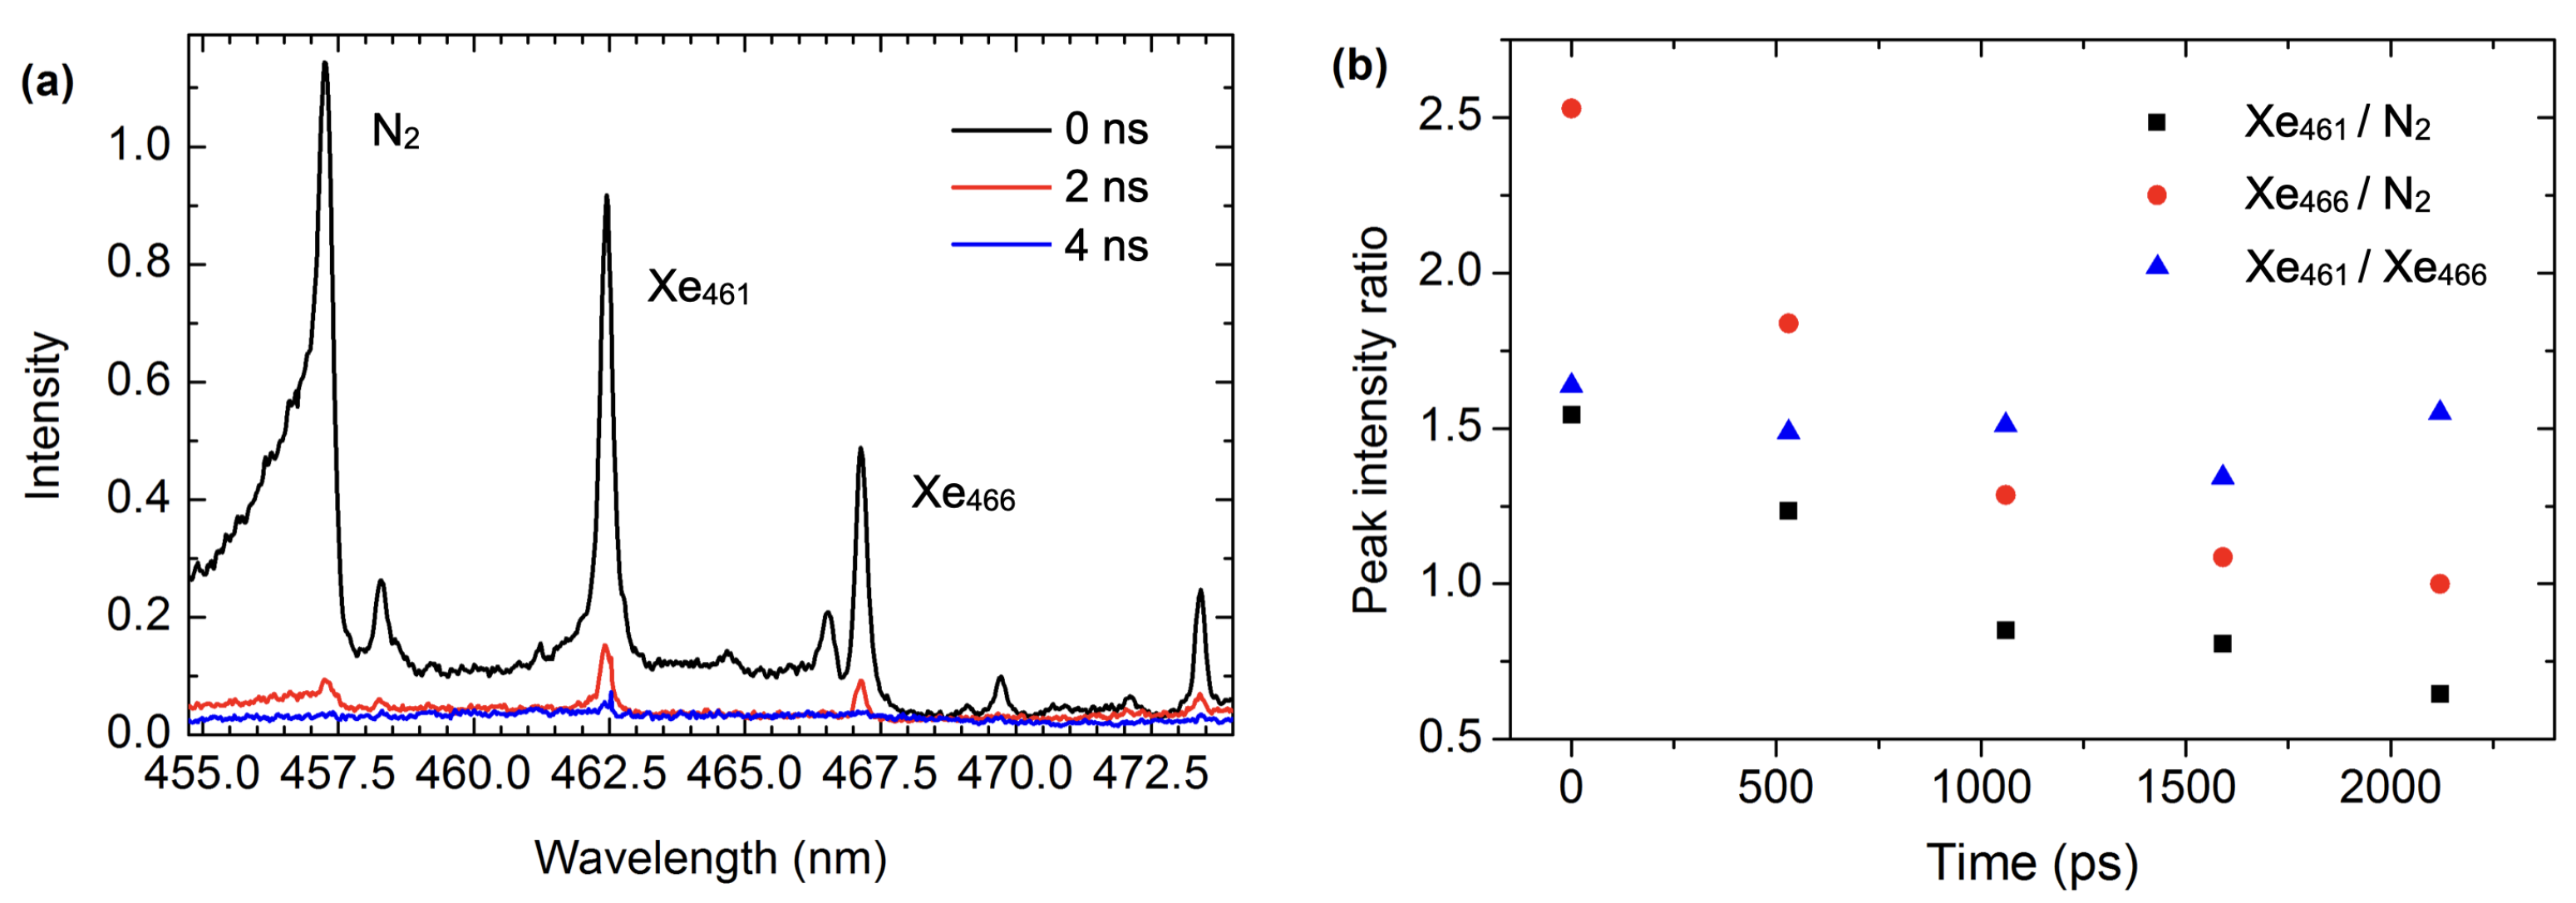
3.1. VIS Spectral Region

| Species | Wavelength | Einstein Coeff. | Lower Level | Upper Level | Lower Level | Upper Level | ||
|---|---|---|---|---|---|---|---|---|
| (nm) | () | Config. | Term | Config. | Term | Energy (eV) | Energy (eV) | |
| Xe I | 467.123 | 2.49 | 8.315 | 10.969 | ||||
| 469.097 | 0.28 | 8.315 | 10.958 | |||||
| 469.702 | 0.736 | 8.315 | 10.954 | |||||
| 473.416 | 1.38 | 8.437 | 11.055 | |||||
| 479.262 | 0.12 | 8.315 | 10.902 | |||||
| 480.702 | 4.29 | 8.437 | 11.015 | |||||
| 482.971 | 0.6 | 8.437 | 11.003 | |||||
| 484.329 | 0.702 | 8.437 | 10.996 | |||||
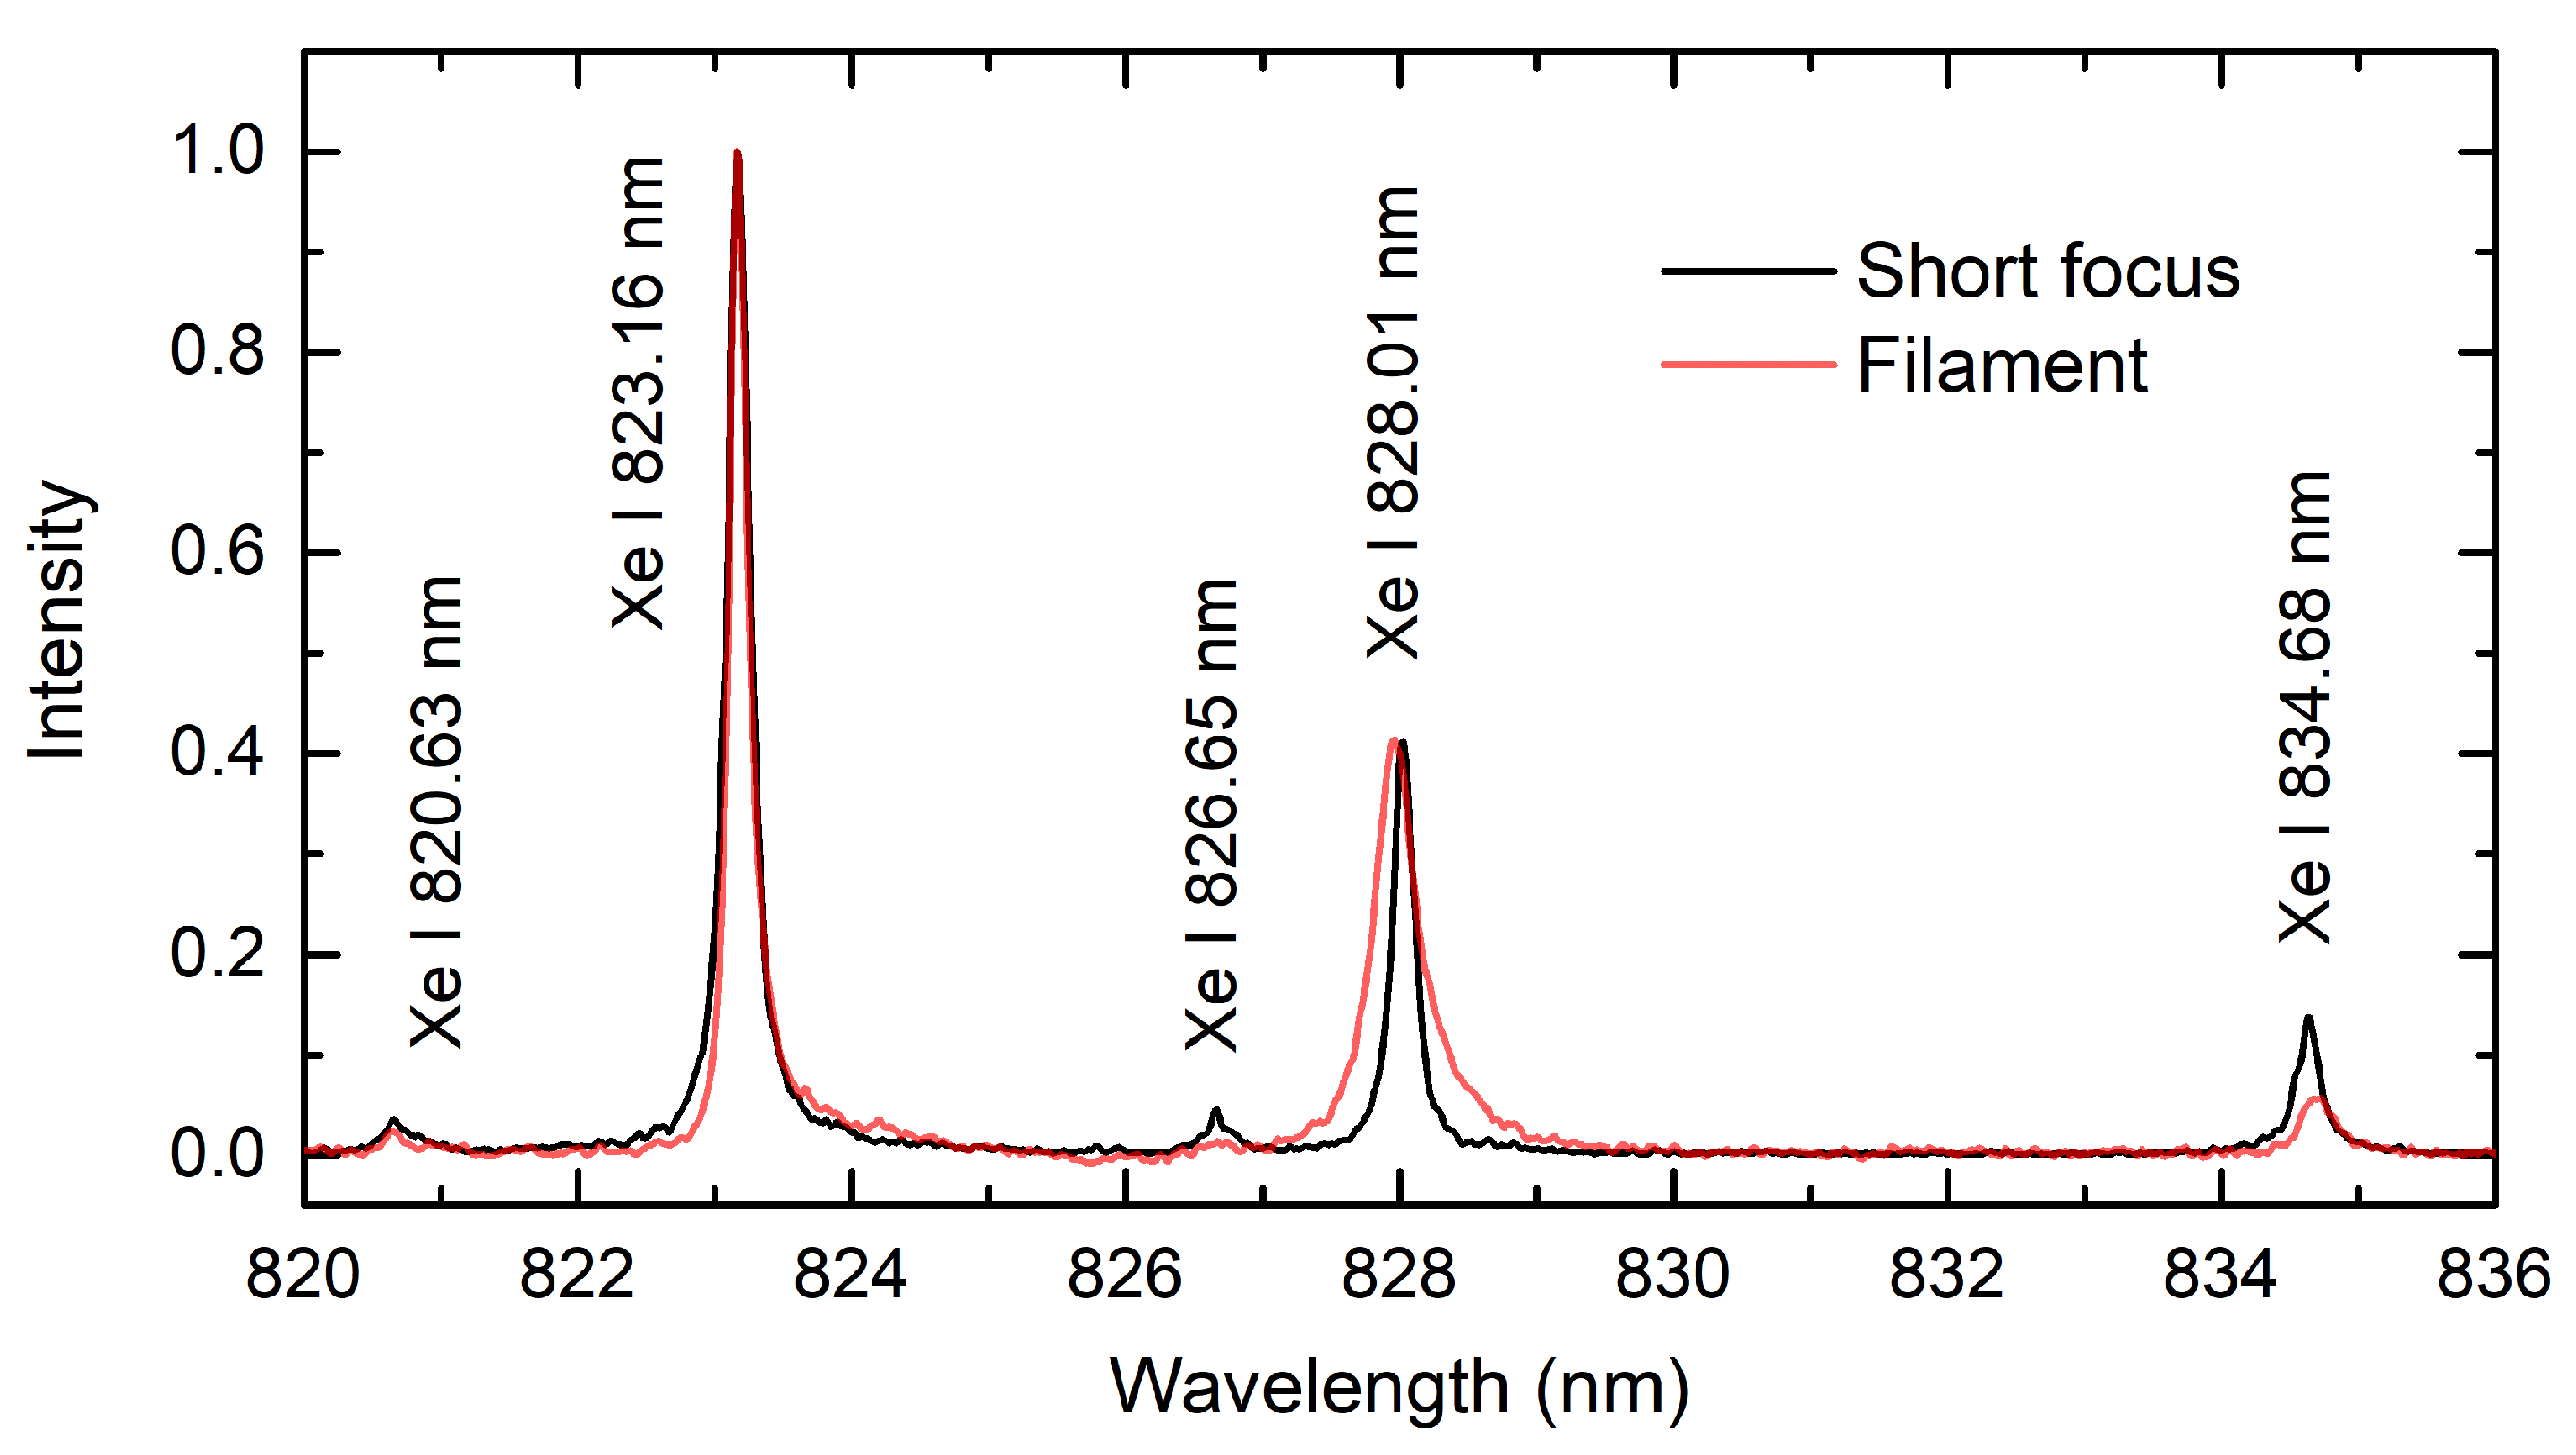
| 820.633 | 20 | 9.447 | 10.957 | |||||
| 823.163 | 28.6 | 8.315 | 9.821 | |||||
| 826.652 | 16.2 | 9.569 | 11.069 | |||||
| 828.011 | 36.9 | 8.436 | 9.933 | |||||
| 834.682 | 42 | 9.569 | 11.055 | |||||
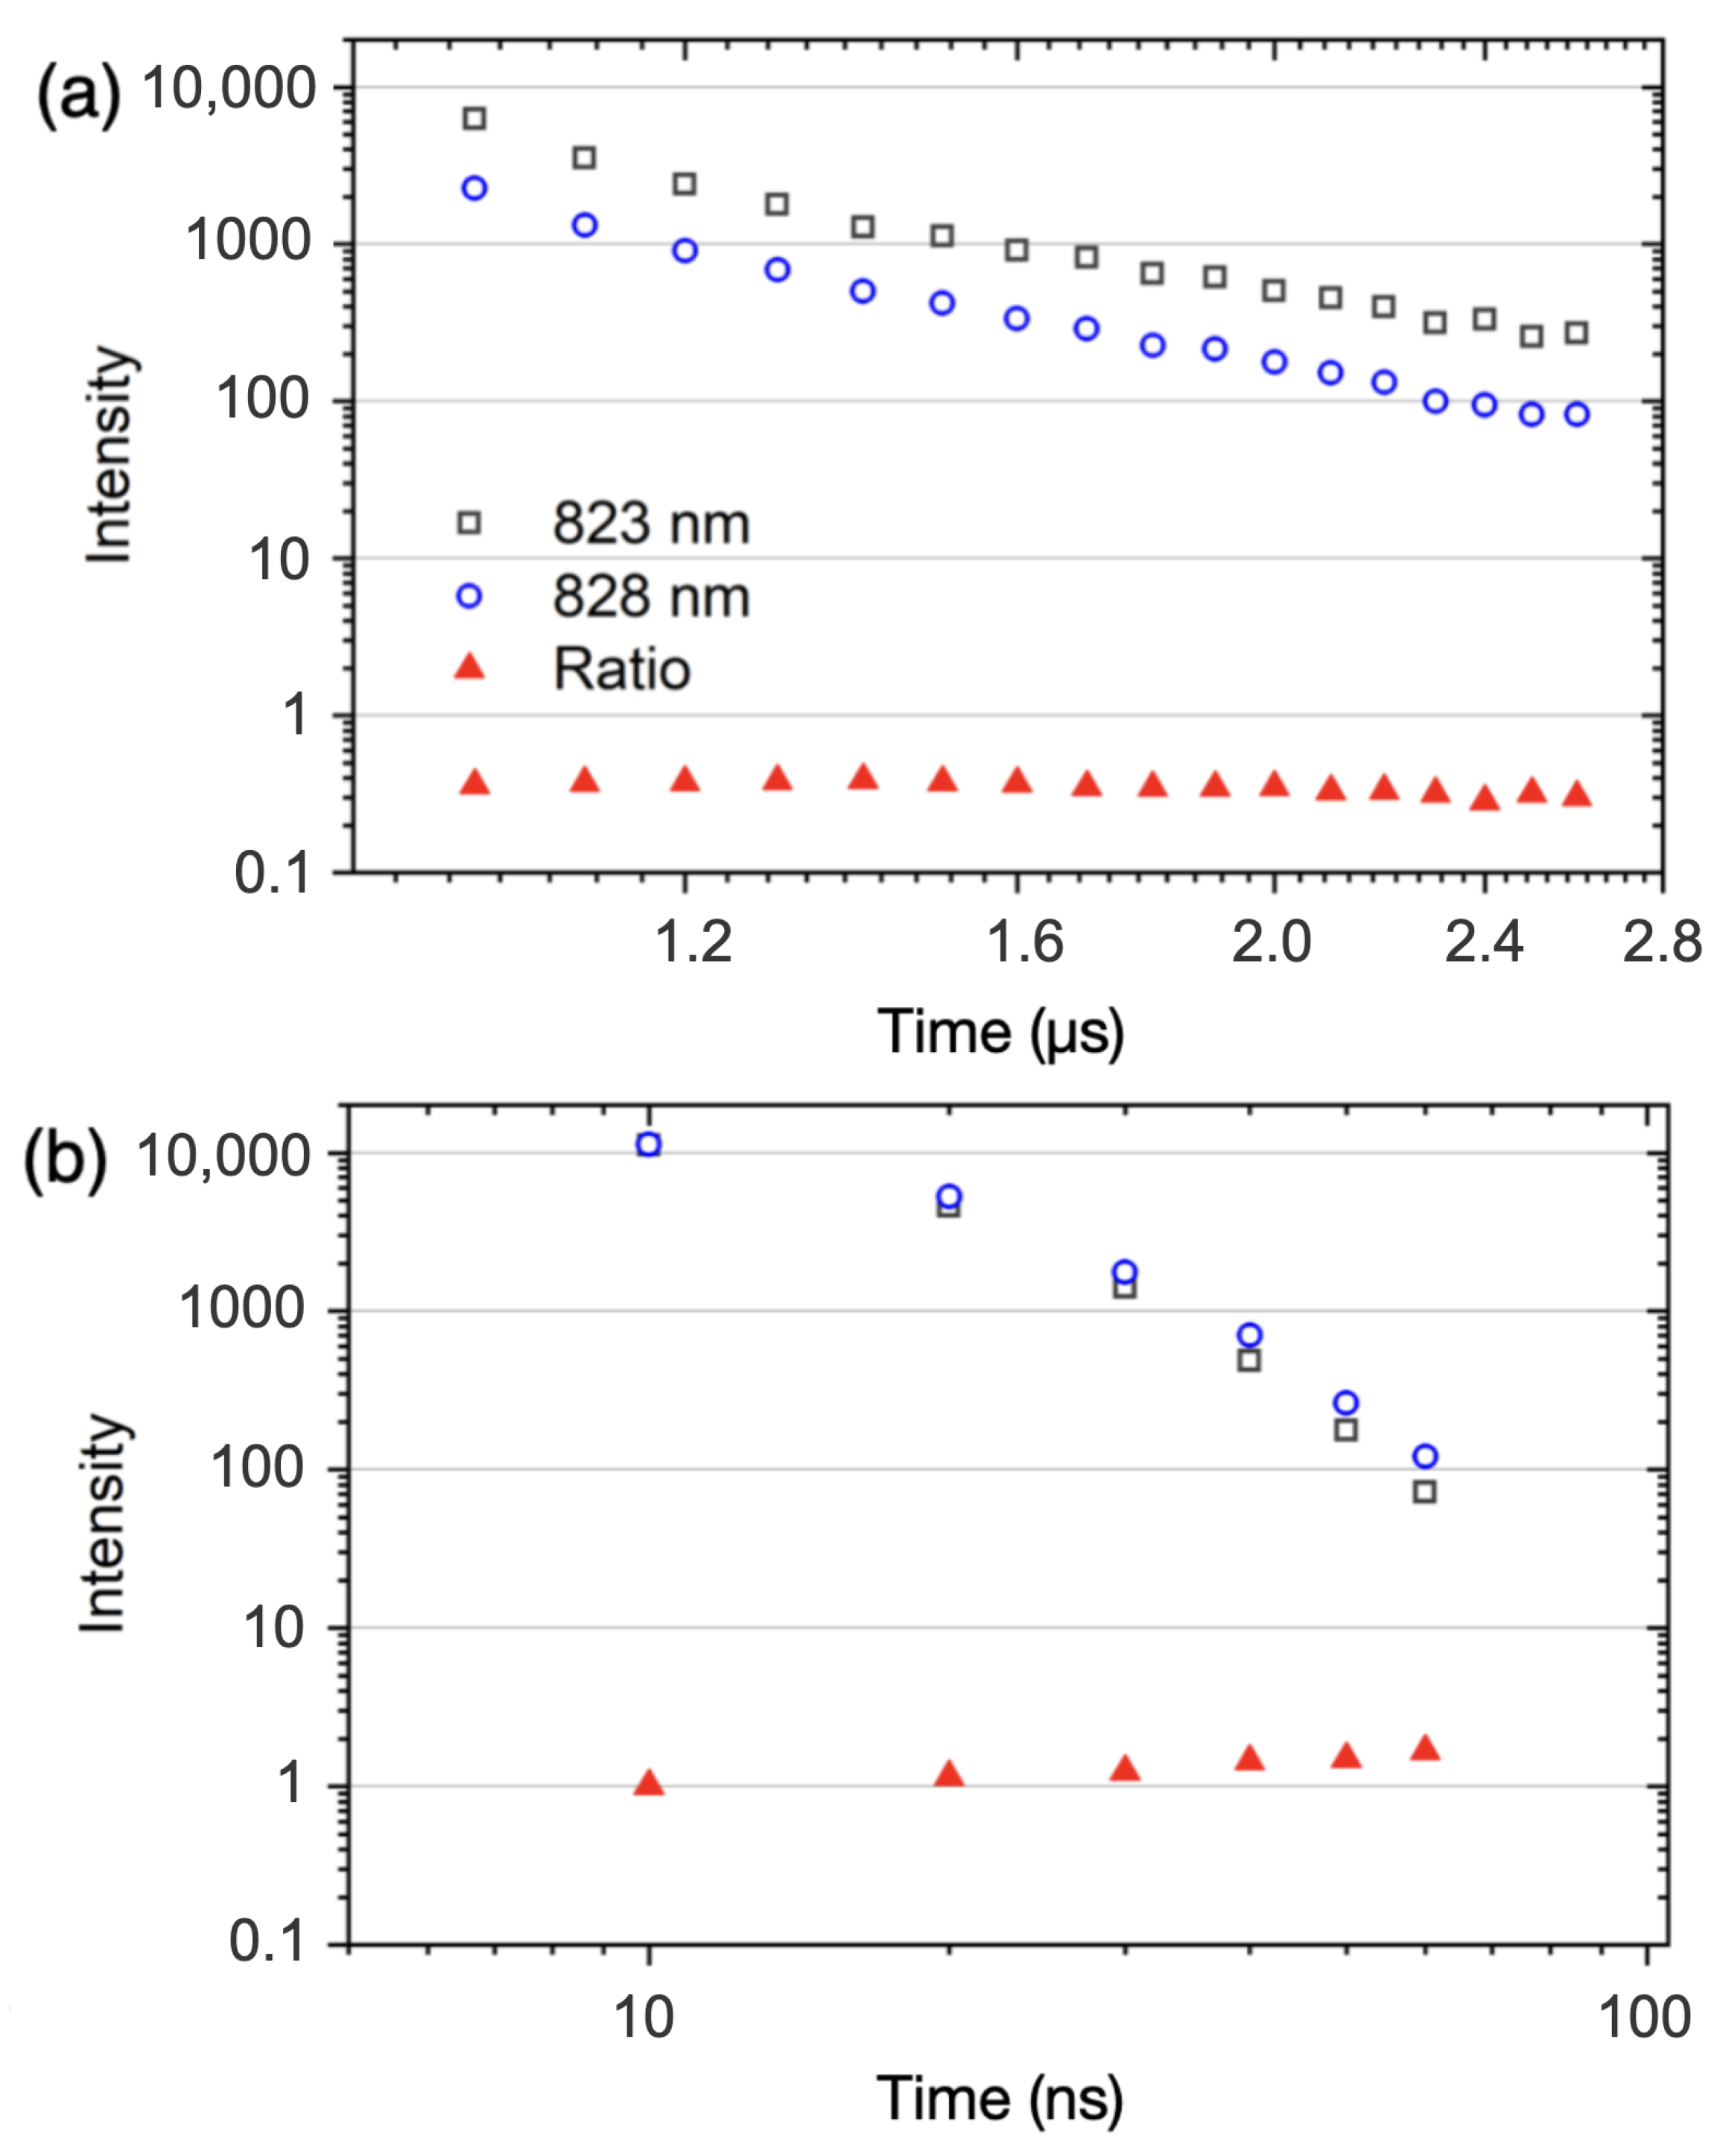
3.2. NIR Spectral Region
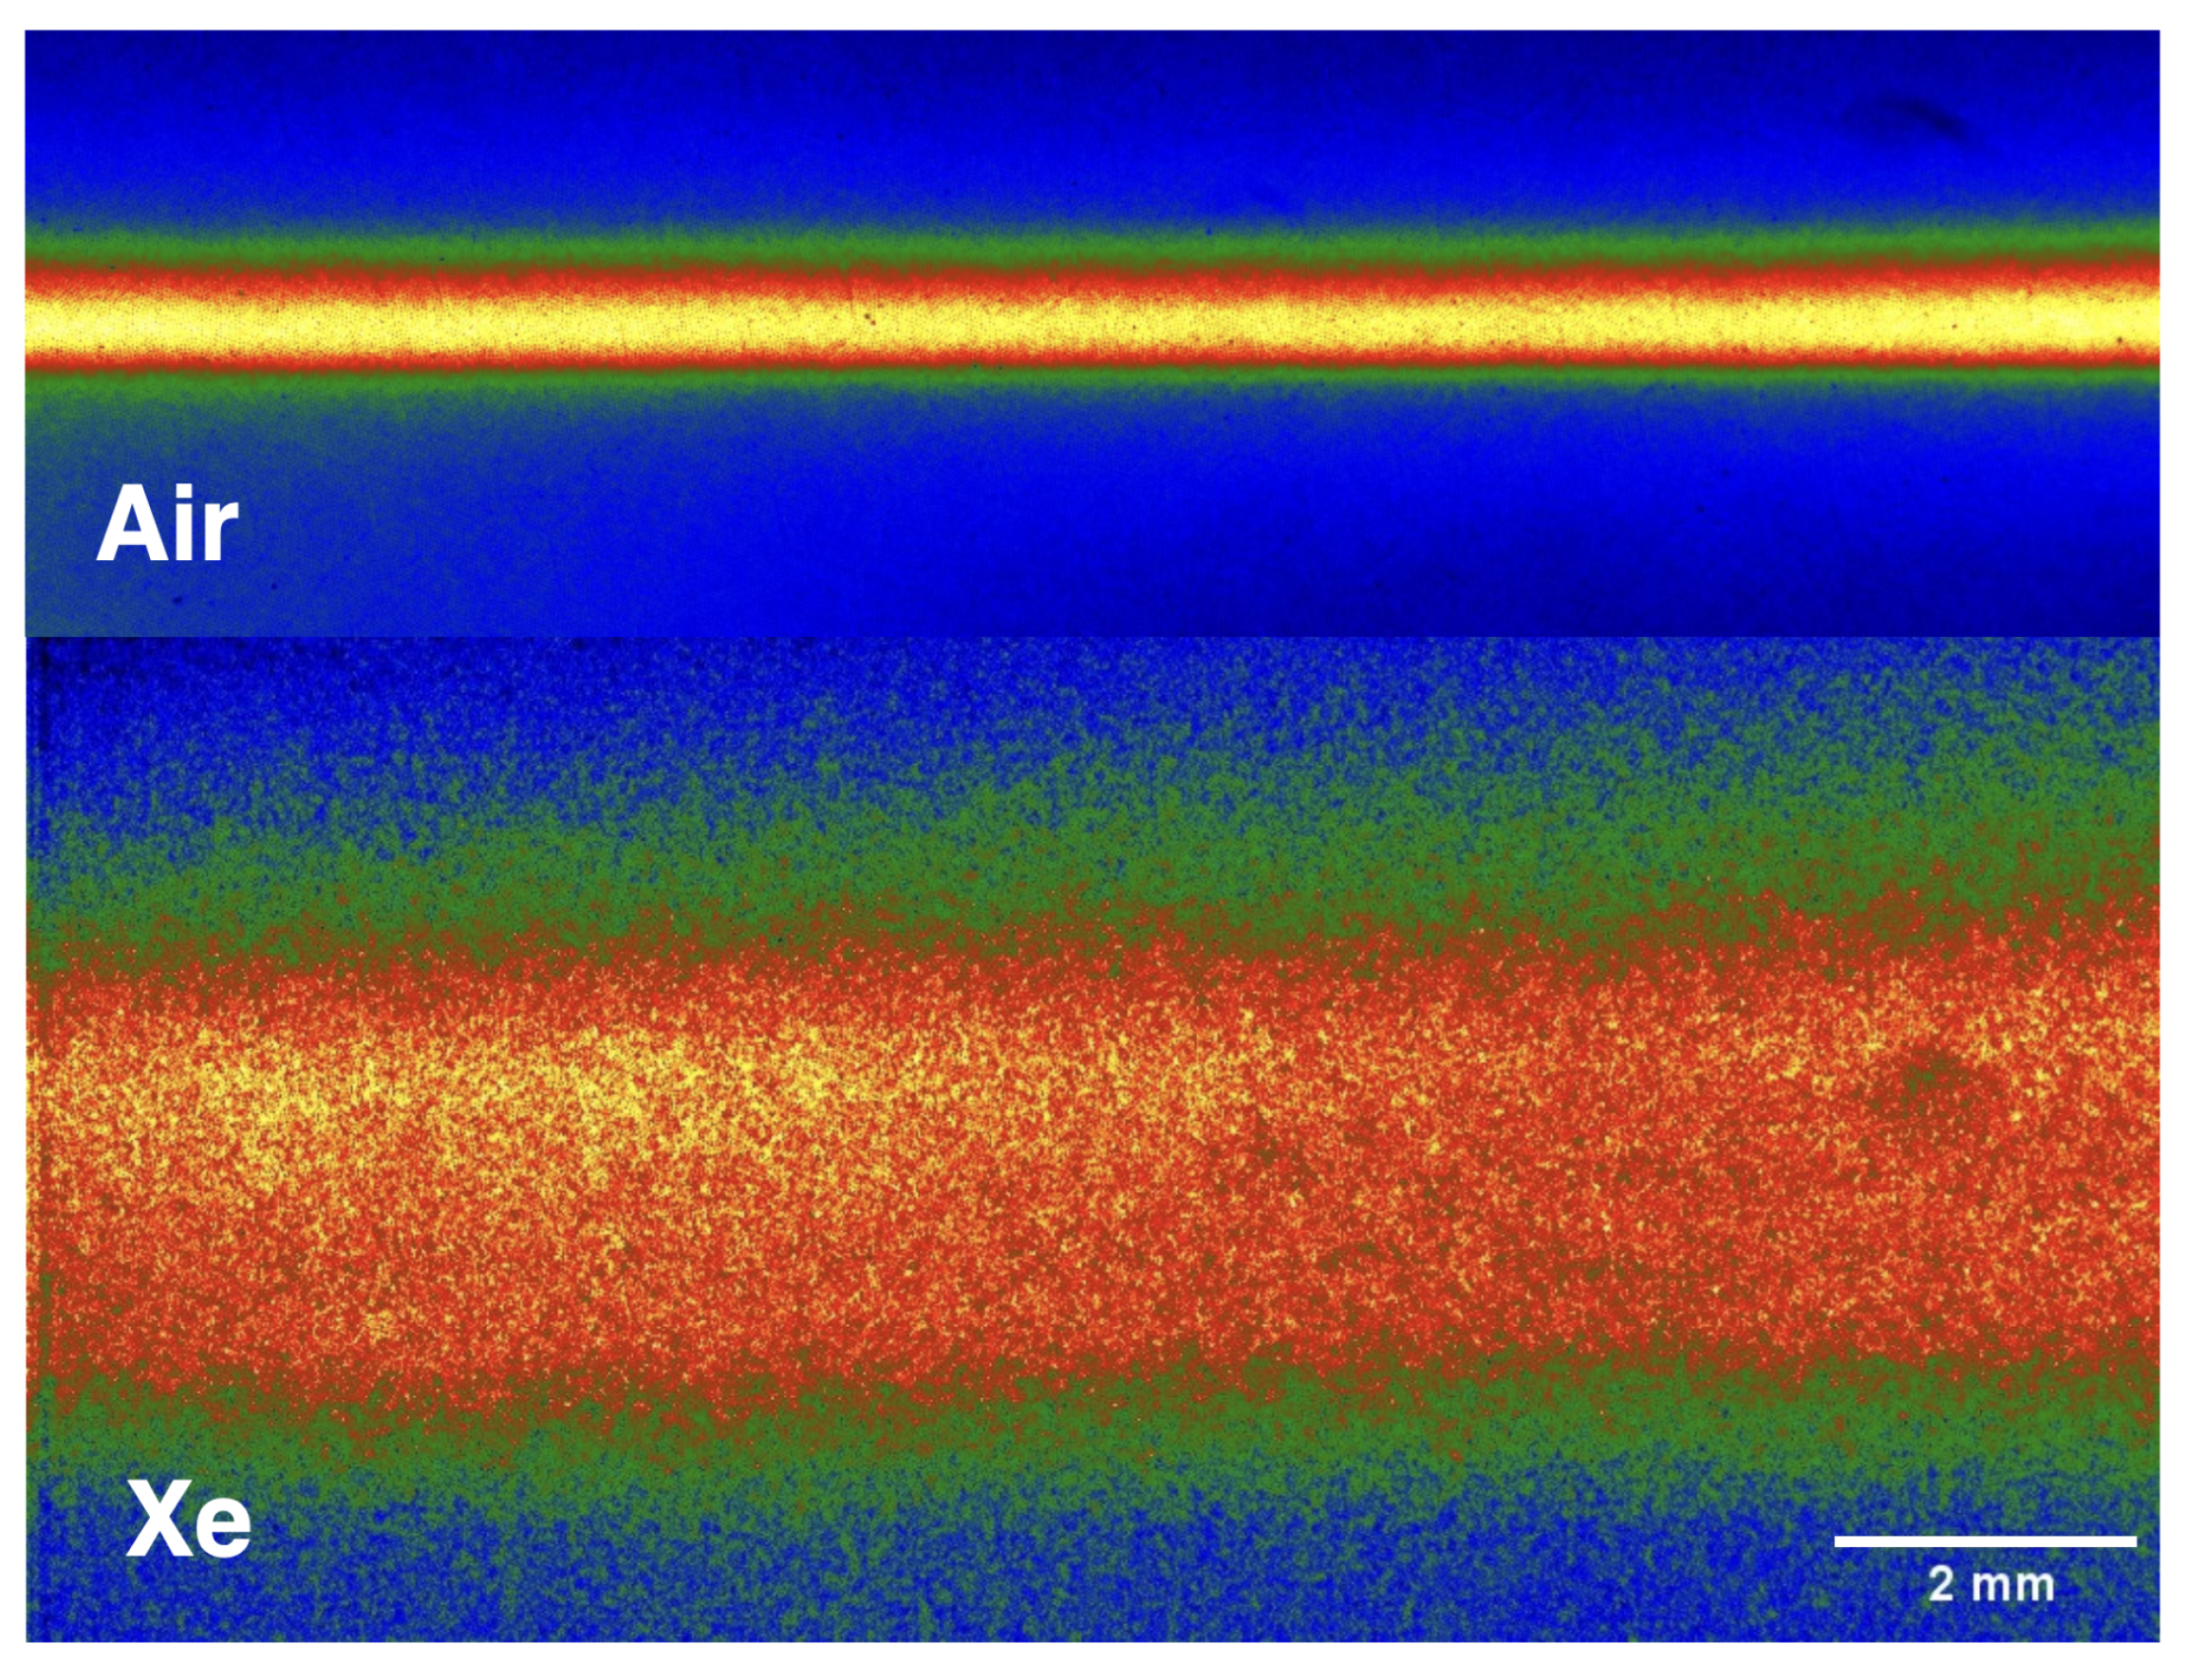
3.3. Filament Imaging
3.4. On-Axis Collection
4. Conclusions
Author Contributions
Funding
Institutional Review Board Statement
Informed Consent Statement
Data Availability Statement
Conflicts of Interest
References
- Kunz, C.O.; Paperiello, C.J. Xenon-133: Ambient Activity from Nuclear Power Stations. Science 1976, 192, 1235–1237. [Google Scholar] [CrossRef] [PubMed]
- Bowyer, T.W. A Review of Global Radioxenon Background Research and Issues. Pure Appl. Geophys. 2021, 178, 2665–2675. [Google Scholar] [CrossRef]
- Andrews, H.; Myhre, K.; Mcfarlane, J. Concept for an irradiation experiment to test a laser-induced breakdown spectroscopy off-gas sensor for molten salt systems. Front. Energy Res. 2023, 10, 1100536. [Google Scholar] [CrossRef]
- Korsah, K.; Kisner, R.; Ramuhalli, P.; Wootan, D.W.; Anheier, N.C.; Diaz, A.A.; Hirt, E.H.; Vilim, R.; Chien, H.T.; Bakhtiari, S.; et al. Assessment of Sensor Technologies for Advanced Reactors; Technical report; Pacific Northwest National Lab. (PNNL): Richland, WA, USA, 2017. [Google Scholar]
- Sabharwall, P.; Weaver, K.; Anand, N.K.; Ellis, C.; Sun, X.; Choi, H.; Chen, D.; Christensen, R.; Fronk, B.M.; Gess, J.; et al. Preconceptual Design of Multifunctional Gas-Cooled Cartridge Loop for the Versatile Test Reactor: Instrumentation and Measurement—Part II. Nucl. Sci. Eng. 2022, 196, S215–S233. [Google Scholar] [CrossRef]
- Cassata, W.; Prussin, S.; Knight, K.; Hutcheon, I.; Isselhardt, B.; Renne, P. When the dust settles: Stable xenon isotope constraints on the formation of nuclear fallout. J. Environ. Radioact. 2014, 137, 88–95. [Google Scholar] [CrossRef]
- Goodwin, M.A.; Chester, D.L.; Britton, R.; Davies, A.V.; Border, J. Analysis of radionuclide detection events on the International Monitoring System. J. Environ. Radioact. 2022, 242, 106789. [Google Scholar] [CrossRef]
- Bowyer, T.W.; Abel, K.H.; Hubbard, C.W.; McKinnon, A.D.; Panisko, M.E.; Perkins, R.W.; Reeder, P.L.; Thompson, R.C.; Warner, R.A. Automated separation and measurement of radioxenon for the Comprehensive Test Ban Treaty. J. Radioanal. Nucl. Chem. 1998, 235, 77–82. [Google Scholar] [CrossRef]
- Ringbom, A.; Larson, T.; Axelsson, A.; Elmgren, K.; Johansson, C. SAUNA—A system for automatic sampling, processing, and analysis of radioactive xenon. Nucl. Instrum. Methods Phys. Res. Sect. A Accel. Spectrometers, Detect. Assoc. Equip. 2003, 508, 542–553. [Google Scholar] [CrossRef]
- Fontaine, J.P.; Pointurier, F.; Blanchard, X.; Taffary, T. Atmospheric xenon radioactive isotope monitoring. J. Environ. Radioact. 2004, 72, 129–135. [Google Scholar] [CrossRef]
- Cremers, D.A.; Radziemski, L.J. Handbook of Laser-Induced Breakdown Spectroscopy; John Wiley & Sons: Hoboken, NJ, USA, 2013. [Google Scholar]
- Burger, M.; Garrett, L.; Burak, A.J.; Petrov, V.; Manera, A.; Sabharwall, P.; Sun, X.; Jovanovic, I. Trace xenon detection in helium environment via laser-induced breakdown spectroscopy. J. Anal. At. Spectrom. 2021, 36, 824–828. [Google Scholar] [CrossRef]
- Burger, M.; Finney, L.; Garrett, L.; Harilal, S.; Hartig, K.; Nees, J.; Skrodzki, P.; Xiao, X.; Jovanovic, I. Laser ablation spectrometry for studies of uranium plasmas, reactor monitoring, and spent fuel safety. Spectrochim. Acta Part B At. Spectrosc. 2021, 179, 106095. [Google Scholar] [CrossRef]
- Labutin, T.A.; Lednev, V.N.; Ilyin, A.A.; Popov, A.M. Femtosecond laser-induced breakdown spectroscopy. J. Anal. At. Spectrom. 2016, 31, 90–118. [Google Scholar] [CrossRef]
- Gurevich, E.; Hergenröder, R. Femtosecond laser-induced breakdown spectroscopy: Physics, applications, and perspectives. Appl. Spectrosc. 2007, 61, 233A–242A. [Google Scholar] [CrossRef] [PubMed]
- Narlagiri, L.M.; Soma, V.R. Recent Developments in Standoff Laser-Induced Breakdown Spectroscopy. In Laser Induced Breakdown Spectroscopy (LIBS); John Wiley & Sons, Ltd.: Hoboken, NJ, USA, 2023; pp. 137–163. [Google Scholar] [CrossRef]
- Couairon, A.; Mysyrowicz, A. Femtosecond filamentation in transparent media. Phys. Rep. 2007, 441, 47–189. [Google Scholar] [CrossRef]
- Rodriguez, M.; Bourayou, R.; Méjean, G.; Kasparian, J.; Yu, J.; Salmon, E.; Scholz, A.; Stecklum, B.; Eislöffel, J.; Laux, U.; et al. Kilometer-range nonlinear propagation of femtosecond laser pulses. Phys. Rev. E 2004, 69, 036607. [Google Scholar] [CrossRef]
- Durand, M.; Houard, A.; Prade, B.; Mysyrowicz, A.; Durécu, A.; Moreau, B.; Fleury, D.; Vasseur, O.; Borchert, H.; Diener, K.; et al. Kilometer range filamentation. Opt. Express 2013, 21, 26836–26845. [Google Scholar] [CrossRef] [PubMed]
- Stelmaszczyk, K.; Rohwetter, P.; Méjean, G.; Yu, J.; Salmon, E.; Kasparian, J.; Ackermann, R.; Wolf, J.P.; Wöste, L. Long-distance remote laser-induced breakdown spectroscopy using filamentation in air. Appl. Phys. Lett. 2004, 85, 3977–3979. [Google Scholar] [CrossRef]
- Burger, M.; Skrodzki, P.J.; Finney, L.A.; Nees, J.; Jovanovic, I. Remote Detection of Uranium Using Self-Focusing Intense Femtosecond Laser Pulses. Remote Sens. 2020, 12, 1281. [Google Scholar] [CrossRef]
- Hartig, K.C.; Ghebregziabher, I.; Jovanovic, I. Standoff Detection of Uranium and its Isotopes by Femtosecond Filament Laser Ablation Molecular Isotopic Spectrometry. Sci. Rep. 2017, 7, 43852. [Google Scholar] [CrossRef]
- Latty, K.S.; Hartig, K.C. Spatiotemporal Plasma-Particle Characterization of Dry Aerosols Using Nanosecond, Femtosecond, and Filament Laser-Produced Plasmas. Appl. Spectrosc. 2023, 77, 848–859. [Google Scholar] [CrossRef]
- Méjean, G.; Kasparian, J.; Yu, J.; Frey, S.; Salmon, E.; Wolf, J.P. Remote detection and identification of biological aerosols using a femtosecond terawatt lidar system. Appl. Phys. B 2004, 78, 535–537. [Google Scholar] [CrossRef]
- Li, H.L.; Wei, X.Y.; Xu, H.L.; Chin, S.L.; Yamanouchi, K.; Sun, H.B. Femtosecond laser filamentation for sensing combustion intermediates: A comparative study. Sens. Actuators B Chem. 2014, 203, 887–890. [Google Scholar] [CrossRef]
- Daigle, J.F.; Mathieu, P.; Roy, G.; Simard, J.R.; Chin, S. Multi-constituents detection in contaminated aerosol clouds using remote-filament-induced breakdown spectroscopy. Opt. Commun. 2007, 278, 147–152. [Google Scholar] [CrossRef]
- Chin, S.; Xu, H.; Luo, Q.; Théberge, F.; Liu, W.; Daigle, J.; Kamali, Y.; Simard, P.; Bernhardt, J.; Hosseini, S.; et al. Filamentation “remote” sensing of chemical and biological agents/pollutants using only one femtosecond laser source. Appl. Phys. B 2009, 95, 1–12. [Google Scholar] [CrossRef]
- Kasparian, J.; Rodriguez, M.; Méjean, G.; Yu, J.; Salmon, E.; Wille, H.; Bourayou, R.; Frey, S.; André, Y.B.; Mysyrowicz, A.; et al. White-Light Filaments for Atmospheric Analysis. Science 2003, 301, 61–64. [Google Scholar] [CrossRef]
- Clough, B.; Liu, J.; Zhang, X.C. “All air–plasma” terahertz spectroscopy. Opt. Lett. 2011, 36, 2399–2401. [Google Scholar] [CrossRef]
- Odhner, J.H.; McCole, E.T.; Levis, R.J. Filament-driven impulsive Raman spectroscopy. J. Phys. Chem. A 2011, 115, 13407–13412. [Google Scholar] [CrossRef]
- McCole Dlugosz, E.T.; Fisher, R.; Filin, A.; Romanov, D.A.; Odhner, J.H.; Levis, R.J. Filament-assisted impulsive Raman spectroscopy of ozone and nitrogen oxides. J. Phys. Chem. A 2015, 119, 9272–9280. [Google Scholar] [CrossRef]
- Qi, P.; Qian, W.; Guo, L.; Xue, J.; Zhang, N.; Wang, Y.; Zhang, Z.; Zhang, Z.; Lin, L.; Sun, C.; et al. Sensing with Femtosecond Laser Filamentation. Sensors 2022, 22, 7076. [Google Scholar] [CrossRef]
- Zhang, Z.; Zhang, N.; Wang, Y.; Xie, B.; Xiang, Y.; Guo, J.; Shang, B.; Guo, L.; Zhao, X.; Xie, M.; et al. Detection of 1.4 μg/m3 Na+ in aerosol at a 30 m distance using 1 kHz femtosecond laser filamentation in air. Opt. Express 2023, 31, 6464–6474. [Google Scholar] [CrossRef]
- Xu, H.; Kamali, Y.; Marceau, C.; Simard, P.; Liu, W.; Bernhardt, J.; Méjean, G.; Mathieu, P.; Roy, G.; Simard, J.R.; et al. Simultaneous detection and identification of multigas pollutants using filament-induced nonlinear spectroscopy. Appl. Phys. Lett. 2007, 90, 101106. [Google Scholar] [CrossRef]
- Mitryukovskiy, S.; Liu, Y.; Ding, P.; Houard, A.; Mysyrowicz, A. Backward stimulated radiation from filaments in nitrogen gas and air pumped by circularly polarized 800 nm femtosecond laser pulses. Opt. Express 2014, 22, 12750–12759. [Google Scholar] [CrossRef] [PubMed]
- Li, X.; Li, B.; Liu, J.; Zhu, Z.; Zhang, D.; Tian, Y.; Gao, Q.; Li, Z. Enhancement of femtosecond laser-induced plasma fluorescence using a nanosecond laser. Opt. Express 2019, 27, 5755–5763. [Google Scholar] [CrossRef] [PubMed]
- Skrodzki, P.; Burger, M.; Finney, L.; Poineau, F.; Balasekaran, S.; Nees, J.; Czerwinski, K.; Jovanovic, I. Ultrafast laser filament-induced fluorescence spectroscopy of uranyl fluoride. Sci. Rep. 2018, 8, 11629. [Google Scholar] [CrossRef] [PubMed]
- Jordan, B.S.; Readle, J.D.; Cooper, J.R.; Cook, M.; Hayward, J.P.; Daniel Hartman, J.; Forrest, D.; Hall, H.L. Assay measurement of gaseous UF6 using femtosecond laser-induced breakdown spectroscopy in the 424.4 nm spectral region. Ann. Nucl. Energy 2023, 181, 109523. [Google Scholar] [CrossRef]
- Silwal, R.; Lapierre, A.; Gillaspy, J.D.; Dreiling, J.M.; Blundell, S.A.; Dipti; Borovik, D.A.; Gwinner, G.; Villari, A.C.C.; Ralchenko, Y.; et al. Measuring the difference in nuclear charge radius of Xe isotopes by EUV spectroscopy of highly charged Na-like ions. Phys. Rev. A 2018, 98, 052502. [Google Scholar] [CrossRef]
- Jackson, D.A.; Coulombe, M.C. Isotope Shifts in the Arc Spectrum of Xenon. Proc. R. Soc. Lond. Ser. A Math. Phys. Sci. 1974, 338, 277–298. [Google Scholar]
- Xu, H.L.; Chin, S.L. Femtosecond laser filamentation for atmospheric sensing. Sensors 2011, 11, 32–53. [Google Scholar] [CrossRef]
- Liu, W.; Luo, Q.; Chin, S.L. Competition between multiphoton/tunnel ionization and filamentation induced by powerful femtosecond laser pulses in air. Chin. Opt. Lett. 2003, 1, 56–59. [Google Scholar]
- Garrett, L.J.; Morgan, B.W.; Burger, M.; Lee, Y.; Kim, H.; Sabharwall, P.; Choi, S.; Jovanovic, I. Impact of Glass Irradiation on Laser-Induced Breakdown Spectroscopy Data Analysis. Sensors 2023, 23, 691. [Google Scholar] [CrossRef]
- DeMichelis, C. Laser induced gas breakdown: A bibliographical review. IEEE J. Quantum Electron. 1969, 5, 188–202. [Google Scholar] [CrossRef]
- Zeldovich, Y.B.; Raizer, Y.P. Shock Waves and High Temperature Hydrodynamic Phenomena; Academic Press: London, UK, 1966. [Google Scholar]
- Harilal, S.S.; Yeak, J.; Brumfield, B.E.; Phillips, M.C. Consequences of femtosecond laser filament generation conditions in standoff laser induced breakdown spectroscopy. Opt. Express 2016, 24, 17941–17949. [Google Scholar] [CrossRef] [PubMed]
- Kramida, A.; Ralchenko, Y.; Reader, J. NIST Atomic Spectra Database; National Institute of Standards and Technology: Gaithersburg, MD, USA, 2023.
- Latty, K.S.; Burger, M.; Borrero, J.; Jovanovic, I.; Hartig, K.C. Emission characteristics of bulk aerosols excited by externally focused femtosecond filaments. Opt. Express 2023, 31, 24652. [Google Scholar] [CrossRef] [PubMed]
- Bree, C.; Demircan, A.; Steinmeyer, G. Method for Computing the Nonlinear Refractive Index via Keldysh Theory. IEEE J. Quantum Electron. 2010, 46, 433–437. [Google Scholar] [CrossRef]
- Couairon, A.; Chakraborty, H.S.; Gaarde, M.B. From single-cycle self-compressed filaments to isolated attosecond pulses in noble gases. Phys. Rev. A 2008, 77, 053814. [Google Scholar] [CrossRef]
- Börzsönyi, A.; Heiner, Z.; Kovács, A.; Kalashnikov, M.P.; Osvay, K. Measurement of pressure dependent nonlinear refractive index of inert gases. Opt. Express 2010, 18, 25847–25854. [Google Scholar] [CrossRef] [PubMed]
- Marburger, J.H. Self-focusing: Theory. Prog. Quantum Electron. 1975, 4, 35–110. [Google Scholar] [CrossRef]
- Akturk, S.; D’Amico, C.; Franco, M.; Couairon, A.; Mysyrowicz, A. Pulse shortening, spatial mode cleaning, and intense terahertz generation by filamentation in xenon. Phys. Rev. A 2007, 76, 063819. [Google Scholar] [CrossRef]
- Théberge, F.; Liu, W.; Simard, P.T.; Becker, A.; Chin, S.L. Plasma density inside a femtosecond laser filament in air: Strong dependence on external focusing. Phys. Rev. E 2006, 74, 036406. [Google Scholar] [CrossRef]
- Bergé, L.; Skupin, S.; Lederer, F.; Méjean, G.; Yu, J.; Kasparian, J.; Salmon, E.; Wolf, J.P.; Rodriguez, M.; Wöste, L.; et al. Multiple Filamentation of Terawatt Laser Pulses in Air. Phys. Rev. Lett. 2004, 92, 225002. [Google Scholar] [CrossRef]
- Skrodzki, P.J.; Burger, M.; Jovanovic, I. Transition of Femtosecond-Filament-Solid Interactions from Single to Multiple Filament Regime. Sci. Rep. 2017, 7, 12740. [Google Scholar] [CrossRef] [PubMed]
- Guo, H.; Zhu, Z.; Wang, T.; Chen, N.; Liu, Y.; Zhang, J.; Sun, H.; Liu, J.; Li, R. Polarization-gated filament-induced remote breakdown spectroscopy. Chin. Opt. Lett. 2018, 16, 033201. [Google Scholar] [CrossRef]


Disclaimer/Publisher’s Note: The statements, opinions and data contained in all publications are solely those of the individual author(s) and contributor(s) and not of MDPI and/or the editor(s). MDPI and/or the editor(s) disclaim responsibility for any injury to people or property resulting from any ideas, methods, instructions or products referred to in the content. |
© 2023 by the authors. Licensee MDPI, Basel, Switzerland. This article is an open access article distributed under the terms and conditions of the Creative Commons Attribution (CC BY) license (https://creativecommons.org/licenses/by/4.0/).
Share and Cite
Burger, M.; Latty, K.S.; Frigerio, L.; Arnaud, T.; Hartig, K.C.; Jovanovic, I. Ultrafast Laser-Excited Optical Emission of Xe under Loose-Focusing Conditions. Sensors 2023, 23, 9374. https://doi.org/10.3390/s23239374
Burger M, Latty KS, Frigerio L, Arnaud T, Hartig KC, Jovanovic I. Ultrafast Laser-Excited Optical Emission of Xe under Loose-Focusing Conditions. Sensors. 2023; 23(23):9374. https://doi.org/10.3390/s23239374
Chicago/Turabian StyleBurger, Miloš, Kyle S. Latty, Leandro Frigerio, Thiago Arnaud, Kyle C. Hartig, and Igor Jovanovic. 2023. "Ultrafast Laser-Excited Optical Emission of Xe under Loose-Focusing Conditions" Sensors 23, no. 23: 9374. https://doi.org/10.3390/s23239374
APA StyleBurger, M., Latty, K. S., Frigerio, L., Arnaud, T., Hartig, K. C., & Jovanovic, I. (2023). Ultrafast Laser-Excited Optical Emission of Xe under Loose-Focusing Conditions. Sensors, 23(23), 9374. https://doi.org/10.3390/s23239374