1. Introduction
The electrocardiogram (ECG) allows for the convenient measurement of cardiac electrical activity. Successive waveforms, known as the P wave, QRS complex, and T wave, characterize each cardiac cycle on the ECG. These waveforms represent the depolarization and repolarization activities in the cells of the atrium and ventricle. Automatic detection of ECG waveforms provides essential information for diagnosing cardiac disease. This broad field continues to be an active research topic, as evidenced by recent publications [
1,
2]. Due to the significant morphological variation of ECG signals, it is not easy to design automatic and widely applicable algorithms. This difficulty partly explains the continuous effort made by researchers in ECG signal processing. ECG detection algorithms aim to improve classification accuracy and are becoming as reliable and successful as expert cardiologists.
Researchers have extensively investigated automatic R-peak detection as a classic ECG signal processing problem. The well-known real-time R-peak detection algorithm was proposed by Pan-Tompkins [
3]. This classical algorithm can process and display the detection result for each sample after a learning period. However, the complexity of the Pan-Tompkins algorithm is high, and the detection accuracy is moderate compared with recently developed algorithms [
1,
4,
5].
Several notable studies have recently been conducted [
4,
6,
7]. However, a problem with most R-peak detection algorithms is that the computational complexity could be higher, and they require impractical assumptions, e.g., they usually need a global statistical knowledge of the entire input signal [
3,
8,
9,
10,
11].
On the other hand, researchers have focused on developing efficient sensing algorithms suitable for wearable ECG devices [
5,
12,
13,
14,
15]. The authors proposed a simple real-time R-peak detector with low computational cost [
16]. As in many previous works, the authors of [
15] customized the input parameters of the algorithm for optimal performance on the MIT-BIH arrhythmia database, which may not be suitable for other databases. Moreover, it is not robust to noise. According to the comprehensive review by the authors, several studies are mentioned in Chapter 4 that achieve a transcendental level of success in determining the R peak. Nevertheless, the algorithm’s performance is susceptible to heart rate variations.
Researchers have successfully used two-parameter parabolic fitting to detect R points of ECG signals [
1,
7]. However, these methods are not suitable for wearable devices since they use computationally complex processes such as high-order band-pass filters, isoelectric line localization, and wavelet filtering. Additionally, one needs a comprehensive understanding of the complete ECG signal.
The proposed method utilizes single-parameter parabolic fitting to extract a feature known as parabolic height. This feature detects partial P peaks, or candidates, by comparing them with a parabolic height threshold. Then, the best candidates are designated as R points of the ECG signal. Afterwards, this threshold is adapted to different signal amplitudes. The proposed algorithm does not require calculating and estimating the isoelectric line of the ECG signal, nor does it require any prior filtering. The authors tested the algorithm on two databases, QT and BIH-MIT. The results show that the proposed algorithm performs very well compared to previous work in terms of robustness to noise and reduced computational resources. It is essential to highlight that the algorithm presented in this document improves the performance of the previous algorithm, called LDR, by reducing the number of operations and the performance of the detection of maximum and minimum points.
2. Materials and Methods
This paper proposes a novel algorithm for R-peak detection, considering the limitations of computational resources commonly found in wearable ECG devices. We tested the algorithm for detecting R peaks in ECG signals from two widely used research databases: the QT database and BIH-MIT database. These ECG signals were obtained following ethical guidelines, as reported in [
17,
18,
19,
20]. We conducted all programming for this work on the MATLAB platform.
The QT database contains a total of 105 15 min ECGs. We chose the ECGs in this database to represent various QRS and ST-T morphologies with real-world variability, aiming to challenge detection algorithms [
18]. The sampling rate in this database is 360 Hz, allowing for a total of 86,995 beats from 82 recordings to be stored, and the remaining 23, sel30-sel52, were not considered due to the absence of QRS annotations. This number is consistent with the results of other studies [
5].
The BIH-MIT database contains 48 ECG records, each containing a 30 min ECG signal [
19]. They used the entire dataset, totaling 109,490 beats. Twenty-five recordings contain fewer common arrhythmias. The recordings have a sampling rate of 360 Hz with a resolution of 11 bits at a 10 mV interval. The ECG recordings have acceptable quality, high and sharp P and T waves, negative R waves, small R peak amplitudes, wider R waves, muscle noise, deviation from baseline, sudden changes in beat morphology, multiform PVCs, long pauses, and irregular heart rhythms.
This work ignores all non-beat annotations defined by Physionet [
19]. Note that both databases offer two channels of ECG signals. This study used only the first channel to develop and test the algorithm.
To be consistent with most of the R-peak detection studies [
3,
5,
8,
9,
10,
11,
12,
14,
15], we used quantitative comparisons in terms of sensitivity (S), positive predictability (P), and detection error (DER), as defined in Equations (1)–(3):
The true positive (TP) is defined as the number of R peaks detected, false negative (FN) is the number of true R peaks that was not detected, and false positive (FP) is the number of detected R peaks that is not detected. Sensitivity represents the percentage of true beats correctly detected, whereas positive predictability presents the percentage of true beats detected.
A problem with the BIH-MIT and QT databases is that the beat annotations are often not located at peak R. This poses a severe problem when evaluating the detectors, as it introduces a temporal fluctuation in the time stamps of peak R. For this reason, we made a readjustment to the original annotations. After applying the algorithm to each recording, they automatically calculated the TP, FN, and FP indices using the new beat annotations, with a tolerance of 40 ms [
20]. This tolerance is consistent with similar work, although sometimes implicit.
3. Fast Parabolic Fitting for ECG Signals
Parabolic fitting aims to extract from a neighborhood of a point in the ECG signal a feature that indicates that the point is the R point and that the neighborhood is part of the R peak. Parabolic fitting has already been successfully applied in the analysis of ECG signals [
1,
17]. One of the significant advantages of parabolic fitting is that it is not necessary to calculate the isoelectric line of the ECG signal. However, in such schemes, a parabola fitting uses two parameters: window width and parabola height, increasing the computational cost and affecting the performance of wearable devices. The computational cost increases by the number of additional operations required, such as
additions,
multiplication, and 2 divisions.
In response to the prior inconveniences, we have introduced a novel approach to parabolic fitting, employing only one parameter. This modification substantially reduces the number of addition and multiplication operations, effectively improving the computational cost, a critical factor in enhancing the performance of wearable devices. Furthermore, our approach eliminates division operations, resulting in a more efficient and streamlined process.
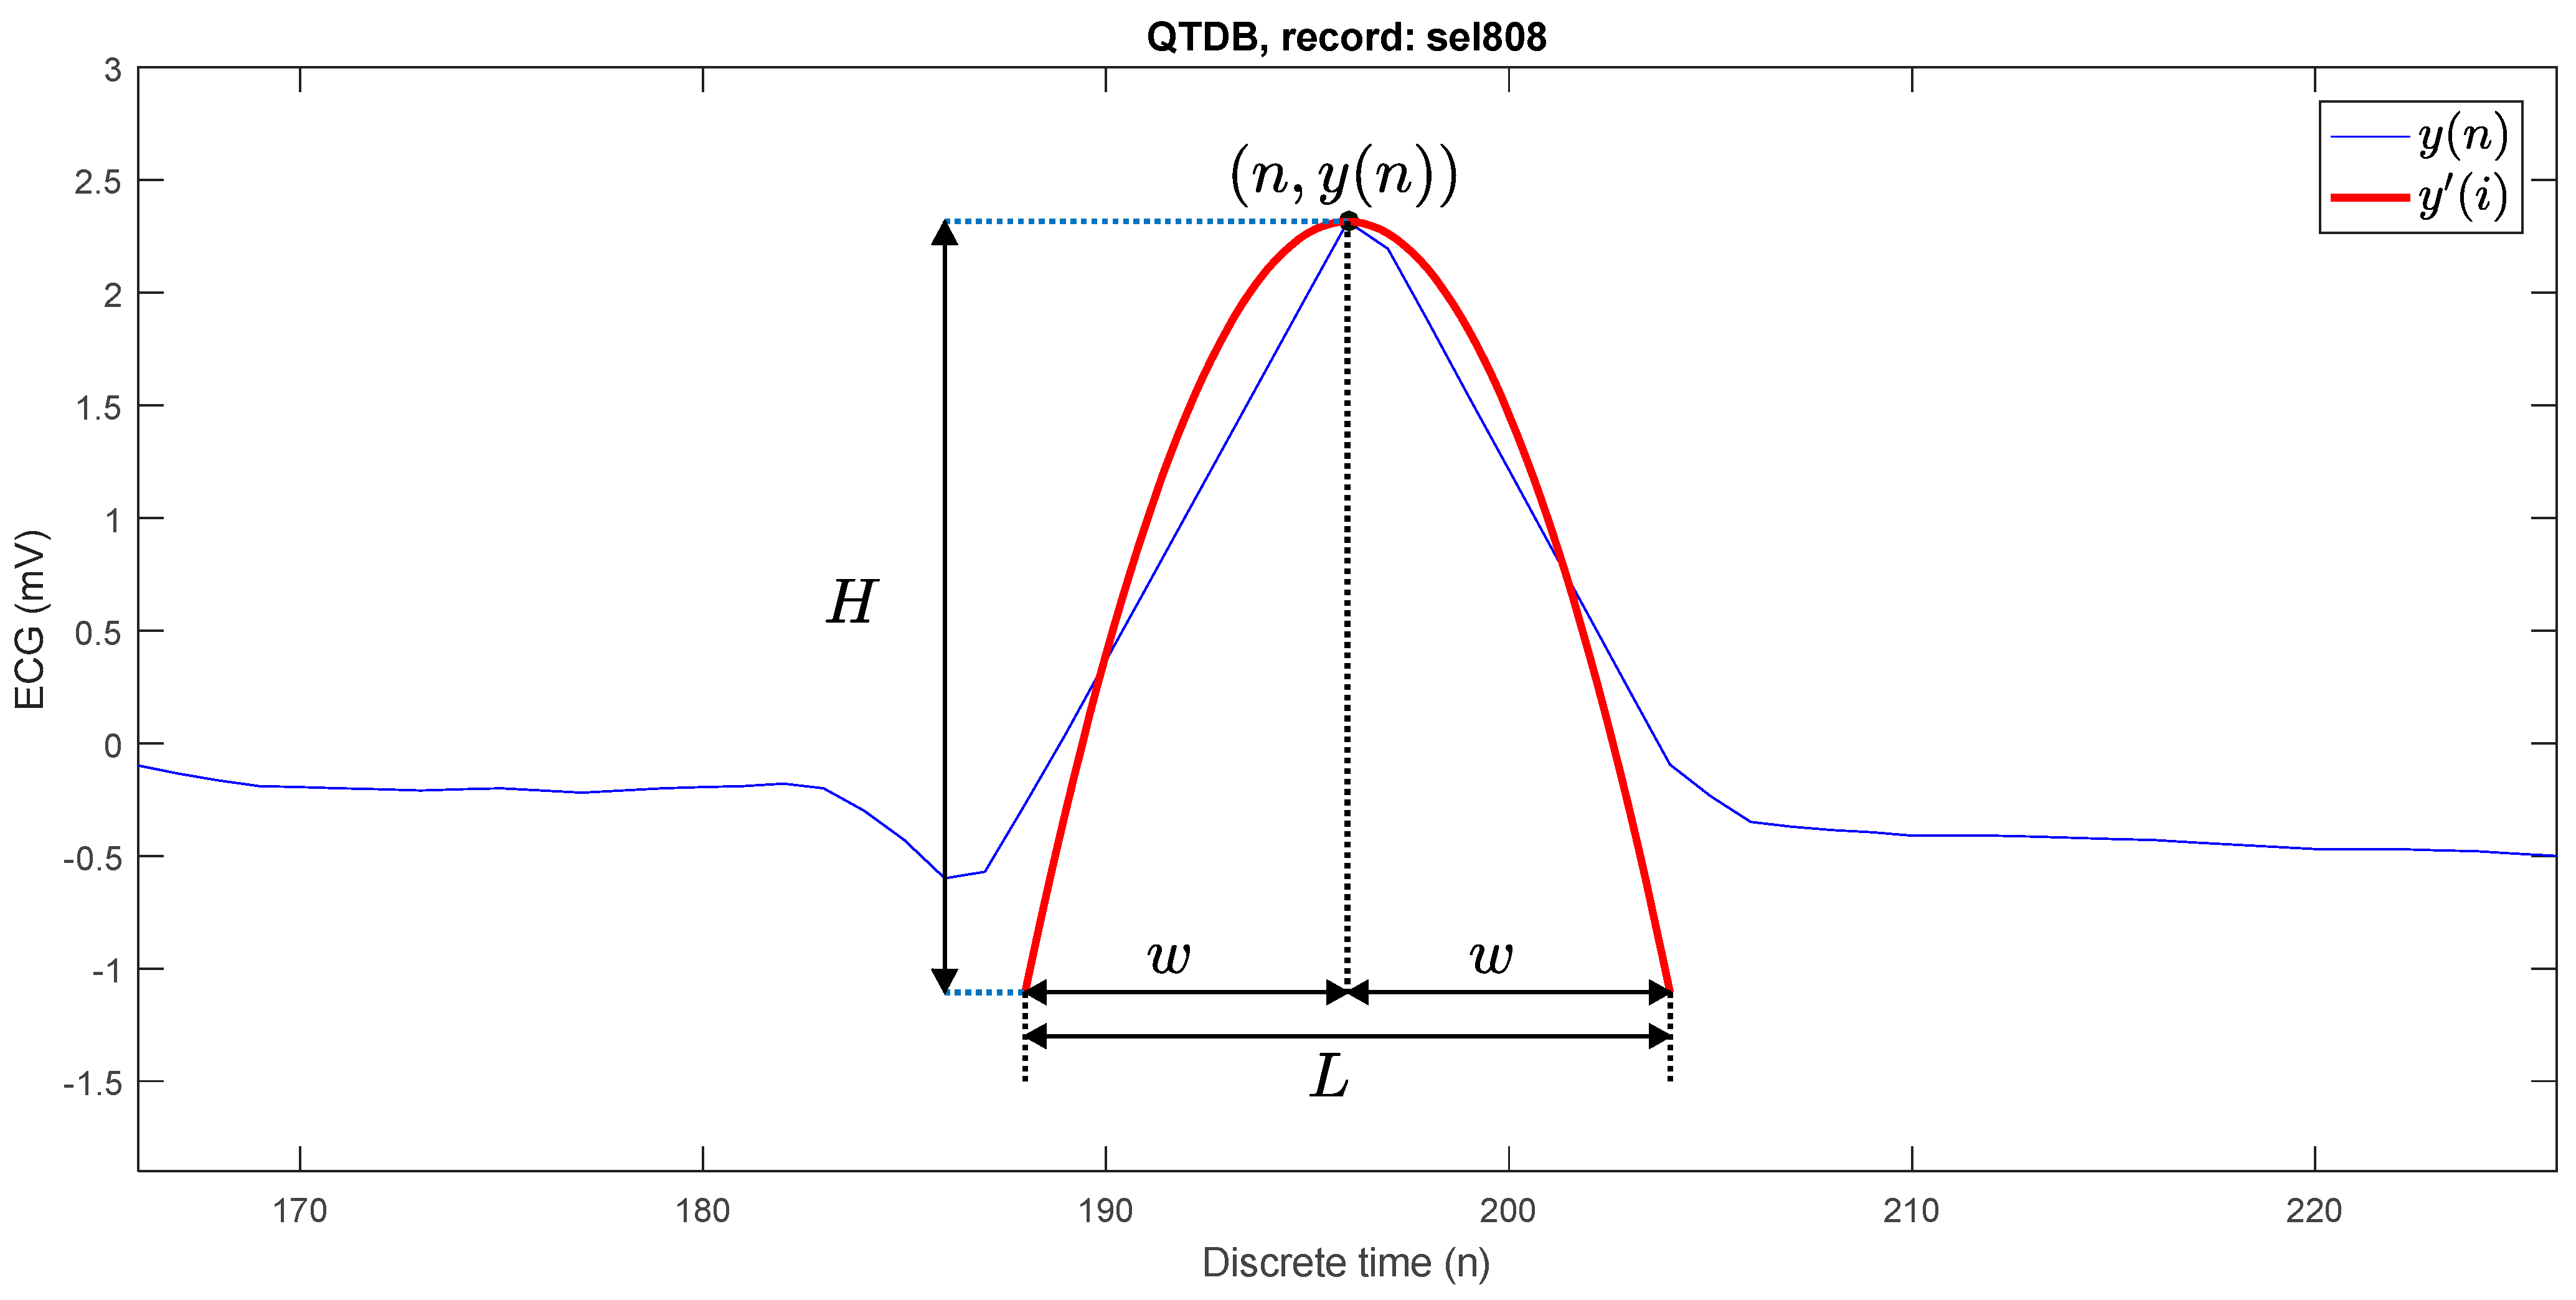
Figure 1 shows the parabolic approximation at an R peak.
For each point
of the ECG signal, the best fitting parabola has the following form:
where
,
y(
n) is the original ECG signal,
a(
n −
i)
2 is the parabola, and
y′(
n) is the adjustment of the signal ECG with the fitting parabola.
This adjustment in the equation allows us to extract from a neighborhood of values the representative values that can be adjusted to a maximum or minimum value in the analysis window, allowing us to improve detection and ensure that detection is successful. The length of a window is
The polynomial coefficient a is calculated by minimizing the following quadratic error criterion:
The first derivative of
is computed as
The error
, therefore
To minimize the criterion of Equation (4), the following equation must be solved:
Solving (10) for
, it yields
Given that
is constant for any
and
Equation (13) is simplified
Calculation for the coefficient at each sample of the ECG signal requires additions and 2 multiplications, which makes this algorithm more suitable for implementation on low-cost microprocessors. On the other hand, if is negative, it indicates that the peak is upward, and if positive, the peak is downward. The parabola defined with the optimal parameter of Equation (16) is called the best-fit parabola.
The parabolic height (
) is defined as the absolute of the difference between the highest point and the lowest point of the best-fit parabola, which is computed as shown in (17) and this value
H is used to detect the R peaks:
Figure 2 shows four parabolic approximations at different discrete time instants:
,
,
and
. In the first case
, it is easy to see that there is no peak. In the second case, the P wave is present with
. In the third case, it does correspond to an R peak with
. In the fourth case it is
even though the peak is downward. The natural strategy is to propose a threshold
, such that if
, then at time
there is an R peak. In each of the analysis windows, a value of
H was obtained, where this coincides with the maximum value in height, and in the last point, it was established as a minimum value.
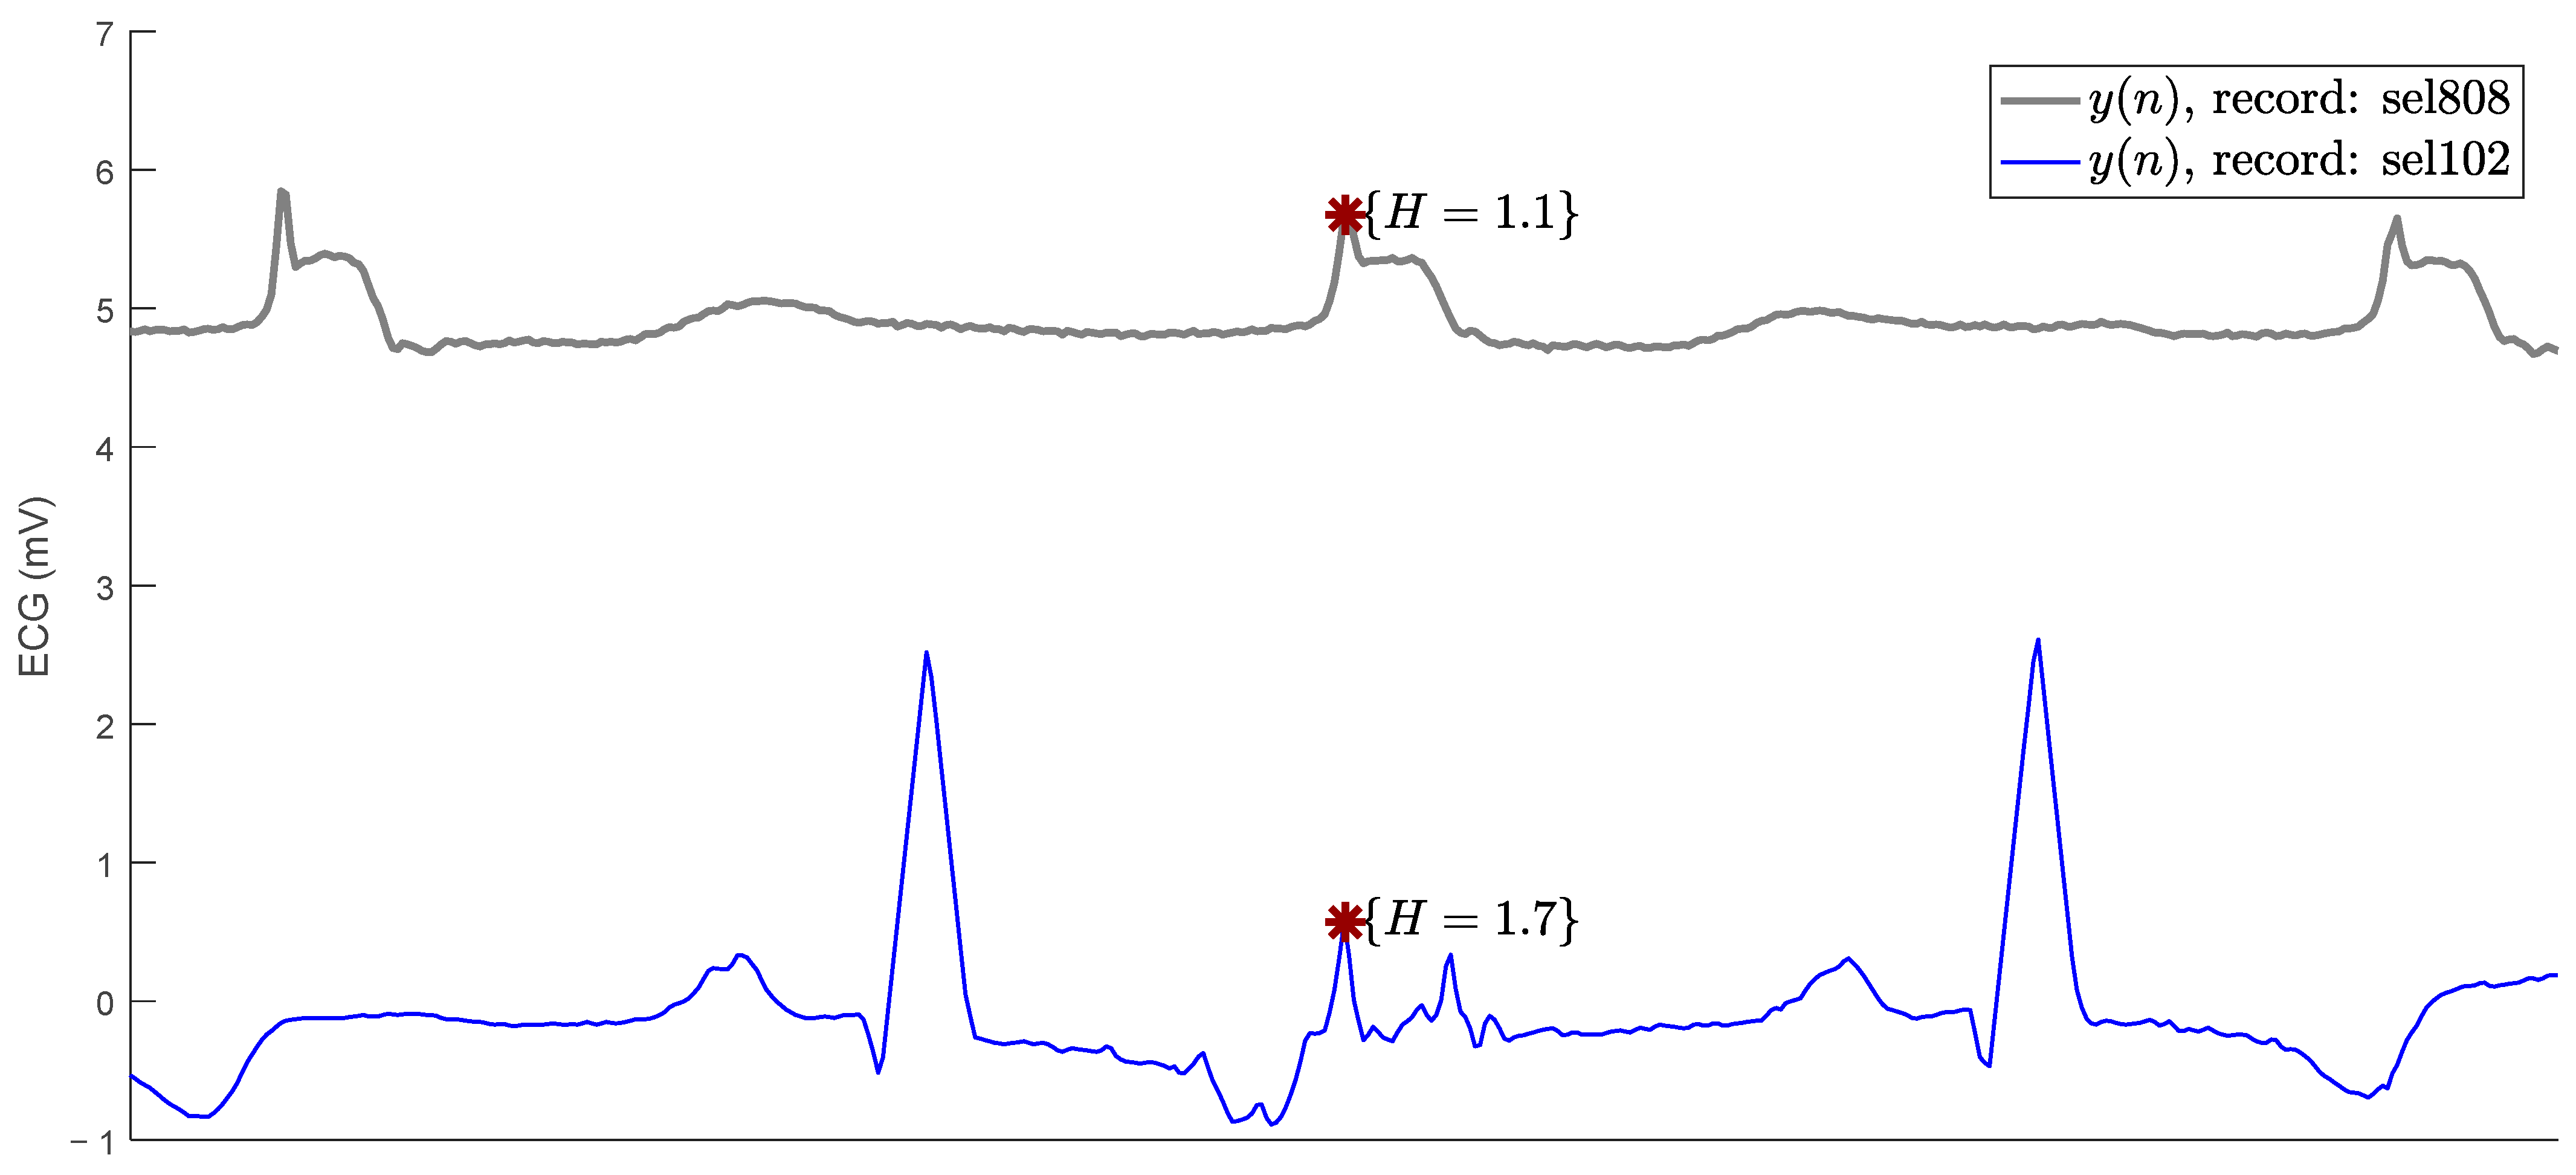
Figure 3 shows one of the biggest problems faced by R-peak detection algorithms in ECG signals. The figure shows an R peak in the sel808 recording and a noise peak in the sel102 recording. Both signals, from the QT database, have different isoelectric lines. The R peak has a parabolic height of
and the false peak is higher with
. Under the threshold strategy of
, the false peak would result in a false positive and the R peak would result in a false negative. The need arises for
to be variable, depending on the typical amplitude of the R peaks in the signal.
4. Fast Parabolic Fitting Algorithm R Peak for Detection
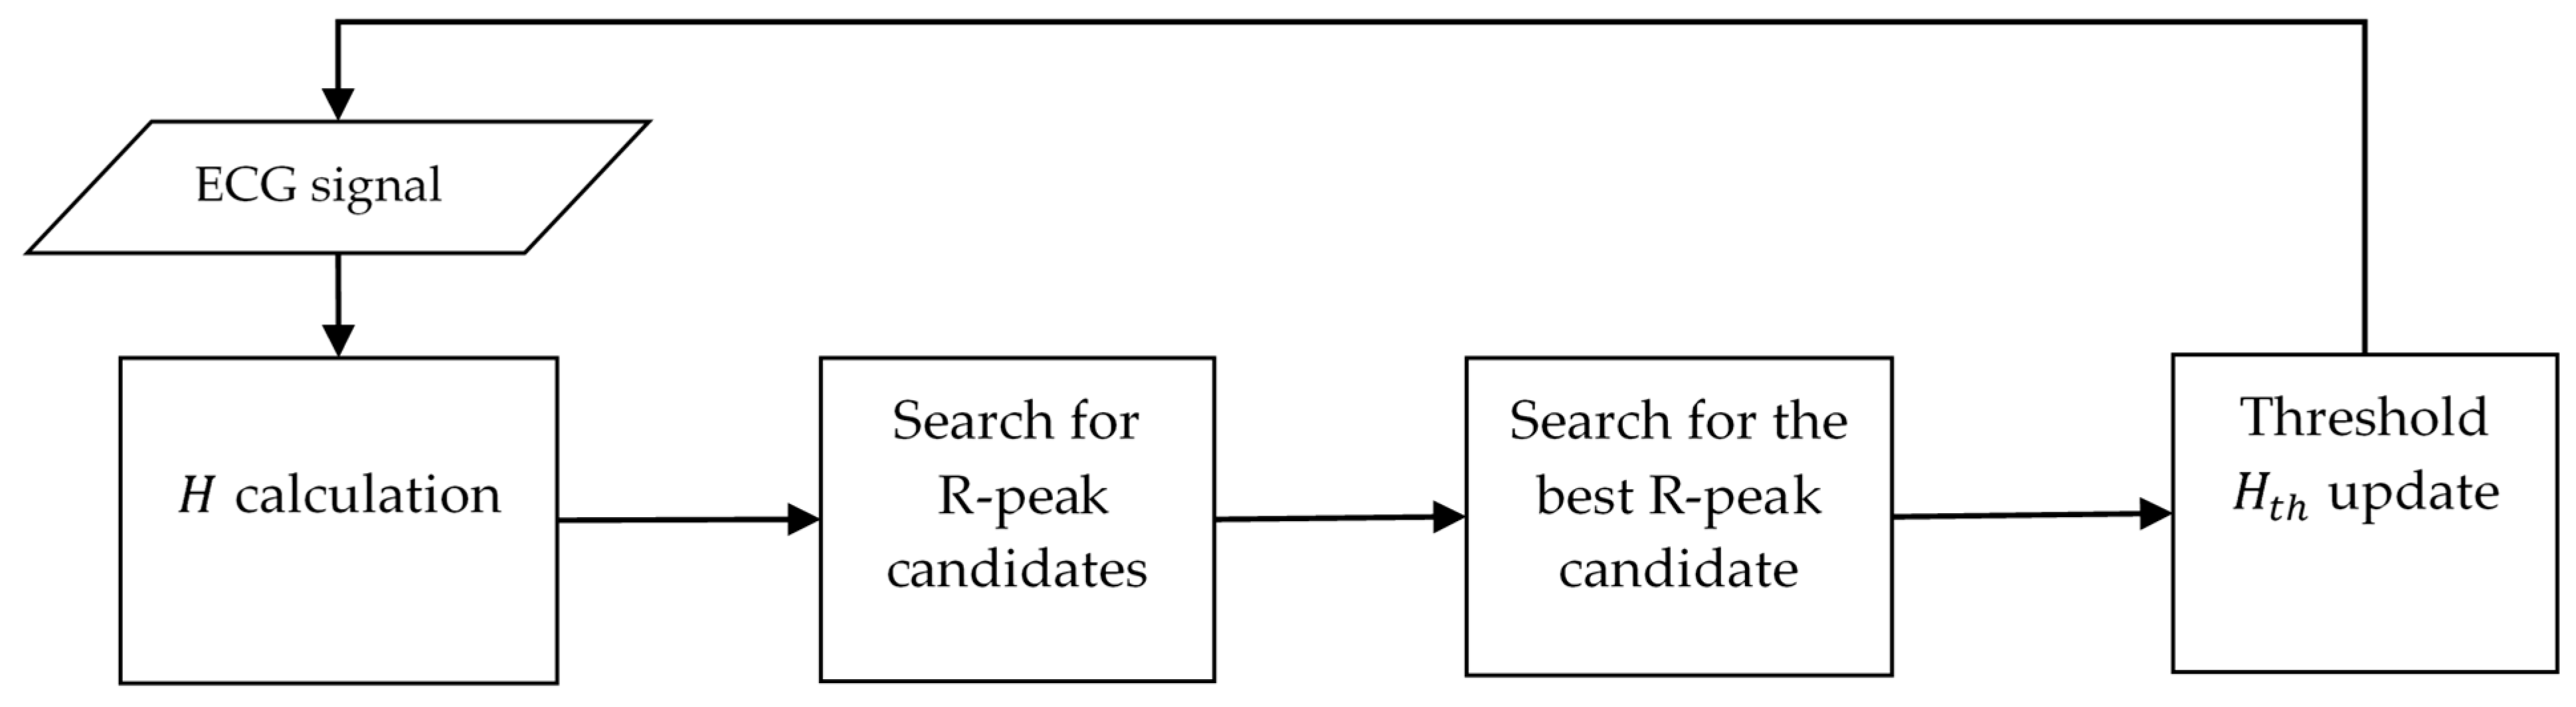
In general, the algorithm consists of four processes:
calculation for each sample, searching for R peak candidates, searching for the best candidate for R peak, and adaptation of the parabolic height threshold (
), see
Figure 4.
Each ECG signal sample has its parabolic height () calculated, and if , then that time is defined as an R-peak candidate. If a candidate has been the best candidate for a certain time, it is recorded as an R peak, then the threshold is updated.
The search for the best candidate starts when the first candidate is found and ends when a discrete time elapses without the best candidate being replaced. For an ECG signal point to be detected as an R peak, it must first be detected to pass as a candidate, then as a best candidate, and remain as such for samples. If a signal R peak does not pass any of these three stages, it will be discarded, which will cause the number of false positives to increase.
For instance, with a threshold of
,
Figure 5 shows five candidates at times:
,
,
,
,
. At time
, the search for the best candidate ends, and it is designated that at
there is an R peak.
In ECG signals, there is a large variability in the amplitude of R peaks; therefore, it is not possible to select a fixed value for . If the threshold is quite large, more points with low parabolic height will qualify as candidates and it becomes more likely that the number of false positives will increase. Conversely, if the threshold is quite small, a true R peak with parabolic height less than the threshold will not qualify as a candidate, thus increasing the number of false negatives. Therefore, the way the threshold is adapted is crucial for the performance of the algorithm.
The threshold is adapted using a weighted arithmetic mean of the parabolic heights of the last detected R peaks.
4.1. Pseudo Codes for the Proposed R-Peak Detection Algorithm
The proposed algorithm is described, in detail, by means of pseudo code in Algorithm 1. A discrete time window of width
moves along the ECG signal. At each time
, the parabolic height
of the signal is calculated. When the height
is greater than a threshold
, at time
there is an R-peak candidate. Once the first candidate is detected, the algorithm searches for the best candidate in a variable interval, called the candidate interval. The candidate search ends after a time
, when no other best candidate has been found. Similarly, the threshold value
is updated, by means of an average of the heights of the last
R peaks that have been detected. With this strategy, the threshold is adapted to the parabolic heights of the R peaks of the various ECG signals. This average is weighted by the constant parameter
. If a time
elapses without finding a new candidate after the last R peak was found, then the value of
is reduced by adding the minimum value
, as if an R peak with parabolic height
had been found and then averaged. This process is repeated every
that no new R peak is found.
is the last discrete time that an R peak should be detected, but it was not. The last part of the algorithm comprises the guarantee that
.
| Algorithm 1: Pseudo code for the R-peak detection proposed method |
| A window is moved along the signal | for |
| is calculated at | |
| H is calculated at | |
| Check for a new candidate at | if (H) |
| Flag for a found candidate | true |
| Check if the new candidate is the best one | if (H) |
| Update the new best candidate location | |
| Update the new best candidate height | |
| | end |
| | end |
| Check for ending the peak search | if and candidateFound==true) |
| For restarting a new peak search | false |
| A new R peak is registered | |
| update for new R peak | M_mean) |
| For checking the absence of new R peaks | |
| | end |
| Check for absence of new R peaks | if () |
| decreasing for finding new R peaks | M_mean) |
| For checking the absence of new R peaks | |
| | end |
| saturation) |
Algorithm 2 describes the pseudo code to calculate the average of the last M P peaks detected by the algorithm. This function is also used to decrement the
threshold when there are no new R peaks.
| Algorithm 2: Pseudo code for the M_mean function |
| | M_mean(H) |
| Shifting the last M R-peak heights | |
| | |
| | |
| | |
| Mean of R-peak heights | |
| | return |
Algorithm 3 shows the pseudo code for limiting the
threshold value.
| Algorithm 3: Pseudo code for the saturation function |
| | saturation() |
| if ) |
| | |
| | else if ) |
| | |
| | else |
| | return h |
The proposed algorithm has only eight numerical parameters: , , , , , , , and , that must be updated according to the different databases where it is tested.
4.2. Analysis of Computational Complexity
The proposed algorithm was implemented on a desktop computer in MATLAB language. However, for the implementation of the algorithm in wearable devices, it is necessary to program low-power microcontrollers or programmable logic devices such as FPGA. One way to compare the computational complexity of algorithms is very common to use the number of registers and operations of addition, multiplication, and comparison. Compared to some of the more advanced portable implementations (see
Table 1), the proposed algorithm is competitive. The number of resources is similar or lower than the alternative proposals.
5. Results
5.1. Detection Results for the QT Database
The proposed algorithm was implemented in MATLAB. The numerical values of the parameters were defined by performing an exhaustive search.
Table 2 shows the values that gave the best performance of the algorithm for the QT database.
Table 3 presents the performance of the proposed algorithm for the QT database. The detection error (DER) is 0.17%, the sensitivity (S) is 99.9%, and the positive predictability (P) is 99.88%. It is noteworthy that a total of 47 (57.3%) records had a DER of 0%, i.e., without any false negative or false positive. The values shown in
Table 3 were calculated considering the entire dataset and no result was minimized.
The algorithm performs well on most records and its maximum DER is less than 1%, except for four records: sel308, sel847, sel15814, and sele0129. The false negative type is mostly due to the R peak being wider and lower than most of the R peaks, as is the case for the false positive present in
Figure 6.
On the other hand, false positives are mainly due to high-frequency noise, as shown in
Figure 7. This phenomenon could be reduced by using band-pass filtering, but it would increase the computational complexity of the algorithm. Despite this, the results are still very satisfactory for the QT database with respect to other algorithms published in the literature.
A comparison of the performance of the proposed algorithm with other algorithms is shown in
Table 4. The proposed algorithm is superior to the others, except in positive predictability (P) by the algorithm of Pandit et al. [
12].
5.2. Detection Results for the BIH-MIT Database
The sampling frequency in the BIH-MIT database is 360 Hz, and in the QT database, it is 250 Hz. This difference necessitates a readjustment of the algorithm parameters. Unfortunately, at this stage of the research, it was not possible to develop a methodology to readjust the parameters considering only the change in the sampling period; therefore, it was necessary to conduct the readjustment using brute force. This is because the BIH-MIT database has some records with higher levels of low frequency. In such records, false peaks are very similar to real ones, but closer to each other, which demanded a higher value for the parameter
, and consequently, other parameters are needed to be readjusted.
Table 5 shows the parameters of the proposed algorithm rescaled for the BIH-MIT database.
Table 6 presents the performance of the proposed algorithm against all records. The mean value of sensitivity (S) is 99.65%, the mean value of positive predictability (P) is 99.63%, and the mean value of error deviation (DER) is 0.67%. The algorithm works with acceptable efficiency, except for the following records: 108, 201, 203, 207, and 210, where it yields some false positives and negatives due to the high level of noise contained in these records.
The proposed algorithm is comparable with some outstanding ones in the literature for R-peak detection, as shown in
Table 7, where the comparison of the proposed algorithm is shown.
5.3. Evaluating the Robustness to Noise of R-Peak Detection Algorithm
In the MIT-BIH arrhythmia database, there are many records, such as 121, 202, 200, 200, 217, 105, and 108, which are greatly affected by noise, including baseline drift and muscle noise. These records were used to evaluate noise robustness in some previous work [
5,
24].
Table 8 shows comparisons of the DER values of the proposed method with the other ten studies. The DER value of the proposed algorithm is comparable to that of previous works on the same records, which are heavily contaminated by noise.
In Bae [
10], R-peak detection is tested in the presence of white noise. To records 102 and 105, Gaussian white noise is added to the ECG signal, for a signal-to-noise ratio (SNR) between 0.5 dB and 80 dB, and then the R-peak detection algorithm is applied. Record 102 is chosen because it is a relatively clean noise signal and record 105 is just the opposite. In this work, a comparison is made with the results from [
10]. Gaussian white noise is added to the ECG signal with a certain signal-to-noise ratio according to the power of the ECG signal by means of the MATLAB command: y = awgn(y,SNR,‘measured’), where y is the ECG signal.
Table 9 shows the results for record 102. The sensitivity (S) starts to degrade from SNR = 60 dB with the algorithm of [
10] and with the proposed algorithm, the degradation starts at SNR = 5 dB. As for the positive predictability (P), the results of [
10] start to degrade at SNR = 40 dB and that of this work at SNR = 5 dB.
For a noisier record, 105,
Table 10 shows that the sensitivity results of [
10] degrade at SNR = 60 dB and at 20 dB for the proposed algorithm; in positive predictability, the results start to degrade at SNR = 40 dB in [
10] and at 20 dB for this algorithm. In both tables, it is demonstrated that the proposed algorithm resists more noise before the performance indices start to degrade. It can also be observed that the proposed algorithm is more robust under the influence of noise.
6. Discussion
The proposed method utilizes single-parameter parabolic fitting, at each ECG sample, to extract a feature known as parabolic height. This feature detects partial P peaks, or candidates, by comparing them with a parabolic height threshold. Then, the best candidates are designated as R points of the ECG signal. Adapting such threshold to different ECG signal amplitudes is critical to the proposed method.
The algorithm designed for wearable devices requires low computational resources, because it does not need calculating and estimating the isoelectric line of the ECG signal, nor any prior filtering. The computational complexity of algorithms is persistent in using the number of registers and operations of addition, multiplication, and comparison. Compared to some of the more advanced portable implementations [
5,
13,
15,
21,
22,
23], the proposed algorithm is competitive.
The results derived from the application of the proposed algorithm to the QT database reveal that the performance of this algorithm is slightly superior with the state-of-the-art algorithms specialized in wearable devices [
5,
12,
13] and demonstrate considerable competence, even in comparison with complex algorithms not specialized in wearable devices [
3,
8,
9]. False negatives are primarily due to the R peak being broader and lower than most R peaks. False positives are mainly due to high-frequency noise.
We observe more modest results when evaluating the algorithm’s performance for the BIH-MIT database. The algorithm works with acceptable efficiency, except for the five most noisy records, where it yields many false positives and negatives due to the high noise level in these records. Nevertheless, considering that the ECG signals were recorded before 1989 [
19] using older technology, a modern ECG signal acquired with current technology could be quieter than the mentioned records.
We perform two distinct types of analysis to assess the algorithm’s resilience against noise interference. First, we compare DER with other algorithms using six records that are notably susceptible to various forms of noise, including baseline drift and muscle noise. As employed in previous studies [
5,
24], these records serve as a standard for evaluating noise robustness.
Second, we subject R-peak detection to a rigorous test for the presence of white noise. To evidence the benefit of the proposed algorithm, Gaussian white noise is intentionally introduced to the ECG signal, with a specific signal-to-noise ratio determined by the characteristics of records 102 and 105, each with varying SNR levels. We then apply the R-peak detection algorithm to these modified signals. The results demonstrate that our proposed algorithm maintains its effectiveness in the presence of higher noise levels in both records before experiencing performance degradation. Furthermore, it is noteworthy that our proposed algorithm exhibits superior robustness when compared to the outcomes obtained in [
10] under similar noisy conditions.
An area of opportunity that was detected in this work is that in most R-peak detectors, it is necessary to adjust the algorithm parameters to a different level. This can be resolved by establishing metaheuristic optimization strategies [
31,
32], which can be addressed in future work to adjust the algorithm parameters for different databases.
Author Contributions
Conceptualization, R.A.F., A.O.-B. and W.M.-L.; methodology, R.A.F., A.O.-B., W.M.-L. and L.J.M.; validation, R.A.F., R.M.-P. and W.M.-L.; investigation, R.A.F., L.J.M. and L.L.V.-V.; writing—original draft preparation, R.A.F., A.O.-B. and W.M.-L.; writing—review and editing, R.M.-P., R.A.F. and L.J.M. All authors have read and agreed to the published version of the manuscript.
Funding
This research received no external funding.
Institutional Review Board Statement
Not Applicable.
Informed Consent Statement
Not applicable.
Data Availability Statement
Not applicable.
Conflicts of Interest
The authors declare no conflict of interest.
References
- Aspuru, J.; Ochoa-Brust, A.; Felix, R.A.; Mata-López, W.; Mena, L.J.; Ostos, R.; Martínez-Peláez, R. Segmentation of the ECG Signal by Means of a Linear Regression Algorithm. Sensors 2019, 19, 775. [Google Scholar] [CrossRef] [PubMed]
- Celin, S.; Vasanth, K. A Novel Method for ECG Classification Using Polynomial Based Curve Fitting. In Proceedings of the IEEE International Conference on Electrical, Computer and Communication Technologies, Coimbatore, India, 20–22 February 2019. [Google Scholar]
- Pan, J.; Tompkins, W.J. A Real-Time QRS Detection Algorithm. IEEE Trans. Biomed. Eng. 1985, 32, 230–236. [Google Scholar] [CrossRef] [PubMed]
- Sabherwal, P.; Agrawal, M.; Singh, L. Automatic Detection of the R Peaks in Single-Lead ECG Signal. Circuits Syst. Signal Process. 2017, 36, 4637–4652. [Google Scholar] [CrossRef]
- Nguyen, T.; Qin, X.; Dinh, A.; Bui, F. Low Resource Complexity R-peak Detection Based on Triangle Template Matching and Moving Average Filter. Sensors 2019, 19, 3997. [Google Scholar] [CrossRef] [PubMed]
- Merino, M.; Gómez, I.; Molina, A. Envelopment filter and K-means for the detection of QRS wave forms in electrocardiogram. Med. Eng. Phys. 2015, 37, 605–609. [Google Scholar] [CrossRef] [PubMed]
- Phukpattaranont, P. QRS detection algorithm based on the quadratic filter. Expert Syst. Appl. 2015, 42, 4867–4877. [Google Scholar] [CrossRef]
- Johnson, A.E.W.; Behar, J.; Andreotti, F.; Clifford, G.D.; Oster, J. Multimodal heart beat detection using signal quality indices. Physiol. Meas. 2015, 36, 1665–1677. [Google Scholar] [CrossRef]
- Martinez, J.P.; Almeida, R.; Olmos, S.; Rocha, A.P.; Laguna, P. A wavelet-based ECG delineator: Evaluation on standard databases. IEEE Trans. Biomed. Eng. 2004, 51, 570–581. [Google Scholar] [CrossRef]
- Bae, T.-W.; Kwon, K.-K.; Kim, K.-H. Electrocardiogram Fiducial Point Detector Using a Bilateral Filter and Symmetrical Point-Filter Structure. Int. J. Environ. Res. Public Health 2021, 18, 10792. [Google Scholar] [CrossRef]
- Dohare, A.K.; Kumar, V.; Ritesh, K. An efficient new method for the detection of QRS in electrocardiogram. Comput. Electr. Eng. 2014, 40, 1717–1730. [Google Scholar] [CrossRef]
- Pandit, D.; Zhang, L.; Liu, C.; Chattopadhyay, S.; Aslam, N.; Lim, C.P. A lightweight QRS detector for single lead ECG signals using a max-min difference algorithm. Comput. Methods Programs Biomed. 2017, 144, 61–75. [Google Scholar] [CrossRef] [PubMed]
- Elgendi, M. Fast QRS detection with an optimized knowledge-based method: Evaluation on 11 standard ECG databases. PLoS ONE 2013, 8, e73557. [Google Scholar] [CrossRef] [PubMed]
- Kim, J.; Shin, H. Simple and Robust Realtime QRS Detection Algorithm Based on Spatiotemporal Characteristic of the QRS Complex. PLoS ONE 2016, 11, e0150144. [Google Scholar] [CrossRef] [PubMed]
- Castells-Rufas, D.; Carrabina, J. Simple real-time QRS detector with the MaMeMi filter. Biomed. Signal Process. Control 2015, 21, 137–145. [Google Scholar] [CrossRef]
- Lee, W.; Yoon, H.; Park, K. Smart ECG Monitoring Patch with Built-in R-Peak Detection for Long-Term HRV Analysis. Ann. Biomed. Eng. 2016, 44, 2292–2301. [Google Scholar] [CrossRef] [PubMed]
- Illanes Manriquez, A.; Zhang, Q. An algorithm for QRS onset and offset detection in single lead electrocardiogram records. In Proceedings of the 29th Annual International Conference of the IEEE Engineering in Medicine and Biology Society, Lyon, France, 22–26 August 2007. [Google Scholar]
- Laguna, P.; Mark, R.; Goldberg, A.; Moody, G. A Database for Evaluation of Algorithms for Measurement of QT and Other Waveform Intervals in the ECG. Comput. Cardiol. 1997, 24, 673–676. [Google Scholar]
- Goldberger, A.L.; Amaral, L.A.N.; Glass, L.; Hausdorff, J.M.; Ivanov, P.C.; Mark, R.; Mietus, J.E.; Moody, G.B.; Peng, C.-K.; Stanley, H.E. PhysioBank, PhysioToolkit, and PhysioNet: Components of a New Research Resource for Complex Physiologic Signals. Circulation 2000, 101, 215–220. [Google Scholar] [CrossRef]
- Porr, B.; Macfarlan, P.W. A new QRS detector stress test combining temporal jitter and accuracy (JA) reveals significant performance differences amongst popular detectors. bioRxiv 2023, 722397. [Google Scholar] [CrossRef]
- Wang, Y.; Deepu, C.J.; Lian, Y. A computationally efficient QRS detection algorithm for wearable ECG sensors. In Proceedings of the 2011 Annual International Conference of the IEEE Engineering in Medicine and Biology Society, Boston, MA, USA, 30 August–3 September 2011. [Google Scholar]
- Hoang, T.-T.; Son, J.-P.; Kang, Y.-R.; Kim, C.-R.; Chung, H.-Y.; Kim, S.-W. A low complexity, low power, programmable QRS detector based on wavelet transform for implantable pacemaker IC. In Proceedings of the 2006 IEEE International SOC Conference, Austin, TX, USA, 24–27 September 2006. [Google Scholar]
- Jun, T.; Park, H.; Yoo, H.; Kim, Y.; Kim, D. GPU based cloud system for high-performance arrhythmia detection with parallel k-NN algorithm. In Proceedings of the 38th Annual International Conference, Orlando, FL, USA, 16–20 August 2016. [Google Scholar]
- Bouaziz, F.; Boutana, D.; Benidir, M. Multiresolution wavelet-based QRS complex detection algorithm suited. IET Signal Process. 2014, 8, 774–782. [Google Scholar] [CrossRef]
- Zhu, H.; Dong, J. An R-peak detection method based on peaks of Shannon energy envelope. Biomed. Signal Process. Control 2013, 8, 466–474. [Google Scholar] [CrossRef]
- Choi, S.; Adnane, M.; Lee, G.; Jang, H.; Jiang, Z.; Park, H. Development of ECG beat segmentation method by combining lowpass filter and irregular RR interval checkup strategy. Expert Syst. Appl. 2010, 37, 5208–5218. [Google Scholar] [CrossRef]
- Arbateni, K.; Bennia, A. Sigmoidal radial basis function ANN for QRS complex detection. Neurocomputing 2014, 145, 438–450. [Google Scholar] [CrossRef]
- Zhang, F.; Lian, Y. QRS detection based on multi-scale mathematical morphology for wearable ECG device in body area networks. IEEE Trans. Biomed. Circuits Syst. 2009, 3, 220–228. [Google Scholar] [CrossRef]
- Yazdani, S.; Vesin, J. Extraction of QRS fiducial points from the ECG using adaptive mathematical morphology. Digit. Signal Process. 2016, 56, 100–109. [Google Scholar] [CrossRef]
- Chen, C.-L.; Chuang, C.-T. A QRS Detection and R Point Recognition Method for Wearable Single-Lead ECG Devices. Sensors 2017, 17, 1969. [Google Scholar] [CrossRef]
- Hansen, P.; Mladenović, N. Variable Neighborhood Search Methods. In Encyclopedia of Optimization; Springer: Boston, MA, USA, 2008; pp. 3975–3989. [Google Scholar]
- Mirjalili, S.; Gandomi, A.H.; Mirjalili, S.Z.; Saremi, S.; Faris, H.; Mirjalili, S.M. Salp Swarm Algorithm: A bio-inspired optimizer for engineering design problems. Adv. Eng. Softw. 2017, 144, 163–191. [Google Scholar] [CrossRef]
| Disclaimer/Publisher’s Note: The statements, opinions and data contained in all publications are solely those of the individual author(s) and contributor(s) and not of MDPI and/or the editor(s). MDPI and/or the editor(s) disclaim responsibility for any injury to people or property resulting from any ideas, methods, instructions or products referred to in the content. |
© 2023 by the authors. Licensee MDPI, Basel, Switzerland. This article is an open access article distributed under the terms and conditions of the Creative Commons Attribution (CC BY) license (https://creativecommons.org/licenses/by/4.0/).


 ,
, 


