
Mechanomyographic Analysis for Muscle Activity Assessment during a Load-Lifting Task


Abstract
:1. Introduction
2. Materials and Methods
2.1. Participants
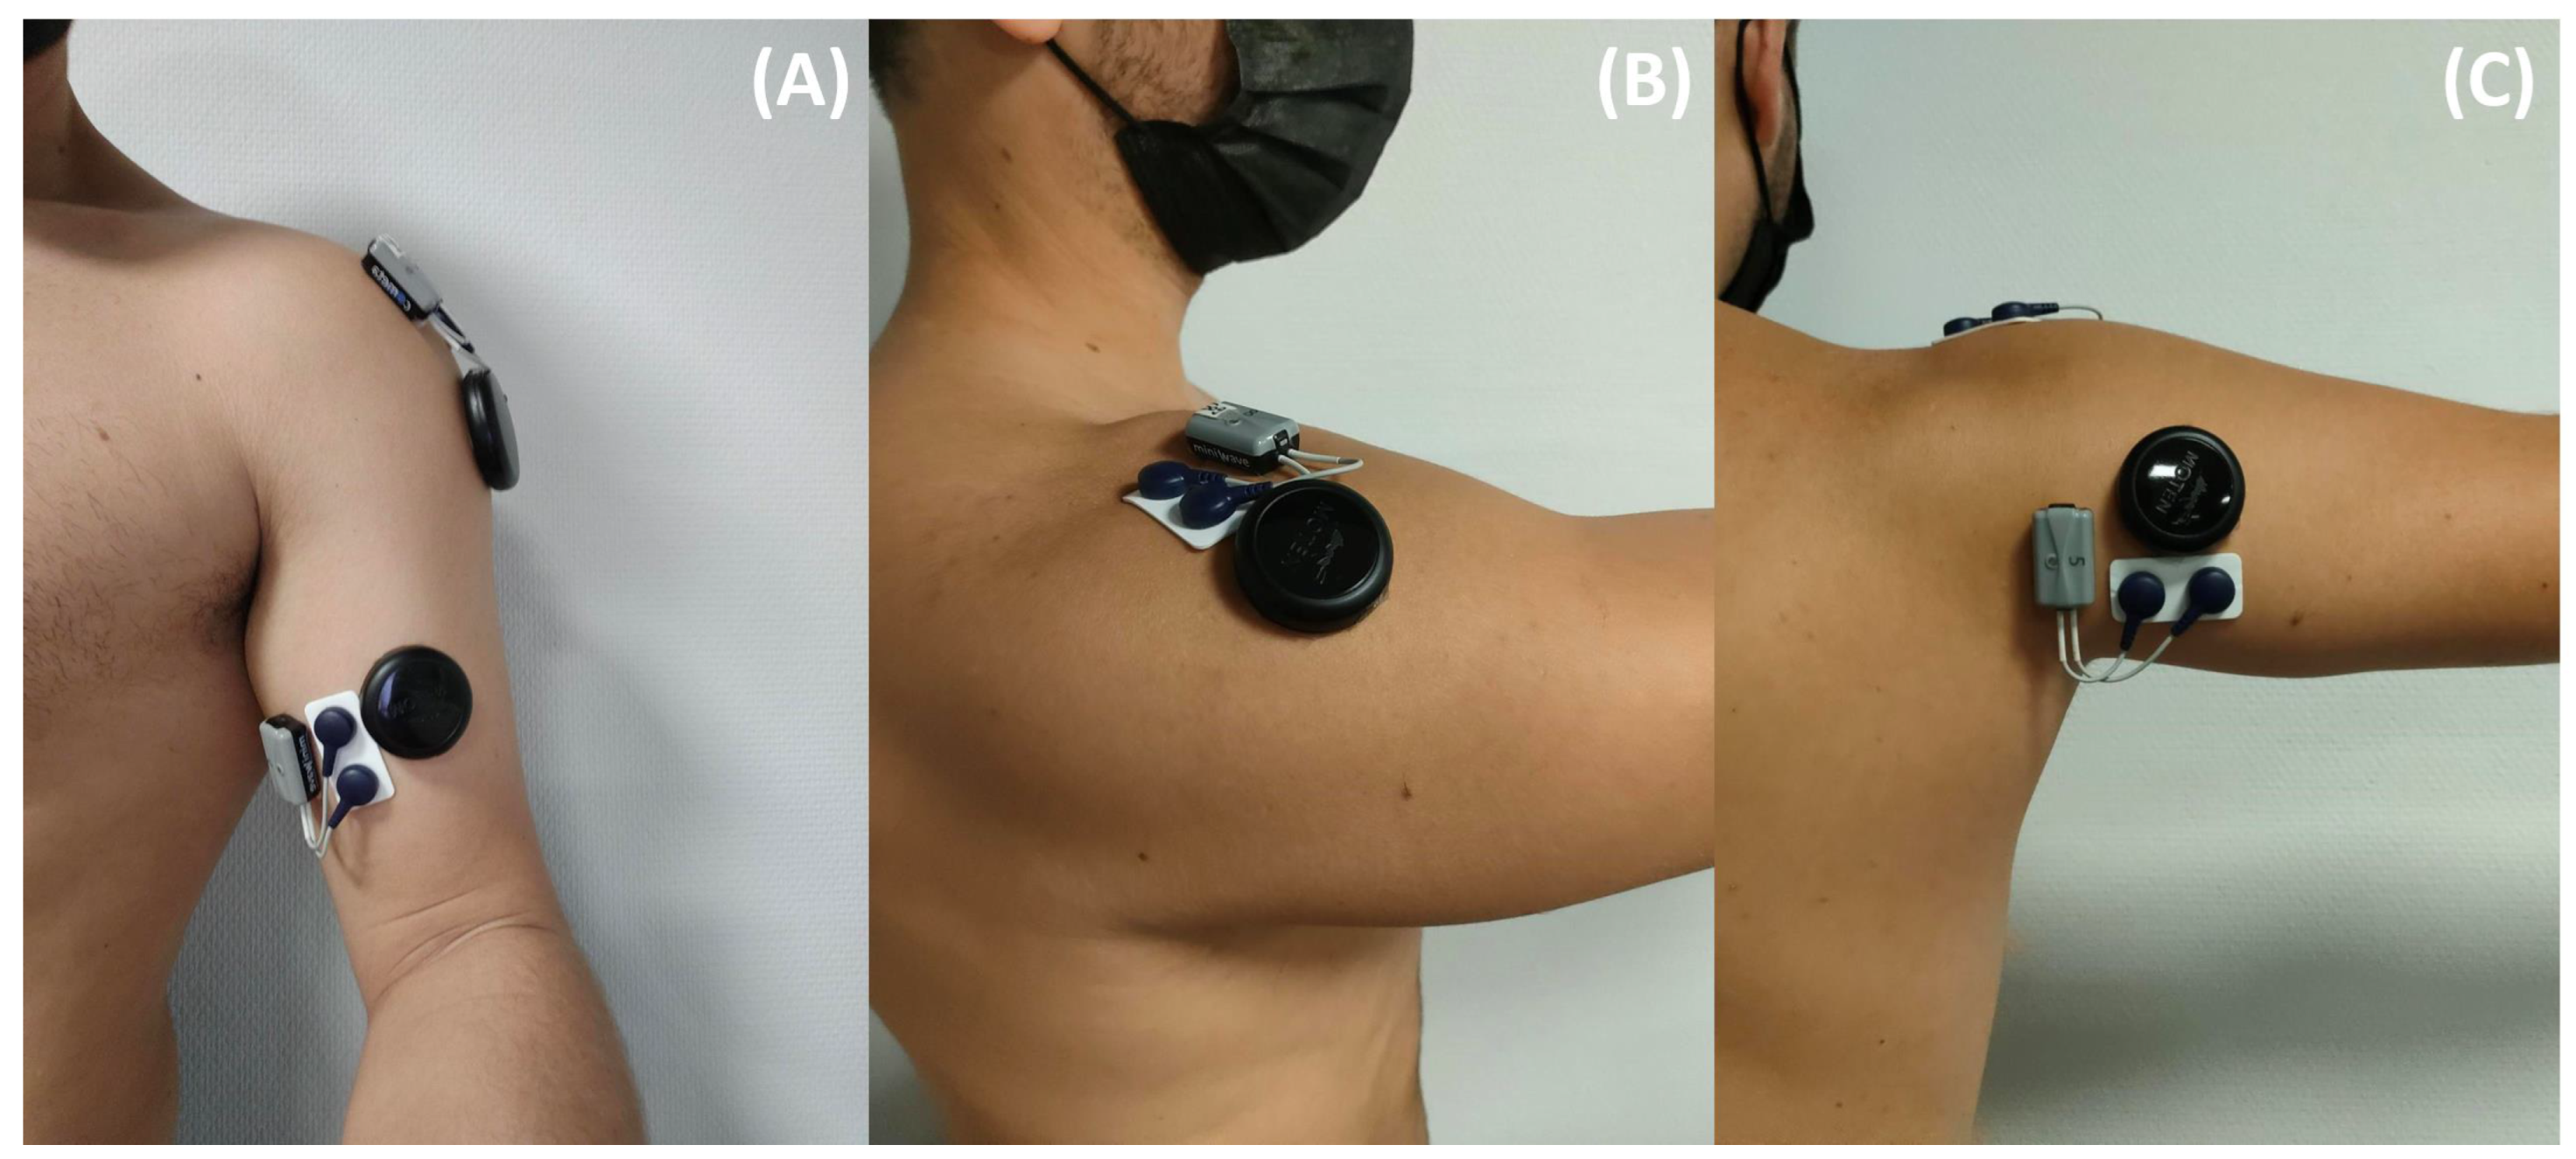
2.2. Sensors
2.3. Isometric Testing Procedure
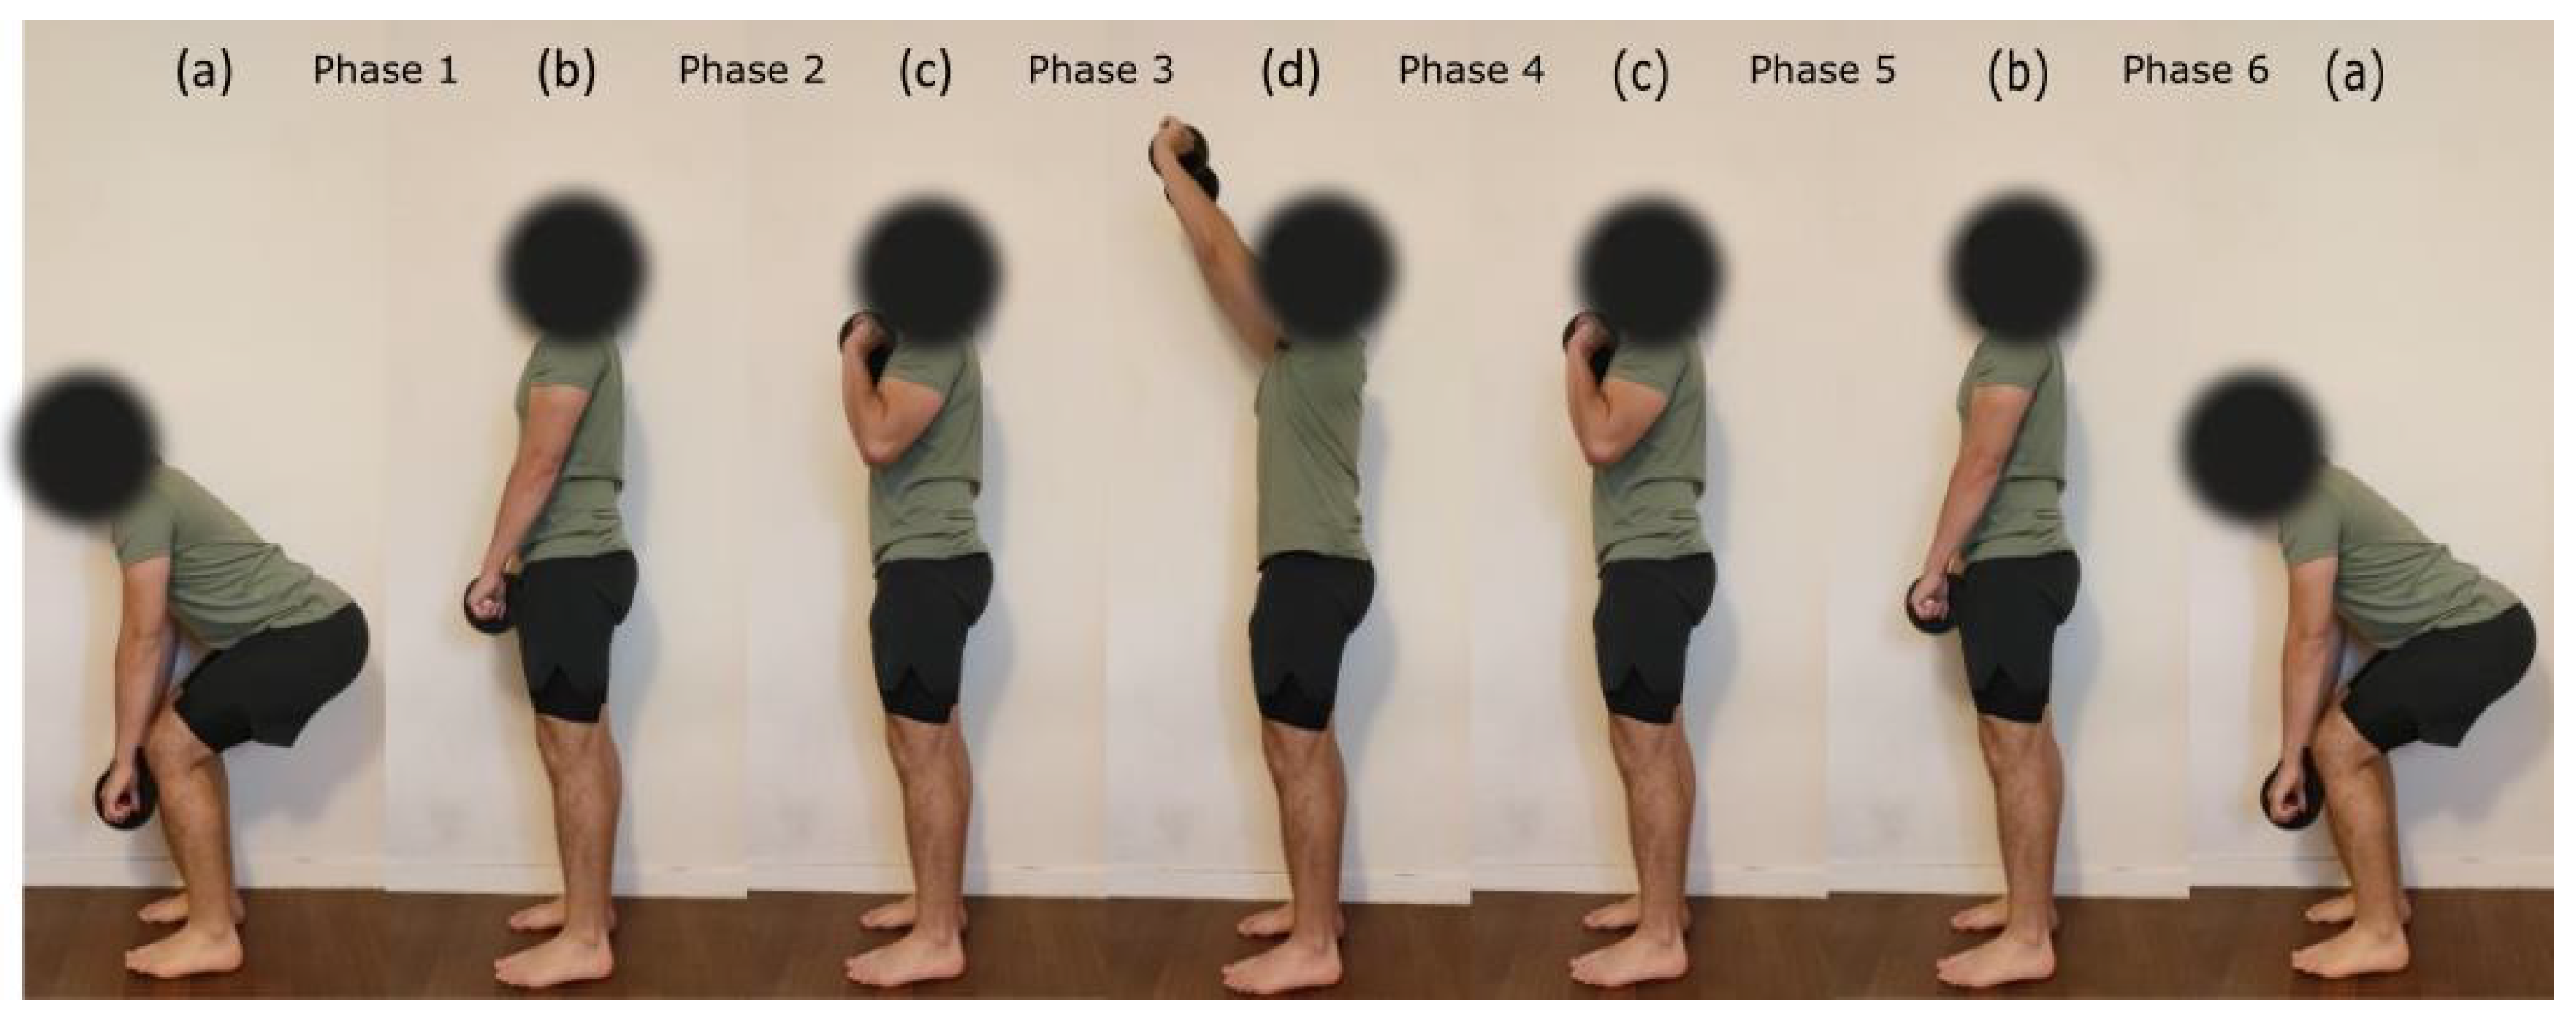
2.4. Dynamic Testing Procedure
2.5. Signal Processing
2.6. Statistical Analysis
3. Results
3.1. Isometric Testing
3.1.1. Time Domain Analysis
3.1.2. Frequency Domain Analysis
3.2. Dynamic Testing
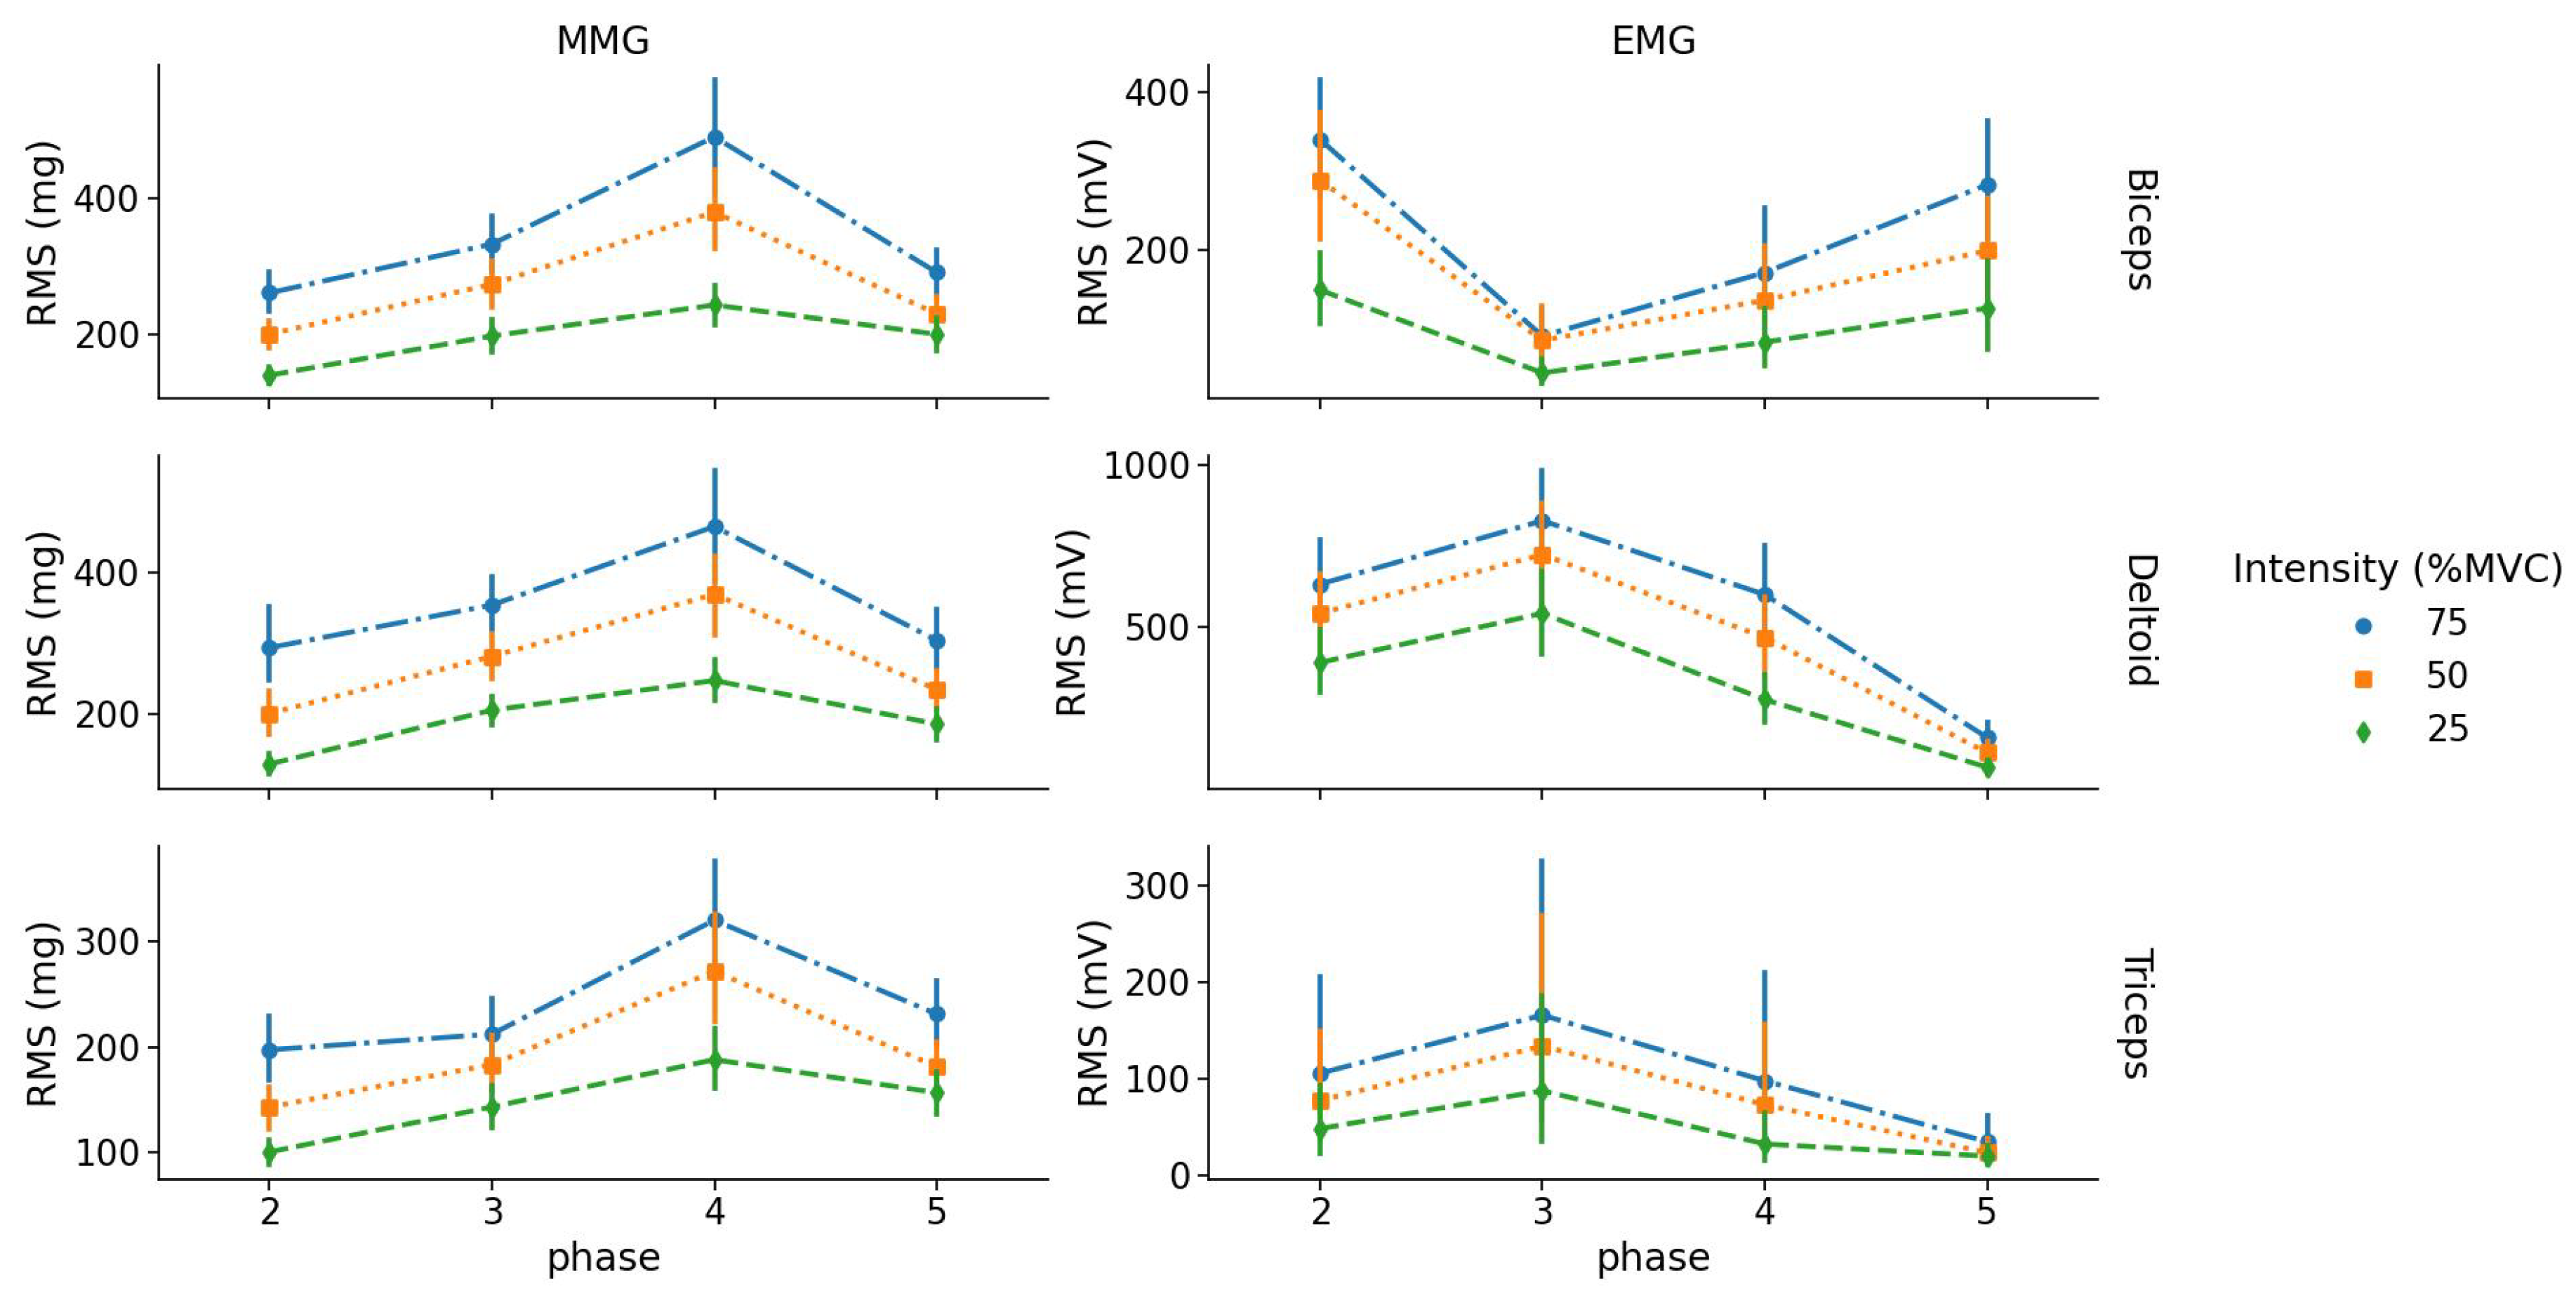
3.2.1. Time Domain Analysis
Intensity Levels
Concentric vs. Eccentric
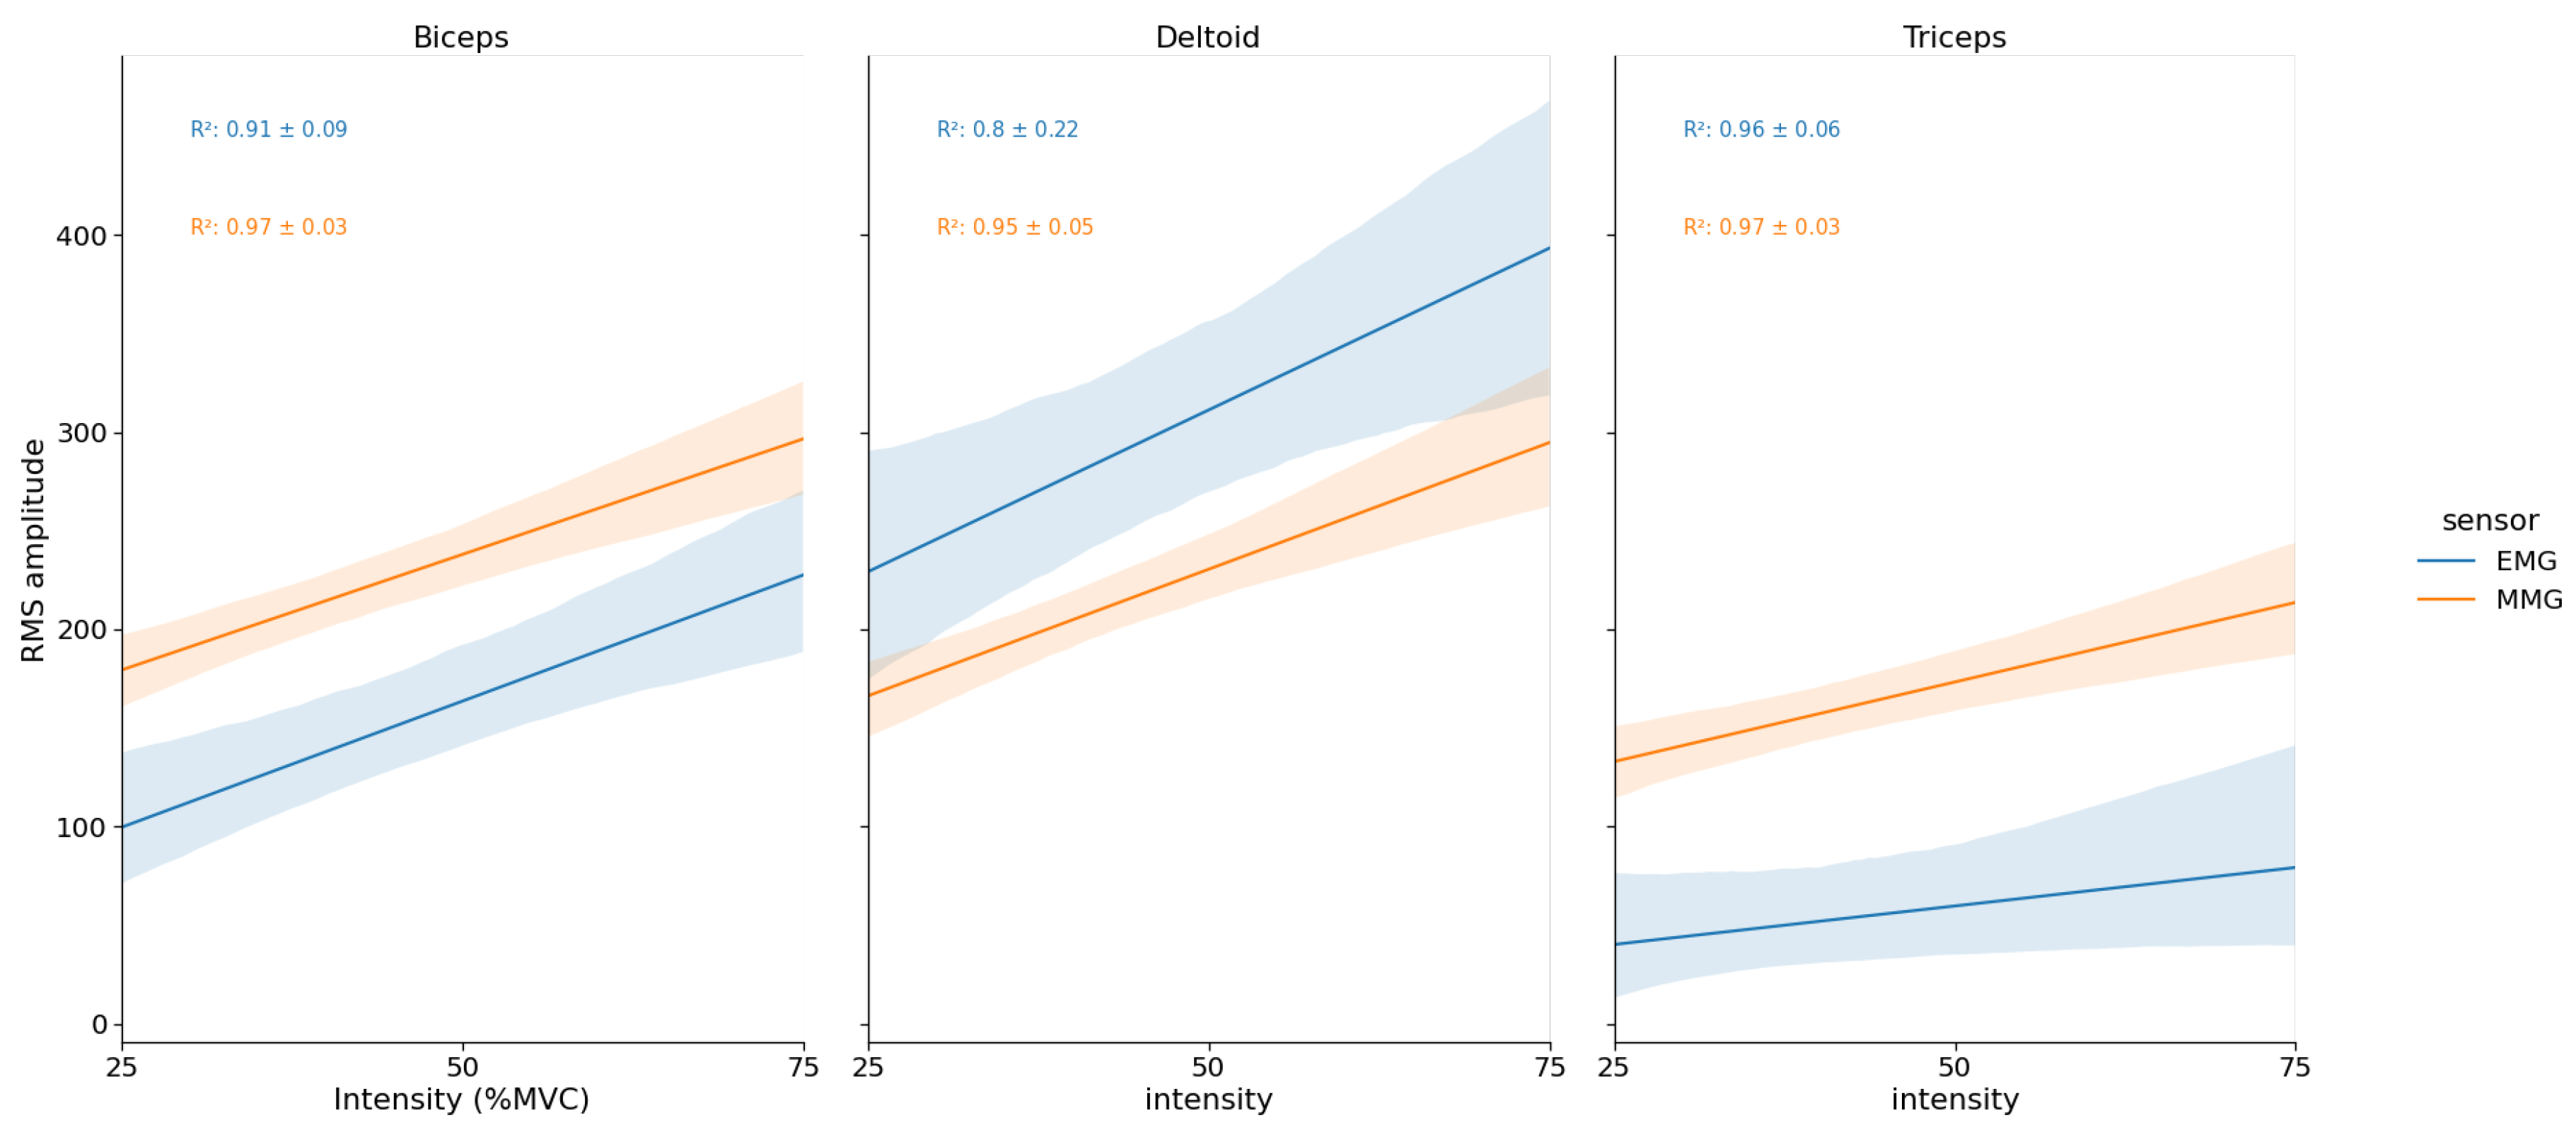
EMG and MMG RMS vs. % MVC Relationship
3.2.2. Frequency Domain Analysis
Intensity Levels
4. Discussion
4.1. Isometric Testing
4.1.1. Time Domain Analysis
4.1.2. Frequency Domain Analysis
4.2. Dynamic Testing
4.2.1. Time Domain Analysis
4.2.2. Frequency Domain Analysis
4.3. Limits
5. Conclusions
Author Contributions
Funding
Institutional Review Board Statement
Informed Consent Statement
Data Availability Statement
Acknowledgments
Conflicts of Interest
References
- Gazzoni, M.; Afsharipour, B.; Merletti, R. Surface EMG in Ergonomics and Occupational Medicine. In Surface Electromyography: Physiology, Engineering, and Applications; John Wiley & Sons, Ltd.: Hoboken, NJ, USA, 2016; pp. 361–391. [Google Scholar]
- Hermens, H.J.; Freriks, B.; Disselhorst-Klug, C.; Rau, G. Development of recommendations for SEMG sensors and sensor placement procedures. J. Electromyogr. Kinesiol. Off. J. Int. Soc. Electrophysiol. Kinesiol. 2000, 10, 361–374. [Google Scholar] [CrossRef]
- Woodward, R.B.; Stokes, M.J.; Shefelbine, S.J.; Vaidyanathan, R. Segmenting Mechanomyography Measures of Muscle Activity Phases Using Inertial Data. Sci. Rep. 2019, 9, 5569. [Google Scholar] [CrossRef]
- Laferriere, P.; Chan, A.D.C.; Lemaire, E.D. Surface electromyographic signals using a dry electrode. In Proceedings of the 2010 IEEE International Workshop on Medical Measurements and Applications, Ottawa, ON, Canada, 30 April–1 May 2010; pp. 77–80. [Google Scholar] [CrossRef]
- De Luca, C.J.; Donald Gilmore, L.; Kuznetsov, M.; Roy, S.H. Filtering the surface EMG signal: Movement artifact and baseline noise contamination. J. Biomech. 2010, 43, 1573–1579. [Google Scholar] [CrossRef]
- Farina, D. Interpretation of the surface electromyogram in dynamic contractions. Exerc. Sport Sci. Rev. 2006, 34, 121–127. [Google Scholar] [CrossRef]
- Beck, T.W.; Housh, T.J.; Johnson, G.O.; Weir, J.P.; Cramer, J.T.; Coburn, J.W.; Malek, M.H. Mechanomyographic and electromyographic time and frequency domain responses during submaximal to maximal isokinetic muscle actions of the biceps brachii. Eur. J. Appl. Physiol. 2004, 92, 352–359. [Google Scholar] [CrossRef]
- Ibitoye, M.O.; Hamzaid, N.A.; Zuniga, J.M.; Abdul Wahab, A.K. Mechanomyography and muscle function assessment: A review of current state and prospects. Clin. Biomech. 2014, 29, 691–704. [Google Scholar] [CrossRef]
- Islam, M.A.; Sundaraj, K.; Ahmad, R.B.; Ahamed, N.U.; Ali, M.A. Mechanomyography Sensor Development, Related Signal Processing, and Applications: A Systematic Review. IEEE Sens. J. 2013, 13, 2499–2516. [Google Scholar] [CrossRef]
- Posatskiy, A.O.; Chau, T. The effects of motion artifact on mechanomyography: A comparative study of microphones and accelerometers. J. Electromyogr. Kinesiol. 2012, 22, 320–324. [Google Scholar] [CrossRef]
- Wang, D.; Wu, H.; Xie, C.; Gao, L. Suppression of Motion Artifacts in Multichannel Mechanomyography Using Multivariate Empirical Mode Decomposition. IEEE Sens. J. 2019, 19, 5732–5739. [Google Scholar] [CrossRef]
- Li, Z.; Gao, L.; Lu, W.; Wang, D.; Cao, H.; Zhang, G. A Novel Noise Suppression and Artifact Removal Method of Mechanomyography Based on RLS, IGWO-VMD, and CEEMDAN. J. Sens. 2022, 2022, e4239211. [Google Scholar] [CrossRef]
- Yu, J.; Zhang, Y.; Xia, C. Study of gait pattern recognition based on fusion of mechanomyography and attitude angle signal. J. Mech. Med. Biol. 2020, 20, 1950085. [Google Scholar] [CrossRef]
- Silva, J.; Heim, W.; Chau, T. A Self-Contained, Mechanomyography-Driven Externally Powered Prosthesis. Arch. Phys. Med. Rehabil. 2005, 86, 2066–2070. [Google Scholar] [CrossRef]
- Evetovich, T.K.; Housh, T.J.; Johnson, G.O.; Smith, D.B.; Ebersole, K.T.; Perry, S.R. Gender comparisons of the mechanomyographic responses to maximal concentric and eccentric isokinetic muscle actions. Med. Sci. Sport. Exerc. 1998, 30, 1697–1702. [Google Scholar] [CrossRef]
- Ibitoye, M.O.; Hamzaid, N.A.; Zuniga, J.M.; Hasnan, N.; Wahab, A.K.A. Mechanomyographic parameter extraction methods: An appraisal for clinical applications. Sensors 2014, 14, 22940–22970. [Google Scholar] [CrossRef]
- Ebersole, K.T.; Housh, T.J.; Johnson, G.O.; Evetovich, T.K.; Smith, D.B.; Perry, S.R. MMG and EMG responses of the superficial quadriceps femoris muscles. J. Electromyogr. Kinesiol. 1999, 9, 219–227. [Google Scholar] [CrossRef]
- Evetovich, T.K.; Boyd, J.C.; Drake, S.M.; Eschbach, L.C.; Magal, M.; Soukup, J.T.; Webster, M.J.; Whitehead, M.T.; Weir, J.P. Effect of moderate dehydration on torque, electromyography, and mechanomyography. Muscle Nerve 2002, 26, 225–231. [Google Scholar] [CrossRef]
- Beck, T.W.; Housh, T.J.; Johnson, G.O.; Weir, J.P.; Cramer, J.T.; Coburn, J.W.; Malek, M.H. Comparison of a piezoelectric contact sensor and an accelerometer for examining mechanomyographic amplitude and mean power frequency versus torque relationships during isokinetic and isometric muscle actions of the biceps brachii. J. Electromyogr. Kinesiol. 2006, 16, 324–335. [Google Scholar] [CrossRef]
- Coburn, J.W.; Housh, T.J.; Weir, J.P.; Malek, M.H.; Cramer, J.T.; Beck, T.W.; Johnson, G.O. Mechanomyographic responses of the vastus medialis to isometric and eccentric muscle actions. Med. Sci. Sport. Exerc. 2004, 36, 1916–1922. [Google Scholar] [CrossRef]
- Beck, T.W.; Housh, T.J.; Johnson, G.O.; Weir, J.P.; Cramer, J.T.; Coburn, J.W.; Malek, M.H. Comparison of Fourier and wavelet transform procedures for examining the mechanomyographic and electromyographic frequency domain responses during fatiguing isokinetic muscle actions of the biceps brachii. J. Electromyogr. Kinesiol. 2005, 15, 190–199. [Google Scholar] [CrossRef]
- Nogueira-Neto, G.; Scheeren, E.; Krueger, E.; Nohama, P.; Button, V.L.S.N. The Influence of Window Length Analysis on the Time and Frequency Domain of Mechanomyographic and Electromyographic Signals of Submaximal Fatiguing Contractions. Open J. Biophys. 2013, 3, 178. [Google Scholar] [CrossRef]
- Shrout, P.E.; Fleiss, J.L. Intraclass Correlations: Uses in Assessing Rater Reliability. Psychol. Bull. 1979, 86, 420. [Google Scholar] [CrossRef]
- Koo, T.K.; Li, M.Y. A Guideline of Selecting and Reporting Intraclass Correlation Coefficients for Reliability Research. J. Chiropr. Med. 2016, 15, 155–163. [Google Scholar] [CrossRef] [PubMed]
- Akataki, K.; Mita, K.; Itoh, Y. Repeatability study of mechanomyography in submaximal isometric contractions using coefficient of variation and intraclass correlation coefficient. Electromyogr. Clin. Neurophysiol. 1999, 39, 161–166. [Google Scholar] [PubMed]
- Herda, T.J.; Ryan, E.D.; Beck, T.W.; Costa, P.B.; DeFreitas, J.M.; Stout, J.R.; Cramer, J.T. Reliability of mechanomyographic amplitude and mean power frequency during isometric step and ramp muscle actions. J. Neurosci. Methods 2008, 171, 104–109. [Google Scholar] [CrossRef] [PubMed]
- Meagher, C.; Franco, E.; Turk, R.; Wilson, S.; Steadman, N.; McNicholas, L.; Vaidyanathan, R.; Burridge, J.; Stokes, M. New advances in mechanomyography sensor technology and signal processing: Validity and intrarater reliability of recordings from muscle. J. Rehabil. Assist. Technol. Eng. 2020, 7, 2055668320916116. [Google Scholar] [CrossRef] [PubMed]
- Talib, I.; Sundaraj, K.; Lam, C.K.; Sundaraj, S. A systematic review of muscle activity assessment of the biceps brachii muscle using mechanomyography. J. Musculoskelet. Neuronal Interact. 2018, 18, 446–462. [Google Scholar]
- Madeleine, P.; Bajaj, P.; Søgaard, K.; Arendt-Nielsen, L. Mechanomyography and electromyography force relationships during concentric, isometric and eccentric contractions. J. Electromyogr. Kinesiol. 2001, 11, 113–121. [Google Scholar] [CrossRef]
- Bilodeau, M.; Arsenault, A.B.; Gravel, D.; Bourbonnais, D. EMG power spectra of elbow extensors during ramp and step isometric contractions. Eur. J. Appl. Physiol. Occup. Physiol. 1991, 63, 24–28. [Google Scholar] [CrossRef]
- Beck, T.W.; Housh, T.J.; Johnson, G.O.; Cramer, J.T.; Weir, J.P.; Coburn, J.W.; Malek, M.H. Does the frequency content of the surface mechanomyographic signal reflect motor unit firing rates? A brief review. J. Electromyogr. Kinesiol. Off. J. Int. Soc. Electrophysiol. Kinesiol. 2007, 17, 1–13. [Google Scholar] [CrossRef]
- Beck, T.W.; Housh, T.J.; Johnson, G.O.; Weir, J.P.; Cramer, J.T.; Coburn, J.W.; Malek, M.H. Mechanomyographic and electromyographic amplitude and frequency responses during fatiguing isokinetic muscle actions of the biceps brachii. Electromyogr. Clin. Neurophysiol. 2004, 44, 431–441. [Google Scholar]
- Qi, L.; Wakeling, J.M.; Ferguson-Pell, M. Spectral properties of electromyographic and mechanomyographic signals during dynamic concentric and eccentric contractions of the human biceps brachii muscle. J. Electromyogr. Kinesiol. 2011, 21, 1056–1063. [Google Scholar] [CrossRef] [PubMed]
- Perry, S.R.; Housh, T.J.; Weir, J.P.; Johnson, G.O.; Bull, A.J.; Ebersole, K.T. Mean power frequency and amplitude of the mechanomyographic and electromyographic signals during incremental cycle ergometry. J. Electromyogr. Kinesiol. 2001, 11, 299–305. [Google Scholar] [CrossRef] [PubMed]
- Beck, T.W.; Housh, T.J.; Johnson, G.O.; Weir, J.P.; Cramer, J.T.; Coburn, J.W.; Malek, M.H. Mechanomyographic amplitude and mean power frequency versus torque relationships during isokinetic and isometric muscle actions of the biceps brachii. J. Electromyogr. Kinesiol. 2004, 14, 555–564. [Google Scholar] [CrossRef] [PubMed]
- Zhang, Y.; Xu, P.; Li, P.; Duan, K.; Wen, Y.; Yang, Q.; Zhang, T.; Yao, D. Noise-assisted multivariate empirical mode decomposition for multichannel EMG signals. Biomed. Eng. Online 2017, 16, 107. [Google Scholar] [CrossRef] [PubMed]


| Type | 3-axis capacitive accelerometer with digital output |
| Mass | 13 g |
| Sensor resonant frequency | 2.4 kHz |
| Output full scale range (FSR) | ±2 g |
| Non linearity | 0.1% FSR |
| Scale factor | 3.9 µg/LSB (less significant bit) |
| Dynamic range | 98 dB |
| Sensor | Muscle | Feature | Intensity (%MVC) | |||
|---|---|---|---|---|---|---|
| 25% | 50% | 75% | 100% | |||
| EMG | BB | ICC | 0.96–0.93 | 0.97–0.94 | 0.99–0.98 | - |
| RMS | 22.1 ± 10.9 #†• | 54.4 ± 23.7 *†• | 80.0 ± 25.5 *# | 90.2 ± 5.3 *# | ||
| TRI | ICC | 0.98–0.97 | 0.99–0.98 | 0.996–0.992 | - | |
| RMS | 15.0 ± 5.6 #†• | 46.8 ± 17.6 *†• | 81.7 ± 25.3 *# | 89.5 ± 7.5 *# | ||
| DEL | ICC | 0.99–0.98 | 0.99–0.98 | 0.99–0.985 | - | |
| RMS | 33.8 ± 10.4 #†• | 64.3 ± 18.5 *†• | 92.2 ± 21.9 *# | 93.6 ± 4.3 *# | ||
| MMG | BB | ICC | 0.97–0.94 | 0.96–0.93 | 0.97–0.95 | - |
| RMS | 19.4 ± 8.6 #†• | 60.8 ± 25.1 *†• | 81.9 ± 24.7 *# | 88.8 ± 6.6 *# | ||
| TRI | ICC | 0.95–0.90 | 0.97–0.94 | 0.95–0.91 | - | |
| RMS | 11.6 ± 5.3 #†• | 45.2 ± 16.7 *†• | 92.5 ± 20.9 *# | 85.8 ± 7.2 *# | ||
| DEL | ICC | 0.98–0.97 | 0.98–0.96 | 0.97–0.94 | - | |
| RMS | 28.3 ± 12.7 #†• | 75.1 ± 20.3 *†• | 100.0 ± 29.4 *# | 88.3 ± 7.6 *# | ||
| Sensor | Muscle | Factor | df | F | p | |
|---|---|---|---|---|---|---|
| MMG | BB | Intensity | (2, 36) | 96 | <0.001 | 0.40 |
| Phase | (3, 54) | 36 | <0.001 | 0.29 | ||
| Intensity × Phase | (6, 108) | 5.5 | <0.001 | 0.02 | ||
| TRI | Intensity | (2, 36) | 84 | <0.001 | 0.30 | |
| Phase | (3, 54) | 33 | <0.001 | 0.35 | ||
| Intensity × Phase | (6, 108) | 7.8 | <0.001 | 0.02 | ||
| DEL | Intensity | (2, 36) | 96 | <0.001 | 0.40 | |
| Phase | (3, 54) | 36 | <0.001 | 0.29 | ||
| Intensity × Phase | (6, 108) | 5.5 | <0.001 | 0.02 | ||
| EMG | BB | Intensity | (2, 36) | 37 | <0.001 | 0.16 |
| Phase | (3, 54) | 21 | <0.001 | 0.32 | ||
| Intensity × Phase | (6, 108) | 5.5 | <0.001 | 0.04 | ||
| TRI | Intensity | (2, 36) | 5.2 | 0.01 | 0.05 | |
| Phase | (3, 54) | 3.8 | 0.015 | 0.13 | ||
| Intensity × Phase | (6, 108) | 4.58 | <0.001 | 0.01 | ||
| DEL | Intensity | (2, 36) | 32 | <0.001 | 0.12 | |
| Phase | (3, 54) | 58 | <0.001 | 0.59 | ||
| Intensity × Phase | (6, 108) | 13 | <0.001 | 0.02 |
| Sensor | Muscle | Factor | df | F | p | |
|---|---|---|---|---|---|---|
| MMG | BB | Intensity | (2, 36) | - | - | - |
| Phase | (3, 54) | 61 | <0.001 | 0.67 | ||
| Intensity × Phase | (6, 108) | - | - | - | ||
| TRI | Intensity | (2, 36) | 14 | <0.001 | 0.04 | |
| Phase | (3, 54) | 53 | <0.001 | 0.61 | ||
| Intensity × Phase | (6, 108) | 10 | <0.001 | 0.04 | ||
| DEL | Intensity | (2, 36) | - | - | - | |
| Phase | (3, 54) | - | - | - | ||
| Intensity × Phase | (6, 108) | 4 | <0.001 | 0.05 | ||
| EMG | BB | Intensity | (2, 36) | - | - | - |
| Phase | (3, 54) | 9 | <0.001 | 0.24 | ||
| Intensity × Phase | (6, 108) | - | - | - | ||
| TRI | Intensity | (2, 36) | 56 | <0.001 | 0.20 | |
| Phase | (3, 54) | 17 | <0.001 | 0.28 | ||
| Intensity × Phase | (6, 108) | 7 | <0.001 | 0.04 | ||
| DEL | Intensity | (2, 36) | 14 | <0.001 | 0.05 | |
| Phase | (3, 54) | 37 | <0.001 | 0.55 | ||
| Intensity × Phase | (6, 108) | - | - | - |
Disclaimer/Publisher’s Note: The statements, opinions and data contained in all publications are solely those of the individual author(s) and contributor(s) and not of MDPI and/or the editor(s). MDPI and/or the editor(s) disclaim responsibility for any injury to people or property resulting from any ideas, methods, instructions or products referred to in the content. |
© 2023 by the authors. Licensee MDPI, Basel, Switzerland. This article is an open access article distributed under the terms and conditions of the Creative Commons Attribution (CC BY) license (https://creativecommons.org/licenses/by/4.0/).
Share and Cite
Correa, M.; Projetti, M.; Siegler, I.A.; Vignais, N. Mechanomyographic Analysis for Muscle Activity Assessment during a Load-Lifting Task. Sensors 2023, 23, 7969. https://doi.org/10.3390/s23187969
Correa M, Projetti M, Siegler IA, Vignais N. Mechanomyographic Analysis for Muscle Activity Assessment during a Load-Lifting Task. Sensors. 2023; 23(18):7969. https://doi.org/10.3390/s23187969
Chicago/Turabian StyleCorrea, Matthieu, Maxime Projetti, Isabelle A. Siegler, and Nicolas Vignais. 2023. "Mechanomyographic Analysis for Muscle Activity Assessment during a Load-Lifting Task" Sensors 23, no. 18: 7969. https://doi.org/10.3390/s23187969
APA StyleCorrea, M., Projetti, M., Siegler, I. A., & Vignais, N. (2023). Mechanomyographic Analysis for Muscle Activity Assessment during a Load-Lifting Task. Sensors, 23(18), 7969. https://doi.org/10.3390/s23187969