

Quantitative Dynamic Allodynograph—A Standardized Measure for Testing Dynamic Mechanical Allodynia in Chronic Limb Pain
 ,
,
Abstract
:1. Introduction
2. Methods
2.1. Participants
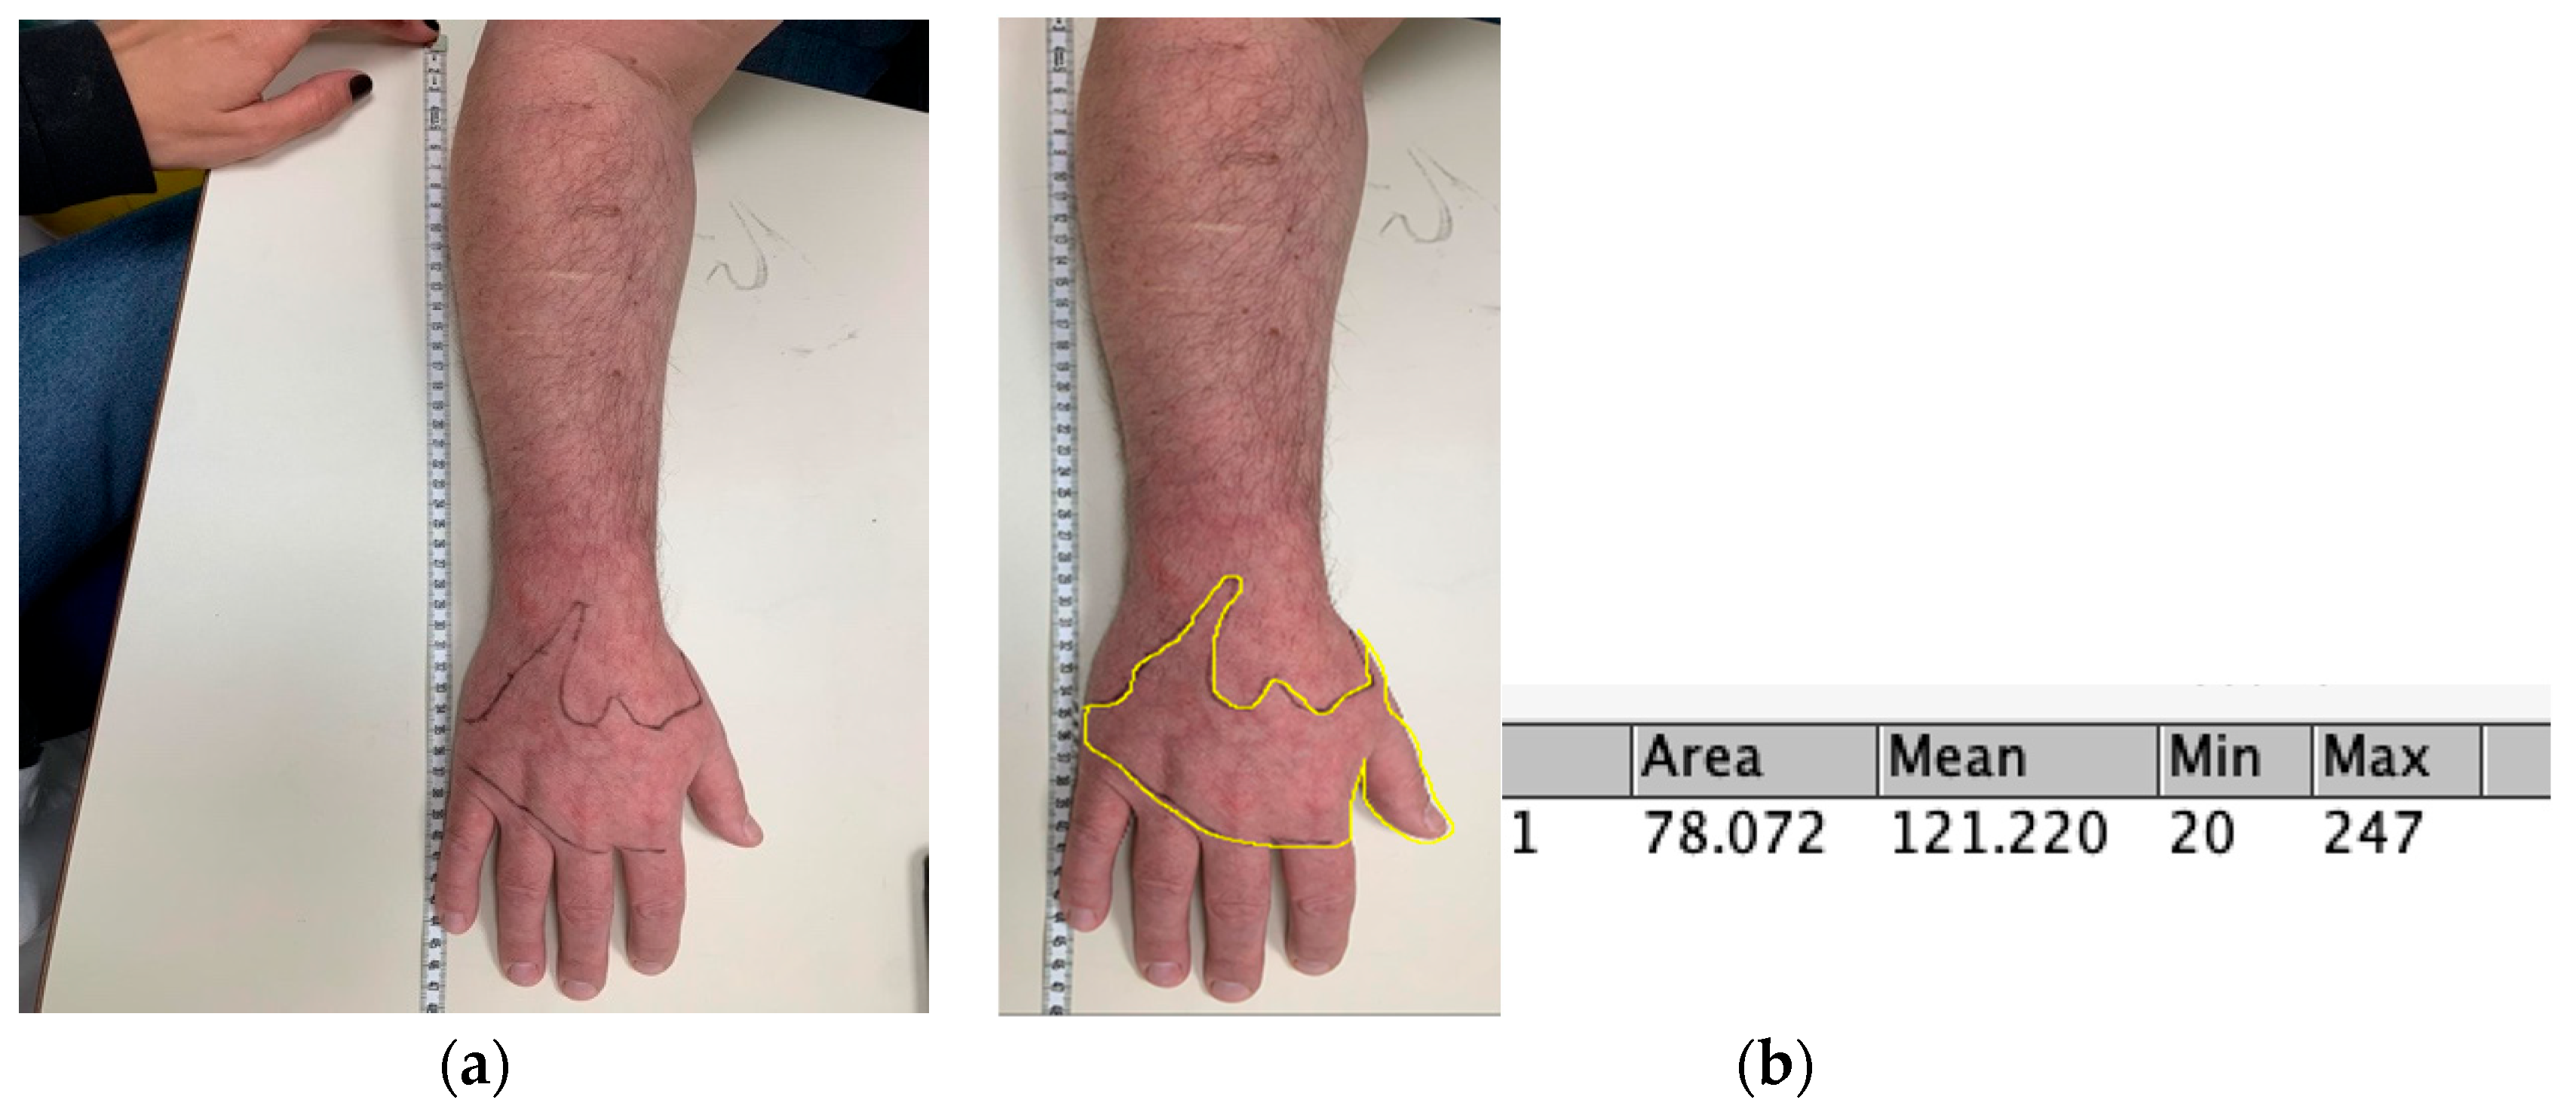
2.2. Measures
2.3. Procedure
2.4. Statistical Analysis
3. Results
3.1. Participants
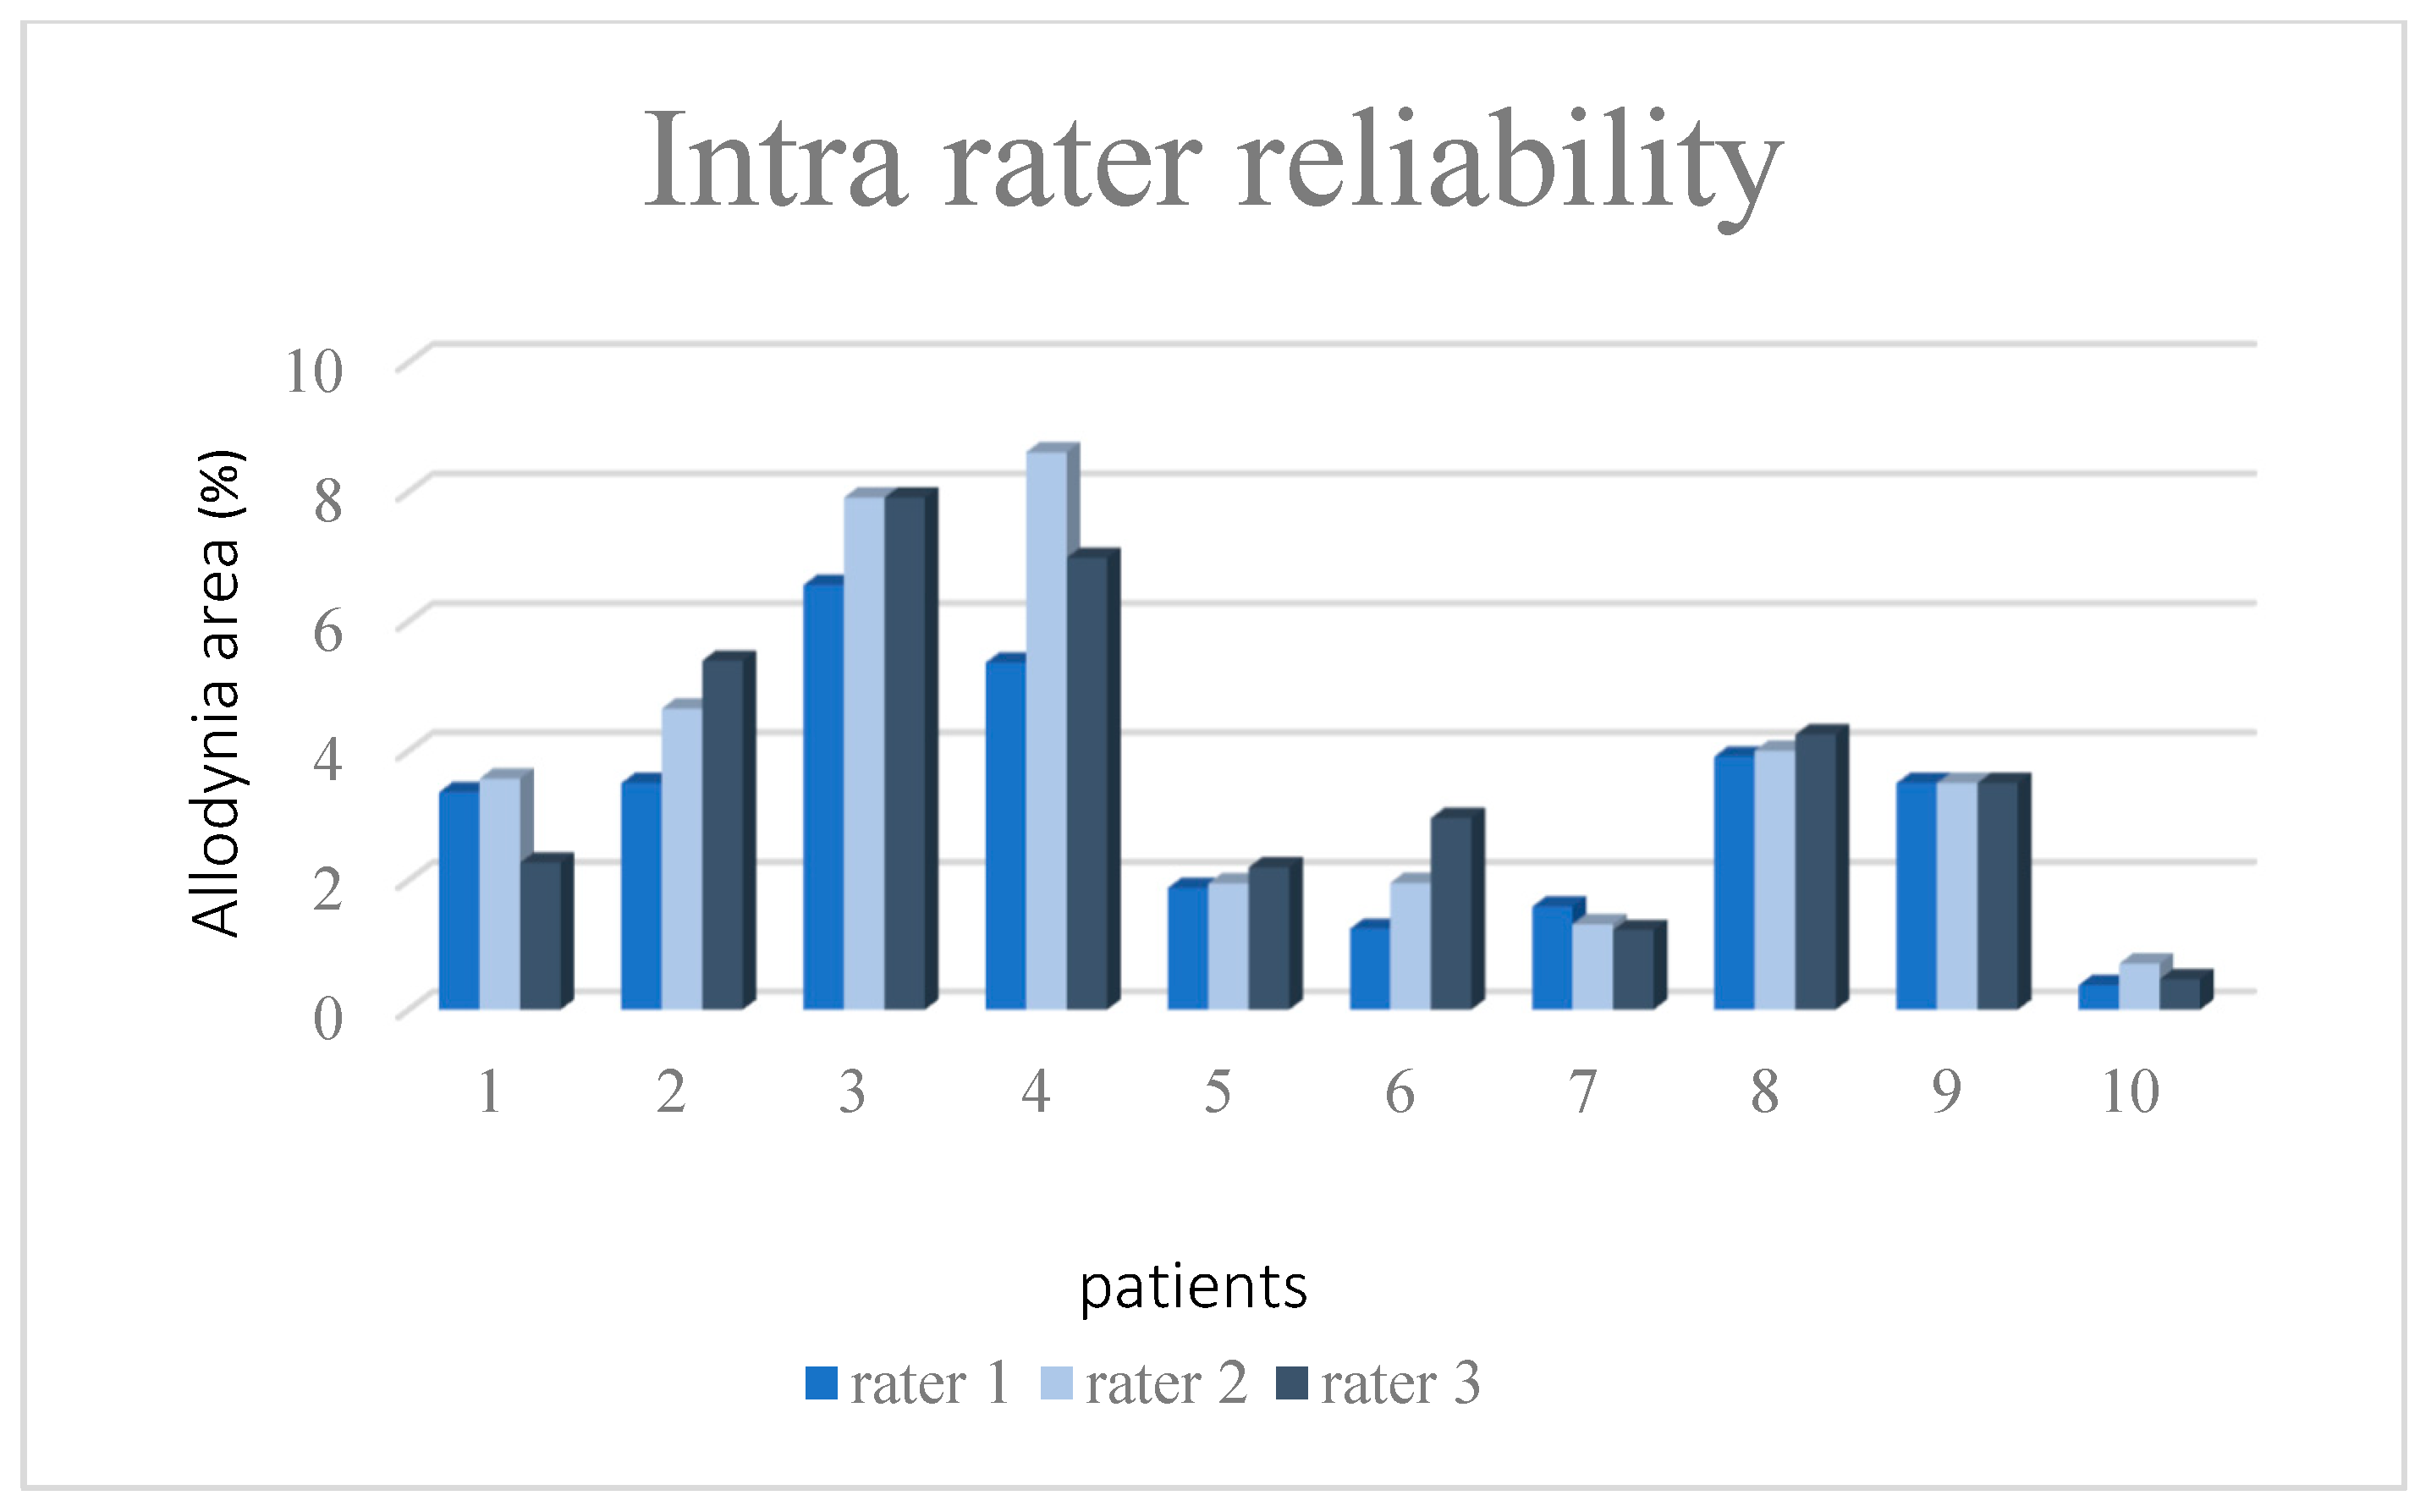
3.2. Phase I—Establishing Inter-Rater Reliability and Test–Retest Reliability for the QDA
3.3. Phase II-Convergent Validity for the QDA
4. Discussion
4.1. Reliability of the QDA
4.2. Construct Validity of the QDA
5. Conclusions
Author Contributions
Funding
Institutional Review Board Statement
Informed Consent Statement
Data Availability Statement
Acknowledgments
Conflicts of Interest
References
- Koltzenburg, M.; Lundberg, L.E.; Torebjörk, H.E. Dynamic and static components of mechanical hyperalgesia in human hairy skin. Pain 1992, 51, 207–219. [Google Scholar] [CrossRef]
- Ochoa, J.L.; Yarnitsky, D. Mechanical hyperalgesias in neuropathic pain patients: Dynamic and static subtypes. Ann. Neurol. Off. J. Am. Neurol. Assoc. Child Neurol. Soc. 1993, 33, 465–472. [Google Scholar] [CrossRef] [PubMed]
- Baron, R. Peripheral neuropathic pain: From mechanisms to symptoms. Clin. J. Pain 2000, 16, S12–S20. [Google Scholar] [CrossRef]
- Baral, P.; Udit, S.; Chiu, I.M. Pain and immunity: Implications for host defence. Nat. Rev. Immunol. 2019, 19, 433–447. [Google Scholar] [CrossRef] [PubMed]
- Woolf, C.J. Central sensitization: Implications for the diagnosis and treatment of pain. Pain 2011, 152, S2–S15. [Google Scholar] [CrossRef]
- Llewellyn, A.; Buckle, L.; Grieve, S.; Birklein, F.; Brunner, F.; Goebel, A.; Harden, R.N.; Bruehl, S.; Vaughan-Spickers, N.; Connett, R.; et al. A Delphi study to define core clinical outcomes for inclusion in a complex regional pain syndrome international research registry and data bank. Pain 2022, 164, 543–554. [Google Scholar] [CrossRef]
- Ott, S.; Maihöfner, C. Signs and symptoms in 1043 patients with complex regional pain syndrome. J. Pain 2018, 19, 599–611. [Google Scholar] [CrossRef] [PubMed]
- Harden, N.R.; Bruehl, S.; Perez, R.S.; Birklein, F.; Marinus, J.; Maihofner, C.; Lubenow, T.; Buvanendran, A.; Mackey, S.; Graciosa, J.; et al. Development of a severity score for CRPS. PAIN® 2010, 151, 870–876. [Google Scholar] [CrossRef] [PubMed]
- Harden, R.N. Objectification of the diagnostic criteria for CRPS. Pain Med. 2010, 11, 1212–1215. [Google Scholar] [CrossRef]
- Brunner, F.; Nauer, M.; Bachmann, L.M. Poor prognostic factors in complex regional pain syndrome 1: A Delphi survey. J. Rehabil. Med. 2011, 43, 783–786. [Google Scholar] [CrossRef]
- Wertli, M.; Bachmann, L.; Weiner, S.; Brunner, F. Prognostic factors in complex regional pain syndrome 1: A systematic review. J. Rehabil. Med. 2013, 45, 225–231. [Google Scholar] [CrossRef] [PubMed]
- Savaş, S.; Baloğlu, H.H.; Ay, G.; Çerçi, S.S. The effect of sequel symptoms and signs of Complex Regional Pain Syndrome type 1 on upper extremity disability and quality of life. Rheumatol. Int. 2009, 29, 545–550. [Google Scholar] [CrossRef] [PubMed]
- Samuelsson, M.; Leffler, A.-S.; Hansson, P. Dynamic mechanical allodynia: On the relationship between temporo-spatial stimulus parameters and evoked pain in patients with peripheral neuropathy. Pain 2005, 115, 264–272. [Google Scholar] [CrossRef]
- Packham, T.L.; Spicher, C.J.; MacDermid, J.C.; Buckley, N.D. Allodynography: Reliability of a new procedure for objective clinical examination of static mechanical allodynia. Pain Med. 2020, 21, 101–108. [Google Scholar] [CrossRef] [PubMed]
- Spicher, C.J.; Mathis, F.; Degrange, B.; Freund, P.; Rouiller, E.M. Static mechanical allodynia (SMA) is a paradoxical painful hypo-aesthesia: Observations derived from neuropathic pain patients treated with somatosensory rehabilitation. Somatosens. Mot. Res. 2008, 25, 77–92. [Google Scholar] [CrossRef] [PubMed]
- Spicher, C. Handbook for Somatosensory Rehabilitation; Sauramps Médical: Montpellier, France, 2006. [Google Scholar]
- Lundin, K.; Alsbjørn, B. The 101 percent in Lund-Browder charts—A commentary. Burn. J. Int. Soc. Burn Inj. 2012, 39, 819–820. [Google Scholar] [CrossRef] [PubMed]
- Faul, F.; Erdfelder, E.; Lang, A.G.; Buchner, A. G* Power 3: A flexible statistical power analysis program for the social, behavioral, and biomedical sciences. Behav. Res. Methods 2007, 39, 175–191. [Google Scholar] [CrossRef]
- Harden, R.N.; Oaklander, A.L.; Burton, A.W.; Perez, R.R.S.G.M.; Richardson, K.; Swan, M.; Barthel, J.; Costa, B.; Graciosa, J.R.; Bruehl, S. Complex regional pain syndrome: Practical diagnostic and treatment guidelines. Pain Med. 2013, 14, 180–229. [Google Scholar] [CrossRef]
- Rasband, W. ImageJ; US National Institutes of Health: Bethesda, MD, USA, 1997.
- Ferreira, T.; Rasband, W. ImageJ user guide. ImageJ/Fiji 2012, 1, 155–161. [Google Scholar]
- Harden, R.N.; Maihofner, C.; Abousaad, E.; Vatine, J.-J.; Kirsling, A.; Perez, R.S.; Kuroda, M.; Brunner, F.; Stanton-Hicks, M.; Marinus, J.; et al. A prospective, multisite, international validation of the Complex Regional Pain Syndrome Severity Score. Pain 2017, 158, 1430–1436. [Google Scholar] [CrossRef]
- Melzack, R. The short-form McGill pain questionnaire. Pain 1987, 30, 191–197. [Google Scholar] [CrossRef] [PubMed]
- Sloman, R.; Rosen, G.; Rom, M.; Shir, Y. Nurses’ assessment of pain in surgical patients. J. Adv. Nurs. 2005, 52, 125–132. [Google Scholar] [CrossRef]
- Ware, J.E., Jr.; Sherbourne, C.D. The MOS 36-item short-form health survey (SF-36): I. Conceptual framework and item selection. Med. Care 1992, 30, 473–483. [Google Scholar] [CrossRef] [PubMed]
- Lewin-Epstein, N.; Sagiv-Schifter, T.M.; Shabtal, E.L.M.; Shmueli, A. Validation of the 36-item short-form Health Survey (Hebrew version) in the adult population of Israel. Med. Care 1998, 36, 1361–1370. [Google Scholar] [CrossRef] [PubMed]
- Koo, T.K.; Li, M.Y. A guideline of selecting and reporting intraclass correlation coefficients for reliability research. J. Chiropr. Med. 2016, 15, 155–163. [Google Scholar] [CrossRef] [PubMed]
- Fitzpatrick, R.; Davey, C.; Buxton, M.J.; Jones, D.R. Evaluating Patient-Based Outcome Measures for Use in Clinical Trials. Health Technol. Assess. 1998, 2, 1–74. [Google Scholar] [CrossRef]
- Hays, R.; Anderson, R.; Revicki, D. Psychometric considerations in evaluating health-related quality of life measures. Qual. Life Res. 1993, 2, 441–449. [Google Scholar] [CrossRef] [PubMed]
- Raja, S.N.; Carr, D.B.; Cohen, M.; Finnerup, N.B.; Flor, H.; Gibson, S.; Keefe, F.; Mogil, J.S.; Ringkamp, M.; Sluka, K.A.; et al. The revised IASP definition of pain: Concepts, challenges, and compromises. Pain 2020, 161, 1976. [Google Scholar] [CrossRef]
- Upshur, C.C.; Bacigalupe, G.; Luckmann, R. “They don’t want anything to do with you”: Patient views of primary care management of chronic pain. Pain Med. 2010, 11, 1791–1798. [Google Scholar] [CrossRef]
- Melhado, E.M.; Rister, H.L.T.; Galego, D.R.; de Oliveira, A.B.; Buttarello, I.A.; Belucio, I.S.; Marcos, J.M.O.; Xavier, M.L.T.; Peres, M.F.P. Allodynia in menstrually related migraine: Score assessment by Allodynia Symptom Checklist (ASC-12). Headache J. Head Face Pain 2020, 60, 162–170. [Google Scholar] [CrossRef]
- Campbell, D.T.; Fiske, D.W. Convergent and discriminant validation by the multitrait-multimethod matrix. Psychol. Bull. 1959, 56, 81. [Google Scholar] [CrossRef] [PubMed]
- Jenkinson, C.; Carroll, D.; Egerton, M.; Frankland, T.; McQuay, H.; Nagle, C. Comparison of the sensitivity to change of long and short form pain measures. Qual. Life Res. 1995, 4, 353–357. [Google Scholar] [CrossRef] [PubMed]
- Spitzer, W.O.; Dobson, A.J.; Hall, J.; Chesterman, E.; Levi, J.; Shepherd, R.; Battista, R.N.; Catchlove, B.R. Measuring the quality of life of cancer patients: A concise QL-index for use by physicians. J. Chronic Dis. 1981, 34, 585–597. [Google Scholar] [CrossRef] [PubMed]
- Sullivan, M.; Ahlmen, M.; Bjelle, A. Health status assessment in rheumatoid arthritis. I. Further work on the validity of the sickness impact profile. J. Rheumatol. 1990, 17, 439–447. [Google Scholar] [PubMed]
- Aaronson, N.K.; Ahmedzai, S.; Bergman, B.; Bullinger, M.; Cull, A.; Duez, N.J.; Filiberti, A.; Flechtner, H.; Fleishman, S.B.; De Haes, J.C.J.M.; et al. The European Organization for Research and Treatment of Cancer QLQ-C30: A quality-of-life instrument for use in international clinical trials in oncology. JNCI J. Natl. Cancer Inst. 1993, 85, 365–376. [Google Scholar] [CrossRef]
- Backonja, M.-M.; Stacey, B. Neuropathic pain symptoms relative to overall pain rating. J. Pain 2004, 5, 491–497. [Google Scholar] [CrossRef]
- Ito, M.; Ono, K.; Hitomi, S.; Nodai, T.; Sago, T.; Yamaguchi, K.; Harano, N.; Gunjigake, K.; Hosokawa, R.; Kawamoto, T.; et al. Prostanoid-dependent spontaneous pain and PAR2-dependent mechanical allodynia following oral mucosal trauma: Involvement of TRPV1, TRPA1, and TRPV4. Mol. Pain 2017, 13, 1744806917704138. [Google Scholar] [CrossRef]
- Zuo, Z.-X.; Wang, Y.-J.; Liu, L.; Wang, Y.; Mei, S.-H.; Feng, Z.-H.; Wang, M.; Li, X.-Y. Huperzine A alleviates mechanical allodynia but not spontaneous pain via muscarinic acetylcholine receptors in mice. Neural Plast. 2015, 2015, 453170. [Google Scholar] [CrossRef]
- Gottrup, H.; Bach, F.W.; Juhl, G.; Jensen, T.S. Differential effect of ketamine and lidocaine on spontaneous and mechanical evoked pain in patients with nerve injury pain. J. Am. Soc. Anesthesiol. 2006, 104, 527–536. [Google Scholar] [CrossRef]
- Tucker, R.G. Karch’s Focus on Nursing Pharmacology; Lippincott Williams & Wilkins: Philadelphia, PA, USA, 2022. [Google Scholar]
- Latremoliere, A.; Woolf, C.J. Central sensitization: A generator of pain hypersensitivity by central neural plasticity. J. Pain 2009, 10, 895–926. [Google Scholar] [CrossRef]
- Kim, J.; Kang, I.; Chung, Y.-A.; Kim, T.-S.; Namgung, E.; Lee, S.; Oh, J.K.; Jeong, H.S.; Cho, H.; Kim, M.J.; et al. Altered attentional control over the salience network in complex regional pain syndrome. Sci. Rep. 2018, 8, 7466. [Google Scholar] [CrossRef]
- Baron, R.; Wasner, G. Complex regional pain syndromes. Curr. Pain Headache Rep. 2001, 5, 114–123. [Google Scholar]
- Merskey, H.; Bogduk, N. Classification of Chronic Pain, IASP Task Force on Taxonomy; IASP Press: Seattle, WA, USA, 1994. [Google Scholar]
- Geertzen, J.H.B.; de Bruijn-Kofman, A.T.; de Bruijn, H.P.; van de Wiel, H.B.M.; Dijkstra, P.U. Stressful life events and psychological dysfunction in complex regional pain syndrome type I. Clin. J. Pain 1998, 14, 143–147. [Google Scholar]
- Galer, B.S.; Henderson, J.; Perander, J.; Jensen, M.P. Course of symptoms and quality of life measurement in complex regional pain syndrome: A pilot survey. J. Pain Symptom Manag. 2000, 20, 286–292. [Google Scholar] [CrossRef] [PubMed]
- Kemler, M.A.; De Vet, H.C. Health-related quality of life in chronic refractory reflex sympathetic dystrophy (complex regional pain syndrome type I). J. Pain Symptom Manag. 2000, 20, 68–76. [Google Scholar] [CrossRef] [PubMed]
- Duman, I.; Dincer, U.; Taskaynatan, M.A.; Cakar, E.; Tugcu, I.; Dincer, K. Reflex sympathetic dystrophy: A retrospective epidemiological study of 168 patients. Clin. Rheumatol. 2007, 26, 1433–1437. [Google Scholar] [CrossRef] [PubMed]
- van Velzen, G.A.; Perez, R.S.; van Gestel, M.A.; Huygen, F.J.; van Kleef, M.; van Eijs, F.; Dahan, A.; van Hilten, J.J.; Marinus, J. Health-related quality of life in 975 patients with complex regional pain syndrome type 1. PAIN® 2014, 155, 629–634. [Google Scholar] [CrossRef] [PubMed]


| First Phase N = 30 Mean (SD) | Second Phase N = 61 Mean (SD) | ||
|---|---|---|---|
| Age | 32.02 (11.87) | 35.61 (12.09) | |
| Years of education | 13.05 (2.19) | ||
| Years from injury | 1.66 (2.65) | 1.97 (2.41) | |
| N (%) | N (%) | ||
| Gender | Men | 18 (58.1) | 29 (47.5) |
| Women | 12 (41.9) | 32 (52.5) | |
| Type of CRPS | 1 2 | 14 (45.2) 16 (51.6) | 38 (62.35) 23 (37.65) |
| Measures | Median (IQR) |
|---|---|
| QDA | 5.03 (1.25–6.72) |
| CSS | 12 (10–14) |
| MPQ-VAS | 7 (5–8) |
| MPQ Affect total | 6 (3–10) |
| Mean (SD) | |
| SF-36 Physical Health sum score | 27.17 (13.37) |
| QDA r | p | |
|---|---|---|
| CSS | 0.47 | <0.001 |
| MPQ-VAS | 0.37 | <0.001 |
| MPQ Affect total | 0.26 | 0.026 |
| SF-36 Physical Health total score | −0.47 | <0.001 |
Disclaimer/Publisher’s Note: The statements, opinions and data contained in all publications are solely those of the individual author(s) and contributor(s) and not of MDPI and/or the editor(s). MDPI and/or the editor(s) disclaim responsibility for any injury to people or property resulting from any ideas, methods, instructions or products referred to in the content. |
© 2023 by the authors. Licensee MDPI, Basel, Switzerland. This article is an open access article distributed under the terms and conditions of the Creative Commons Attribution (CC BY) license (https://creativecommons.org/licenses/by/4.0/).
Share and Cite
Turgeman Dahan, N.; Vatine, J.-J.; Weissman-Fogel, I.; Karpin, H.; Shmuely, S.; Bar-Shalita, T. Quantitative Dynamic Allodynograph—A Standardized Measure for Testing Dynamic Mechanical Allodynia in Chronic Limb Pain. Sensors 2023, 23, 7949. https://doi.org/10.3390/s23187949
Turgeman Dahan N, Vatine J-J, Weissman-Fogel I, Karpin H, Shmuely S, Bar-Shalita T. Quantitative Dynamic Allodynograph—A Standardized Measure for Testing Dynamic Mechanical Allodynia in Chronic Limb Pain. Sensors. 2023; 23(18):7949. https://doi.org/10.3390/s23187949
Chicago/Turabian StyleTurgeman Dahan, Noy, Jean-Jacques Vatine, Irit Weissman-Fogel, Hana Karpin, Sharon Shmuely, and Tami Bar-Shalita. 2023. "Quantitative Dynamic Allodynograph—A Standardized Measure for Testing Dynamic Mechanical Allodynia in Chronic Limb Pain" Sensors 23, no. 18: 7949. https://doi.org/10.3390/s23187949
APA StyleTurgeman Dahan, N., Vatine, J.-J., Weissman-Fogel, I., Karpin, H., Shmuely, S., & Bar-Shalita, T. (2023). Quantitative Dynamic Allodynograph—A Standardized Measure for Testing Dynamic Mechanical Allodynia in Chronic Limb Pain. Sensors, 23(18), 7949. https://doi.org/10.3390/s23187949