


Comparative Analysis of the Clustering Quality in Self-Organizing Maps for Human Posture Classification

Abstract
:1. Introduction
2. State of the Art
3. Problem Statement
4. Data Gathering and the Posture Recognition Method
5. Applied Scores
6. Evaluation of Clustering Quality
6.1. Approach
6.2. Results
6.3. Discussion
7. Conclusions
- -
- The introduction of a new clustering quality assessment namely, termed the discriminant score.
- -
- Comparative studies of clustering scores, considering the posture classification task, with an indication of the advantages and disadvantages of each of them.
Author Contributions
Funding
Institutional Review Board Statement
Informed Consent Statement
Data Availability Statement
Acknowledgments
Conflicts of Interest
References
- Nadeem, A.; Jalal, A.; Kim, K. Automatic Human Posture Estimation for Sport Activity Recognition with Robust Body Parts Detection and Dntropy Markov Model. Multimed. Tools Appl. 2021, 80, 21465–21498. [Google Scholar] [CrossRef]
- Paudel, P.; Kwon, Y.J.; Kim, D.H.; Choi, K.H. Industrial Ergonomics Risk Analysis Based on 3D-Human Pose Estimation. Electronics 2022, 11, 3403. [Google Scholar] [CrossRef]
- Arowolo, O.F.; Arogunjo, E.O.; Owolabi, D.G.; Markus, E.D. Development of a Human Posture Recognition System for Surveillance Application. Int. J. Comput. Digit. Syst. 2021, 10. [Google Scholar] [CrossRef]
- Pascual-Hernández, D.; de Frutos, N.O.; Mora-Jiménez, I.; Cañas-Plaza, J.M. Efficient 3D human pose estimation from RGBD sensors. Displays 2022, 74, 102225. [Google Scholar] [CrossRef]
- Ding, W.; Hu, B.; Liu, H.; Wang, X.; Huang, X. Human Posture Recognition Based on Multiple Features and Rule Learning. Int. J. Mach. Learn. Cybern. 2020, 11, 2529–2540. [Google Scholar] [CrossRef]
- Chun, S.; Kong, S.; Mun, K.R.; Kim, J. A Foot-Arch Parameter Measurement System Using a RGB-D Camera. Sensors 2017, 17, 1796. [Google Scholar] [CrossRef] [PubMed]
- Cao, B.; Bi, S.; Zheng, J.; Yang, D. Human Posture Recognition using Skeleton and Depth Information. In Proceedings of the 2018 WRC Symposium on Advanced Robotics and Automation (WRC SARA), Beijing, China, 16 August 2018; pp. 275–280. [Google Scholar]
- Leone, A.; Rescio, G.; Caroppo, A.; Siciliano, P.; Manni, A. Human Postures Recognition by Accelerometer Sensor and ML Architecture Integrated in Embedded Platforms: Benchmarking and Performance Evaluation. Sensors 2023, 23, 1039. [Google Scholar] [CrossRef]
- Lan, T.; Chen, T.C.; Savarese, S. A Hierarchical Representation for Future Action Prediction. In Proceedings of the European Conference on Computer Vision, Zurich, Switzerland, 6–12 September 2014; pp. 689–704. [Google Scholar]
- Zhang, W.; Fang, J.; Wang, X.; Liu, W. Efficientpose: Efficient Human Pose Estimation with Neural Architecture Search. Comput. Vis. Media 2021, 7, 335–347. [Google Scholar] [CrossRef]
- Dutta, V.; Zielinska, T. Prognosing Human Activity Using Actions Forecast and Structured Database. IEEE Access 2020, 8, 6098–6116. [Google Scholar] [CrossRef]
- Nurwulan, N.; Selamaj, G. Human Daily Activities Recognition using Decision Tree. J. Phys. Conf. Ser. 2021, 1833, 012039. [Google Scholar] [CrossRef]
- Mohsen, S.; Elkaseer, A.; Scholz, S.G. Human Activity Recognition using K-nearest Neighbor Machine Learning Algorithm. In Proceedings of the Sustainable Design and Manufacturing: Proceedings of the 8th International Conference on Sustainable Design and Manufacturing (KES-SDM 2021), Split, Croatia, 16–17 September 2021; pp. 304–313. [Google Scholar]
- Yadav, S.K.; Singh, A.; Gupta, A.; Raheja, J.L. Real-time Yoga recognition using deep learning. Neural Comput. Appl. 2019, 31, 9349–9361. [Google Scholar] [CrossRef]
- Ariza Colpas, P.; Vicario, E.; De-La-Hoz-Franco, E.; Pineres-Melo, M.; Oviedo-Carrascal, A.; Patara, F. Unsupervised human activity recognition using the clustering approach: A review. Sensors 2020, 20, 2702. [Google Scholar] [CrossRef] [PubMed]
- Ferles, C.; Papanikolaou, Y.; Savaidis, S.P.; Mitilineos, S.A. Deep Self-Organizing Map of Convolutional Layers for Clustering and Visualizing Image Data. Mach. Learn. Knowl. Extr. 2021, 3, 879–899. [Google Scholar] [CrossRef]
- Naskath, J.; Sivakamasundari, G.; Begum, A.A.S. A study on different deep learning algorithms used in deep neural nets: MLP SOM and DBN. Wirel. Pers. Commun. 2023, 128, 2913–2936. [Google Scholar] [CrossRef] [PubMed]
- Chiu, S.L. Task compatibility of manipulator postures. Int. J. Robot. Res. 1988, 7, 13–21. [Google Scholar] [CrossRef]
- Tommasino, P.; Campolo, D. An extended passive motion paradigm for human-like posture and movement planning in redundant manipulators. Front. Neurorobot. 2017, 11, 65. [Google Scholar] [CrossRef] [PubMed]
- Floyd, M.W.; Bicakci, M.V.; Esfandiari, B. Case-based learning by observation in robotics using a dynamic case representation. In Proceedings of the Twenty-Fifth International FLAIRS Conference, Marco Island, FL, USA, 23–25 May 2012. [Google Scholar]
- Ikeuchi, K.; Takamatsu, J.; Sasabuchi, K.; Wake, N.; Kanehiro, A. Applying Learning-from-observation to household service robots: Three common-sense formulation. arXiv 2023, arXiv:2304.09966. [Google Scholar]
- Patil, C.; Baidari, I. Estimating the optimal number of clusters k in a dataset using data depth. Data Sci. Eng. 2019, 4, 132–140. [Google Scholar] [CrossRef]
- Dinh, D.T.; Fujinami, T.; Huynh, V.N. Estimating the optimal number of clusters in categorical data clustering by silhouette coefficient. In Proceedings of the Knowledge and Systems Sciences: 20th International Symposium, KSS 2019, Proceedings 20, Da Nang, Vietnam, 29 November–1 December 2019; Springer: Berlin/Heidelberg, Germany, 2019; pp. 1–17. [Google Scholar]
- Rodriguez, M.Z.; Comin, C.H.; Casanova, D.; Bruno, O.M.; Amancio, D.R.; Costa, L.d.F.; Rodrigues, F.A. Clustering algorithms: A comparative approach. PLoS ONE 2019, 14, e0210236. [Google Scholar] [CrossRef]
- Ezugwu, A.E.; Shukla, A.K.; Agbaje, M.B.; Oyelade, O.N.; José-García, A.; Agushaka, J.O. Automatic clustering algorithms: A systematic review and bibliometric analysis of relevant literature. Neural Comput. Appl. 2021, 33, 6247–6306. [Google Scholar] [CrossRef]
- Lan, D.T.; Yoon, S. Trajectory Clustering-Based Anomaly Detection in Indoor Human Movement. Sensors 2023, 23, 3318. [Google Scholar] [CrossRef] [PubMed]
- Liu, H.; Wang, L. Gesture Recognition for Human-robot Collaboration: A Review. Int. J. Ind. Ergon. 2018, 68, 355–367. [Google Scholar] [CrossRef]
- Ko, C.; Baek, J.; Tavakkol, B.; Jeong, Y.S. Cluster Validity Index for Uncertain Data Based on a Probabilistic Distance Measure in Feature Space. Sensors 2023, 23, 3708. [Google Scholar] [CrossRef] [PubMed]
- Tarekegn, A.N.; Michalak, K.; Giacobini, M. Cross-validation approach to evaluate clustering algorithms: An experimental study using multi-label datasets. SN Comput. Sci. 2020, 1, 263. [Google Scholar] [CrossRef]
- Kokate, U.; Deshpande, A.; Mahalle, P.; Patil, P. Data stream clustering techniques, applications, and models: Comparative analysis and discussion. Big Data Cogn. Comput. 2018, 2, 32. [Google Scholar] [CrossRef]
- Saxena, A.; Goyal, L.; Mittal, M. Comparative Analysis of Clustering Methods. Int. J. Comput. Appl. 2015, 118, 30–35. [Google Scholar] [CrossRef]
- Kolesnikov, A.; Trichina, E. Determining the Number of Clusters with Rate-Distortion Curve Modeling. In Proceedings of the Image Analysis and Recognition: 9th International Conference, ICIAR 2012, Aveiro, Portugal, 25–27 June 2012; Campilho, A., Kamel, M., Eds.; Springer: Berlin/Heidelberg, Germany, 2012; pp. 43–50. [Google Scholar]
- Ünlü, R.; Xanthopoulos, P. Estimating the number of clusters in a dataset via consensus clustering. Expert Syst. Appl. 2019, 125, 33–39. [Google Scholar] [CrossRef]
- Zimmermann, A. Method Evaluation, Parameterization, and Result Validation In Unsupervised Data Mining: A Critical Survey. Wires Data Min. Knowl. Discov. 2019, 10, e1330. [Google Scholar] [CrossRef]
- Liu, T.; Yu, H.; Blair, R.H. Stability estimation for unsupervised clustering: A review. Wiley Interdiscip. Rev. Comput. Stat. 2022, 14, e1575. [Google Scholar] [CrossRef]
- Haselbeck, V.; Kordilla, J.; Krause, F.; Sauter, M. Self-organizing maps for the identification of groundwater salinity sources based on hydrochemical data. J. Hydrol. 2019, 576, 610–619. [Google Scholar] [CrossRef]
- Doan, Q.V.; Kusaka, H.; Sato, T.; Chen, F. S-SOM v1. 0: A structural self-organizing map algorithm for weather typing. Geosci. Model Dev. 2021, 14, 2097–2111. [Google Scholar] [CrossRef]
- Xiao, J.; Lu, J.; Li, X. Davies Bouldin Index based hierarchical initialization K-means. Intell. Data Anal. 2017, 21, 1327–1338. [Google Scholar] [CrossRef]
- Cengizler, C.; Kerem-Un, M. Evaluation of Calinski-Harabasz criterion as fitness measure for genetic algorithm based segmentation of cervical cell nuclei. J. Adv. Math. Comput. Sci 2017, 22, 1–13. [Google Scholar] [CrossRef]
- Rozumalski, A.; Schwartz, M.H. Crouch gait patterns defined using k-means cluster analysis are related to underlying clinical pathology. Gait Posture 2009, 30, 155–160. [Google Scholar] [CrossRef] [PubMed]
- Manfrè, A.; Infantino, I.; Augello, A.; Pilato, G.; Vella, F. Learning by Demonstration for a Dancing Robot within a Computational Creativity Framework. In Proceedings of the 2017 First IEEE International Conference on Robotic Computing (IRC), Taichung, Taiwan, 10–12 April 2017; pp. 434–439. [Google Scholar] [CrossRef]
- Dimitrijevic, M.; Lepetit, V.; Fua, P. Human body pose detection using Bayesian spatio-temporal templates. Comput. Vis. Image Underst. 2006, 104, 127–139. [Google Scholar] [CrossRef]
- Ding, H.; Shangguan, L.; Yang, Z.; Han, J.; Zhou, Z.; Yang, P.; Xi, W.; Zhao, J. Femo: A Platform for Free-Weight Exercise Monitoring with RFIDs. In Proceedings of the 13th ACM Conference on Embedded Networked Sensor Systems, Seoul, Republic of Korea, 1–4 November 2015; pp. 141–154. [Google Scholar]
- Rallis, I.; Georgoulas, I.; Doulamis, N.; Voulodimos, A.; Terzopoulos, P. Extraction of key postures from 3D human motion data for choreography summarization. In Proceedings of the 2017 9th International Conference on Virtual Worlds and Games for Serious Applications (VS-Games), Athens, Greece, 6–8 September 2017; pp. 94–101. [Google Scholar]
- Siami, M.; Naderpour, M.; Lu, J. A Mobile Telematics Pattern Recognition Framework for Driving Behavior Extraction. IEEE Trans. Intell. Transp. Syst. 2021, 22, 1459–1472. [Google Scholar] [CrossRef]
- Pius Owoh, N.; Mahinderjit Singh, M.; Zaaba, Z.F. Automatic Annotation of Unlabeled Data from Smartphone-Based Motion and Location Sensors. Sensors 2018, 18, 2134. [Google Scholar] [CrossRef]
- Dutta, V.; Cydejko, J.T. Improved Competitive Neural Network for Classification of Human Postures Based on Data from RGB-D Sensors. J. Autom. Mob. Robot. Intell. Syst. 2023, printing. [Google Scholar]
- Xin, H.; Vibekananda, D.; Teresa, Z.; Takafumi, M. A Probabilistic Approach Based on Combination of Distance Metrics and Distribution Functions for Human Postures Classification; IEEE: Bhushan, Republic of Korea, 2023. [Google Scholar]
- Gupta, M.K.; Chandra, P. A Comparative Study of Clustering Algorithms. In Proceedings of the 2019 6th International Conference on Computing for Sustainable Global Development (INDIACom), New Delhi, India, 13–15 March 2019; pp. 801–805. [Google Scholar]
- Ogbuabor, G.; Ugwoke, F. Clustering algorithm for a healthcare dataset using silhouette score value. Int. J. Comput. Sci. Inf. Technol. 2018, 10, 27–37. [Google Scholar] [CrossRef]
- Kambara, M.; Sugiura, K. Relational Future Captioning Model for Explaining Likely Collisions in Daily Tasks. arXiv 2022, arXiv:2207.09083. [Google Scholar]
- Maulik, U.; Bandyopadhyay, S. Performance evaluation of some clustering algorithms and validity indices. IEEE Trans. Pattern Anal. Mach. Intell. 2002, 24, 1650–1654. [Google Scholar] [CrossRef]
- Yang, S.; Feng, Z.; Wang, Z.; Li, Y.; Zhang, S.; Quan, Z.; Xia, S.T.; Yang, W. Detecting and grouping keypoints for multi-person pose estimation using instance-aware attention. Pattern Recognit. 2023, 136, 109232. [Google Scholar] [CrossRef]
- Shrikant, K.; Gupta, V.; Khandare, A.; Furia, P. A Comparative Study of Clustering Algorithm. In Intelligent Computing and Networking; Balas, V.E., Semwal, V.B., Khandare, A., Eds.; Springer Nature: Singapore, 2022; pp. 219–235. [Google Scholar]
- Tibshirani, R.; Walther, G.; Hastie, T. Estimating the Number of Clusters in a Data Set Via the Gap Statistic. J. R. Stat. Soc. Ser. B 2001, 63, 411–423. [Google Scholar] [CrossRef]
- Shi, C.; Wei, B.; Wei, S.; Wang, W.; Liu, H.; Liu, J. A quantitative discriminant method of elbow point for the optimal number of clusters in clustering algorithm. Eurasip J. Wirel. Commun. Netw. 2021, 2021, 31. [Google Scholar] [CrossRef]
- Guo, L.L.; Pfohl, S.R.; Fries, J.; Posada, J.; Fleming, S.L.; Aftandilian, C.; Shah, N.; Sung, L. Systematic review of approaches to preserve machine learning performance in the presence of temporal dataset shift in clinical medicine. Appl. Clin. Inform. 2021, 12, 808–815. [Google Scholar] [CrossRef] [PubMed]
- Kamiran, F.; Calders, T. Data preprocessing techniques for classification without discrimination. Knowl. Inf. Syst. 2011, 33, 1–33. [Google Scholar] [CrossRef]
- Müller, E.; Assent, I.; Günnemann, S.; Seidl, T.; Dy, J. MultiClust special issue on discovering, summarizing and using multiple clusterings. Mach. Learn. 2015, 98, 1–5. [Google Scholar] [CrossRef]
- Da Silva, G.R.; Albertini, M.K. Using multiple clustering algorithms to generate constraint rules and create consensus clusters. In Proceedings of the 2017 Brazilian Conference on Intelligent Systems (BRACIS), Uberlândia, Brazil, 2–5 October 2017; pp. 312–317. [Google Scholar]
- Ezugwu, A.E.; Ikotun, A.M.; Oyelade, O.O.; Abualigah, L.; Agushaka, J.O.; Eke, C.I.; Akinyelu, A.A. A comprehensive survey of clustering algorithms: State-of-the-art machine learning applications, taxonomy, challenges, and future research prospects. Eng. Appl. Artif. Intell. 2022, 110, 104743. [Google Scholar] [CrossRef]
- Aadil, F.; Raza, A.; Khan, M.F.; Maqsood, M.; Mehmood, I.; Rho, S. Energy aware cluster-based routing in flying ad-hoc networks. Sensors 2018, 18, 1413. [Google Scholar] [CrossRef]
- Aadil, F.; Ahsan, W.; Rehman, Z.U.; Shah, P.A.; Rho, S.; Mehmood, I. Clustering algorithm for internet of vehicles (IoV) based on dragonfly optimizer (CAVDO). J. Supercomput. 2018, 74, 4542–4567. [Google Scholar] [CrossRef]
- Nweke, H.F.; Teh, Y.W.; Mujtaba, G.; Al-Garadi, M.A. Data fusion and multiple classifier systems for human activity detection and health monitoring: Review and open research directions. Inf. Fusion 2019, 46, 147–170. [Google Scholar] [CrossRef]
- Prabono, A.G.; Yahya, B.N.; Lee, S.L. Multiple-instance domain adaptation for cost-effective sensor-based human activity recognition. Future Gener. Comput. Syst. 2022, 133, 114–123. [Google Scholar] [CrossRef]
- Al-Shaqi, R.; Mourshed, M.; Rezgui, Y. Progress in ambient assisted systems for independent living by the elderly. SpringerPlus 2016, 5, 624. [Google Scholar] [CrossRef] [PubMed]
- Nahavandi, D.; Alizadehsani, R.; Khosravi, A.; Acharya, U.R. Application of artificial intelligence in wearable devices: Opportunities and challenges. Comput. Methods Programs Biomed. 2022, 213, 106541. [Google Scholar] [CrossRef] [PubMed]
- Cooper, S.; Di Fava, A.; Vivas, C.; Marchionni, L.; Ferro, F. ARI: The social assistive robot and companion. In Proceedings of the 2020 29th IEEE International Conference on Robot and Human Interactive Communication (RO-MAN), Naples, Italy, 31 August–4 September 2020; pp. 745–751. [Google Scholar]
- Kivrak, H.; Cakmak, F.; Kose, H.; Yavuz, S. Social navigation framework for assistive robots in human inhabited unknown environments. Eng. Sci. Technol. Int. J. 2021, 24, 284–298. [Google Scholar] [CrossRef]
- Rodomagoulakis, I.; Kardaris, N.; Pitsikalis, V.; Mavroudi, E.; Katsamanis, A.; Tsiami, A.; Maragos, P. Multimodal human action recognition in assistive human-robot interaction. In Proceedings of the 2016 IEEE International Conference on Acoustics, Speech and Signal Processing (ICASSP), Shanghai, China, 20–25 March 2016; pp. 2702–2706. [Google Scholar] [CrossRef]


| Notation | Description |
|---|---|
| N | total number of samples |
| M | total number of clusters |
| j-th data point, | |
| j = 1,…, N | |
| m-th cluster, | |
| m = 1,…, M | |
| number of data points | |
| assigned to cluster | |
| data point assigned to , | |
| centroid of cluster | |
| centroid of all clusters | |
| the weights vector of the m-th | |
| output neuron | |
| the distance between x and y | |
| obtained with | |
| metrics, | |
| minimum distance between x and y | |
| absolute value of • | |
| Euclidean distance |
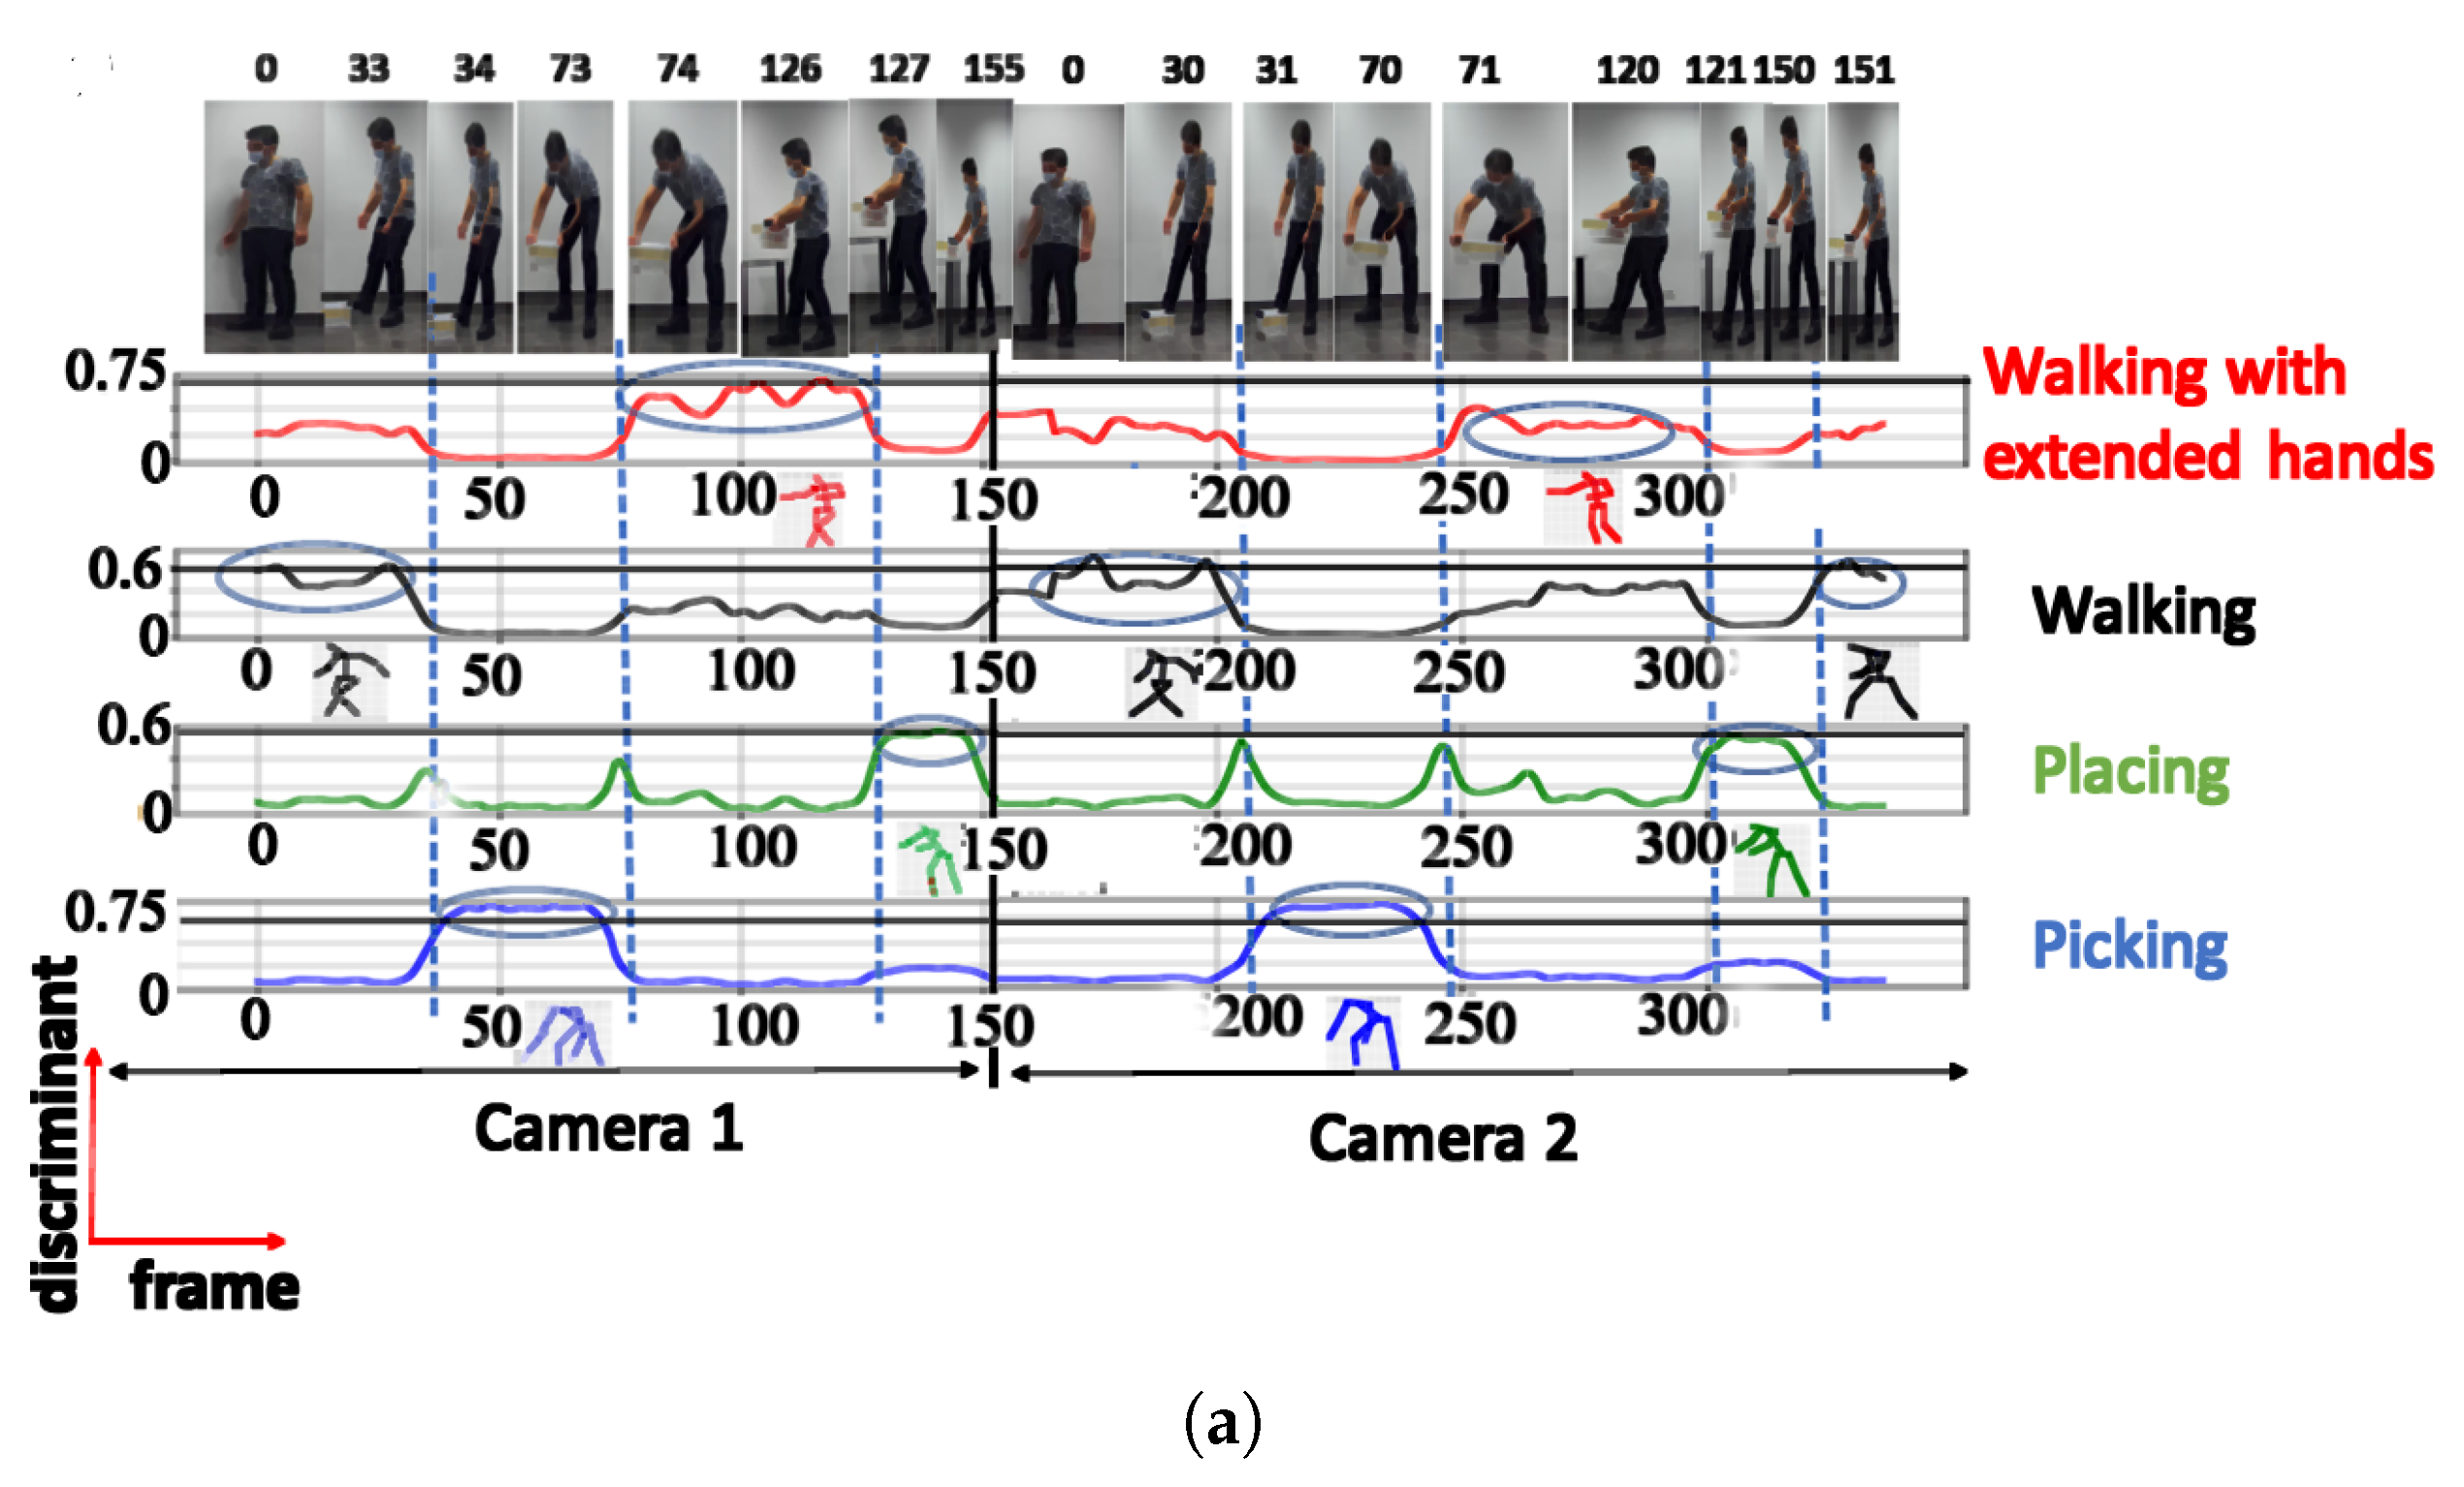
| Activity | Number of Clusters | Semantic Meaning | Max DS |
|---|---|---|---|
| Training activity (TA) | 3 | Walking | 0.81 |
| Picking | 0.97 | ||
| Walking with extended hands | 0.78 | ||
| 4 | Walking | 0.71 | |
| Picking | 0.90 | ||
| Walking with extended hands | 0.78 | ||
| Placing | 0.60 | ||
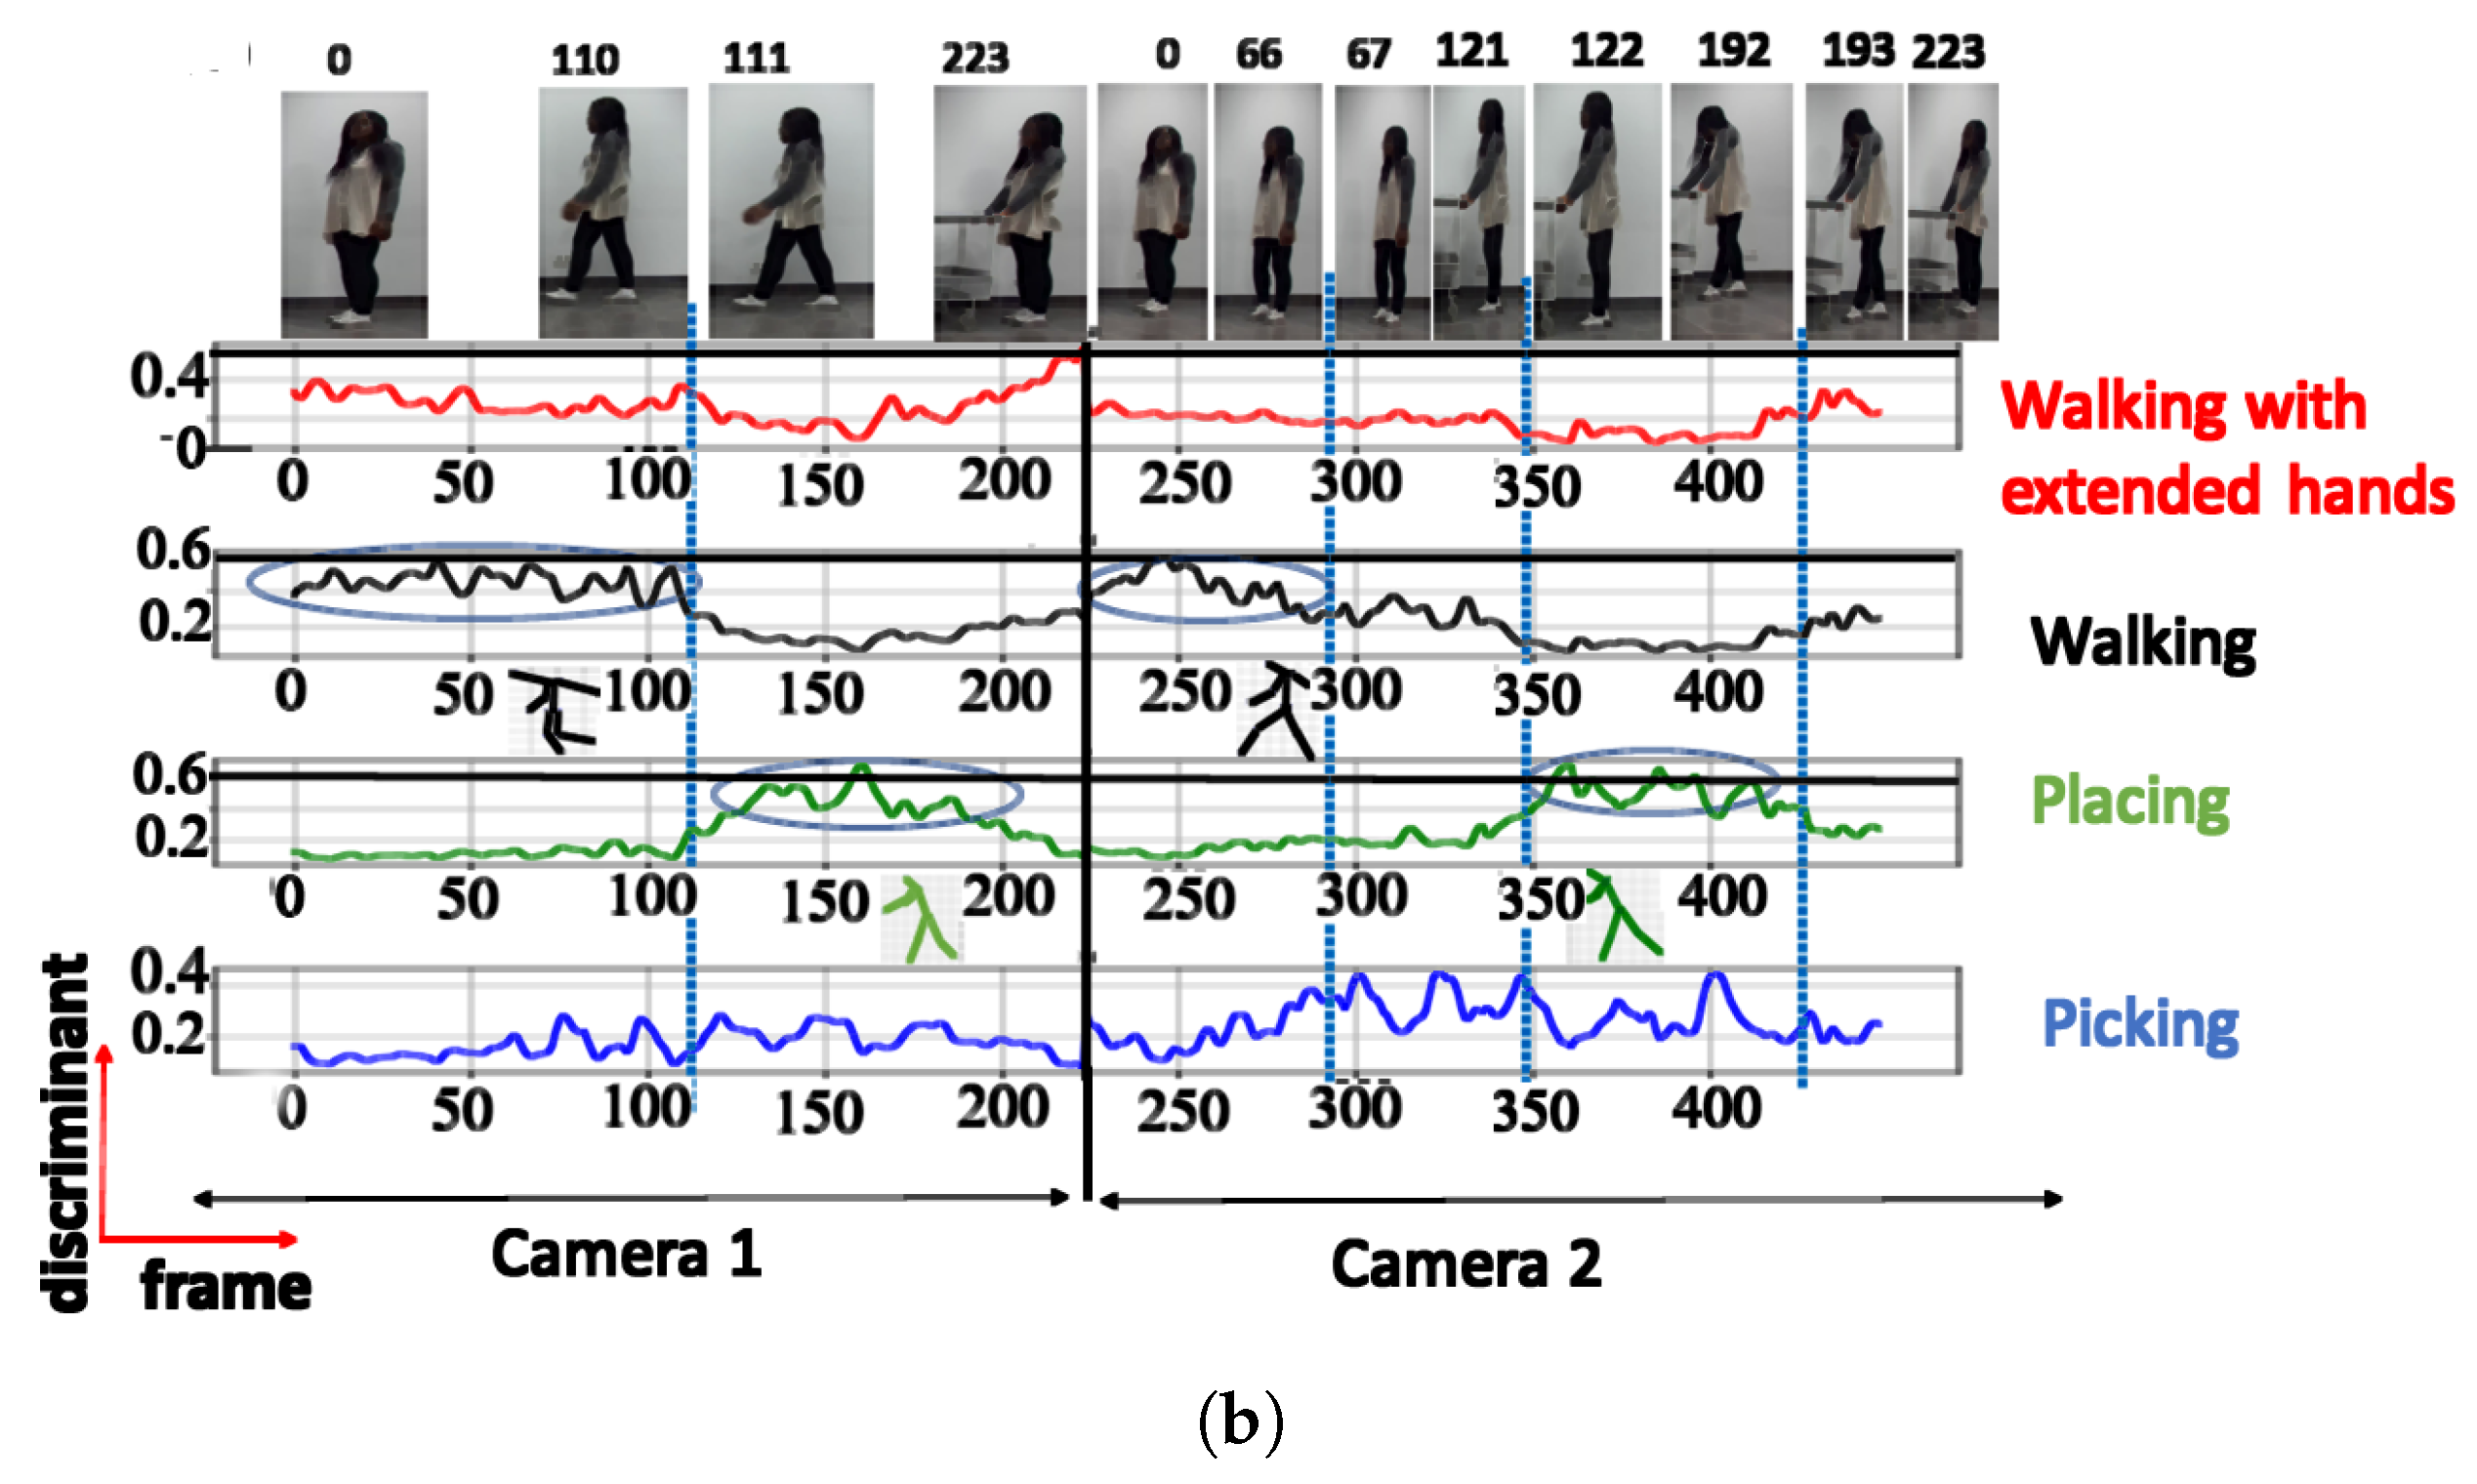
| 5 | Walking | 0.61 | |
| Squatting | 0.44 | ||
| Picking | 0.84 | ||
| Walking with extended hands | 0.63 | ||
| Placing | 0.64 | ||
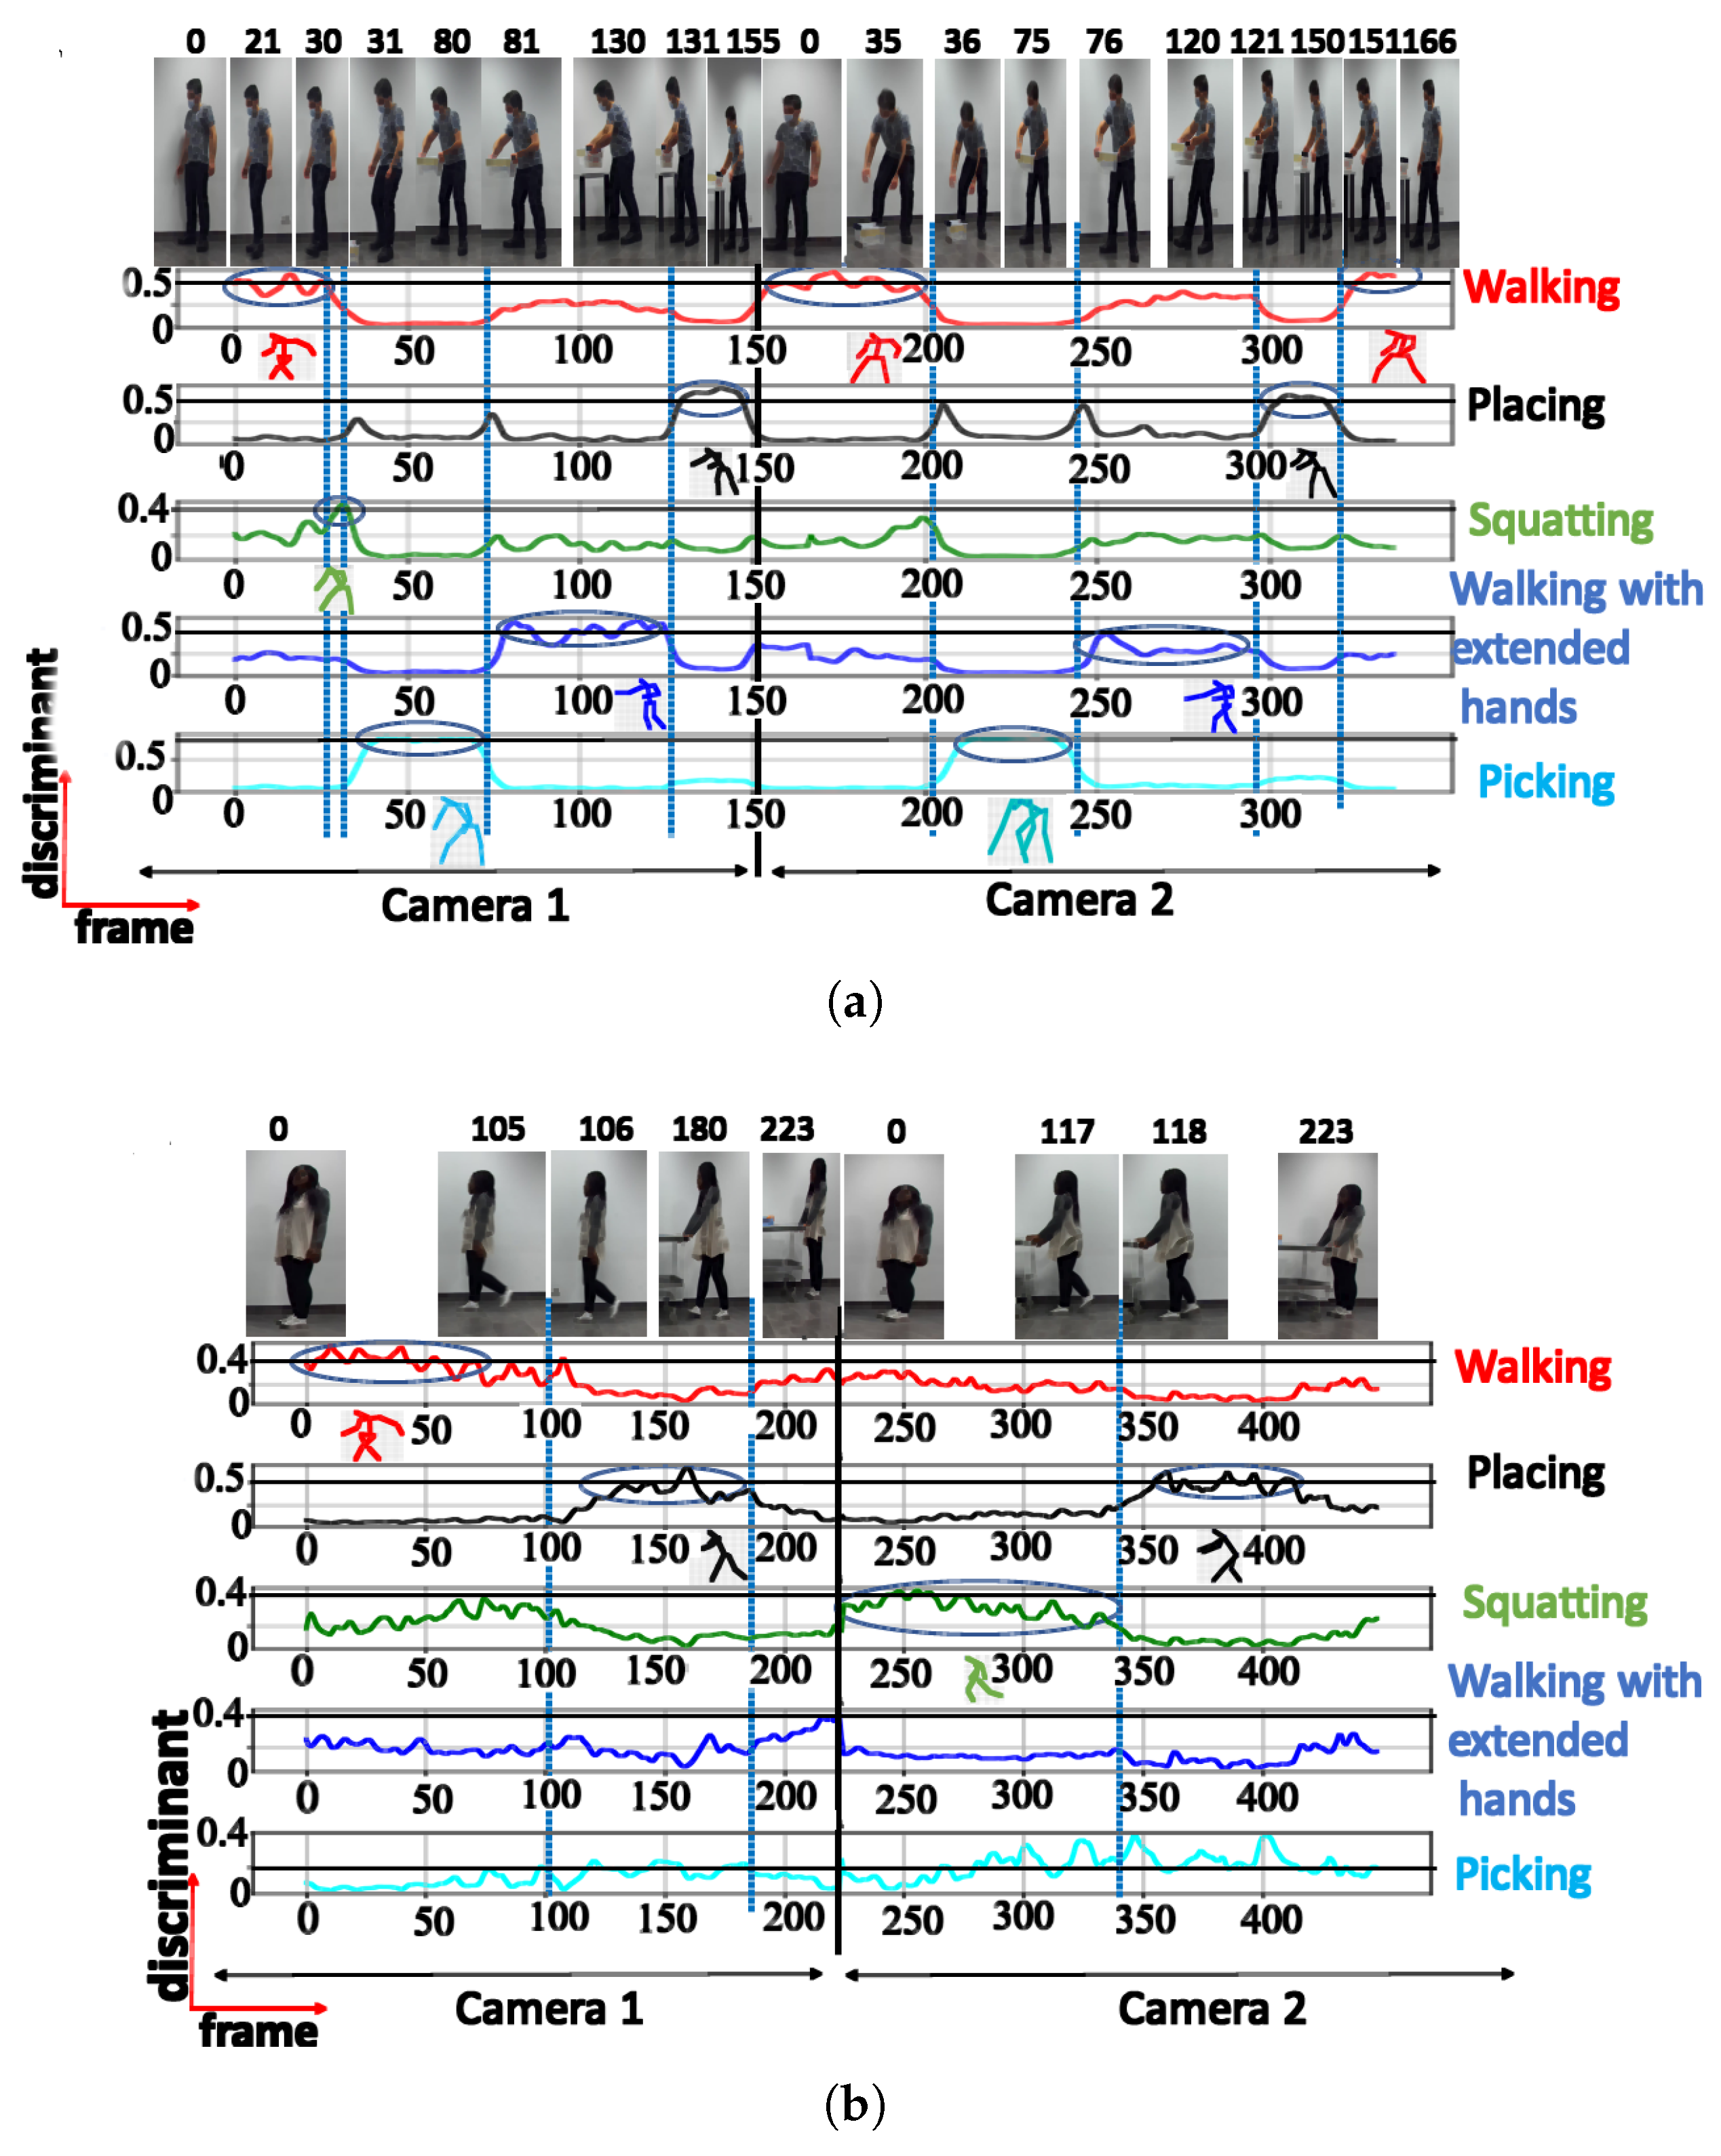
| 6 | Walking | 0.66 | |
| Picking | 0.82 | ||
| Walking with extended hands | 0.70 | ||
| Placing | 0.59 | ||
| Unknown posture | 0.32 | ||
| Unknown posture | 0.39 | ||
| Non-training activity (UA) | 3 | Walking | 0.60 |
| Picking | 0.84 | ||
| Walking with extended hands | 0.65 | ||
| 4 | Walking | 0.59 | |
| Picking | 0.44 | ||
| Walking with extended hands | 0.56 | ||
| Placing | 0.68 | ||
| 5 | Walking | 0.54 | |
| Squatting | 0.43 | ||
| Picking | 0.38 | ||
| Walking with extended hands | 0.42 | ||
| Placing | 0.65 | ||
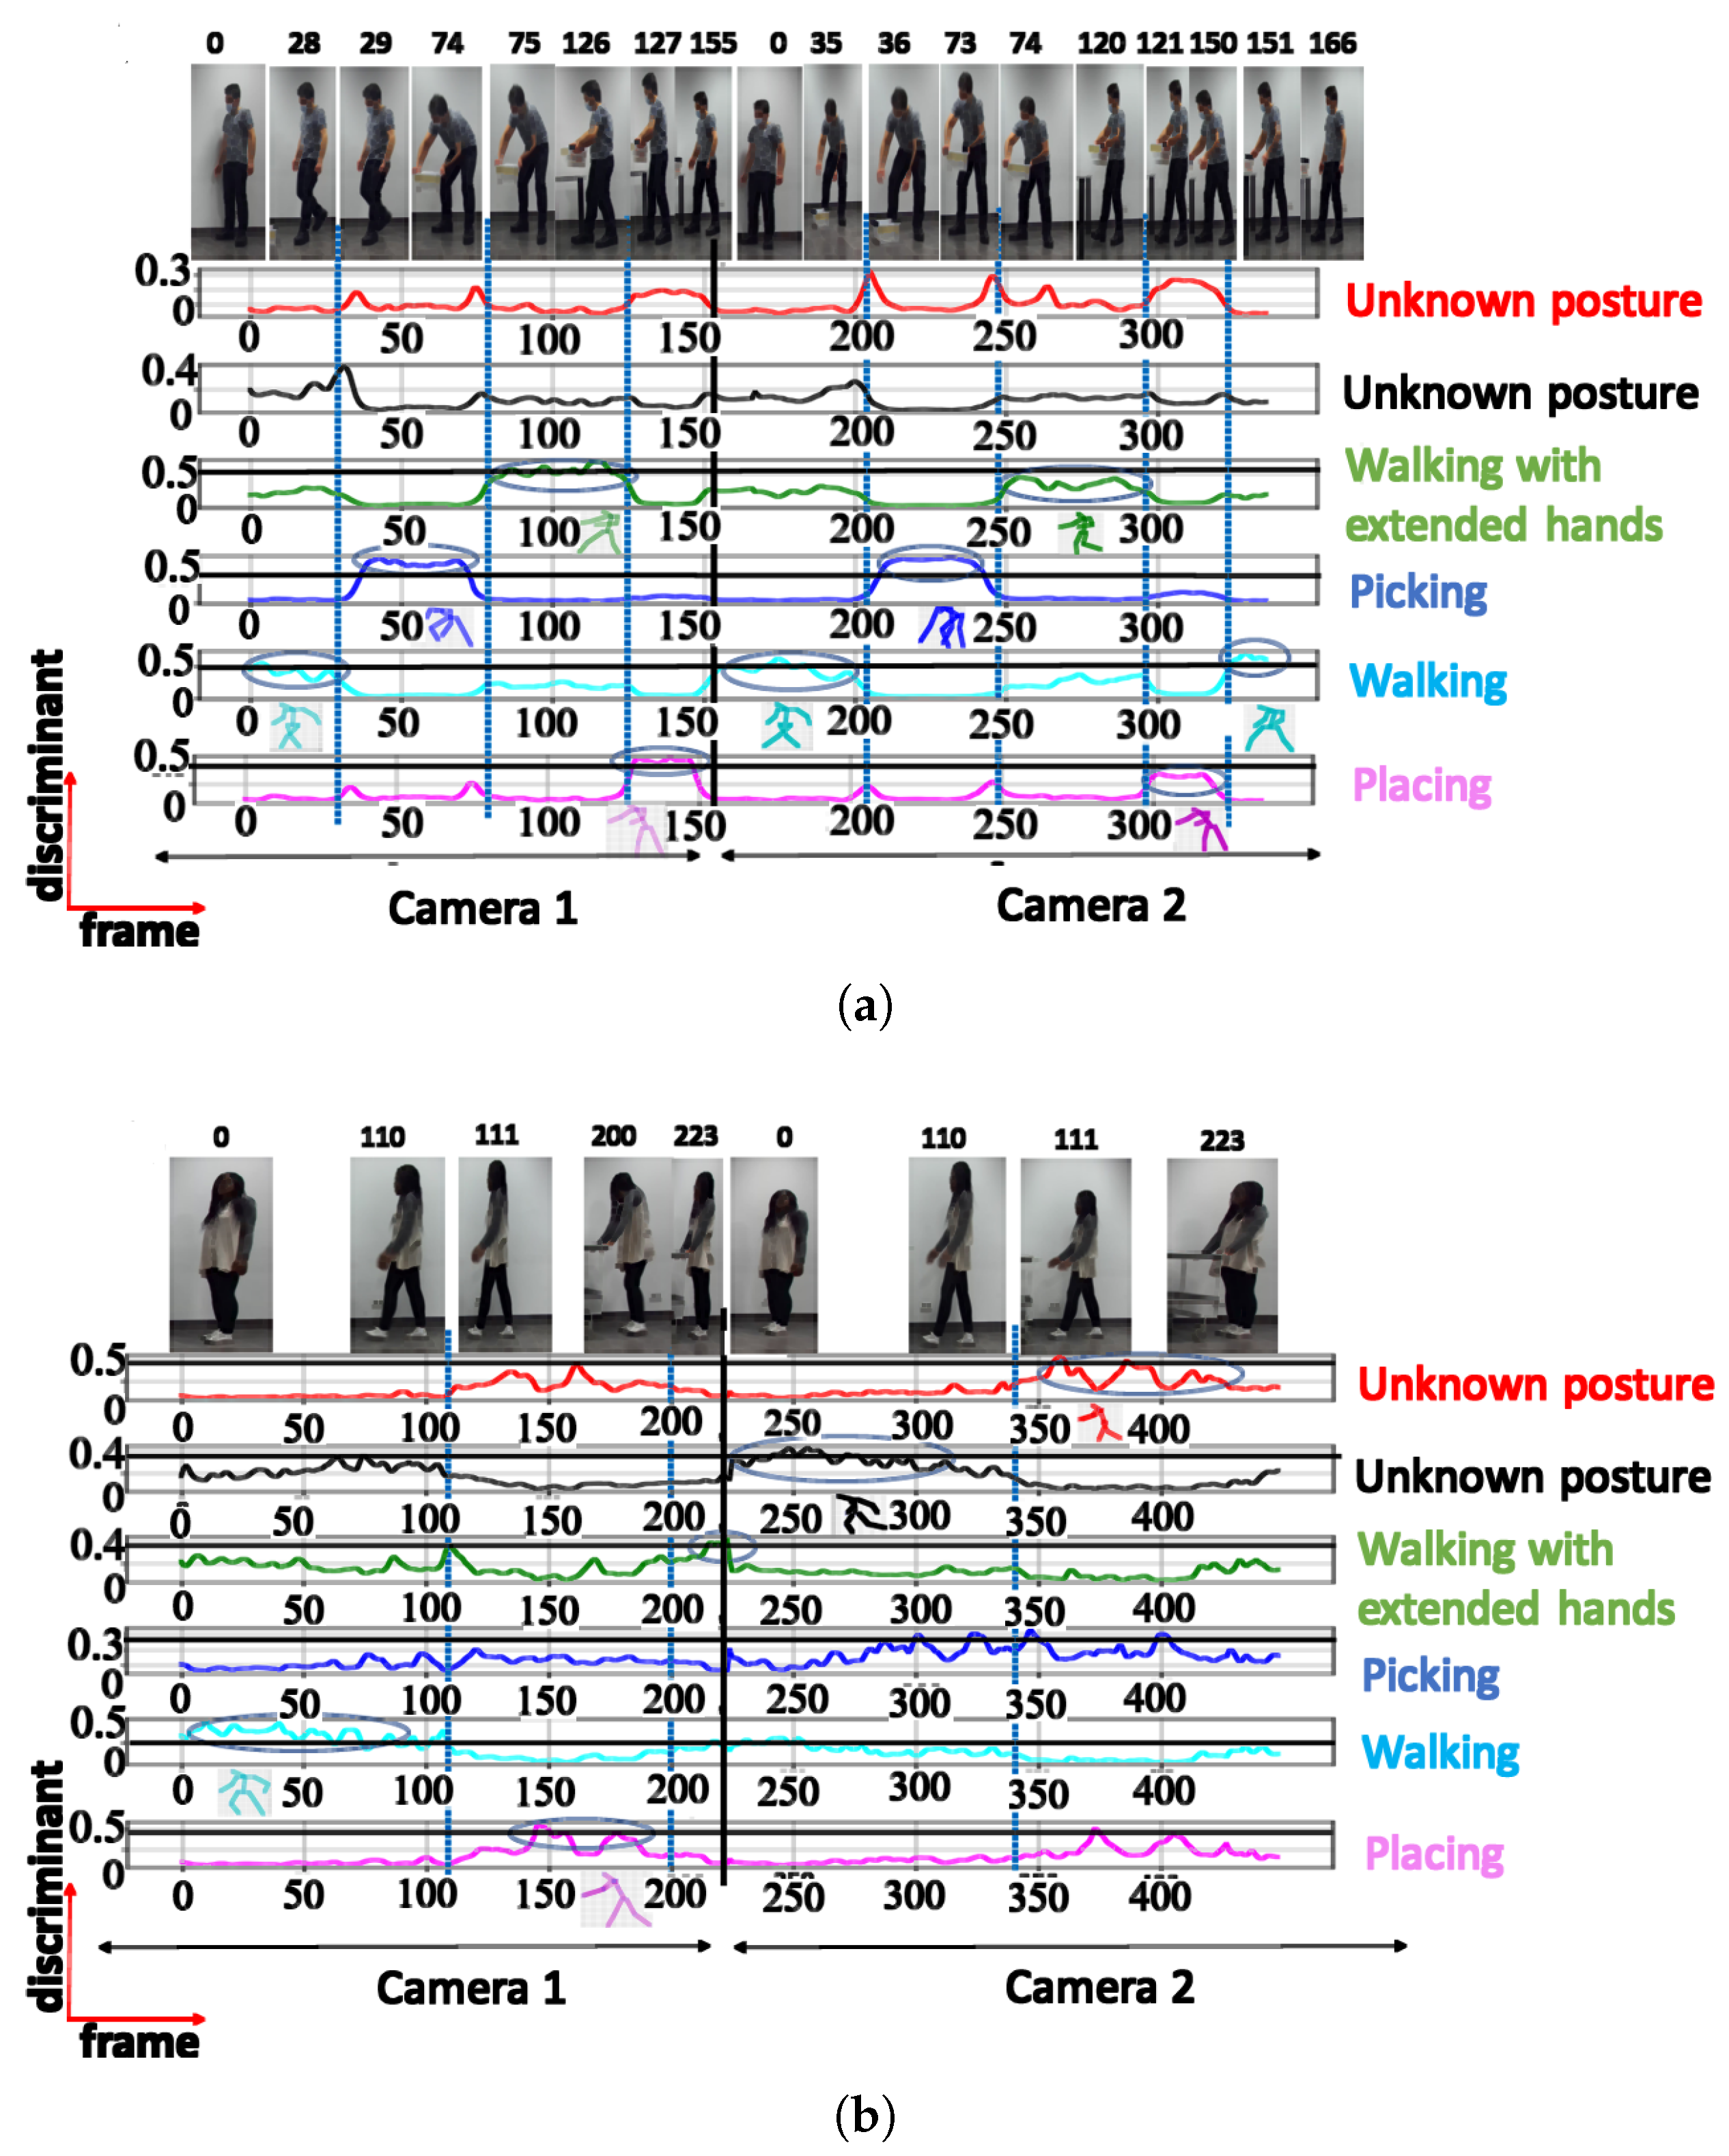
| 6 | Walking | 0.48 | |
| Picking | 0.32 | ||
| Walking with extended hands | 0.41 | ||
| Placing | 0.56 | ||
| Unknown posture | 0.53 | ||
| Unknown posture | 0.42 |
Disclaimer/Publisher’s Note: The statements, opinions and data contained in all publications are solely those of the individual author(s) and contributor(s) and not of MDPI and/or the editor(s). MDPI and/or the editor(s) disclaim responsibility for any injury to people or property resulting from any ideas, methods, instructions or products referred to in the content. |
© 2023 by the authors. Licensee MDPI, Basel, Switzerland. This article is an open access article distributed under the terms and conditions of the Creative Commons Attribution (CC BY) license (https://creativecommons.org/licenses/by/4.0/).
Share and Cite
Ekemeyong Awong, L.E.; Zielinska, T. Comparative Analysis of the Clustering Quality in Self-Organizing Maps for Human Posture Classification. Sensors 2023, 23, 7925. https://doi.org/10.3390/s23187925
Ekemeyong Awong LE, Zielinska T. Comparative Analysis of the Clustering Quality in Self-Organizing Maps for Human Posture Classification. Sensors. 2023; 23(18):7925. https://doi.org/10.3390/s23187925
Chicago/Turabian StyleEkemeyong Awong, Lisiane Esther, and Teresa Zielinska. 2023. "Comparative Analysis of the Clustering Quality in Self-Organizing Maps for Human Posture Classification" Sensors 23, no. 18: 7925. https://doi.org/10.3390/s23187925
APA StyleEkemeyong Awong, L. E., & Zielinska, T. (2023). Comparative Analysis of the Clustering Quality in Self-Organizing Maps for Human Posture Classification. Sensors, 23(18), 7925. https://doi.org/10.3390/s23187925