
Cortical Response Variation with Social and Non-Social Affective Touch Processing in the Glabrous and Hairy Skin of the Leg: A Pilot fMRI Study


Abstract
:1. Introduction
2. Methods
2.1. Study Participants
2.2. Experimental Design and Stimuli
2.3. Functional MRI Scanning Parameters
2.4. Functional Data Preprocessing Pipeline and Statistical Analysis
2.5. Evaluation of Subjective Perception of Pleasantness and Ticklishness of the Stimuli Presented during fMRI
3. Results
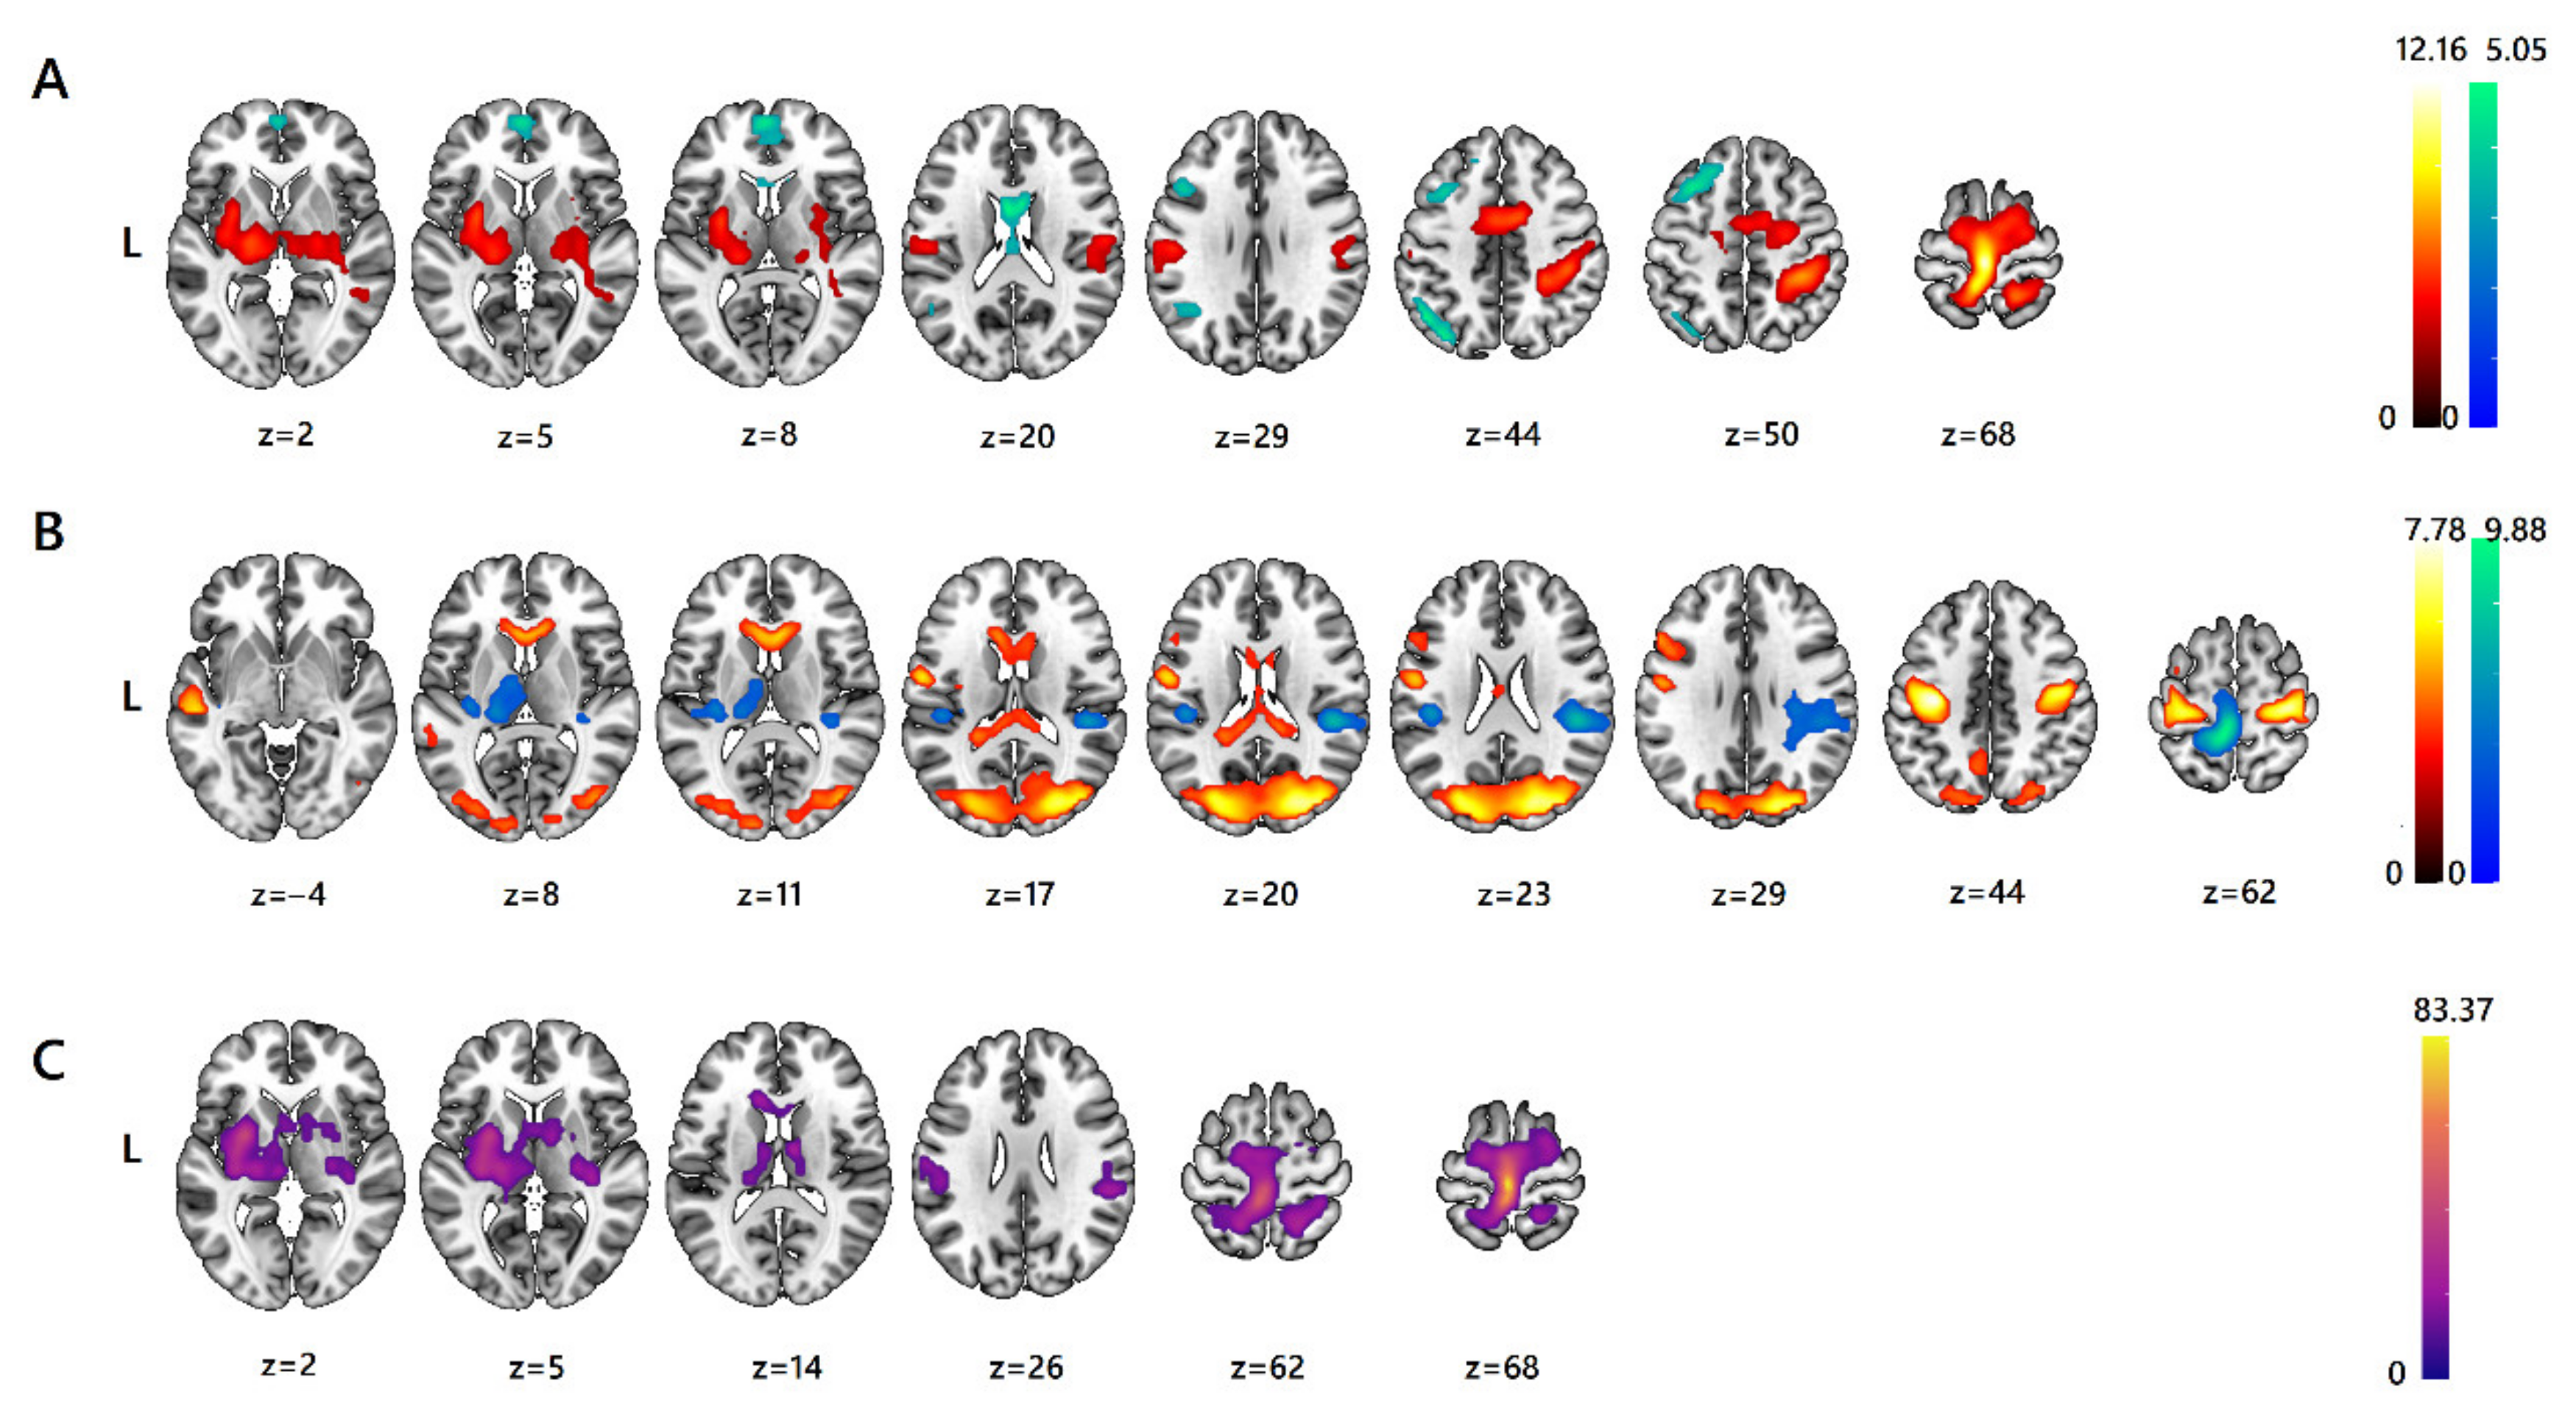
3.1. fMRI ANOVA
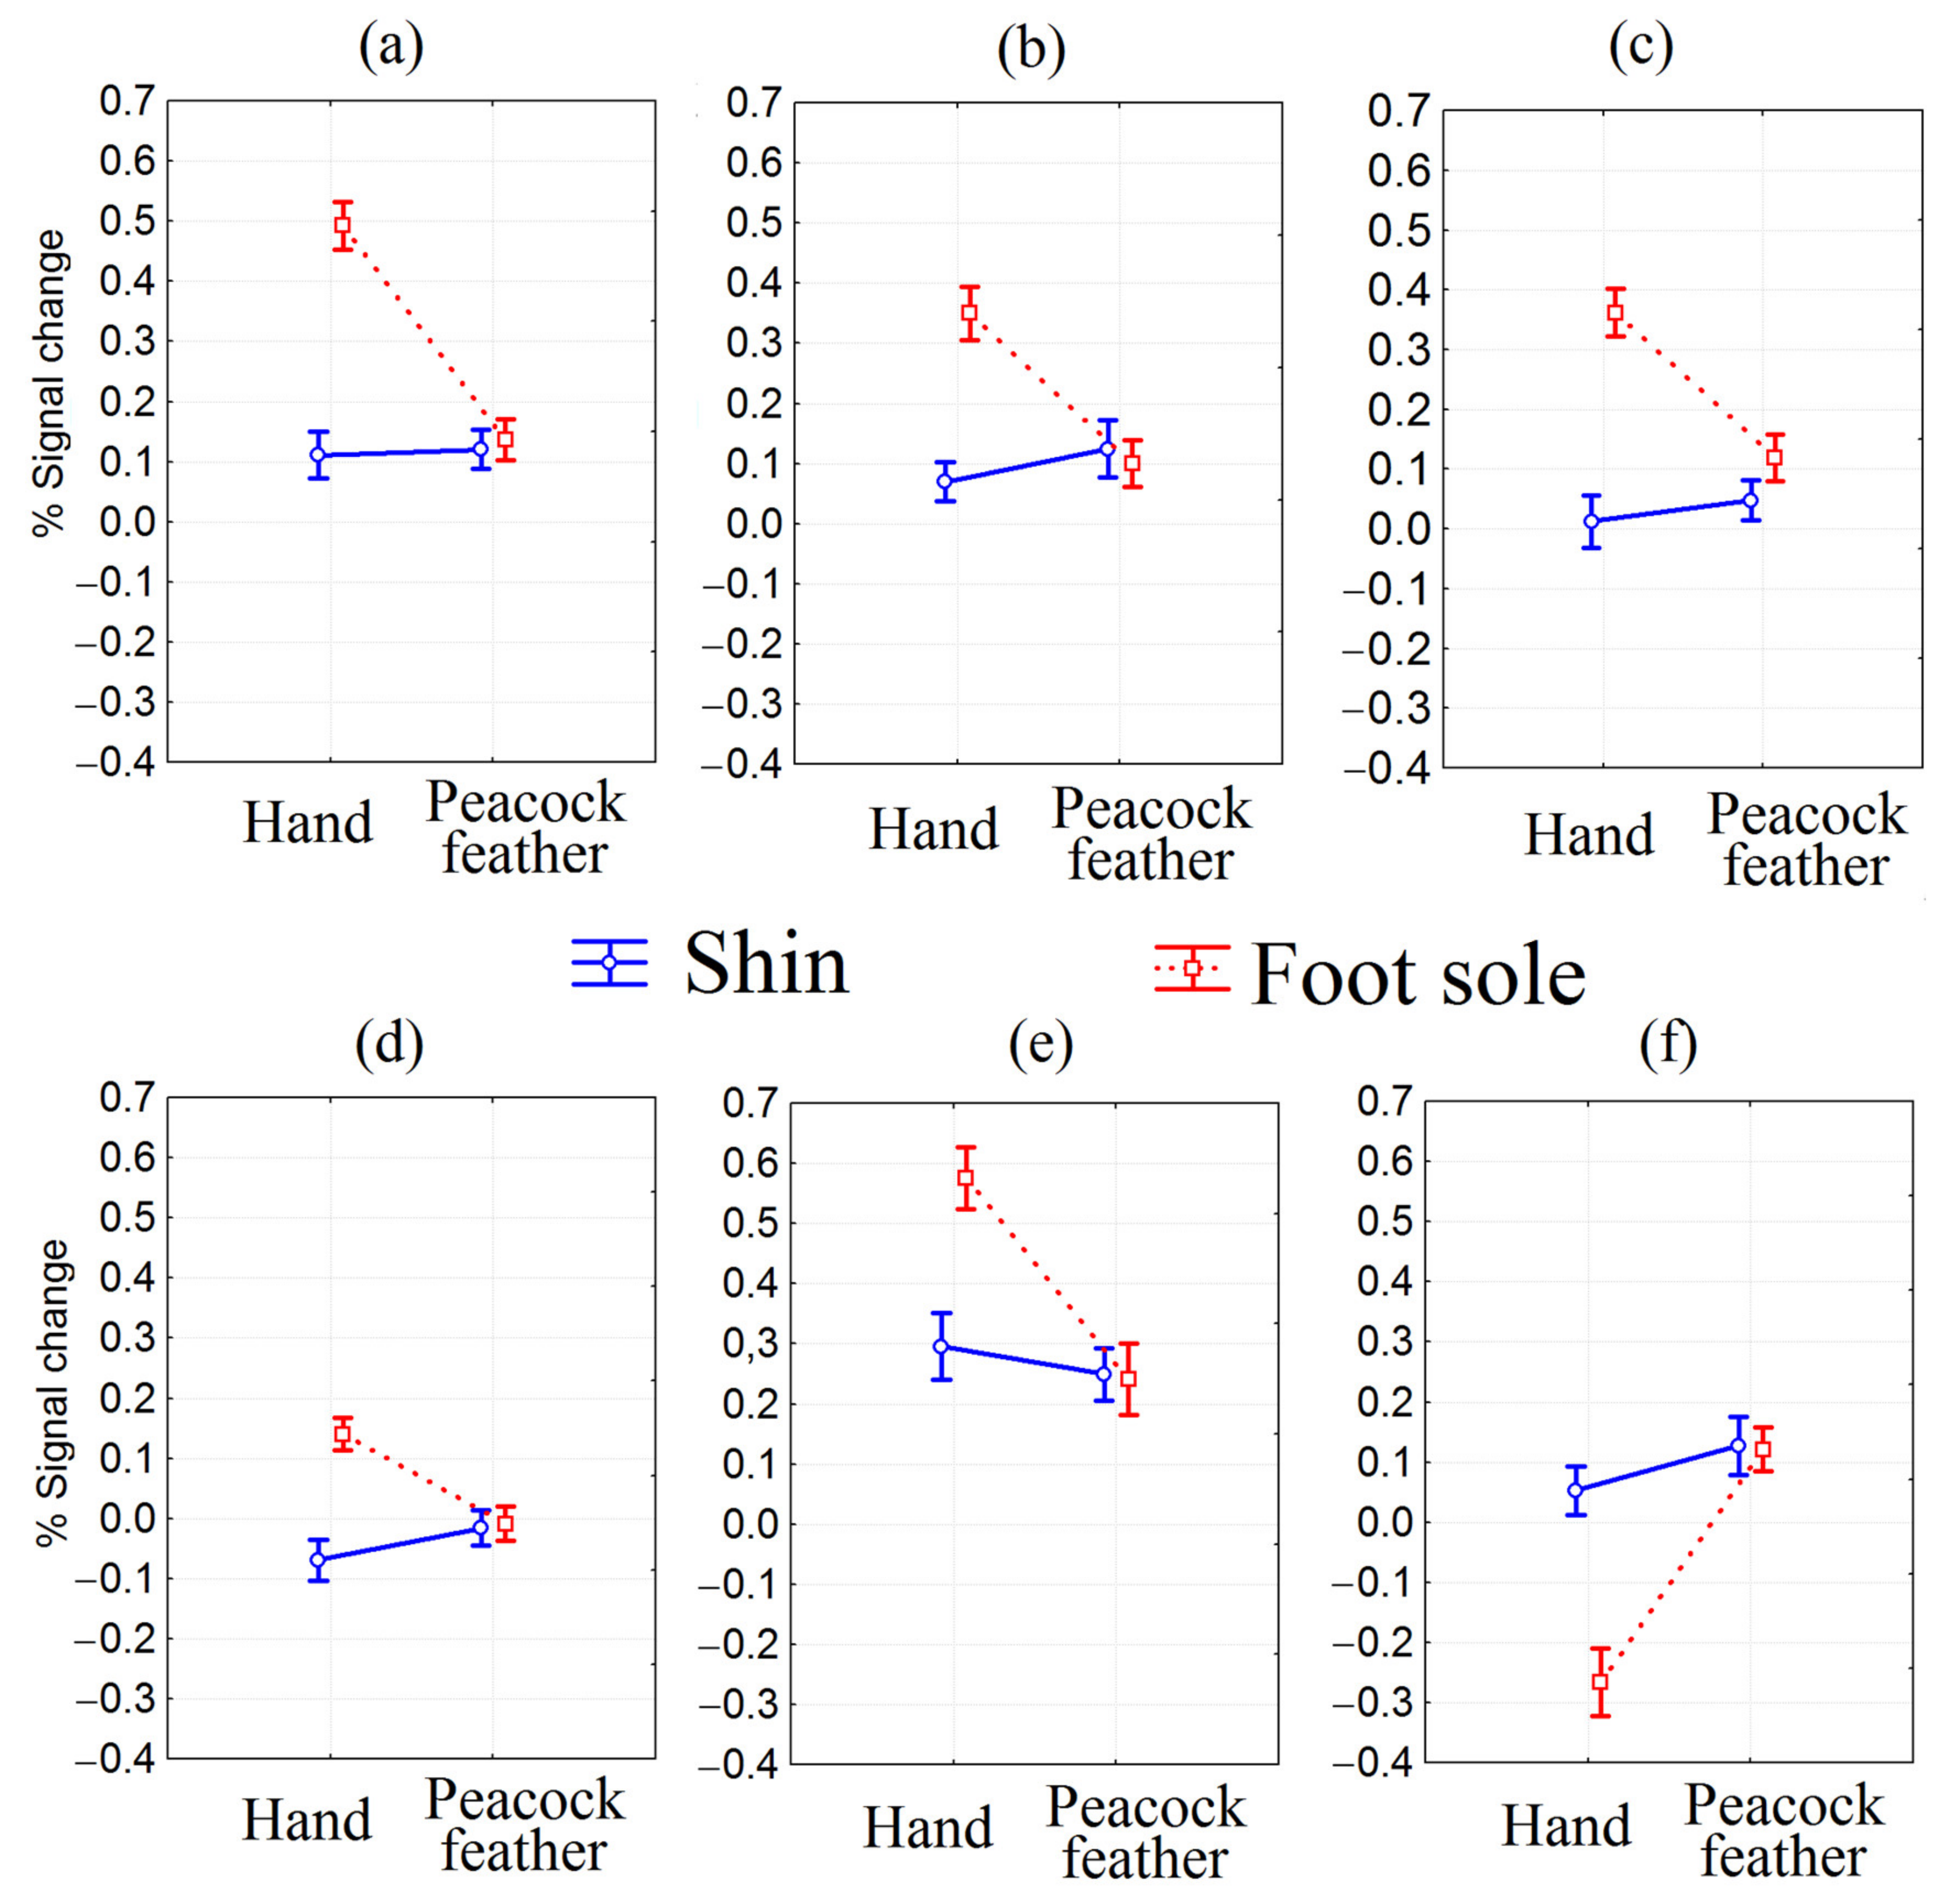
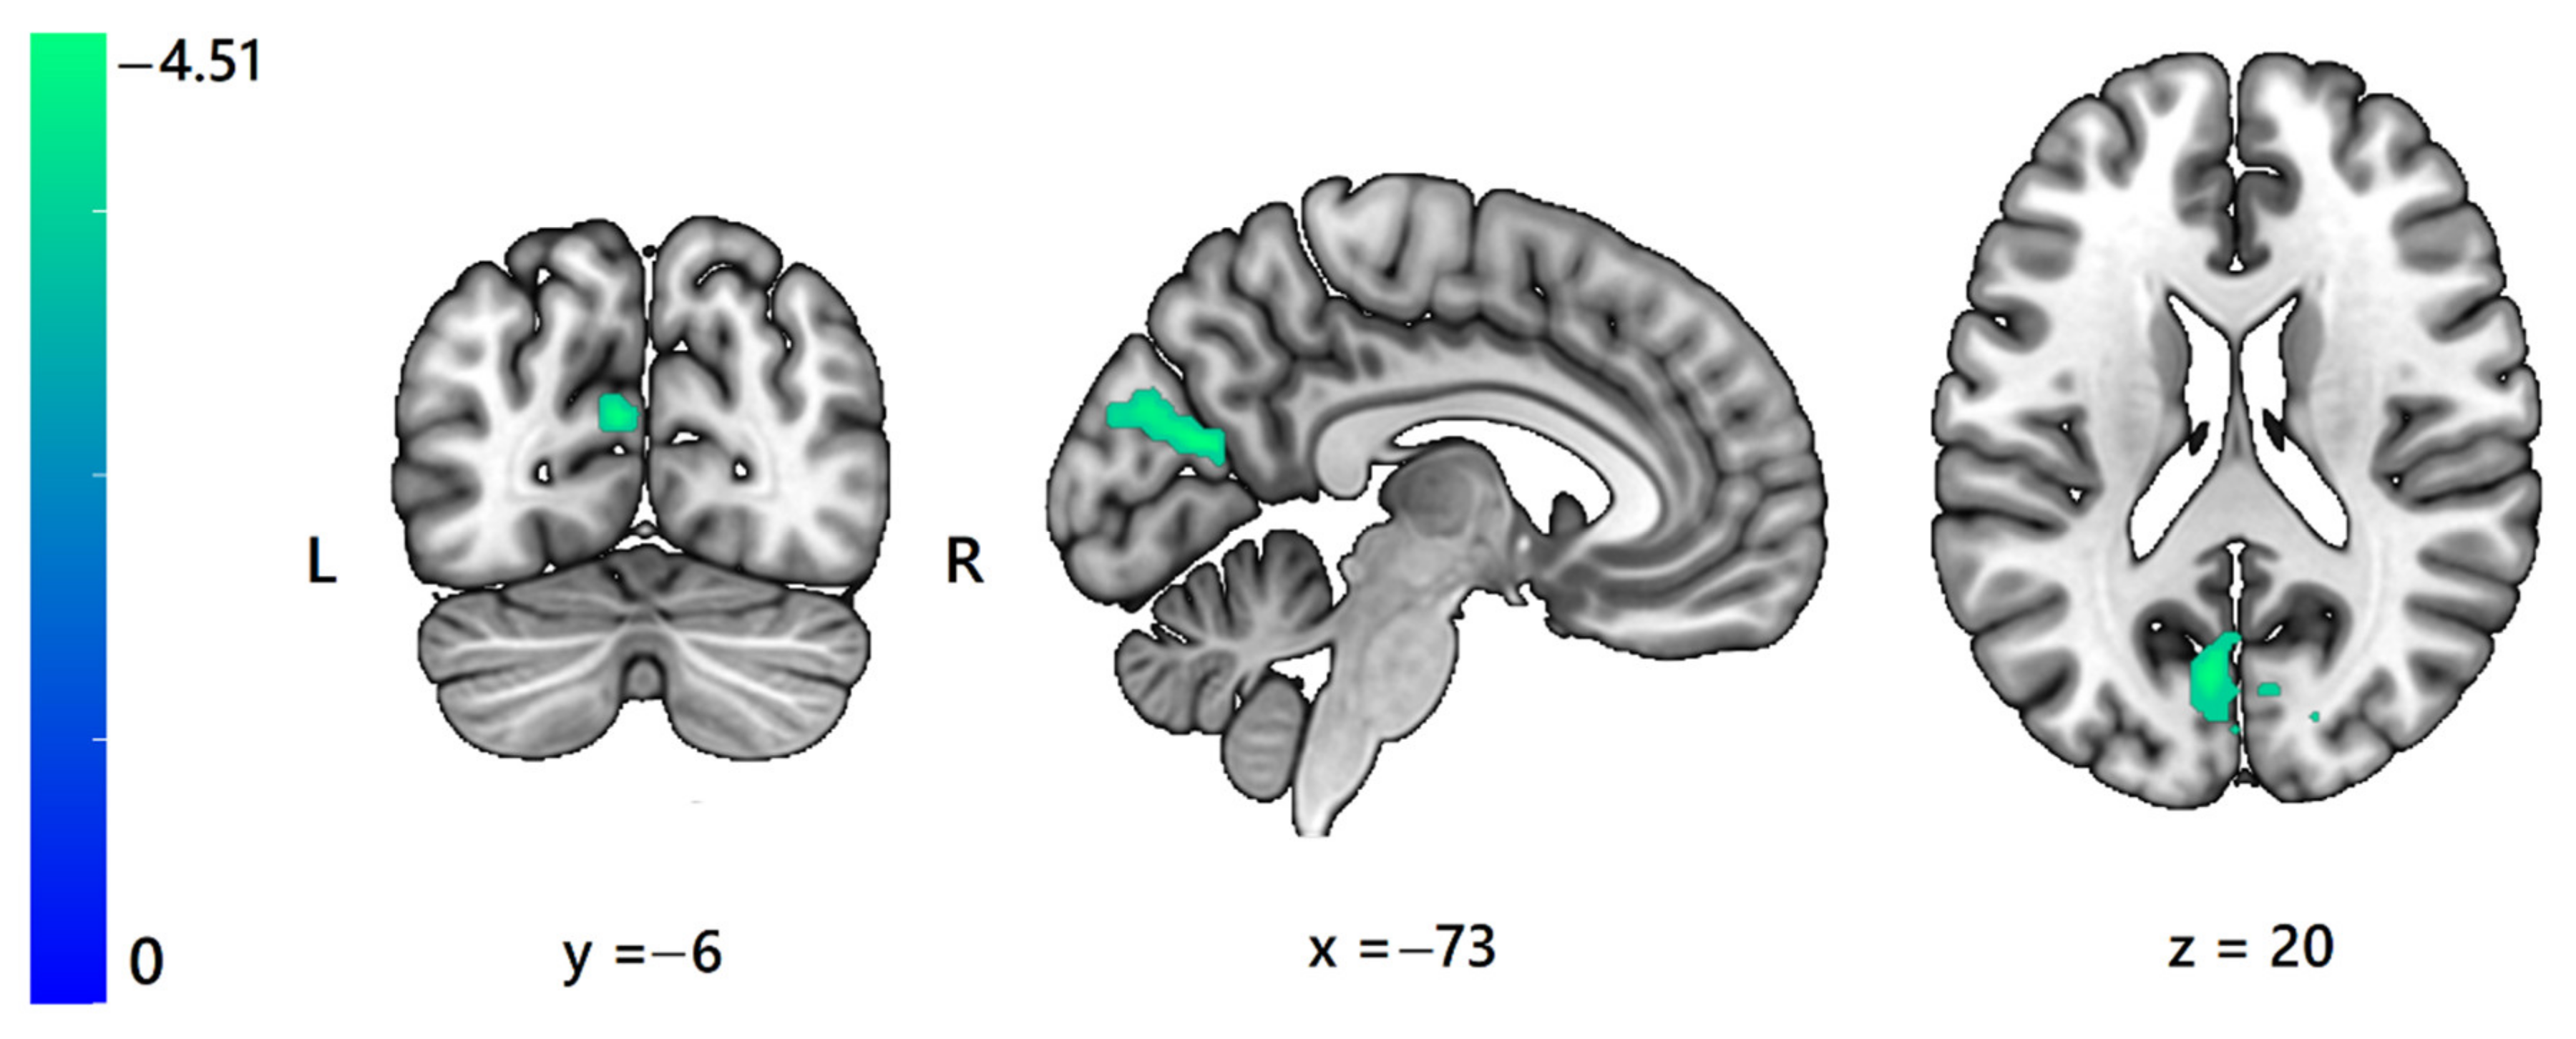
3.2. Correlation of BOLD-Signal with Subjective Stimuli Assessment
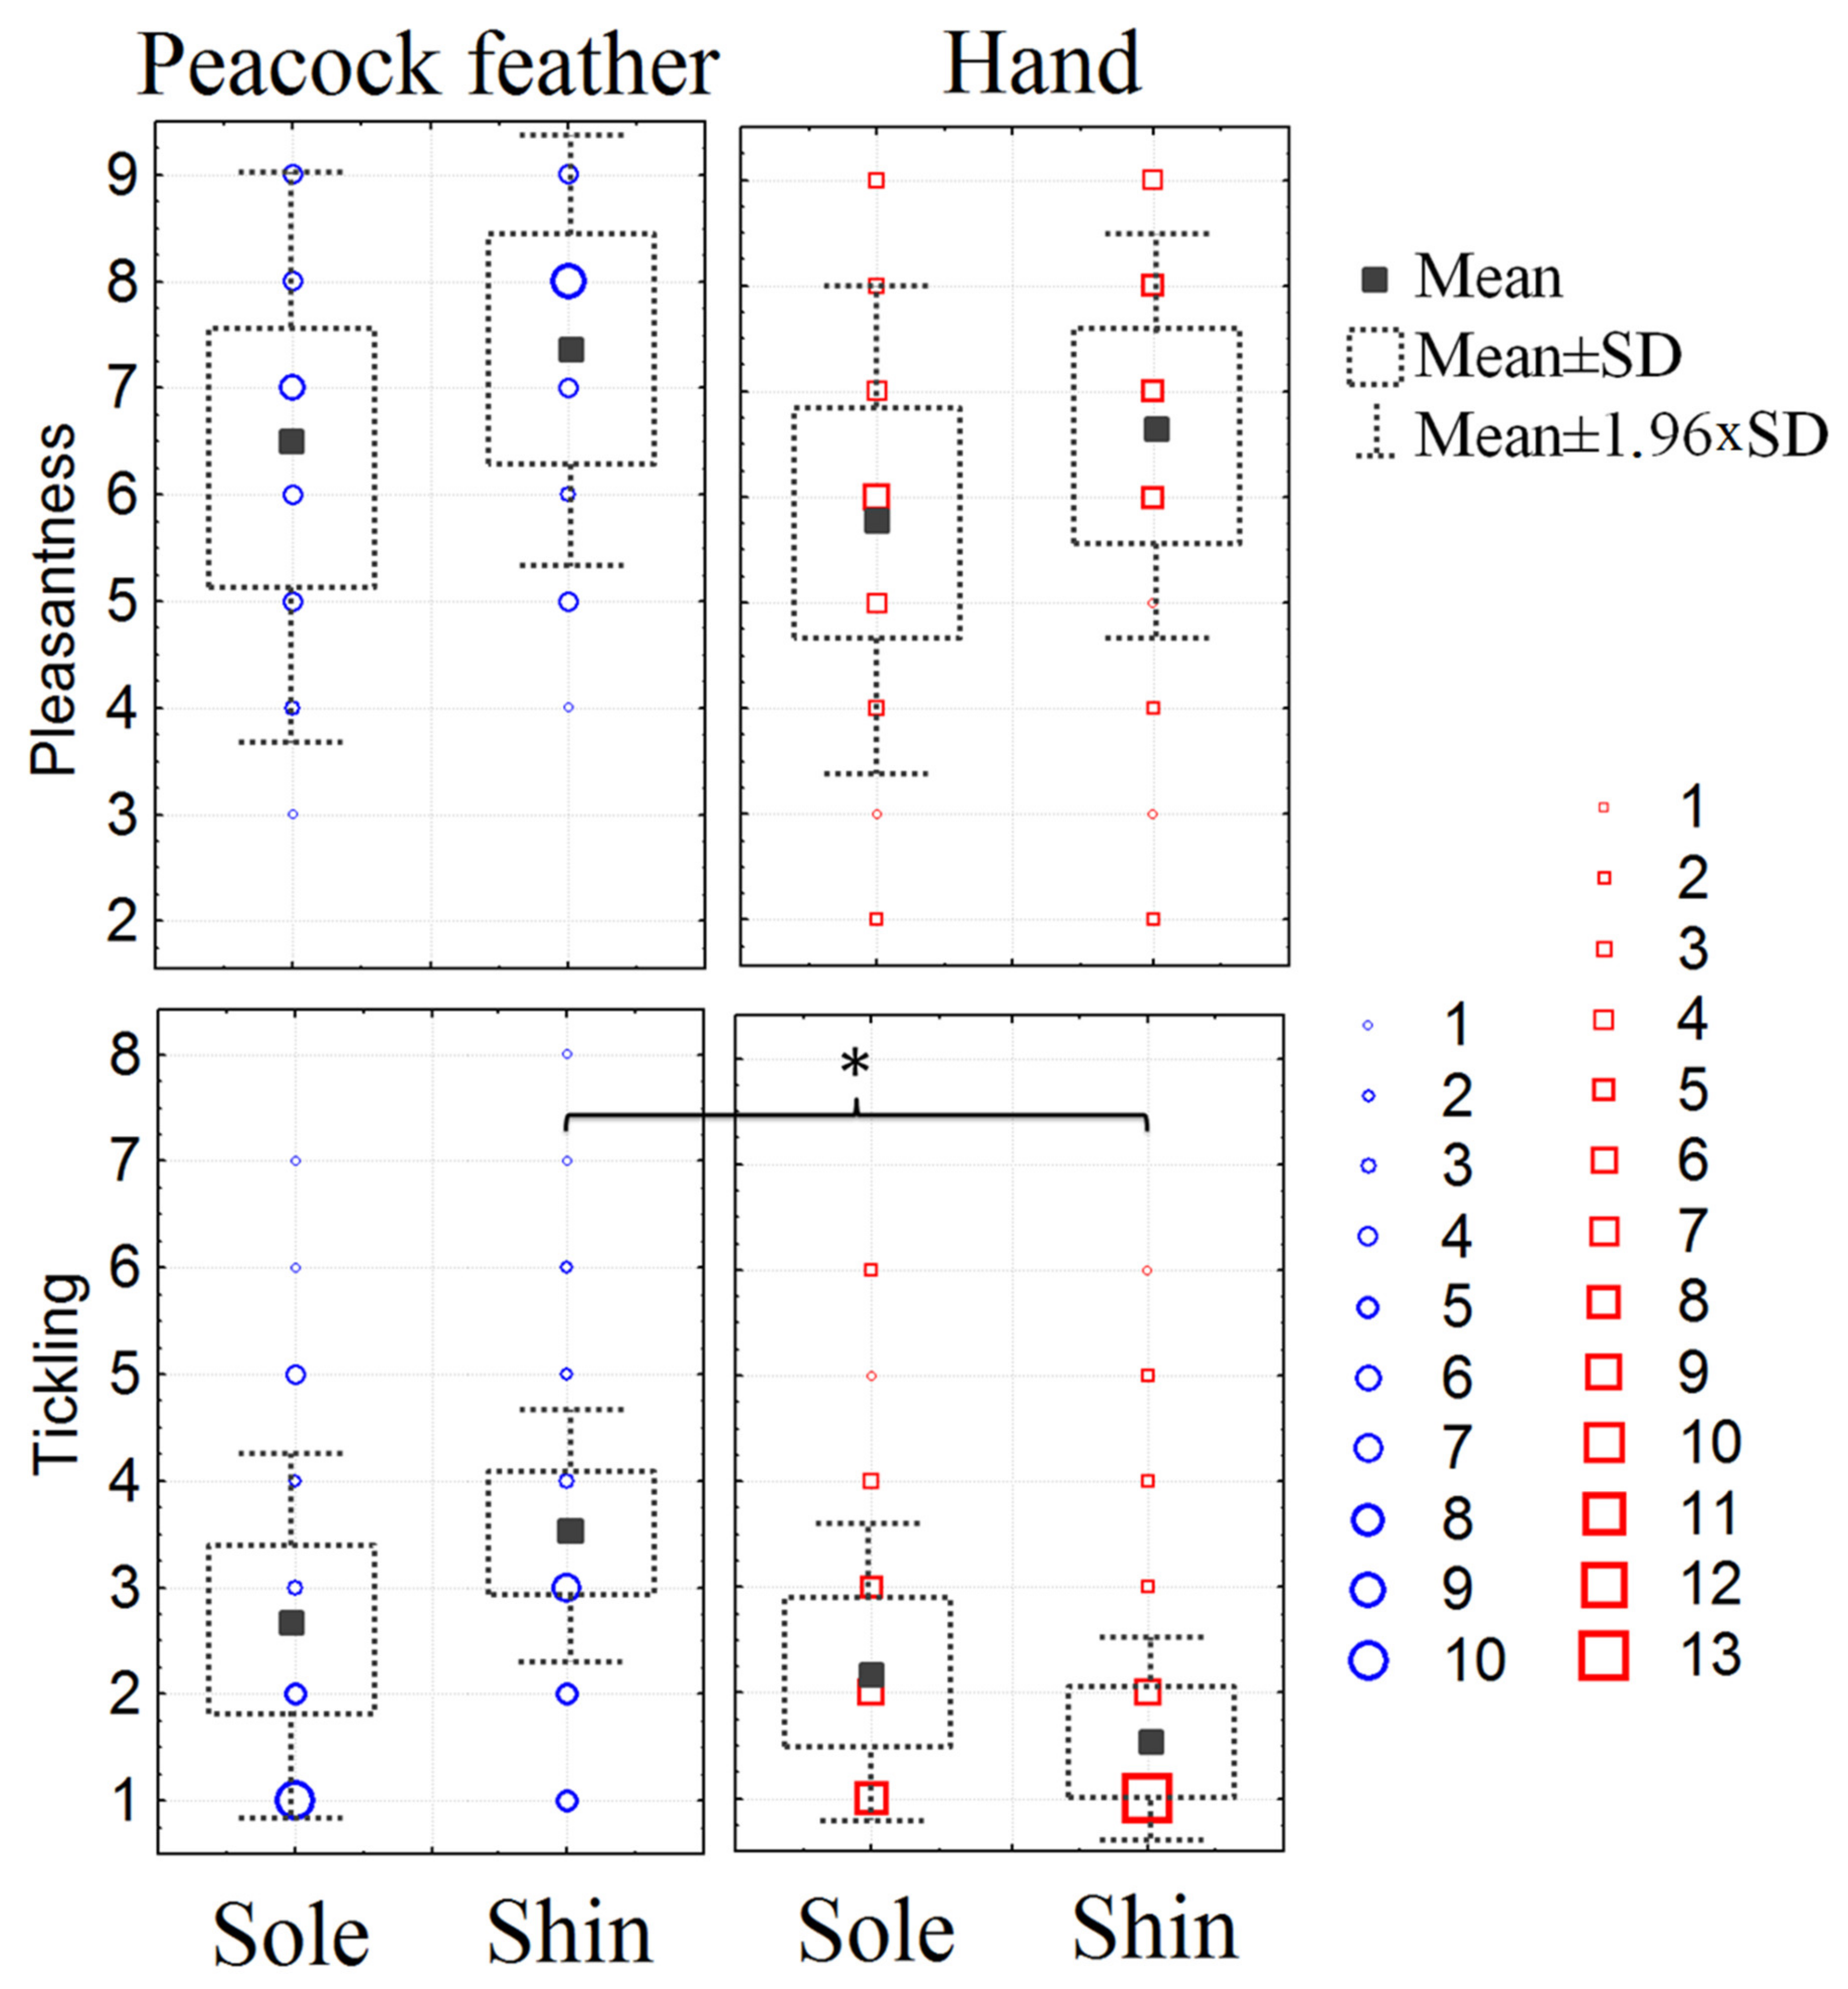
3.3. Subjective Perception of Pleasantness and Ticklishness of the Stimuli Presented during fMRI
4. Discussion
4.1. Stimulation Area
4.2. Stimulus Type
4.3. Interaction of Factors
4.4. Subjective Perception of Pleasantness and Ticklishness of the Stimuli
5. Limitations
6. Conclusions
Author Contributions
Funding
Institutional Review Board Statement
Informed Consent Statement
Data Availability Statement
Conflicts of Interest
References
- McGlone, F.; Wessberg, J.; Olausson, H. Discriminative and Affective Touch: Sensing and Feeling. Neuron 2014, 82, 737–755. [Google Scholar] [CrossRef] [PubMed]
- Löken, L.S.; Wessberg, J.; Morrison, I.; McGlone, F.; Olausson, H. Coding of Pleasant Touch by Unmyelinated Afferents in Humans. Nat. Neurosci. 2009, 12, 547–548. [Google Scholar] [CrossRef]
- Gordon, I.; Voos, A.C.; Bennett, R.H.; Bolling, D.Z.; Pelphrey, K.A.; Kaiser, M.D. Brain Mechanisms for Processing Affective Touch. Hum. Brain Mapp. 2013, 34, 914–922. [Google Scholar] [CrossRef]
- Olausson, H.; Wessberg, J.; Morrison, I.; McGlone, F.; Vallbo, Å. The Neurophysiology of Unmyelinated Tactile Afferents. Neurosci. Biobehav. Rev. 2010, 34, 185–191. [Google Scholar] [CrossRef]
- Morrison, I. ALE Meta-Analysis Reveals Dissociable Networks for Affective and Discriminative Aspects of Touch. Hum. Brain Mapp. 2016, 37, 1308–1320. [Google Scholar] [CrossRef]
- Ackerley, R.; Backlund Wasling, H.; Liljencrantz, J.; Olausson, H.; Johnson, R.D.; Wessberg, J. Human C-Tactile Afferents Are Tuned to the Temperature of a Skin-Stroking Caress. J. Neurosci. Off. J. Soc. Neurosci. 2014, 34, 2879–2883. [Google Scholar] [CrossRef]
- Georgopoulos, A.P. Functional Properties of Primary Afferent Units Probably Related to Pain Mechanisms in Primate Glabrous Skin. J. Neurophysiol. 1976, 39, 71–83. [Google Scholar] [CrossRef]
- Björnsdotter, M.; Gordon, I.; Pelphrey, K.A.; Olausson, H.; Kaiser, M.D. Development of Brain Mechanisms for Processing Affective Touch. Front. Behav. Neurosci. 2014, 8, 24. [Google Scholar] [CrossRef]
- Voos, A.C.; Pelphrey, K.A.; Kaiser, M.D. Autistic Traits Are Associated with Diminished Neural Response to Affective Touch. Soc. Cogn. Affect. Neurosci. 2013, 8, 378–386. [Google Scholar] [CrossRef]
- Olausson, H.; Lamarre, Y.; Backlund, H.; Morin, C.; Wallin, B.G.; Starck, G.; Ekholm, S.; Strigo, I.; Worsley, K.; Vallbo, B.; et al. Unmyelinated Tactile Afferents Signal Touch and Project to Insular Cortex. Nat. Neurosci. 2002, 5, 900–904. [Google Scholar] [CrossRef]
- Bennett, R.H.; Bolling, D.Z.; Anderson, L.C.; Pelphrey, K.A.; Kaiser, M.D. FNIRS Detects Temporal Lobe Response to Affective Touch. Soc. Cogn. Affect. Neurosci. 2014, 9, 470–476. [Google Scholar] [CrossRef] [PubMed]
- Lindgren, L.; Westling, G.; Brulin, C.; Lehtipalo, S.; Andersson, M.; Nyberg, L. Pleasant Human Touch Is Represented in Pregenual Anterior Cingulate Cortex. Neuroimage 2012, 59, 3427–3432. [Google Scholar] [CrossRef] [PubMed]
- Tuulari, J.J.; Scheinin, N.M.; Lehtola, S.; Merisaari, H.; Saunavaara, J.; Parkkola, R.; Sehlstedt, I.; Karlsson, L.; Karlsson, H.; Björnsdotter, M. Neural Correlates of Gentle Skin Stroking in Early Infancy. Dev. Cogn. Neurosci. 2019, 35, 36–41. [Google Scholar] [CrossRef] [PubMed]
- Jönsson, E.H.; Kotilahti, K.; Heiskala, J.; Wasling, H.B.; Olausson, H.; Croy, I.; Mustaniemi, H.; Hiltunen, P.; Tuulari, J.J.; Scheinin, N.M.; et al. Affective and Non-Affective Touch Evoke Differential Brain Responses in 2-Month-Old Infants. Neuroimage 2018, 169, 162–171. [Google Scholar] [CrossRef]
- Case, L.K.; Laubacher, C.M.; Olausson, H.; Wang, B.; Spagnolo, P.A.; Bushnell, M.C. Encoding of Touch Intensity but Not Pleasantness in Human Primary Somatosensory Cortex. J. Neurosci. 2016, 36, 5850–5860. [Google Scholar] [CrossRef] [PubMed]
- Sanchez Panchuelo, R.M.; Ackerley, R.; Glover, P.M.; Bowtell, R.W.; Wessberg, J.; Francis, S.T.; McGlone, F. Mapping Quantal Touch Using 7 Tesla Functional Magnetic Resonance Imaging and Single-Unit Intraneural Microstimulation. Elife 2016, 5, e12812. [Google Scholar] [CrossRef]
- Sanchez-Panchuelo, R.M.; Besle, J.; Beckett, A.; Bowtell, R.; Schluppeck, D.; Francis, S. Within-Digit Functional Parcellation of Brodmann Areas of the Human Primary Somatosensory Cortex Using Functional Magnetic Resonance Imaging at 7 Tesla. J. Neurosci. 2012, 32, 15815–15822. [Google Scholar] [CrossRef]
- Ackerley, R.; Hassan, E.; Curran, A.; Wessberg, J.; Olausson, H.; McGlone, F. An FMRI Study Oncortical Responses during Active Self-Touch and Passive Touch from Others. Front. Behav. Neurosci. 2012, 6, 51. [Google Scholar] [CrossRef]
- Case, L.K.; Laubacher, C.M.; Richards, E.A.; Spagnolo, P.; Olausson, H.; Bushnell, M.C. Inhibitory RTMS of Secondary Somatosensory Cortex Reduces Intensity but Not Pleasantness of Gentle Touch. Neurosci. Lett. 2017, 653, 84–91. [Google Scholar] [CrossRef]
- Craig, A.D. How Do You Feel? Interoception: The Sense of the Physiological Condition of the Body. Nat. Rev. Neurosci. 2002, 3, 655–666. [Google Scholar] [CrossRef]
- Boehme, R.; Hauser, S.; Gerling, G.J.; Heilig, M.; Olausson, H. Distinction of Self-Produced Touch and Social Touch at Cortical and Spinal Cord Levels. Proc. Natl. Acad. Sci. USA 2019, 116, 2290–2299. [Google Scholar] [CrossRef] [PubMed]
- Strauss, T.; Rottstädt, F.; Sailer, U.; Schellong, J.; Hamilton, J.P.; Raue, C.; Weidner, K.; Croy, I. Touch Aversion in Patients with Interpersonal Traumatization. Depress. Anxiety 2019, 36, 635–646. [Google Scholar] [CrossRef] [PubMed]
- Kress, I.U.; Minati, L.; Ferraro, S.; Critchley, H.D. Direct Skin-to-Skin versus Indirect Touch Modulates Neural Responses to Stroking versus Tapping. Neuroreport 2011, 22, 646–651. [Google Scholar] [CrossRef] [PubMed]
- Nordin, M. Low-Threshold Mechanoreceptive and Nociceptive Units with Unmyelinated (C) Fibres in the Human Supraorbital Nerve. J. Physiol. 1990, 426, 229–240. [Google Scholar] [CrossRef]
- Vallbo, Å.B.; Olausson, H.; Wessberg, J. Unmyelinated Afferents Constitute a Second System Coding Tactile Stimuli of the Human Hairy Skin. J. Neurophysiol. 1999, 81, 2753–2763. [Google Scholar] [CrossRef]
- Vallbo, Å.; Olausson, H.; Wessberg, J.; Norrsell, U. A System of Unmyelinated Afferents for Innocuous Mechanoreception in the Human Skin. Brain Res. 1993, 628, 301–304. [Google Scholar] [CrossRef]
- Varlamov, A.A.; Portnova, G.V.; Mcglone, F. C-Tactile System and Affective Touch: History of Discovery and Current State of the Concept. Zhurnal Vyss. Nervn. Deyatelnosti Im. I.P. Pavlov. 2019, 69, 280–293. [Google Scholar]
- Krahé, C.; von Mohr, M.; Gentsch, A.; Guy, L.; Vari, C.; Nolte, T.; Fotopoulou, A. Sensitivity to CT-Optimal, Affective Touch Depends on Adult Attachment Style. Sci. Rep. 2018, 8, 14544. [Google Scholar] [CrossRef]
- Triscoli, C.; Olausson, H.; Sailer, U.; Ignell, H.; Croy, I. CT-Optimized Skin Stroking Delivered by Hand or Robot Is Comparable. Front. Behav. Neurosci. 2013, 7, 208. [Google Scholar] [CrossRef]
- Ahnlund, P.; Lövgren, V.; Andersson, K.; Kalman, H. Perceptions of Intimacy and Integrity in Formal Home Care. Eur. J. Soc. Work 2022, 1–12. [Google Scholar] [CrossRef]
- Trotter, P.; Belovol, E.; McGlone, F.; Varlamov, A. Validation and Psychometric Properties of the Russian Version of the Touch Experiences and Attitudes Questionnaire (TEAQ-37 Rus). PLoS ONE 2018, 13, e0206905. [Google Scholar] [CrossRef] [PubMed]
- Welcome Trust Centre for Neuroimaging. Available online: https://www.fil.ion.ucl.ac.uk/spm-statistical-parametric-mapping/ (accessed on 6 January 2023).
- Mcglone, F.; Olausson, H.; Boyle, J.A.; Jones-Gotman, M.; Dancer, C.; Guest, S.; Essick, G. Touching and Feeling: Differences in Pleasant Touch Processing between Glabrous and Hairy Skin in Humans. Eur. J. Neurosci. 2012, 35, 1782–1788. [Google Scholar] [CrossRef] [PubMed]
- Kirchner, H.; Barbeau, E.J.; Thorpe, S.J.; Régis, J.; Liégeois-Chauvel, C. Ultra-Rapid Sensory Responses in the Human Frontal Eye Field Region. J. Neurosci. 2009, 29, 7599–7606. [Google Scholar] [CrossRef]
- Brothers, L. The Neural Basis of Primate Social Communication. Motiv. Emot. 1990, 14, 81–91. [Google Scholar] [CrossRef]
- Frith, C.D.; Frith, U. Social Cognition in Humans. Curr. Biol. 2007, 17, R724-32. [Google Scholar] [CrossRef] [PubMed]
- Schirmer, A.; Adolphs, R. Emotion Perception from Face, Voice, and Touch: Comparisons and Convergence. Trends Cogn. Sci. 2017, 21, 216–228. [Google Scholar] [CrossRef] [PubMed]
- Uddin, L.Q.; Iacoboni, M.; Lange, C.; Keenan, J.P. The Self and Social Cognition: The Role of Cortical Midline Structures and Mirror Neurons. Trends Cogn. Sci. 2007, 11, 153–157. [Google Scholar] [CrossRef]
- Watkins, R.H.; Dione, M.; Ackerley, R.; Wasling, H.B.; Wessberg, J.; Loken, L.S. Evidence for Sparse C-Tactile Afferent Innervation of Glabrous Human Hand Skin. J. Neurophysiol. 2021, 125, 232–237. [Google Scholar] [CrossRef]
- Djouhri, L. Electrophysiological Evidence for the Existence of a Rare Population of C-Fiber Low Threshold Mechanoreceptive (C-LTM) Neurons in Glabrous Skin of the Rat Hindpaw. Neurosci. Lett. 2016, 613, 25–29. [Google Scholar] [CrossRef]
- Nagi, S.S.; Mahns, D.A. Mechanical Allodynia in Human Glabrous Skin Mediated by Low-Threshold Cutaneous Mechanoreceptors with Unmyelinated Fibres. Exp. Brain Res. 2013, 231, 139–151. [Google Scholar] [CrossRef]
- Pawling, R.; Cannon, P.R.; McGlone, F.P.; Walker, S.C. C-Tactile Afferent Stimulating Touch Carries a Positive Affective Value. PLoS ONE 2017, 12, e0173457. [Google Scholar] [CrossRef] [PubMed]
- Ackerley, R.; Saar, K.; McGlone, F.; Backlund Wasling, H. Quantifying the Sensory and Emotional Perception of Touch: Differences between Glabrous and Hairy Skin. Front. Behav. Neurosci. 2014, 8, 34. [Google Scholar] [CrossRef] [PubMed]
- Guest, S.; Dessirier, J.M.; Mehrabyan, A.; McGlone, F.; Essick, G.; Gescheider, G.; Fontana, A.; Xiong, R.; Ackerley, R.; Blot, K. The Development and Validation of Sensory and Emotional Scales of Touch Perception. Atten. Percept. Psychophys. 2011, 73, 531–550. [Google Scholar] [CrossRef] [PubMed]
- van den Heuvel, M.P.; Mandl, R.C.W.; Kahn, R.S.; Hulshoff Pol, H.E. Functionally Linked Resting-State Networks Reflect the Underlying Structural Connectivity Architecture of the Human Brain. Hum. Brain Mapp. 2009, 30, 3127–3141. [Google Scholar] [CrossRef]
- Volkow, N.D.; Tomasi, D.; Wang, G.-J.; Fowler, J.S.; Telang, F.; Goldstein, R.Z.; Alia-Klein, N.; Woicik, P.; Wong, C.; Logan, J.; et al. Positive Emotionality Is Associated with Baseline Metabolism in Orbitofrontal Cortex and in Regions of the Default Network. Mol. Psychiatry 2011, 16, 818–825. [Google Scholar] [CrossRef]
- Veer, I.M.; Oei, N.Y.L.; Spinhoven, P.; van Buchem, M.A.; Elzinga, B.M.; Rombouts, S.A.R.B. Beyond Acute Social Stress: Increased Functional Connectivity between Amygdala and Cortical Midline Structures. Neuroimage 2011, 57, 1534–1541. [Google Scholar] [CrossRef]
- Barrett, L.F. The Theory of Constructed Emotion: An Active Inference Account of Interoception and Categorization. Soc. Cogn. Affect. Neurosci. 2017, 12, 1–23. [Google Scholar] [CrossRef]
- Zhang, S.; Li, C.-S.R. A Neural Measure of Behavioral Engagement: Task-Residual Low-Frequency Blood Oxygenation Level-Dependent Activity in the Precuneus. Neuroimage 2010, 49, 1911–1918. [Google Scholar] [CrossRef]
- Eser, D.; Leicht, G.; Lutz, J.; Wenninger, S.; Kirsch, V.; Schüle, C.; Karch, S.; Baghai, T.; Pogarell, O.; Born, C.; et al. Functional Neuroanatomy of CCK-4-Induced Panic Attacks in Healthy Volunteers. Hum. Brain Mapp. 2009, 30, 511–522. [Google Scholar] [CrossRef]
- Mercado, F.; Carretié, L.; Hinojosa, J.A.; Peñacoba, C. Two Successive Phases in the Threat-Related Attentional Response of Anxious Subjects: Neural Correlates. Depress. Anxiety 2009, 26, 1141–1150. [Google Scholar] [CrossRef]
- Sander, D.; Grandjean, D.; Pourtois, G.; Schwartz, S.; Seghier, M.L.; Scherer, K.R.; Vuilleumier, P. Emotion and Attention Interactions in Social Cognition: Brain Regions Involved in Processing Anger Prosody. Neuroimage 2005, 28, 848–858. [Google Scholar] [CrossRef] [PubMed]
- Seiferth, N.Y.; Pauly, K.; Habel, U.; Kellermann, T.; Shah, N.J.; Ruhrmann, S.; Klosterkötter, J.; Schneider, F.; Kircher, T. Increased Neural Response Related to Neutral Faces in Individuals at Risk for Psychosis. Neuroimage 2008, 40, 289–297. [Google Scholar] [CrossRef] [PubMed]

| Brain Region (and Functional Localization) | L/R | Cluster Size (Voxels) | Local Maxima (MNI) | BA | p-Value (Cluster-Level, FWE p < 0.05) | F-Value | Direction (Post-Hoc) | ||
|---|---|---|---|---|---|---|---|---|---|
| x | y | z | |||||||
| Main effect: Foot sole vs. Shin | |||||||||
| Precentral g. medial segment Left precentral g. (MI) | L, R | 1986 | −3 | −28 | 68 | 4 | 0.000 | 147.96 | Sole > Shin |
| Putamen Anterior insula | L | 315 | −30 | −1 | 5 | – | 0.000 | 33.87 | Sole > Shin |
| Postcentral g. (SI) | L | 148 | −51 | −19 | 29 | 1 | 0.003 | 26.20 | Sole > Shin |
| Lateral ventricle Left middle cingulate g. | L, R | 142 | −3 | 5 | 20 | – | 0.003 | 25.54 | Shin > Sole |
| Angular g. | L | 153 | −48 | −64 | 44 | 39 | 0.002 | 22.85 | Shin > Sole |
| Thalamus proper Putamen Pallidum | R | 143 | 24 | −16 | 2 | – | 0.003 | 22.27 | Sole > Shin |
| Middle frontal g. (FEF) | L | 158 | −33 | 17 | 50 | 8 | 0.002 | 20.99 | Shin > Sole |
| Superior frontal g. medial segment (AntPFC) Left frontal pole | L, R | 75 | −3 | 59 | 8 | 10 | 0.038 | 20.24 | Shin > Sole |
| Main effect: Feather vs. Hand | |||||||||
| Postcentral g. medial segment Postcentral g. Precuneus Precentral g. medial segment (MI) | L | 668 | −6 | −40 | 65 | 4 | 0.000 | 97.62 | Hand > Feather |
| Precentral g. (MI) Postcentral g. | L | 615 | −36 | −19 | 44 | 4 | 0.000 | 60.58 | Feather >Hand |
| Parietal operculum (PO) Planum temporale (PT) | R | 313 | 48 | −31 | 23 | 40 | 0.000 | 53.28 | Hand > Feather |
| Precentral g. Postcentral g. | R | 450 | 36 | −22 | 62 | 6 | 0.000 | 51.94 | Feather >Hand |
| Superior occipital g. Middle occipital g. | R, L | 1455 | 27 | −82 | 20 | 19 | 0.000 | 48.98 | Feather >Hand |
| Parietal operculum Central operculum | L | 106 | −45 | −25 | 23 | – | 0.011 | 35.40 | Hand > Feather |
| Middle temporal g. Superior temporal g. | L | 81 | −54 | −25 | −4 | 22 | 0.030 | 33.55 | Feather >Hand |
| Anterior cingulate g. Caudate | R | 157 | 6 | 23 | 11 | – | 0.002 | 30.69 | Feather >Hand |
| Thalamus proper | L | 142 | −18 | −25 | 8 | – | 0.003 | 26.09 | Hand > Feather |
| Middle frontal g. Inferior frontal g. opercular part | L | 86 | −54 | 20 | 29 | 44 | 0.025 | 22.41 | Feather >Hand |
| Lateral ventricle | L | 85 | −21 | −40 | 17 | – | 0.026 | 20.79 | Feather >Hand |
| Interaction of factors (“Body Part” × “Type of stroking”) | |||||||||
| Precentral g. medial segment Left precentral g. (MI) | L, R | 1673 | −3 | −28 | 68 | 4 | 0.000 | 83.37 | – |
| Putamen Pallidum Anterior insula | L | 718 | −27 | 2 | 2 | – | 0.000 | 41.99 | – |
| Superior parietal lobule | R | 245 | 18 | −55 | 62 | 7 | 0.000 | 28.19 | – |
| Transverse temporal g. Posterior insula | R | 83 | 36 | −25 | 5 | – | 0.028 | 24.15 | – |
| Parietal operculum (PO) Supramarginal g. Planum temporale (PT) | R | 147 | 54 | −34 | 26 | 40 | 0.003 | 23.72 | – |
| Lateral ventricle Caudate | L | 72 | −12 | 23 | 14 | – | 0.043 | 23.58 | – |
Disclaimer/Publisher’s Note: The statements, opinions and data contained in all publications are solely those of the individual author(s) and contributor(s) and not of MDPI and/or the editor(s). MDPI and/or the editor(s) disclaim responsibility for any injury to people or property resulting from any ideas, methods, instructions or products referred to in the content. |
© 2023 by the authors. Licensee MDPI, Basel, Switzerland. This article is an open access article distributed under the terms and conditions of the Creative Commons Attribution (CC BY) license (https://creativecommons.org/licenses/by/4.0/).
Share and Cite
Mayorova, L.; Portnova, G.; Skorokhodov, I. Cortical Response Variation with Social and Non-Social Affective Touch Processing in the Glabrous and Hairy Skin of the Leg: A Pilot fMRI Study. Sensors 2023, 23, 7881. https://doi.org/10.3390/s23187881
Mayorova L, Portnova G, Skorokhodov I. Cortical Response Variation with Social and Non-Social Affective Touch Processing in the Glabrous and Hairy Skin of the Leg: A Pilot fMRI Study. Sensors. 2023; 23(18):7881. https://doi.org/10.3390/s23187881
Chicago/Turabian StyleMayorova, Larisa, Galina Portnova, and Ivan Skorokhodov. 2023. "Cortical Response Variation with Social and Non-Social Affective Touch Processing in the Glabrous and Hairy Skin of the Leg: A Pilot fMRI Study" Sensors 23, no. 18: 7881. https://doi.org/10.3390/s23187881
APA StyleMayorova, L., Portnova, G., & Skorokhodov, I. (2023). Cortical Response Variation with Social and Non-Social Affective Touch Processing in the Glabrous and Hairy Skin of the Leg: A Pilot fMRI Study. Sensors, 23(18), 7881. https://doi.org/10.3390/s23187881