Article

Forgery Cyber-Attack Supported by LSTM Neural Network: An Experimental Case Study

1
Institute of Control and Computation Engineering, Faculty of Electronics and Information Technology, Warsaw University of Technology, 00-665 Warsaw, Poland
2
Institute of Computer Science, Faculty of Electronics and Information Technology, Warsaw University of Technology, 00-665 Warsaw, Poland
*
Author to whom correspondence should be addressed.
Sensors 2023, 23(15), 6778; https://doi.org/10.3390/s23156778
Submission received: 26 May 2023 / Revised: 22 July 2023 / Accepted: 25 July 2023 / Published: 28 July 2023

Abstract

:
This work is concerned with the vulnerability of a network industrial control system to cyber-attacks, which is a critical issue nowadays. This is because an attack on a controlled process can damage or destroy it. These attacks use long short-term memory (LSTM) neural networks, which model dynamical processes. This means that the attacker may not know the physical nature of the process; an LSTM network is sufficient to mislead the process operator. Our experimental studies were conducted in an industrial control network containing a magnetic levitation process. The model training, evaluation, and structure selection are described. The chosen LSTM network very well mimicked the considered process. Finally, based on the obtained results, we formulated possible protection methods against the considered types of cyber-attack.

1. Introduction

Cyber-attacks pose an increasingly significant threat to industrial networks. This applies to industries such as energy, robotics, and automotive [1,2,3,4,5,6,7,8]. On the one hand, relatively obvious protection methods against such attacks exist, i.e., isolation of information technology (IT) and operational technology (OT) networks, as well as the precise definition of permissions for individual human and hardware elements of the network based on whitelisting [9]. On the other hand, unauthorized access to such networks’ critical elements remains a real threat [10].
Cyber-security and proper operation of control algorithms heavily depend on sensors required to provide precise measurements. First, when a cyberattack occurs, measurements from those sensors might be used to detect this malicious activity and further investigate the problem. There are various approaches to performing this detection, e.g., models such as support vector data description [11], neural autoencoders [12], long short-term memory networks [13], k-nearest-neighbors (KNN), decision tree (DT), support vector machines (SVM), naive Bayes and random forest [14] could be trained on the data collected from sensors during the typical work of the system. Then, when the measurements differ from the norm, the said algorithms can raise the alarm about anomalies or potential attacks. Anomalies are often related to some errors in the sensors, external disturbances, or even manual human interventions, but they can also arise from the interference of an malicious actor. The algorithms used for anomaly detection vary in complexity, from simple threshold analysis [15] to deep neural network models [16,17] or classifiers based on statistical properties [18,19,20].
Another category of cyber-attacks is attacks on the communication between sensors and other devices. This ranges from denial of service attacks [21], sleep deprivation attacks [22], through flooding [23], and jamming attacks [24], to attacks based on network traffic analysis and self-replay attacks [25]. All of these rely on the fact that the data from the sensors must be transmitted somehow. This is an especially significant threat to IoT and industrial IoT devices and sensors [26,27]. Even the commonly used IIoT protocol MQTT is prone to typical attacks [28,29], e.g., as considered in this paper, man in the middle attacks [30].
Second, the efficiency of control algorithms relies on the accuracy of sensors, e.g., in UAV [31] or autonomous vehicle [32,33] control. It is necessary to point out that the efficient operation of control algorithms can be significantly improved using neural networks. Typically, neural networks serve as models of dynamical processes, e.g., utilized online in model predictive control (MPC) algorithms [34,35].
The intensive development of neural networks in various configurations makes it possible to find networks that approximate dynamical phenomena [36,37]. Additionally, neural networks can carry out effective cyber-attacks that are invisible to the process operator with much less effort than classical methods. Therefore, this publication proposes defense mechanisms against such attacks that would provide additional protection against the destructive actions of the attacker in the event of a breach of the OT network’s integrity.
Often in research, it is assumed that the attacker has gained access to the industrial network, and further considerations are made from that point. This is because gaining access to the attacked network is often the result of social engineering, which is difficult to standardize. Specifying a precise and effective methodology to access an industrial network is also difficult. Therefore, assuming access has been obtained, the attacker may consider various methods of attacking the industrial network.
The operator often oversees the key time series or some derivative plots of this signal (e.g., histograms, signal increments, control errors). This paper presents the vulnerability directly related to the operator’s responsibilities. The attack presented in our work aims to take advantage of the operator’s inability to discern small changes in the signal, as the LSTM model that we propose generates similar results to the real signals. On the other hand, a slow degradation of the control quality is performed via subtle changes in the control signals that affect the signal that is being forged.
A commonly considered approach for detecting attacks based on network traffic is to use genetic or evolutionary algorithms [38], Bayesian networks [39], or machine learning [40]. One of the more time-consuming approaches is to identify the target under attack by monitoring network traffic and, based on that traffic or the data acquired from it, to develop a model of the process under attack, to accurately generate malicious signals. Such an approach is often impossible to implement, due to the large number of signals used in the network. In this case, it is necessary to identify signals relevant to the operation of the process and interpret them correctly. The model can be obtained using classical approaches such as support vector machines [10] or random forest [39]. A relatively new approach is to use deep neural networks [6,39]. These are attractive because of their high degree of automation of the learning process and because they require less knowledge of the process being modeled. However, these models tend to be less well adapted to the actual process, and their learning requires selecting a number of meta-parameters.
This study presents an example of using LSTM-type neural networks to model a process of unknown physical form. This model is then used to simulate the process. Such data are transmitted to the supervisory control and data acquisition (SCADA) system, to conceal the attack on the actual process. Finally, considerations are formulated regarding potential protection methods against such attacks, abstracting from the methodology for acquiring the process model.

1.1. Problem Definition: Cyber-Attacks

The problem considered in this paper relates to cyber-attacks, which are understood as harmful actions against critical elements of industrial processes accessible from the industrial network. They may lead to a prolonged reduction in the efficiency of industrial processes [41] or their accelerated aging [42]. Attacks aimed at immediately disabling network elements [43,44] are not considered in this context, as such a failure is easy to detect and repair. At the same time, the attacker may seek to remain hidden in their actions for as long as possible [45]. In these studies, the assumed motive of the attacker is to carry out a prolonged attack that would be difficult to detect by operators.
There are a few potential implications of carrying out prolonged cyber-attacks that are difficult for operators to detect:
  • introduction of an ill-natured (e.g., high frequency) control signal, which might increase the aging rate of the actuators, which would result in a larger overall loss due to the prolonged exposure, compared to more devastating but quicker to detect and fix attacks, e.g., denial of service;
  • gaining knowledge about the process of control; as the operators are not aware of the subtle changes in the control signals, subtle responses visible in the measurements might be attributed to noise and disturbances, whereas the attacker might use this knowledge to understand the process and design more precise attacks;
  • the prolonged presence of the attacker in the network might result in getting operators used to the new characteristics of the signals, thus lowering the operators’ caution.
This paper considers an attack on one of the control loops in a system. It is worth underlining that the described system is simple, and thus there is a clear relation between the signals. From the point of view of the malicious actor, the control signal should be considered the most relevant for the attack, as the quality of this signal is often not validated. This is because this signal is a result of simple computations (e.g., a PID algorithm) based on the measured and setpoint values, and therefore it is assumed that the root cause is based on the measured or setpoint signals. There is, of course, a challenge for the attacker in determining which of the signals is the control signal (as designers or even maintainers of the system, this information should be known). There might be some premises for some signals to be assumed to be the control signals (e.g., dynamics of the signal, the variance of the signal increments). Nevertheless, in systems with hierarchical or generally complex control schemes, this might be nontrivial or impossible to achieve. In this paper, the interpretation of the signals is assumed to be known.

1.2. State of the Art: LSTM Neural Networks

Long short-term memory (LSTM) networks originated as a modification of the classical recurrent neural network (RNN), differing from it in the neuron’s structure [46]. Classical RNNs are prone to a vanishing gradient phenomenon [47], which often makes them unable to model long-term dependencies in data. LSTM networks, on the other hand, are much more resistant to this problem. The neuron in an LSTM network is often referred to as a cell and consists of a set of gates that regulate the flow of information. In particular, gates allow for selecting relevant, and forgetting unnecessary, information. This often occurs in classical recurrent networks. The unique memory properties of LSTM models have led them to find a wide range of applications, such as in traffic forecasting [48], gaze-based deception detection [49], speech synthesis [50], and handwriting recognition [51]. LSTMs can also be used to model nonlinear dynamic processes [52]. In this case, one can find that LSTM models with a relatively low number of neurons and internal weights, and short input sequences, are easily trained and offer excellent modeling quality. LSTM models can also be successfully implemented in a model predictive control algorithm [35,53,54]. LSTM networks are often used for time series modeling, i.e., for prediction of indoor temperature and air pollution [55], forecasting in finances [56], and time series classification [57].

1.3. Article Contribution

This work investigates the vulnerability of a physical industrial control system operating in a network to cyber-attacks. Specifically, we consider to what extent a cyber-attack can cause disruptions to the process operation but remain invisible to the operator. The Stuxnet worm performed the first such hidden attack, infecting PLC devices controlling Iran’s nuclear centrifuges. In effect, a hostile PLC program deliberately changed the spinning frequency, to destroy the centrifuge. However, normal signals were provided to the SCADA and the operator. In effect, hostile activity was detected when the centrifuge was seriously damaged. During our research, we would like to use machine learning methods to carry out such cyber attacks, while generating fake signals. A cyber attack that is difficult to detect while causing damage to a process can be challenging to carry out using classical methods, without knowledge of the system under attack. However, the development of artificial intelligence carries the risk of using machine learning methods to automate the execution of an attack. In this article, we examine whether LSTM networks allow a physical process to be modeled in an automated manner. Then, we use the process knowledge in this black-box model to mask the cyber attack. Security measures are also discussed, including data redundancy and isolating the industrial network from the IT network; the described attack is only possible in the case of a human error.

1.4. Article Organization

This work is structured as follows. First, Section 2 describes the laboratory control network used in our study. Section 3 presents the article’s main contribution: the LSTM neural networks for SCADA system operator deception; issues such as the network architecture, data-driven training, evaluation, and structure selection are discussed. Section 4 details the experimental evaluation of the obtained LSTM neural networks in the SCADA system and formulates possible protection mechanisms against cyber-attacks. Finally, Section 5 concludes the article.

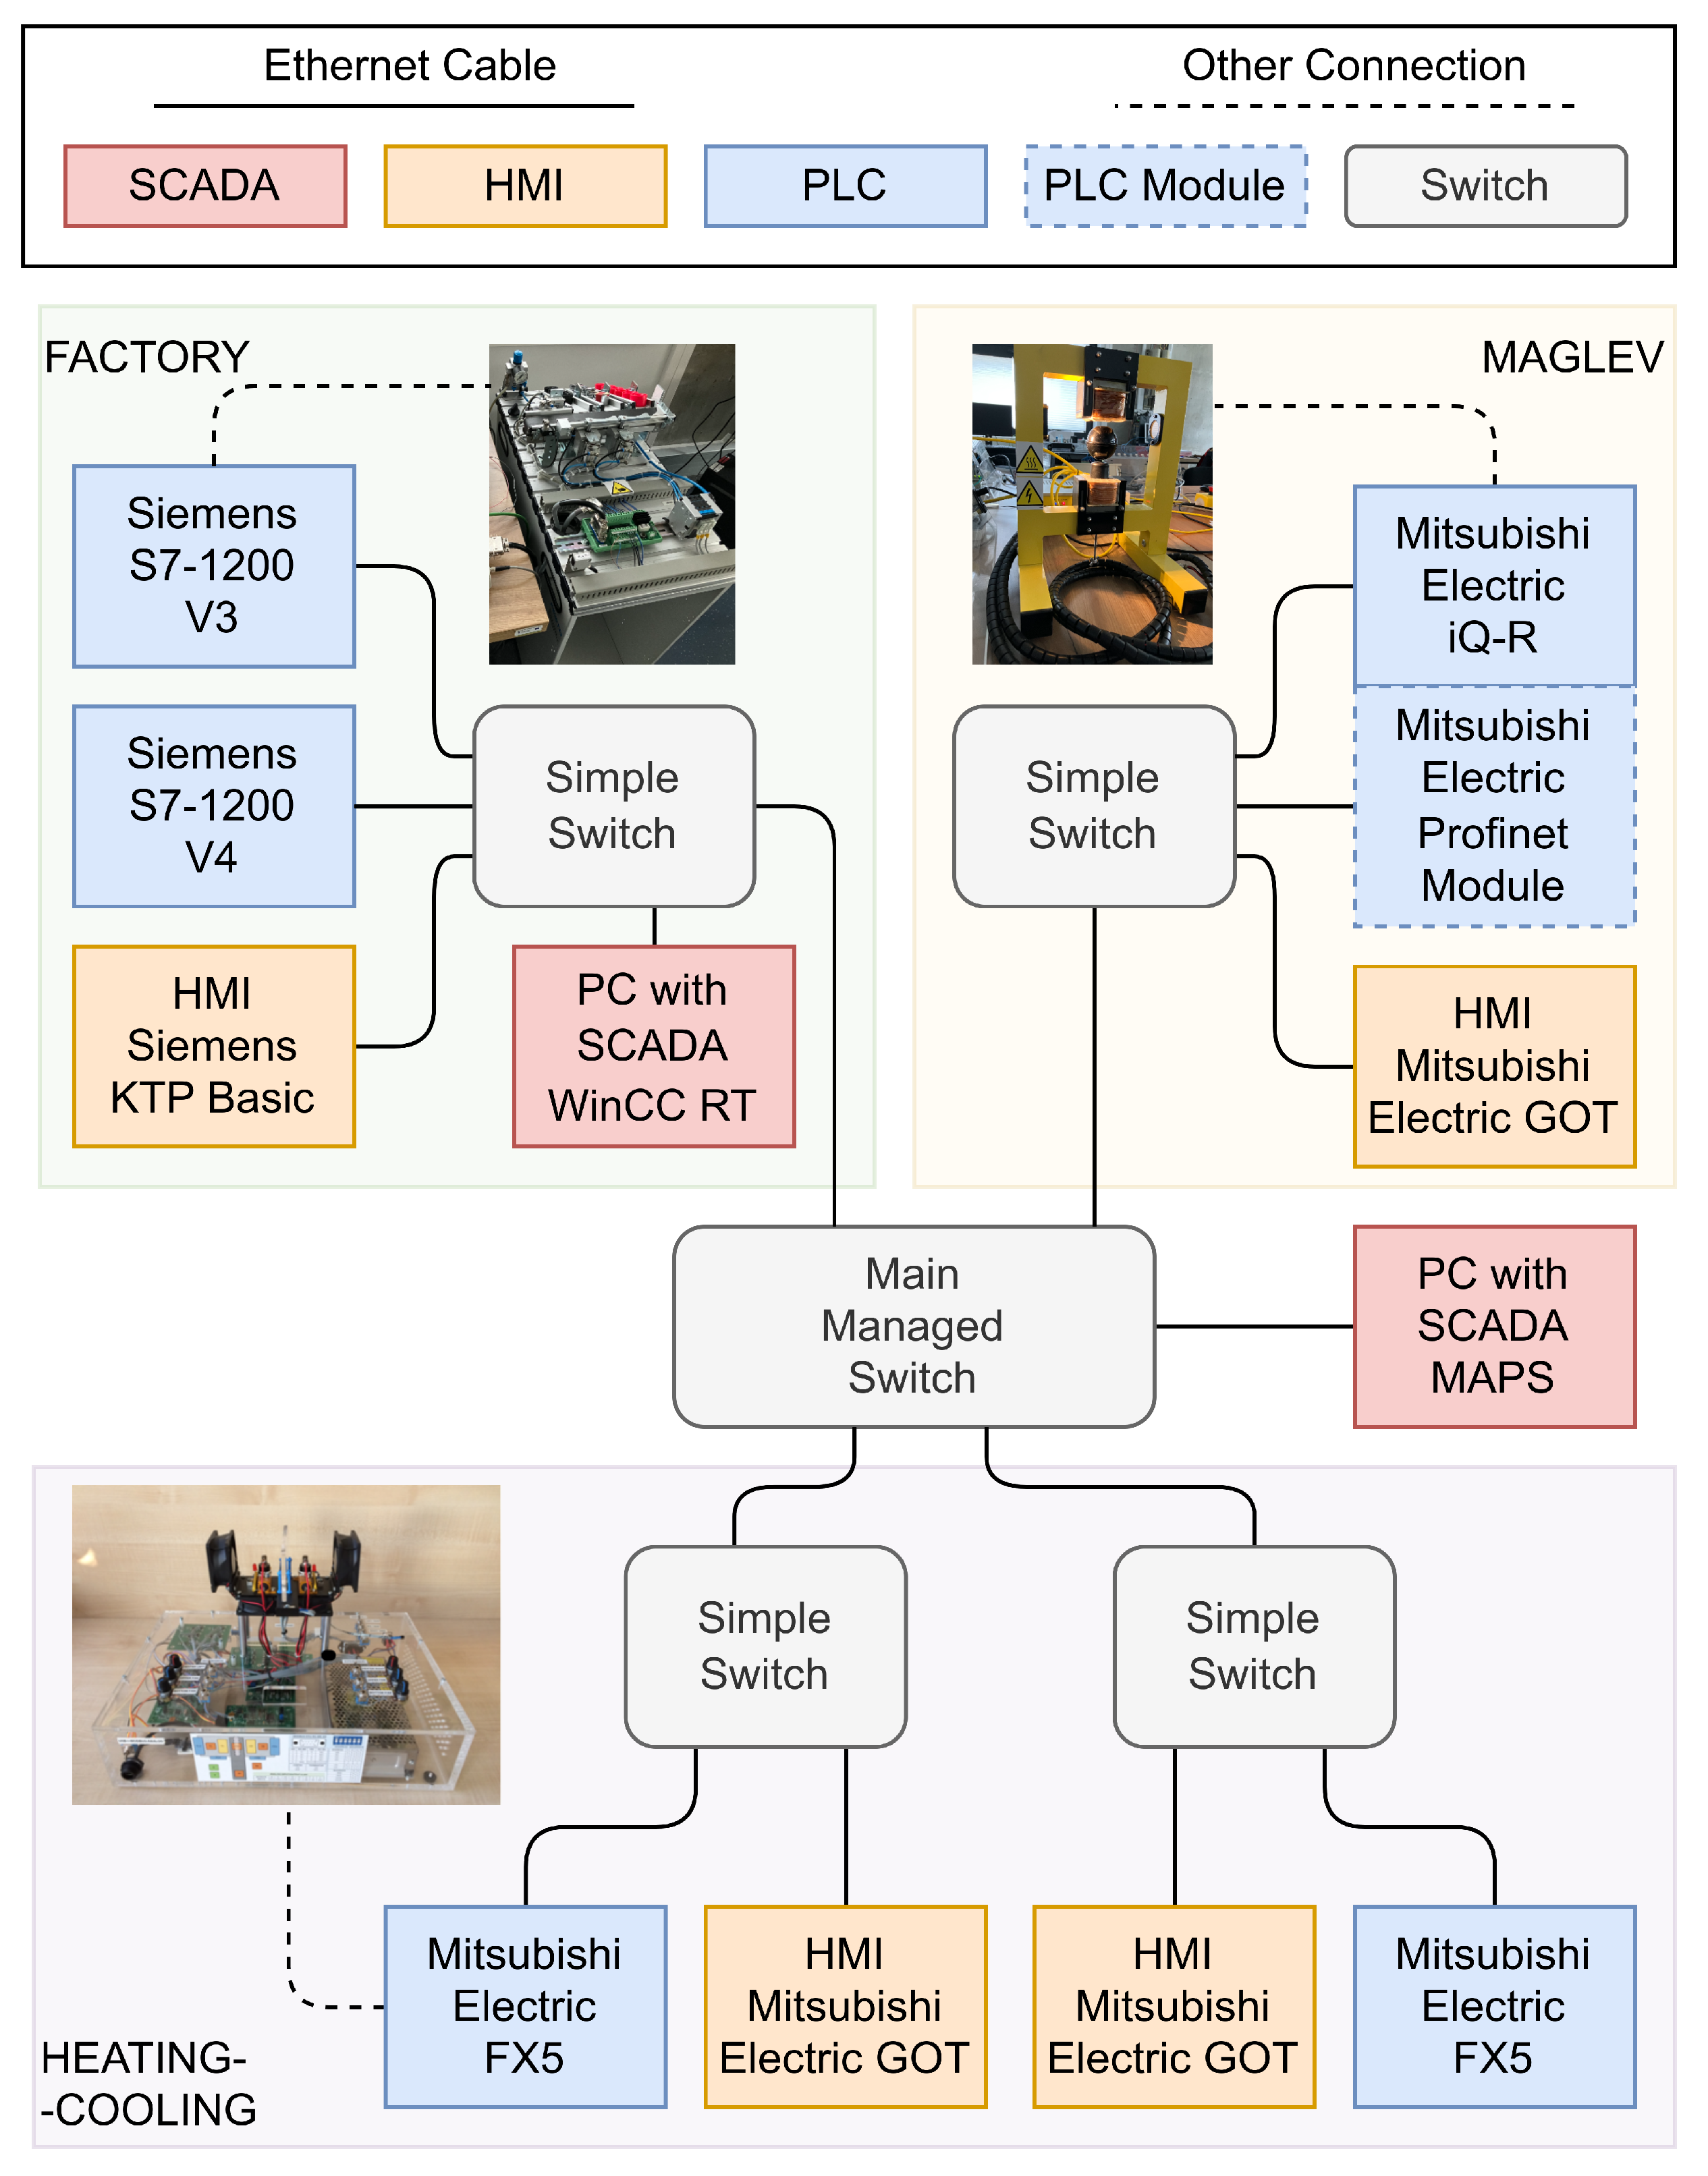
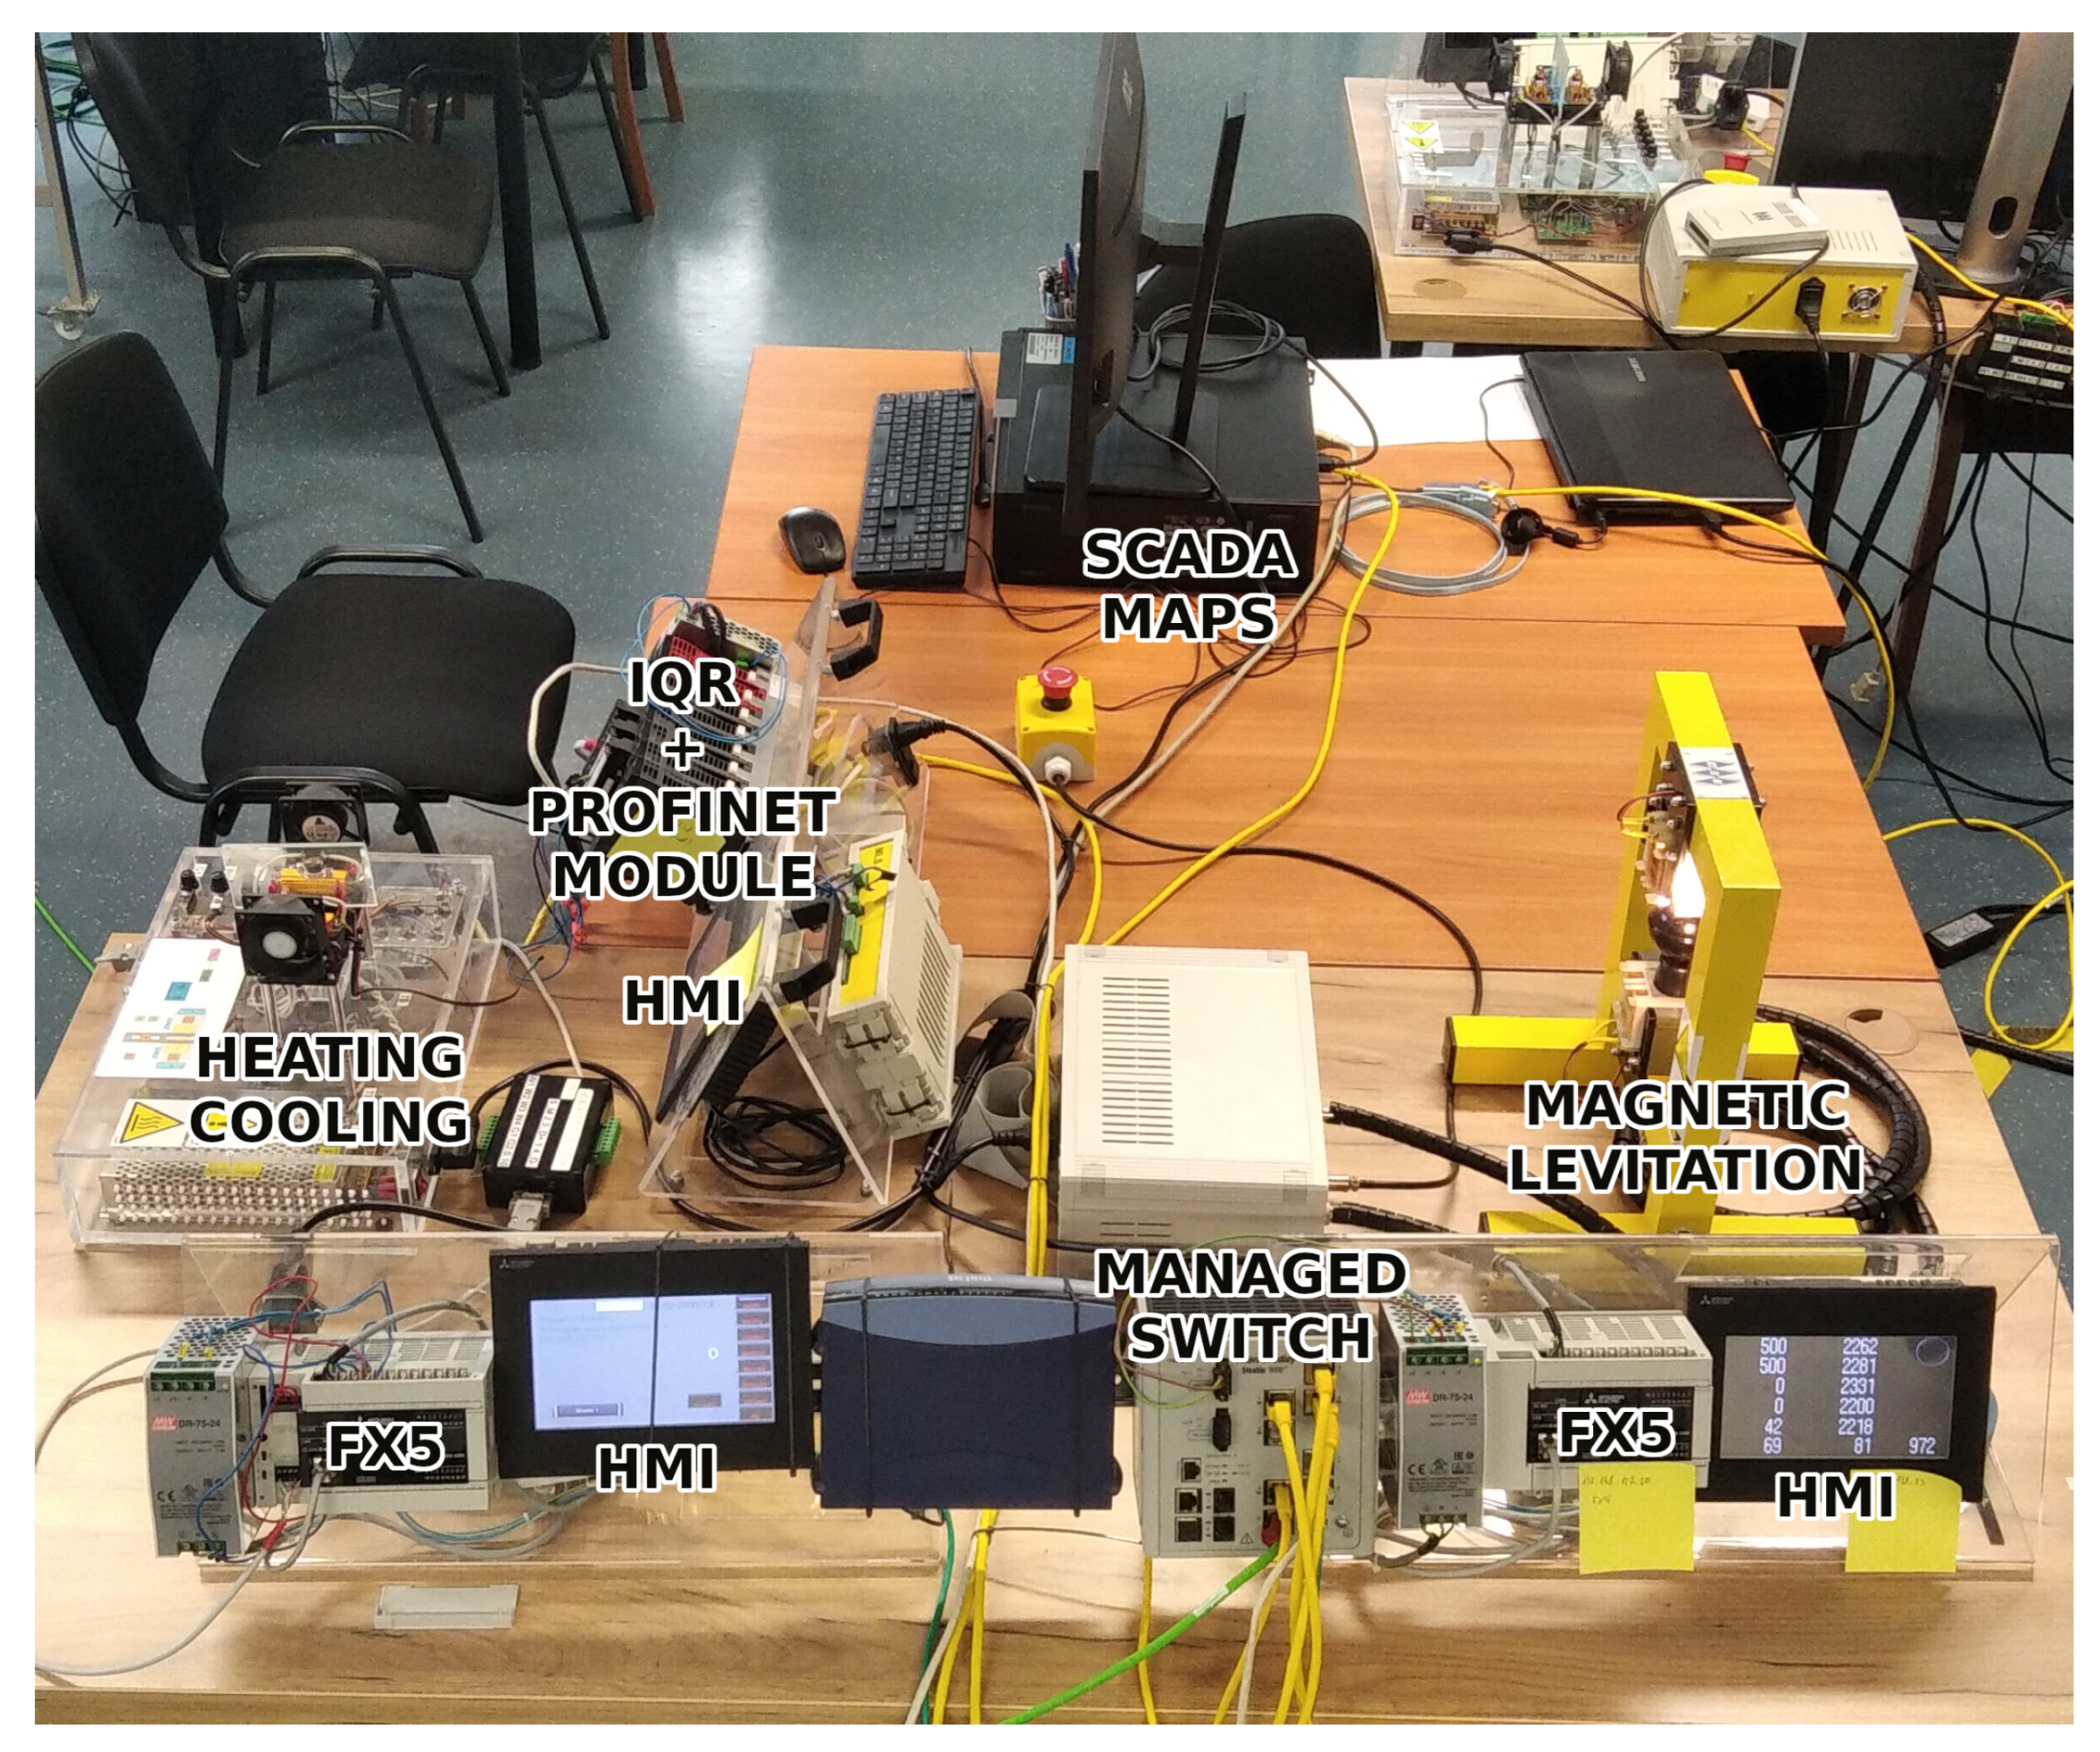
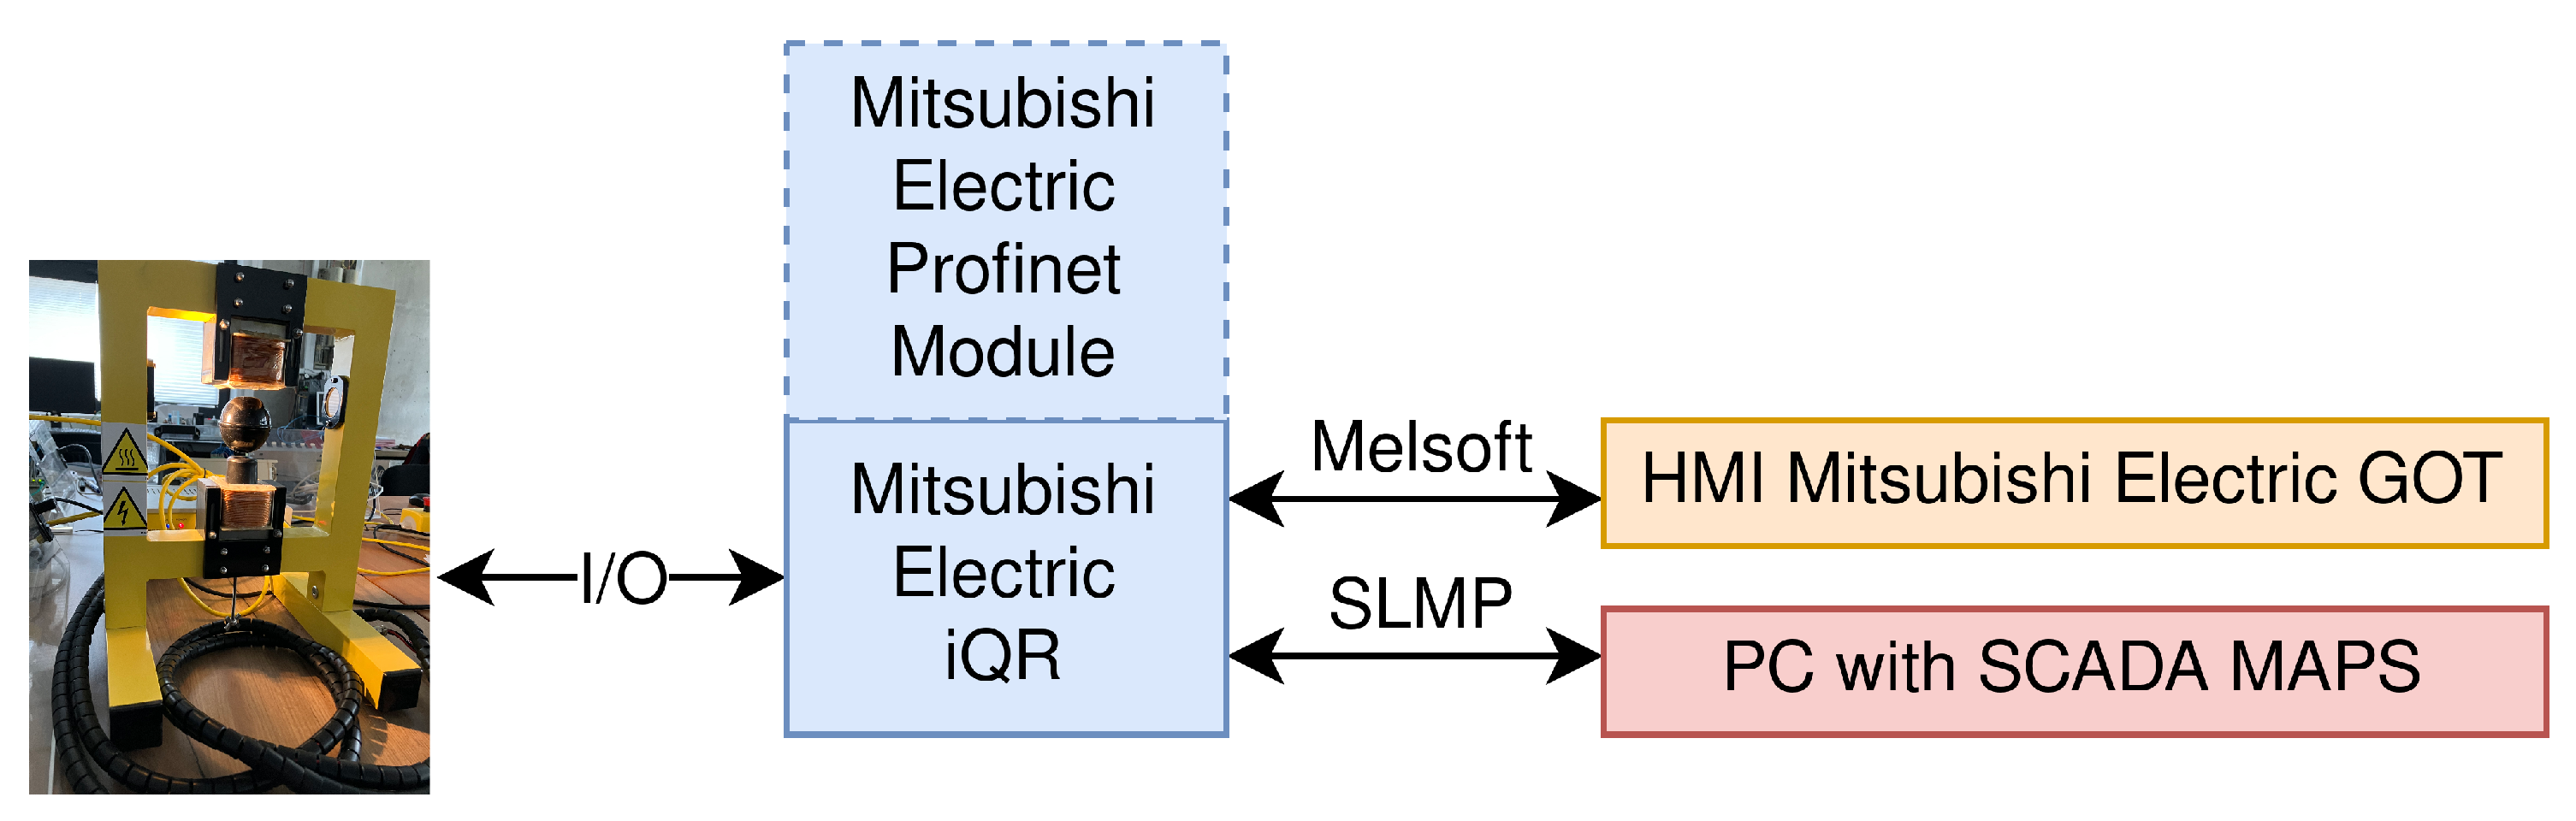
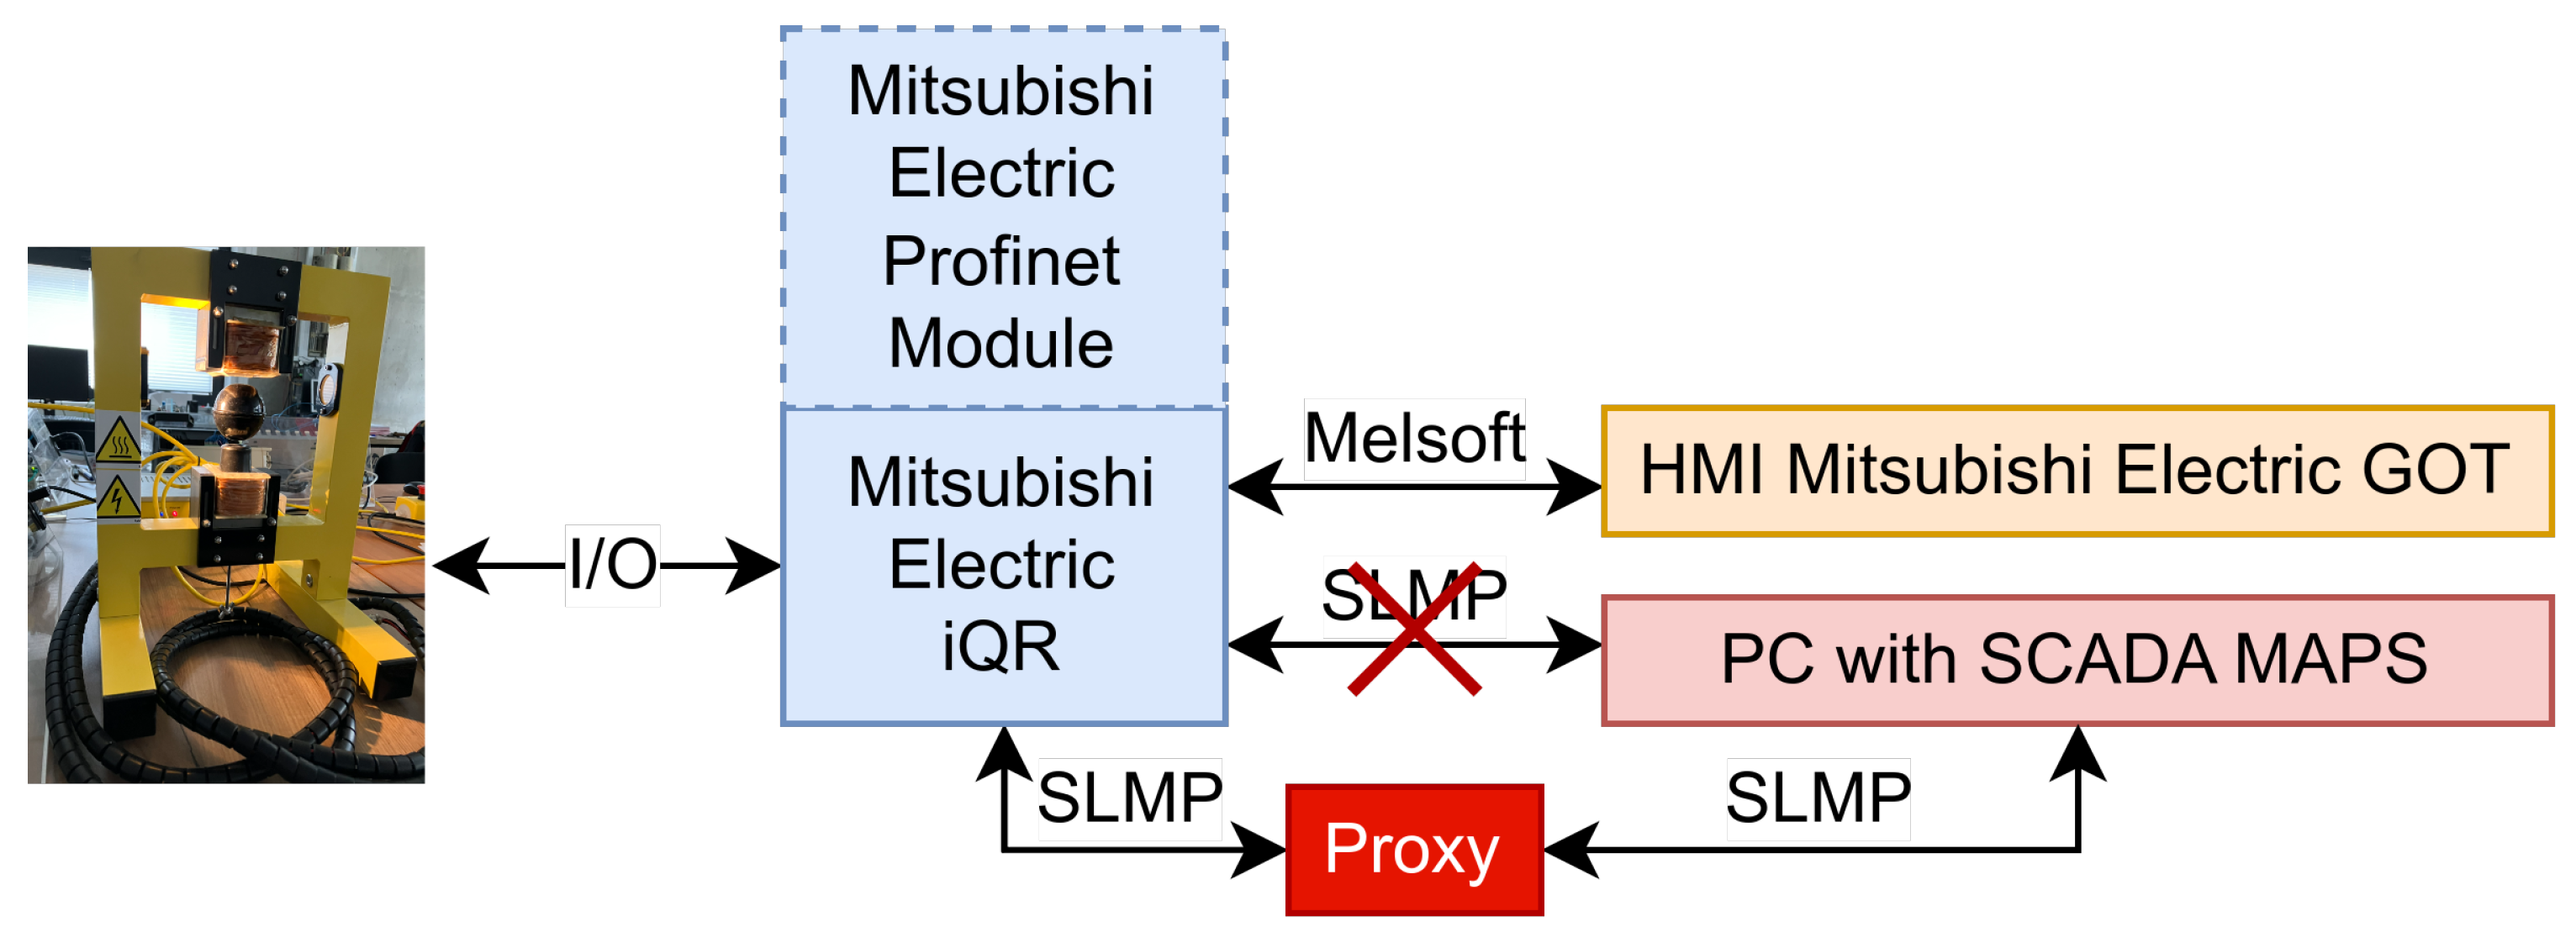
2. Laboratory Process Control Network

To perform tests using algorithms considered in this paper, a laboratory process control network was designed and implemented. This is a controlled part of industrial reality, mainly focused on the industrial network’s OT and control network layers. This network environment was prepared with a few assumptions in mind. First, it should allow testing of a range of standard network protocols in the industry. Second, it should consist of various processes (fast and slow, simple and complex, stable and unstable, binary and continuous). Third, it should be implemented with the best industrial practices in mind.
Figure 1 depicts the laboratory process control network, which consists of several control processes, namely: a heating-cooling test stand (slow, simple, stable, continuous process) [58], MPS Festo stand (fast, complex, stable, binary process) [59,60,61], and a magnetic levitation (MAGLEV) process using INTECO (quick, simple, unstable, continuous process) [62,63]. Out of those, only the magnetic levitation process is considered in this paper. The following programmable logic controllers (PLCs) manage these processes: Mitsubishi Electric FX5, Mitsubishi Electric iQ-R, and Siemens S7-1200. In addition, each PLC was connected to a corresponding human–machine interface (HMI) display. All these network devices were connected to a simple switch that directed communication from a specific part of the network to the main managed switch. This network includes two SCADA systems: SCADA WinCC RT and SCADA MAPS; which were installed and run on separate PCs.
This paper considers a section of the whole workspace, namely the MAGLEV section, including the main managed switch, which connects all the simple switches in the network. In Figure 2, a photo shows the MAGLEV and heating–cooling sections of the laboratory workspace. The Mitsubishi iQ-R Series PLC on the left side of the photo is connected via an Inteco Power Unit to the MAGLEV, visible on the right side. The overall data flow of this part of the network is depicted in Figure 3. The HMI displays were not crucial in terms of this research, yet they are included for the sake of completeness. The control algorithm for the MAGLEV system consists of a PID controller with a precisely calibrated function for transforming raw measurements (voltage based on the amount of light received by the light sensor) into the actual distance of the levitating ball from the electromagnet.
The main communication route is between iQ-R and SCADA MAPS. The communication between the iQ-R and the MAGLEV process is based on pulse width modulation (PWM), to control the top coils’ power and used to pull the metal ball towards the coil, and analog signals, to measure the ball’s position. Therefore, this cannot be utilized to perform an attack. On the other hand, the communication with SCADA goes through a main managed switch and therefore is a good candidate for such an attack. The data sent between those two units only consist of requests for values of iQ-R registers. The SCADA system requests a few variables: the ball position, set-point value (calculated by the PLC), and the width of the PWM, i.e., common control signals. No additional information about the controller parameters was considered in this scenario.
The part of the laboratory workspace considered here allows testing the vulnerability of selected communication protocols. Here, we focused on the SLMP protocol, which allows communication between PLCs and the SCADA MAPS system.
It should be noted that, even though we consider SCADA MAPS in this workspace the SCADA of choice, in the end, we created an implementation of the SCADA system because of the inaccuracies of the SCADA MAPS. Mainly, the communication period was inconsistent, which caused confusing errors during the validation stages of the models. Next, despite being responded to, many messages were ignored and displayed as nonexistent, thus creating an even more confusing picture of the experiment results. The main job of the SCADA finally used in this paper was to send periodic requests for the values of some registers and store their values in files. Those files could be further displayed.

3. LSTM Neural Networks for SCADA System Operator Deception

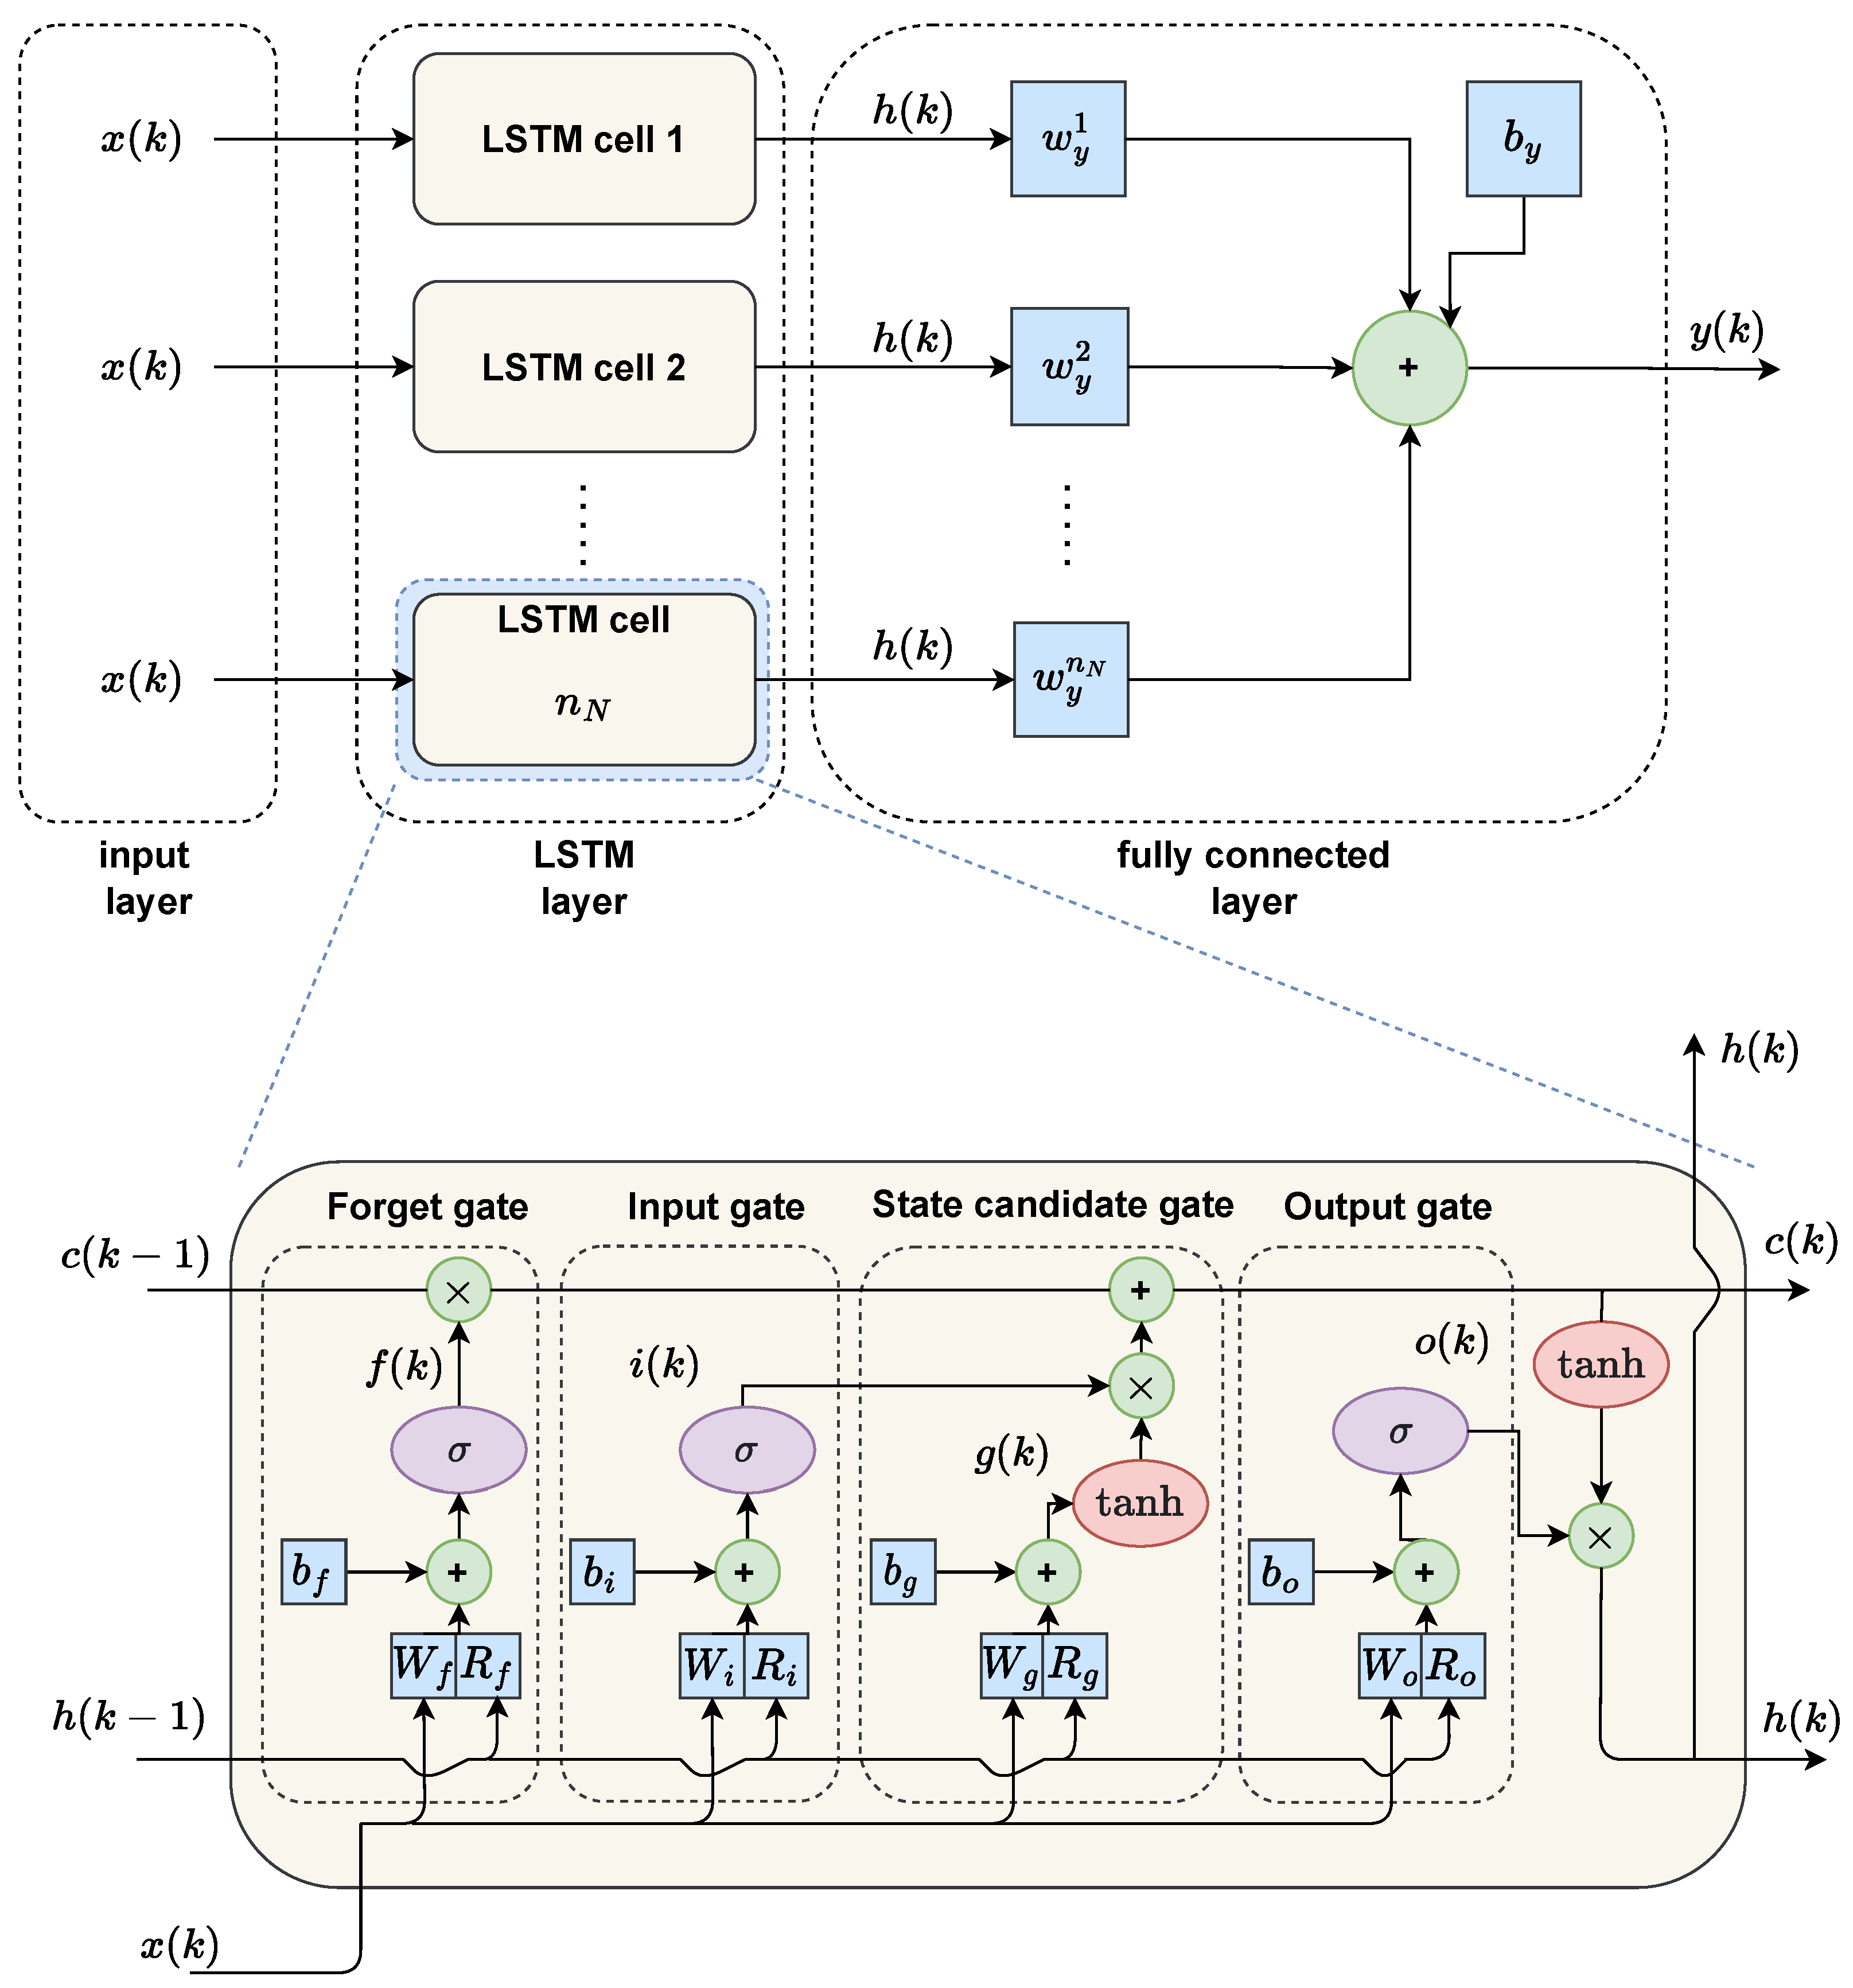
3.1. Architecture of the LSTM Neural Network

The considered LSTM network has one hidden layer of n N neurons. Let u and y stand for the process input and output signals, respectively, while k denotes the discrete time, i.e., k = 0 , 1 , 2 , For time series prediction, the input vector of the network is
x ( k ) = y ( k 1 ) y ( k n A ) T
where n A is an integer number. Alternatively, when the process’s set point is considered, the input vector is
x ( k ) = y ( k 1 ) y ( k n A ) y SP ( k ) T
Each LSTM neuron, often called a cell, consists of four gates: forget gate f, cell candidate gate g, input gate i, and output gate o. When the whole layer of LSTM containing n N cells is discussed, the gates can be represented as vectors f , g , i , o , each of dimensionality n N × 1 . Weights related to the network input signals and past hidden state are denoted as W and R , respectively. The bias vector is denoted as b . Subscripts f, g, i, and o inform about the relation between the gates and weights. The weight matrices of the whole LSTM layer are
W = W i W f W g W o , R = R i R f R g R o , b = b i b f b g b o
At the time instant k, the LSTM layer first performs all gate computations
i ( k ) = σ ( W i x ( k ) + R i h ( k 1 ) + b i )
f ( k ) = σ ( W f x ( k ) + R f h ( k 1 ) + b f )
g ( k ) = tanh ( W g x ( k ) + R g h ( k 1 ) + b g )
o ( k ) = σ ( W o x ( k ) + R o h ( k 1 ) + b o )
Next, the current cell state is calculated
c ( k ) = f ( k ) c ( k 1 ) + i ( k ) g ( k )
where ∘ denotes the Hadamard product. Finally, the hidden state of the LSTM layer can be computed:
h ( k ) = o ( k ) tanh ( c ( k ) )
The hidden state of the LSTM layer then enters a linear (fully-connected) layer. The linear layer has its own weight vector W y and scalar bias b y . The output of the whole LSTM network at the time instant k can be computed as
y LSTM ( k ) = W y h ( k ) + b y
Figure 4 shows the overall structure of the neural network used and the internal configuration of the LSTM cell.

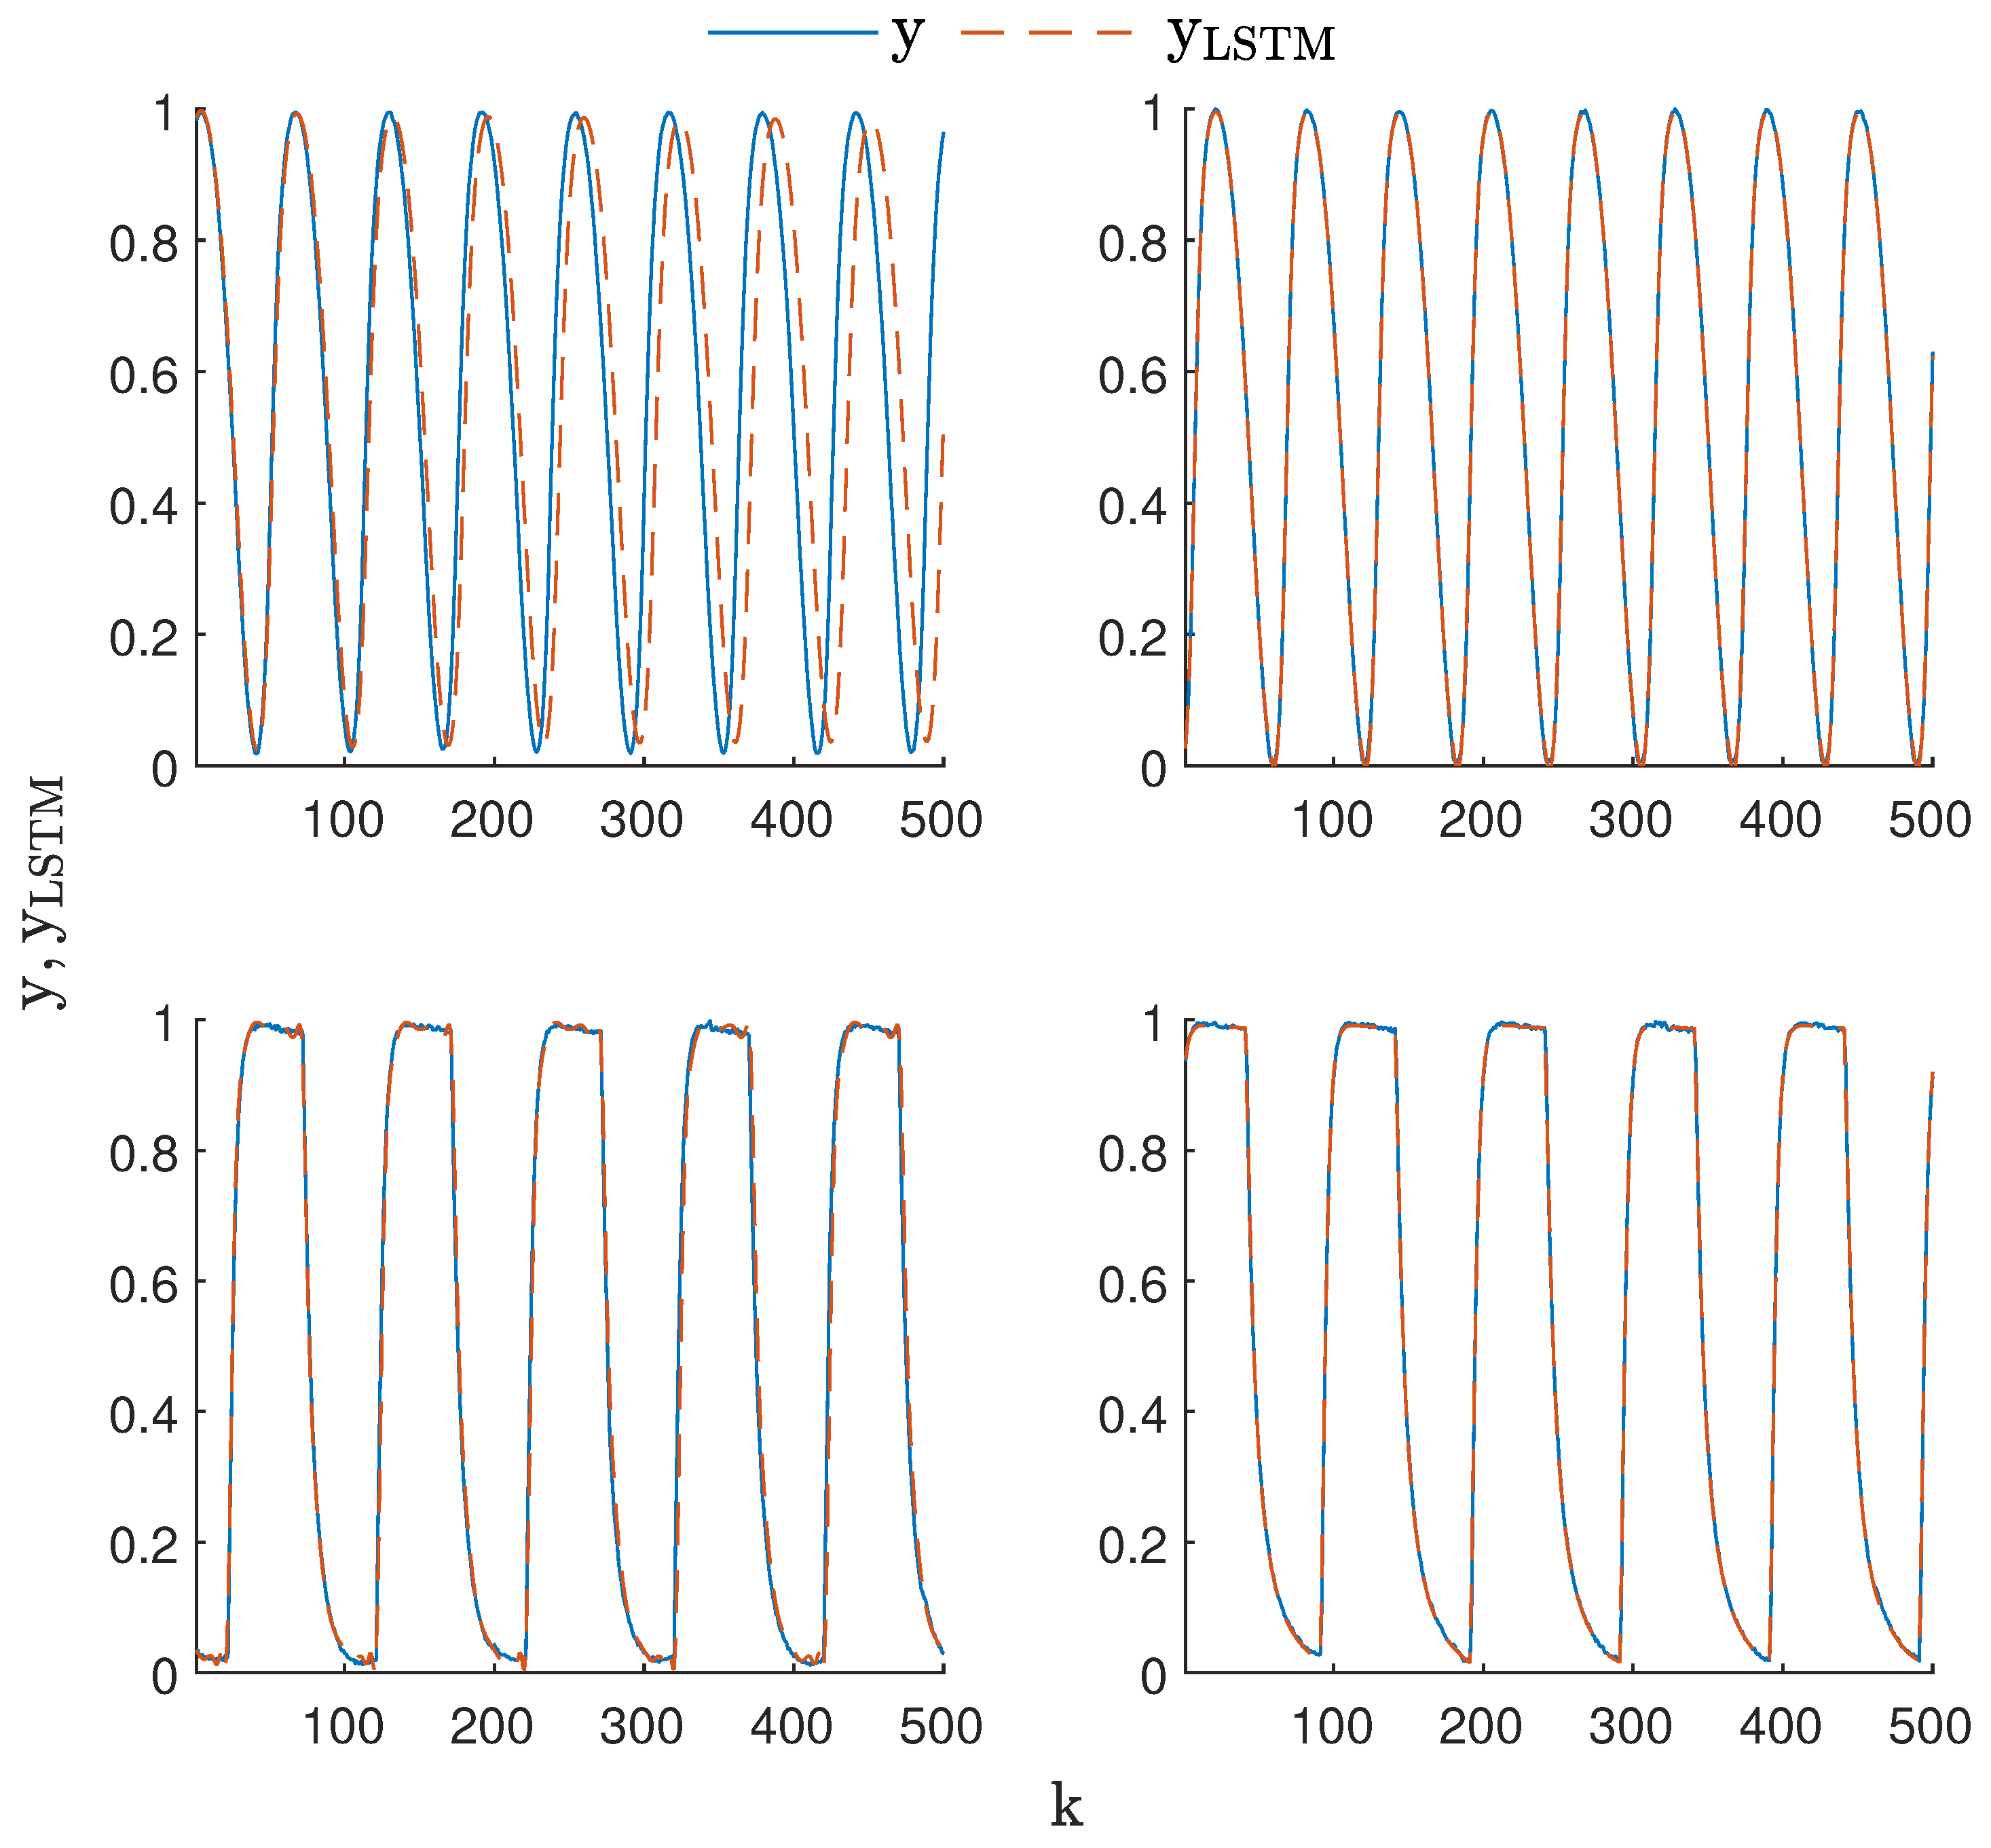
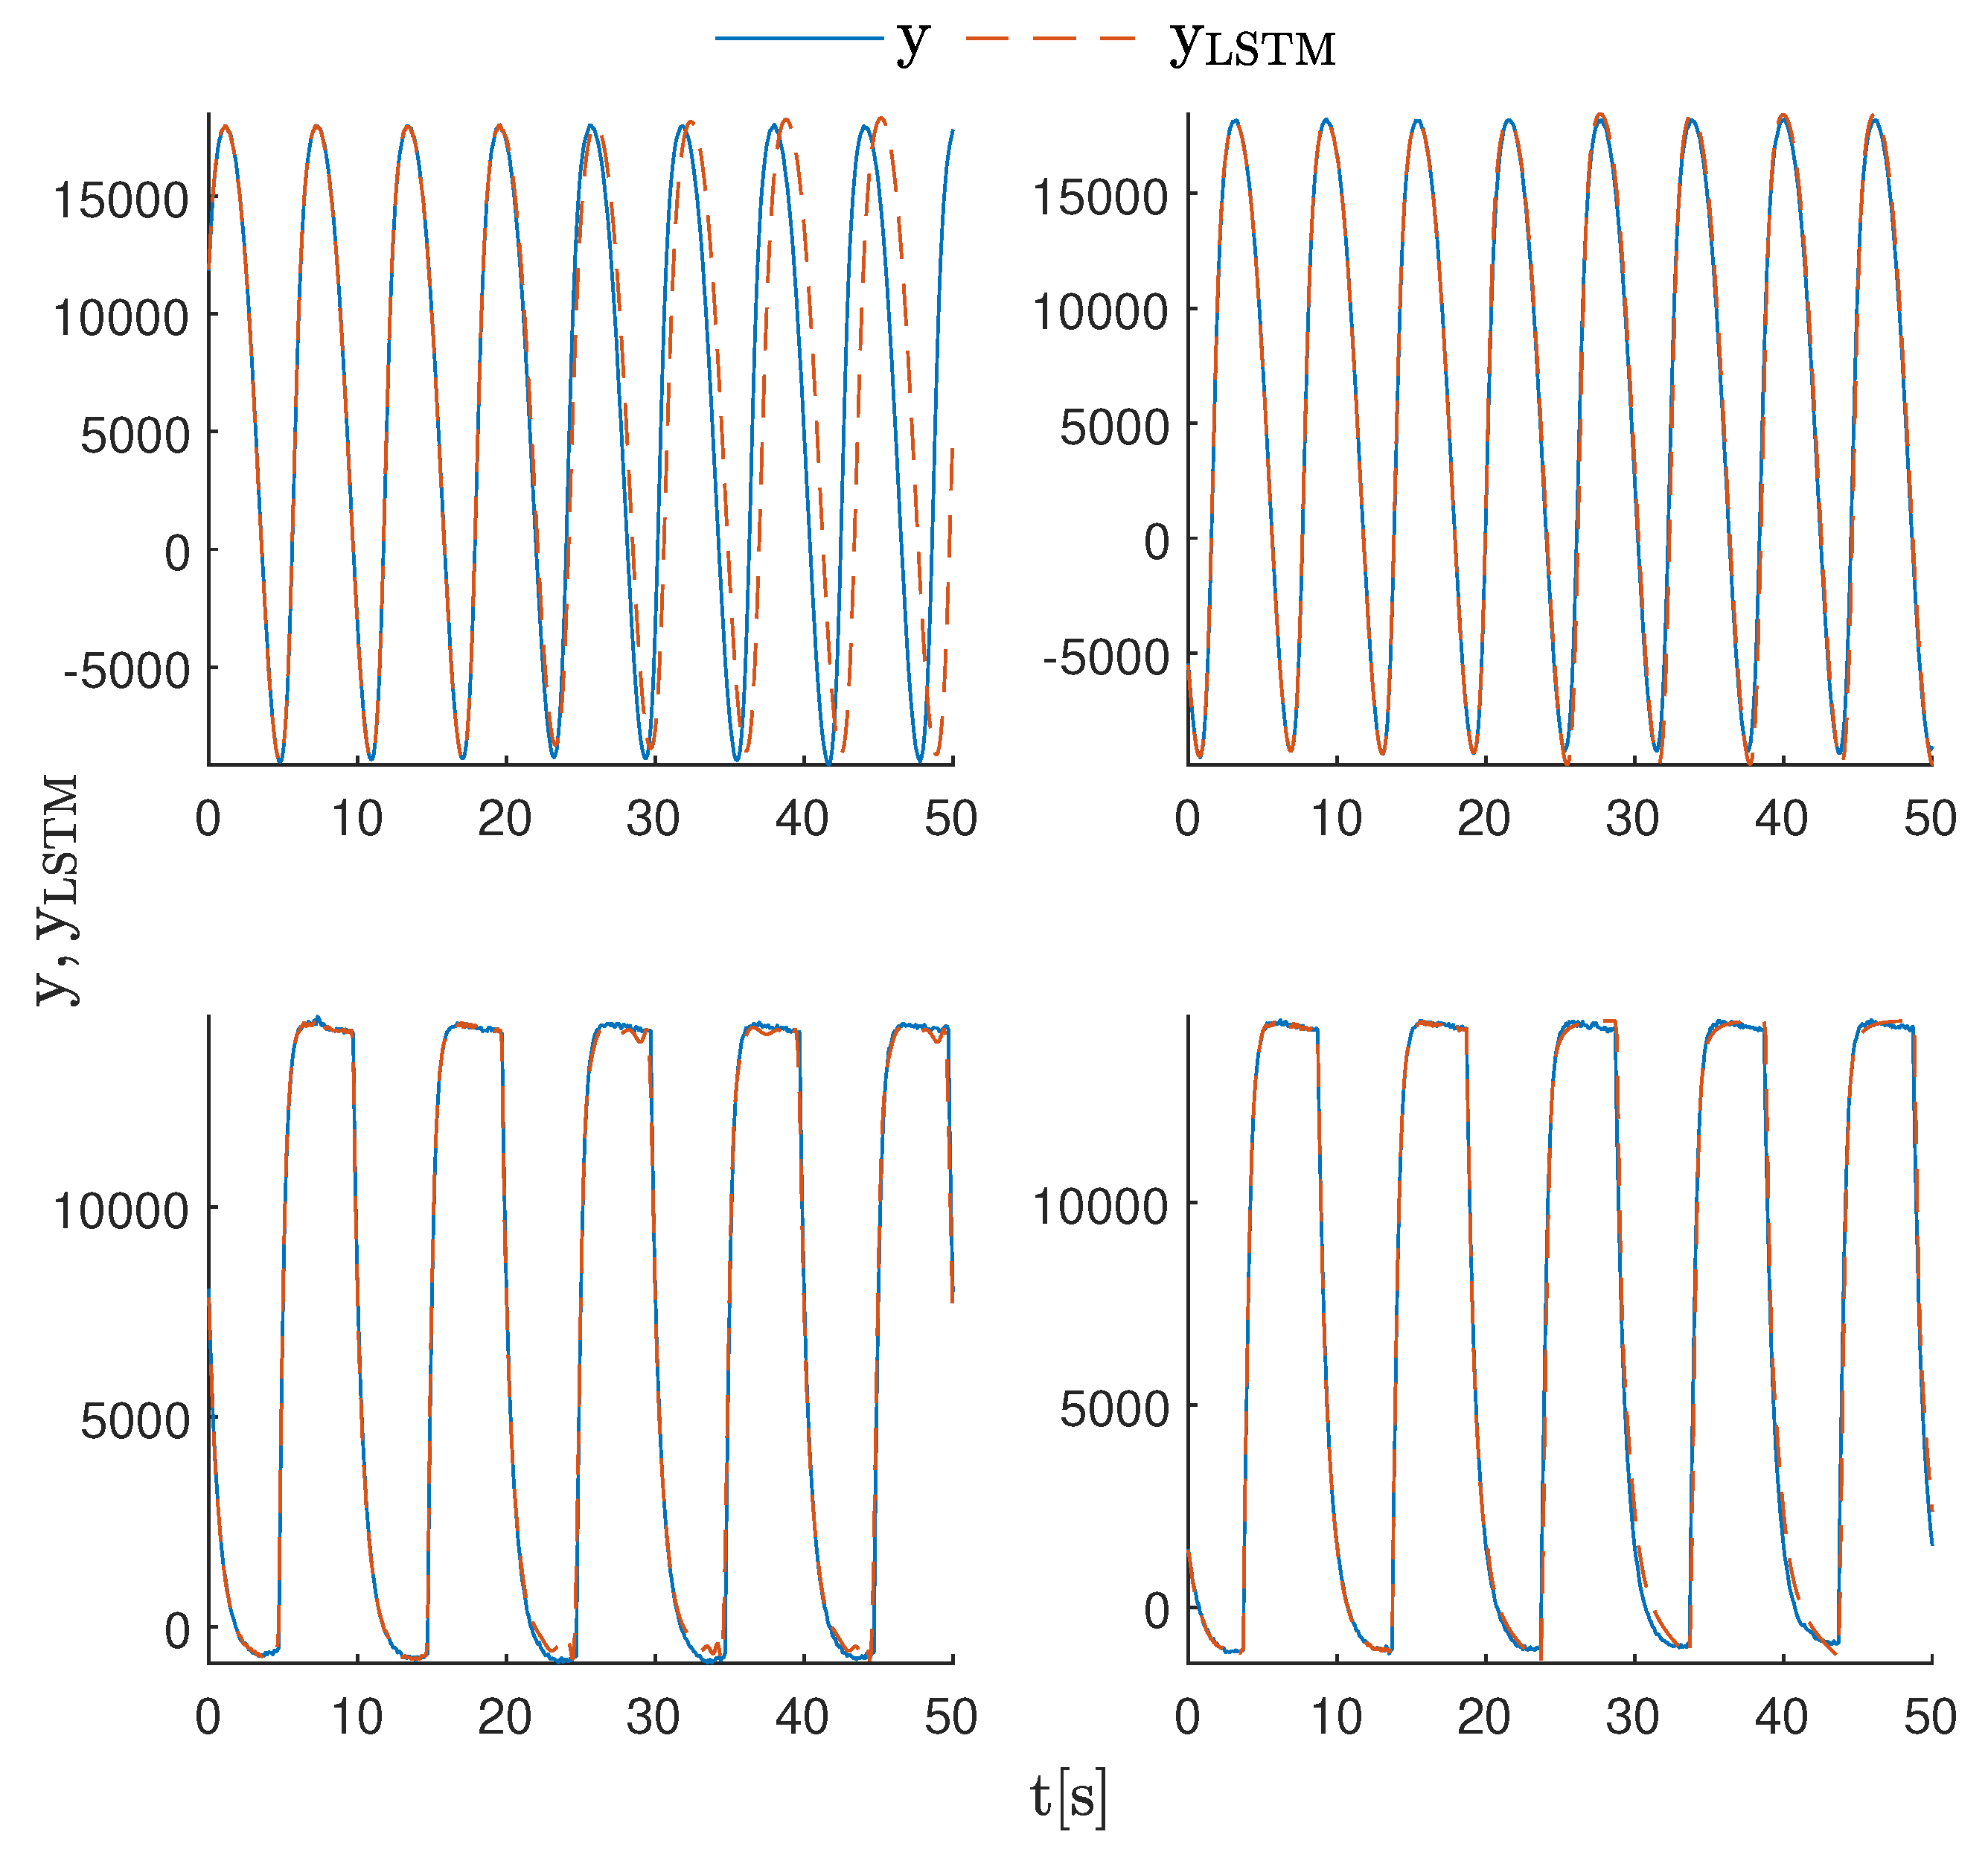
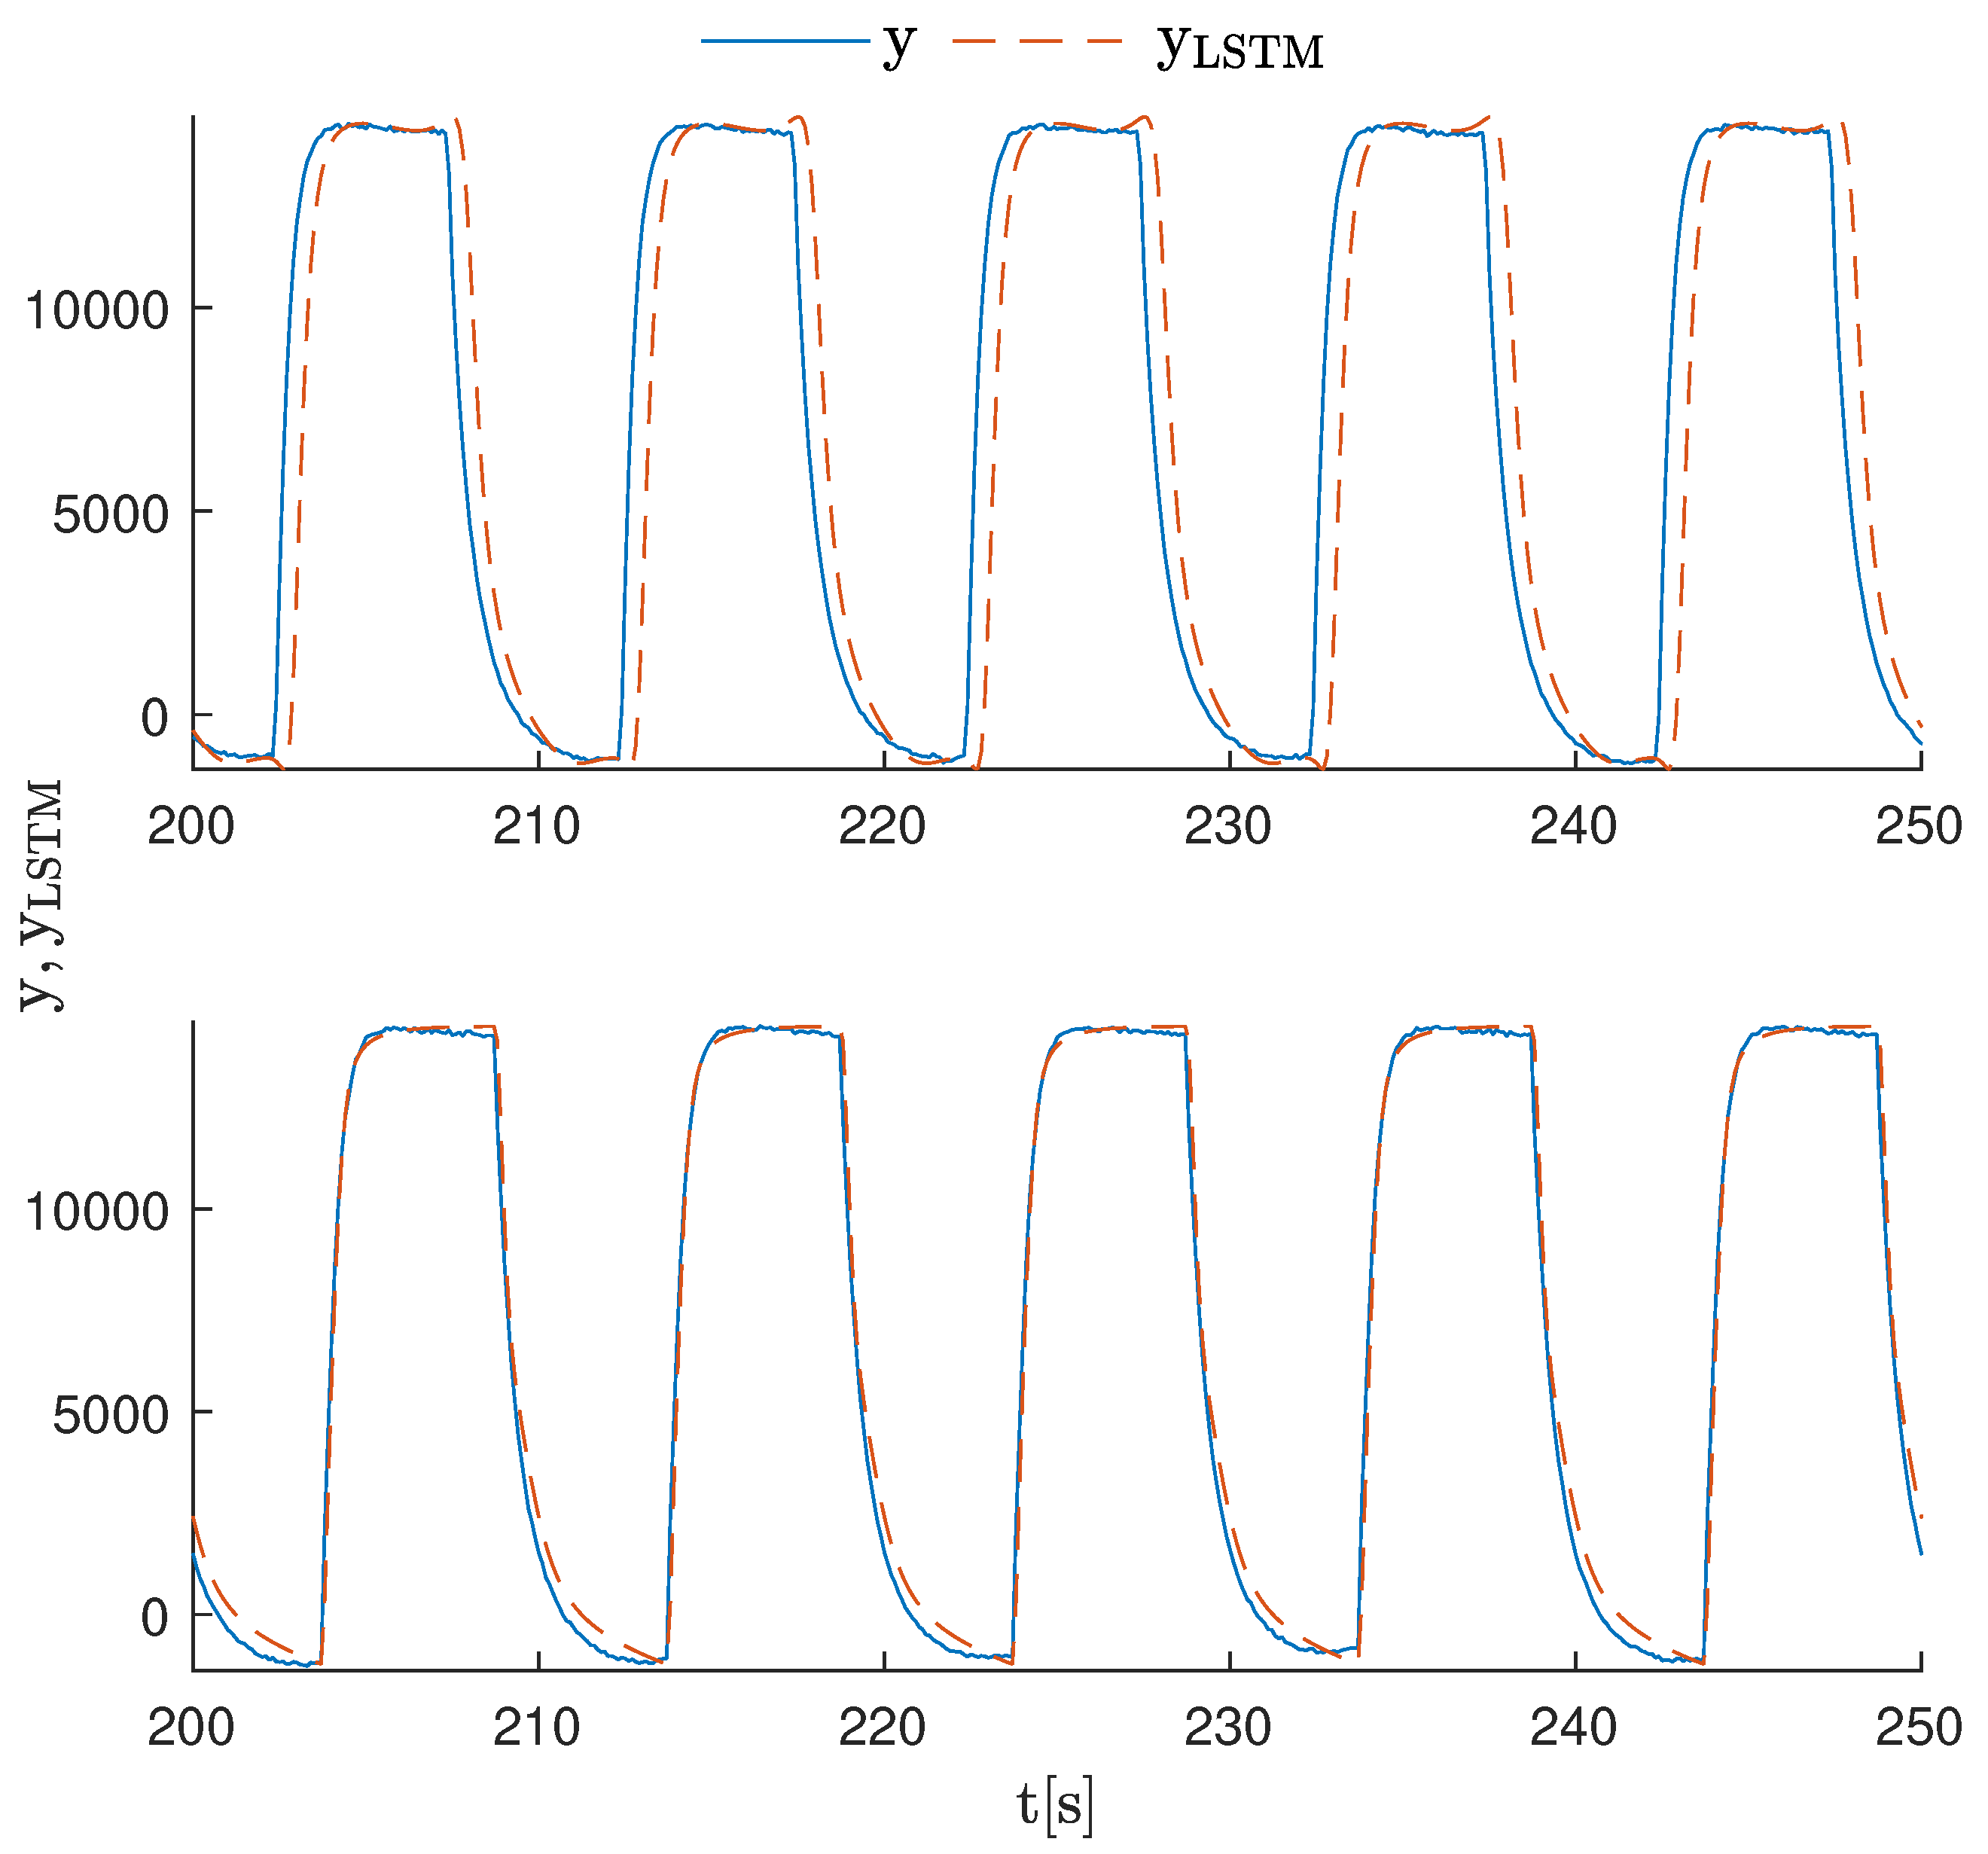
3.2. Data-Driven Training, Evaluation, and Structure Selection of the LSTM Neural Network

The data set used for LSTM training and validation was obtained from the Laboratory Process Control Network. The data were collected using a custom-designed Proxy program, which was assumed to be placed between the PLC and SCADA software (Figure 5). The Proxy works in one of two modes: transparent or active. When in the transparent mode, the Proxy transmits messages from SCADA right to the PLC and all messages (including responses for SCADA requests) from PLC to SCADA. In this mode, the Proxy is used to listen and gather data that will later be used to train the LSTM model. The active mode hijacks the communication between the SCADA and PLC. The Proxy in this mode acts as a PLC and responds to the SCADA with forged signals, using a trained LSTM model, but it can also attack the PLC. This approach guarantees consistency between the data used for training and the environment in which the forgery attack is performed.
LSTM models were trained in MATLAB on a PC with Nvidia GeForce 970 GTX GPU, Intel i5-3450 CPU, and 16 GB of RAM. We used the Adam optimization algorithm, with a learning rate 0.001 , a maximum number of 500 training epochs, and sequence padding-left direction enabled.
Training was performed for four categories of model:
1.
Models whose objective is to approximate the dynamics of the process when a sinusoidal set-point signal of the output is used; these models utilize previous values of the output signals to define the input vector of the LSTM network (Equation (1)), named hereafter LSTM sin ;
2.
Models whose objective is to approximate the dynamics of the process when a square set-point signal of the output is used; these models utilize previous values of the output signals to define the input vector of the LSTM network (Equation (1)), named hereafter LSTM sq ;
3.
Models whose objective is to approximate the dynamics of the process when a sinusoidal set-point signal of the output is used; these models utilize previous values of the output signals and the set-point signal to define the input vector of the LSTM network (Equation (2)), named hereafter LSTM sin SP ;
4.
Models whose objective is to approximate the dynamics of the process when a square set-point signal of the output is used; these models utilize previous values of the output signals and the set-point signal to define the input vector of the LSTM network (Equation (2)), named hereafter LSTM sq SP ;
The data set was collected from the laboratory stand. The data set was divided into training and validation data, each containing 8000 data samples. The average sampling time of the data equaled 100 ms. The procedure of training was as follows:
1.
First, all the data collected from the network were transformed from hexadecimal to decimal format and normalized. We transformed all the signals to be in a range from 0 to 1, except the set-point for the square signal, which was transformed to 1 and −1;
2.
Models with n N = 2 neurons and n A = 1 were trained. For each configuration of parameters, five models were trained;
3.
The order of dynamics was increased to n A = 8 and n A = 3, and 10 new models were trained;
4.
Steps 2 and 3 were repeated for models with n N equal to 12, 16, 24, 32, and 64.
All models were then tested on a test data set. The mean squared error (MSE) was used to measure the quality of the model.
MSE = 1 n k = 1 n ( y ( k ) y LSTM ( k ) ) 2
where y ( k ) and y LSTM ( k ) stand for the data sample and the model output for the sampling time k, respectively, and n = 8000 is the number of samples.
Table 1 presents the error of the best performing LSTM model for each neuron number and the order of dynamics configuration for a sinusoidal ball movement. It can be seen that, for both LSTM sin and LSTM sin SP models, the error decreased as the number of neurons in the network increased. In both cases, the models with 64 hidden neurons performed best. A further increase in the number of neurons resulted in a more significant reduction in error; however, this also increased the computational cost of the model. Therefore, we decided that 64 neurons were sufficient for the case of a sinusoidal output signal. Let us discuss the effect of changing the order of model dynamics. For LSTM sin models, the error increased for higher orders of dynamics. However, for LSTM sin SP models, the best modeling quality was obtained for models with a dynamic order n A = 3 . The LSTM sin SP models provided a better modeling quality compared to LSTM sin models. This is unsurprising, as LSTM models are presented with a more difficult task, having to operate fully in recursive mode. On the other hand, LSTM sin SP models take the set-point of the process as an input signal of the LSTM network, making it easier to match the frequency of the signal being modeled.
Table 2 shows the MSE of LSTM models for the square process output signal. For LSTM sq models, a better modeling quality was provided by those with more neurons. However, for LSTM sq SP models, one of the simplest models with eight neurons had the lowest error. The best models had a high order of dynamics, i.e., n A = 3 . On the other hand, for LSTM sq SP models, there are often (e.g., for 12 or 24 neurons) cases where models with a lower order of dynamics are better. Again, it can be observed that adding the set-point as an input to the neural network significantly reduced the model errors.
A comparison of the performance of selected models (marked in blue in the tables) with the lowest error can be seen in Figure 6. In the case of LSTM sin models, the low MSE values are misleading, i.e., the model output shifted in phase with respect to the data after a short time. The LSTM sin SP model did not have this disadvantage. In its case, the model output was always well synchronized with the data. The outputs of the LSTM sq and LSTM sq SP models were very close to each other, which means that these models reproduced the data well.

4. Experimental Evaluation of LSTM Neural Networks in the SCADA System

The four models with the best quality were tested experimentally. A Python script read the data from the PLC and used LSTM models to generate output data, which were then displayed in SCADA.
The results of the experiments are shown in Figure 7. The output of the LSTM sin model reproduced the amplitude of the real signal well. However, it became out of sync with the process output relatively quickly. The LSTM sin SP model output was very well-fitted to the real data from the PLC. The outputs of the LSTM sq and LSTM sq SP models for the first 50 s of the models’ operation were very similar to each other and well-fitted to the real signal. However, Figure 8 shows the outputs of both models after 200 s of operation. Here, the advantage of the LSTM sq SP model is highlighted. This model was still in sync with the data after this time, while the LSTM sq model had slightly shifted in phase.

4.1. Cyber-Attack Description

The attack conducted during this experiment took advantage of the fact that most PLC devices do not offer reasonable authentication and authorization mechanisms. The most common security control is based on the configured number of concurrent sessions between the SCADA system or master PLC and the victim PLC. When at least one configured connection is not properly established, anybody with access to the industrial control system network can connect to the PLC and manipulate its registers. There are at least a few situations in which the PLC does not utilize all configured connections; for example, an incorrect configuration, change in the control process, temporal disconnection of engineering station, and hostile activity, which actively disconnects the legitimate connections. Regardless of the reason, all the described situations allow an attacker to control PLC registers.
Manipulation of PLC registers directly impacts the controlled MAGLEV process. During the experiments using custom tools, we manipulated the following chosen registers: D100, which contains the measured photodetector value corresponding to the ball position, and D1002, which contains the value of the width of PWM in the range of 0 (electromagnet constantly on) to 2000 (electromagnet constantly off). The custom tool connects to the PLC using SLMP (seamless message protocol) and overwrites the chosen register with the provided value as frequently as possible. Since these values are overwritten by the attacker more frequently than by the controller, the normal activity of the ball is disturbed. In the first case, the attack value 14,000 was written to the register D100. After a few seconds, the ball started “shaking” and stuck to the magnet in a few tens of seconds. In the second case, a value of 2000 was written to register D1002. After a while, the ball went out of the range of the electromagnetic field of the electromagnet and dropped.

4.2. Protection (Precautions) against Cyber-Attacks

To avoid the discussed method of attack, one might want to consider simple software protections. The main approach to prevent such attacks is introducing redundancy into the system. Plain duplication of the communication channel used to obtain certain information might not be enough. Thus, it is encouraged to use different protocols or at least introduce some easily revertible modifications of the original signal, e.g., using affine transformation or delaying the signal. This approach would require modifications on both sides of the communication, i.e., PLC and SCADA. One might also consider using communication protocols that implement encryption; this would prevent intruders from accessing the data.
It is possible to modify only the SCADA system to detect malicious actions such as those discussed in this paper. By constantly monitoring the control error, it is possible to detect controlled signals going out of phase (assuming a periodical set-point value), as is the case for models that do not use set-point values as inputs. It is also worth mentioning that noise and disturbance influence the controlled variable, which is often difficult to model without knowledge of the overall control process. Therefore, measuring the similarity of the consecutive periods of periodic signals might suggest the occurrence of a third party in the OT network. It would also be useful to implement anomaly detection algorithms or even calculate certain signals’ statistic properties (such as variance, skewness, or kurtosis) for the operator to observe, which would be useful for detecting unnatural behavior. As the operator might not be able to detect small changes in the behavior of the plant, these simple methods would amplify these kinds of observations for the operator.
Another useful approach would be forcing the SCADA system to periodically send information to the PLC about certain measurements of key signals (e.g., mean, variation in maximum and minimum values), which would then be calculated on the PLC side and tested for discrepancies. A significant difference in results implies the presence of an ill-intentioned entity in the communication.
There are other more obvious approaches to protecting an OT network. Utilizing secure protocols inside the OT network or isolating the network from the rest of the world are the most common ways to ensure secure data transfer. The challenge is to implement this in a convenient manner and that provides sufficient security to protect against hackers. The vulnerability of an OT network is often the result of human error. Therefore, security measures must not hinder employees’ workflow. Otherwise, they might unknowingly introduce holes in the security layer of the industrial network.
An interesting option is to use LSTM neural networks to establish a protection mechanism against cyber-attacks [64,65,66]. LSTMs can learn the temporal behavior of time series sequences. In the cited works, they helped to neutralize the corrupted measurements. As a result, the process received corrected signals, which increased the overall performance.

5. Conclusions

This work studied the vulnerability of a network industrial control system to cyber-attacks. The MAGLEV process was considered in our study. This process must be very fast, unstable, and nonlinear, with a short sampling time. We used LSTM neural networks to approximate the process dynamics. The model training, evaluation, and selection are described. The model simulated the process, and the output signal was transmitted to the SCADA system, to conceal the attack. We studied if, and to what extent, a cyber-attack could cause disruptions in the process operation. For the considered MAGLEV process, the LSTM networks enabled performing such cyber-attacks. Having completed many experiments, we formulated possible protection methods against the considered type of cyber-attacks.
It is necessary to emphasize that, in general, an LSTM neural network is a great universal tool, capable of approximating the behavior of dynamical systems. On the other hand, the training of LSTMs, network architecture selection, and network validation have to be performed for specific laboratory processes. We plan to compare the efficiency of different neural networks, e.g., gated recurrent units (GRUs).
It is worth underlining that the operator is often not an appropriate tool for data analysis. Specifically, the more subtle the changes are, the more likely the operator will not notice those changes. In addition, the SLMP protocol utilized in this paper is not sufficiently secure, allowing the attacker to easily modify the values of signals visible in the SCADA on the fly and use them with malicious intent. Both conclusions can be further extrapolated for other protocols, e.g., Modbus TCP, where the security concerns are not prioritized. This paper emphasizes the lack of security in the OT network, relying on the protection provided by network isolation from the outside world.

Author Contributions

Conceptualization, P.C., K.Z., K.C., M.Ł., P.M., R.N., S.P. and A.W.; methodology, P.C. and K.Z.; software, P.C. and K.Z.; validation, P.C. and K.Z.; formal analysis, P.C., K.Z. and K.C.; investigation, P.C., K.Z., K.C., M.Ł., P.M., R.N., S.P. and A.W.; resources, P.C., K.Z., K.C., M.Ł., P.M., R.N., S.P. and A.W.; data curation, P.C. and K.Z.; writing—original draft preparation, P.C. and K.Z.; writing—review and editing, P.C., K.Z., M.Ł. and P.M.; visualization, P.C. and K.Z.; supervision, P.C., K.Z., K.C., M.Ł., P.M., R.N., S.P. and A.W.; project administration, M.Ł. and S.P.; funding acquisition, P.C., K.Z., K.C., M.Ł., P.M., R.N., S.P. and A.W. All authors have read and agreed to the published version of the manuscript.

Funding

This work was financed by research grant no. CYBERSECIDENT/488240IV/NCBR/2021 Laboratory for Vulnerability Analysis (LaVA) of stationary and mobile IT devices and algorithms and software.

Institutional Review Board Statement

Not applicable.

Informed Consent Statement

Not applicable.

Data Availability Statement

On request from the authors.

Conflicts of Interest

The authors declare no conflict of interest.

References

  1. Toker, O.; Ozdemir, O. Physical-layer Cyberattack Resilient OFDM Automotive Radars. In Proceedings of the 2020 IEEE Vehicular Networking Conference (VNC), New York, NY, USA, 16–18 December 2020. [Google Scholar]
  2. Hou, B.; Zeng, S.; Xi, B.; Jia, S.; Guo, Q.; Xu, L.; Sun, H. Performance of Neighborhood-Watch-Based Resilient Distributed Energy Management Algorithm under Different Types of Cyberattacks. In Proceedings of the 2021 IEEE 4th International Electrical and Energy Conference (CIEEC), Wuhan, China, 28–30 May 2021; pp. 1–5. [Google Scholar]
  3. Zabetian-Hosseini, A.; Mehrizi-Sani, A.; Liu, C.C. Cyberattack to Cyber-Physical Model of Wind Farm SCADA. In Proceedings of the IECON 2018—44th Annual Conference of the IEEE Industrial Electronics Society, Washington, DC, USA, 21–23 October 2018; pp. 4929–4934. [Google Scholar]
  4. Colter, J.; Kinnison, M.; Henderson, A.; Schlager, S.M.; Bryan, S.; O’Grady, K.L.; Abballe, A.; Harbour, S. Testing the Resiliency of Consumer Off-the-Shelf Drones to a Variety of Cyberattack Methods. In Proceedings of the 2022 IEEE/AIAA 41st Digital Avionics Systems Conference (DASC), Portsmouth, VA, USA, 18–22 September 2022; pp. 1–5. [Google Scholar]
  5. Mu, L.; Zhao, E.; Wang, Y.; Zomaya, A.Y. Buoy Sensor Cyberattack Detection in Offshore Petroleum Cyber-Physical Systems. IEEE Trans. Serv. Comput. 2020, 13, 653–662. [Google Scholar] [CrossRef]
  6. Khaw, Y.M.; Abiri Jahromi, A.; Arani, M.F.M.; Sanner, S.; Kundur, D.; Kassouf, M. A Deep Learning-Based Cyberattack Detection System for Transmission Protective Relays. IEEE Trans. Smart Grid 2021, 12, 2554–2565. [Google Scholar] [CrossRef]
  7. Pazouki, S.; K C, B.; Alkhwaildi, H.A.; Asrari, A. Modelling of Smart Homes Affected by Cyberattacks. In Proceedings of the 2020 52nd North American Power Symposium (NAPS), Tempe, AZ, USA, 11–13 April 2021; pp. 1–6. [Google Scholar]
  8. Zhang, Y.; Jiang, Y.; Xu, A.; Hong, C.; Chen, J. Method to Evaluate the Impact of Cyberattacks against Charging Piles on Distribution Network. In Proceedings of the 2020 12th IEEE PES Asia-Pacific Power and Energy Engineering Conference (APPEEC), Nanjing, China, 20–23 September 2020; pp. 1–5. [Google Scholar]
  9. Kbar, G.; Alazab, A. A Comprehensive Protection Method for Securing the Organization’s Network against Cyberattacks. In Proceedings of the 2019 Cybersecurity and Cyberforensics Conference (CCC), Melbourne, VIC, Australia, 8–9 May 2019; pp. 118–122. [Google Scholar]
  10. Sudar, K.; Deepalakshmi, P.; Nagaraj, P.; Muneeswaran, V. Analysis of Cyberattacks and its Detection Mechanisms. In Proceedings of the 2020 Fifth International Conference on Research in Computational Intelligence and Communication Networks (ICRCICN), Bangalore, India, 26–27 November 2020; pp. 12–16. [Google Scholar]
  11. Housh, M.; Kadosh, N.; Haddad, J. Detecting and Localizing Cyber-Physical Attacks in Water Distribution Systems without Records of Labeled Attacks. Sensors 2022, 22, 6035. [Google Scholar] [CrossRef] [PubMed]
  12. Gaggero, G.B.; Caviglia, R.; Armellin, A.; Rossi, M.; Girdinio, P.; Marchese, M. Detecting Cyberattacks on Electrical Storage Systems through Neural Network Based Anomaly Detection Algorithm. Sensors 2022, 22, 3933. [Google Scholar] [CrossRef]
  13. Jadidi, Z.; Pal, S.; Hussain, M.; Nguyen Thanh, K. Correlation-Based Anomaly Detection in Industrial Control Systems. Sensors 2023, 23, 1561. [Google Scholar] [CrossRef]
  14. Yin, X.C.; Liu, Z.G.; Nkenyereye, L.; Ndibanje, B. Toward an Applied Cyber Security Solution in IoT-Based Smart Grids: An Intrusion Detection System Approach. Sensors 2019, 19, 4952. [Google Scholar] [CrossRef] [Green Version]
  15. Chae, Y.; Katenka, N.; DiPippo, L. An Adaptive Threshold Method for Anomaly-based Intrusion Detection Systems. In Proceedings of the 2019 IEEE 18th International Symposium on Network Computing and Applications (NCA), Cambridge, MA, USA, 26–28 September 2019; pp. 1–4. [Google Scholar]
  16. Villalba, D.A.M.; Varon, D.F.M.; Pórtela, F.G.; Triana, O.A.D. Intrusion Detection System (IDS) with anomaly-based detection and deep learning application. In Proceedings of the 2022 V Congreso Internacional en Inteligencia Ambiental, Ingeniería de Software y Salud Electrónica y Móvil (AmITIC), San Jose, Costa Rica, 14–16 September 2022; pp. 1–4. [Google Scholar]
  17. Wang, W.; Wang, Z.; Zhou, Z.; Deng, H.; Zhao, W.; Wang, C.; Guo, Y. Anomaly detection of industrial control systems based on transfer learning. Tsinghua Sci. Technol. 2021, 26, 821–832. [Google Scholar] [CrossRef]
  18. Kao, J.B.; Jiang, J.R. Anomaly Detection for Univariate Time Series with Statistics and Deep Learning. In Proceedings of the 2019 IEEE Eurasia Conference on IOT, Communication and Engineering (ECICE), Yunlin, Taiwan, 3–6 October 2019; pp. 404–407. [Google Scholar]
  19. Wang, H.; Tang, M.; Park, Y.; Priebe, C.E. Locality Statistics for Anomaly Detection in Time Series of Graphs. IEEE Trans. Signal Process. 2014, 62, 703–717. [Google Scholar] [CrossRef] [Green Version]
  20. Heymann, S.; Latapy, M.; Magnien, C. Outskewer: Using Skewness to Spot Outliers in Samples and Time Series. In Proceedings of the 2012 IEEE/ACM International Conference on Advances in Social Networks Analysis and Mining, Istanbul, Turkey, 26–29 August 2012; pp. 527–534. [Google Scholar]
  21. Abdallah, A.E.; Hamdan, M.; Gismalla, M.S.M.; Ibrahim, A.O.; Aljurayban, N.S.; Nagmeldin, W.; Khairi, M.H.H. Detection of Management-Frames-Based Denial-of-Service Attack in Wireless LAN Network Using Artificial Neural Network. Sensors 2023, 23, 2663. [Google Scholar] [CrossRef]
  22. Bhattasali, T.; Chaki, R.; Sanyal, S. Sleep Deprivation Attack Detection in Wireless Sensor Network. Int. J. Comput. Appl. 2012, 40, 19–25. [Google Scholar] [CrossRef]
  23. Alsaade, F.W.; Al-Adhaileh, M.H. Cyber Attack Detection for Self-Driving Vehicle Networks Using Deep Autoencoder Algorithms. Sensors 2023, 23, 4086. [Google Scholar] [CrossRef]
  24. Basan, E.; Basan, A.; Nekrasov, A.; Fidge, C.; Gamec, J.; Gamcová, M. A Self-Diagnosis Method for Detecting UAV Cyber Attacks Based on Analysis of Parameter Changes. Sensors 2021, 21, 509. [Google Scholar] [CrossRef]
  25. Alahmadi, A.N.; Rehman, S.U.; Alhazmi, H.S.; Glynn, D.G.; Shoaib, H.; Solé, P. Cyber-Security Threats and Side-Channel Attacks for Digital Agriculture. Sensors 2022, 22, 3520. [Google Scholar] [CrossRef]
  26. Mohamed, A.; Wang, F.; Butun, I.; Qadir, J.; Lagerström, R.; Gastaldo, P.; Caviglia, D.D. Enhancing Cyber Security of LoRaWAN Gateways under Adversarial Attacks. Sensors 2022, 22, 3498. [Google Scholar] [CrossRef] [PubMed]
  27. Kumar, V.; Kumar, R.; Khan, A.A.; Kumar, V.; Chen, Y.C.; Chang, C.C. RAFI: Robust Authentication Framework for IoT-Based RFID Infrastructure. Sensors 2022, 22, 3110. [Google Scholar] [CrossRef] [PubMed]
  28. Atilgan, E.; Ozcelik, I.; Yolacan, E.N. MQTT Security at a Glance. In Proceedings of the 2021 International Conference on Information Security and Cryptology (ISCTURKEY), Ankara, Turkey, 2–3 December 2021; pp. 138–142. [Google Scholar]
  29. Hadded, M.; Lauras, G.; Letailleur, J.; Petiot, Y.; Dubois, A. An Assessment Platform of Cybersecurity Attacks against the MQTT Protocol using SIEM. In Proceedings of the 2022 International Conference on Software, Telecommunications and Computer Networks (SoftCOM), Split, Croatia, 22–24 September 2022; pp. 1–6. [Google Scholar]
  30. Sultan, A.B.M.; Mehmood, S.; Zahid, H. Man in the Middle Attack Detection for MQTT based IoT devices using different Machine Learning Algorithms. In Proceedings of the 2022 2nd International Conference on Artificial Intelligence (ICAI), Islamabad, Pakistan, 30–31 March 2022; pp. 118–121. [Google Scholar]
  31. Bassolillo, S.R.; D’Amato, E.; Notaro, I.; Blasi, L.; Mattei, M. Decentralized Mesh-Based Model Predictive Control for Swarms of UAVs. Sensors 2020, 20, 4324. [Google Scholar] [CrossRef] [PubMed]
  32. Ding, Z.; Sun, C.; Zhou, M.; Liu, Z.; Wu, C. Intersection Vehicle Turning Control for Fully Autonomous Driving Scenarios. Sensors 2021, 21, 3995. [Google Scholar] [CrossRef]
  33. Xiong, L.; Fu, Z.; Zeng, D.; Leng, B. An Optimized Trajectory Planner and Motion Controller Framework for Autonomous Driving in Unstructured Environments. Sensors 2021, 21, 4409. [Google Scholar] [CrossRef]
  34. Ławryńczuk, M.; Nebeluk, R. Computationally Efficient Nonlinear Model Predictive Control Using the L1 Cost-Function. Sensors 2021, 21, 5835. [Google Scholar] [CrossRef]
  35. Schwedersky, B.B.; Flesch, R.C.C.; Dangui, H.A.S. Practical nonlinear model predictive control algorithm for long short-term memory networks. IFAC-PapersOnLine 2019, 52, 468–473. [Google Scholar] [CrossRef]
  36. Billings, S.A.; Jamaluddin, H.B.; Chen, S. Properties of neural networks with applications to modelling non-linear dynamical systems. Int. J. Control 1992, 55, 193–224. [Google Scholar] [CrossRef] [Green Version]
  37. Haykin, S. Neural Networks and Learning Machines; Pearson Education: Upper Saddle River, NJ, USA, 2009. [Google Scholar]
  38. Lysenko, S.; Bobrovnikova, K.; Shchuka, R.; Savenko, O. A Cyberattacks Detection Technique Based on Evolutionary Algorithms. In Proceedings of the 2020 IEEE 11th International Conference on Dependable Systems, Services and Technologies (DESSERT), Kyiv, Ukraine, 14–18 May 2020; pp. 127–132. [Google Scholar]
  39. Naik Sapavath, N.; Muhati, E.; Rawat, D.B. Prediction and Detection of Cyberattacks using AI Model in Virtualized Wireless Networks. In Proceedings of the 2021 8th IEEE International Conference on Cyber Security and Cloud Computing (CSCloud)/2021 7th IEEE International Conference on Edge Computing and Scalable Cloud (EdgeCom), Washington, DC, USA, 26–28 June 2021; pp. 97–102. [Google Scholar]
  40. Tang, Z.; Jiao, J.; Zhang, P.; Yue, M.; Chen, C.; Yan, J. Enabling Cyberattack-Resilient Load Forecasting through Adversarial Machine Learning. In Proceedings of the 2019 IEEE Power & Energy Society General Meeting (PESGM), Atlanta, GA, USA, 4–8 August 2019; pp. 1–5. [Google Scholar]
  41. Pazouki, S.; Naderi, E.; Asrari, A. Interconnected Energy Hubs including DERs Targeted by FDI Cyberattacks. In Proceedings of the 2020 11th International Green and Sustainable Computing Workshops (IGSC), Pullman, WA, USA, 19–22 October 2020; pp. 1–6. [Google Scholar]
  42. Toker, O. Performance Bounds for Cyberattack Detectors Using Multiple Observations. In Proceedings of the SoutheastCon 2022, Mobile, AL, USA, 26 March–3 April 2022; pp. 104–109. [Google Scholar]
  43. Djenna, A.; Saidouni, D.E.; Abada, W. A Pragmatic Cybersecurity Strategies for Combating IoT-Cyberattacks. In Proceedings of the 2020 International Symposium on Networks, Computers and Communications (ISNCC), Montreal, QC, Canada, 20–22 October 2020; pp. 1–6. [Google Scholar]
  44. Nagy, L.; Márton, L. Cyberattack detection and compensation for distant-controlled mobile robots. In Proceedings of the 2020 IEEE 20th International Symposium on Computational Intelligence and Informatics (CINTI), Budapest, Hungary, 5–7 November 2020; pp. 39–44. [Google Scholar]
  45. Leng, M.; Sahoo, S.; Blaabjerg, F.; Molinas, M. Projections of Cyberattacks on Stability of DC Microgrids—Modeling Principles and Solution. IEEE Trans. Power Electron. 2022, 37, 11774–11786. [Google Scholar] [CrossRef]
  46. Hochreiter, S.; Schmidhuber, J. Long Short-term Memory. Neural Comput. 1997, 9, 1735–1780. [Google Scholar] [CrossRef]
  47. Hochreiter, S. Untersuchungen zu Dynamischen Neuronalen Netzen. Master’s Thesis, Technical University Munich, Munich, Germany, 1991. [Google Scholar]
  48. Chen, W.; Zhao, Z.; Liu, J.; Chen, P.C.Y.; Wu, X. LSTM Network: A Deep Learning Approach for Short-Term Traffic Forecast. IET Intell. Transp. Syst. 2017, 11, 68–75. [Google Scholar]
  49. Gallardo-Antolín, A.; Montero, J.M. Detecting deception from gaze and speech using a multimodal attention LSTM-based framework. Appl. Sci. 2021, 11, 6393. [Google Scholar] [CrossRef]
  50. Capes, T.; Coles, P.; Conkie, A.; Golipour, L.; Hadjitarkhani, A.; Hu, Q.; Huddleston, N.; Hunt, M.; Li, J.; Neeracher, M.; et al. Siri on-device deep learning-guided unit selection text-to-speech system. In Proceedings of the Interspeech 2017, Stockholm, Sweden, 20–24 August 2017; pp. 4011–4015. [Google Scholar]
  51. Graves, A.; Schmidhuber, J. Offline handwriting recognition with multidimensional recurrent neural networks. Adv. Neural Inf. Process. Syst. 2009, 21, 1–8. [Google Scholar]
  52. Zarzycki, K.; Ławryńczuk, M. LSTM and GRU Neural Networks as Models of Dynamical Processes Used in Predictive Control: A Comparison for Two Chemical Reactors. Sensors 2021, 21, 5625. [Google Scholar] [CrossRef]
  53. Zarzycki, K.; Ławryńczuk, M. Advanced predictive control for GRU and LSTM networks. Inf. Sci. 2022, 616, 229–254. [Google Scholar] [CrossRef]
  54. Jeon, B.K.; Kim, E.J. LSTM-based model predictive control for optimal temperature set-point planning. Sustainability 2021, 13, 894. [Google Scholar] [CrossRef]
  55. Li, Y.; Zhu, Z.; Kong, D.; Han, H.; Zhao, Y. EA-LSTM: Evolutionary attention-based LSTM for time series prediction. Knowl.-Based Syst. 2019, 181, 104785. [Google Scholar] [CrossRef] [Green Version]
  56. Cao, J.; Li, Z.; Li, J. Financial time series forecasting model based on CEEMDAN and LSTM. Phys. A Stat. Mech. Its Appl. 2019, 519, 127–139. [Google Scholar] [CrossRef]
  57. Karim, F.; Majumdar, S.; Darabi, H.; Harford, S. Multivariate LSTM-FCNs for time series classification. Neural Netw. 2019, 116, 237–245. [Google Scholar] [CrossRef] [PubMed] [Green Version]
  58. Wojtulewicz, A.; Chaber, P.; Ławryńczuk, M. Multiple-input multiple-output laboratory stand for process control education. In Proceedings of the 2016 21st International Conference on Methods and Models in Automation and Robotics (MMAR), Miedzyzdroje, Poland, 29 August–1 September 2016; pp. 466–471. [Google Scholar]
  59. Herarsi, N.E.H.; Mkedder, M.E.A.; Hassam, A.; Meliani, S.M. Development of a supervisory and control Interface for the distribution station of the FESTO MPS 500 system using WinCC software. In Proceedings of the 2021 1st International Conference on Cyber Management and Engineering (CyMaEn), Hammamet, Tunisia, 26-28 May 2021; pp. 1–4. [Google Scholar]
  60. Giusti, F.; Bevilacqua, M.; Tedeschi, S.; Emmanouilidis, C. Data analytics and production efficiency evaluation on a flexible manufacturing cell. In Proceedings of the 2018 IEEE International Instrumentation and Measurement Technology Conference (I2MTC), Houston, TX, USA, 14–17 May 2018; pp. 1–6. [Google Scholar]
  61. Garcia, C.A.; Castellanos, E.X.; Rosero, C.; Sanchez, C.; Garcia, M.V. Designing Automation Distributed Systems Based on IEC-61499 and UML. In Proceedings of the 2017 5th International Conference in Software Engineering Research and Innovation (CONISOFT), Merida, Mexico, 25–27 October 2017; pp. 61–68. [Google Scholar]
  62. Hedrea, E.L.; Precup, R.E.; Bojan-Dragos, C.A. Results on Tensor Product-based Model Transformation of Magnetic Levitation Systems. Acta Polytech. Hung. 2019, 16, 93–111. [Google Scholar] [CrossRef]
  63. Bauer, W.; Baranowski, J. Fractional PIλD Controller Design for a Magnetic Levitation System. Electronics 2020, 9, 2135. [Google Scholar] [CrossRef]
  64. Gao, J.; Gan, L.; Buschendorf, F.; Zhang, L.; Liu, H.; Li, P.; Dong, X.; Lu, T. LSTM for SCADA Intrusion Detection. In Proceedings of the 2019 IEEE Pacific Rim Conference on Communications, Computers and Signal Processing (PACRIM), Victoria, BC, Canada, 21–23 August 2019; pp. 1–5. [Google Scholar]
  65. Kotenko, I.; Lauta, O.; Kribel, K.; Saenko, I. LSTM Neural Networks for Detecting Anomalies Caused by Web Application Cyber Attacks. In Frontiers in Artificial Intelligence and Applications, New Trends in Intelligent Software Methodologies, Tools and Techniques; IOS Press: Amsterdam, The Netherlands, 2021; pp. 127–140. [Google Scholar]
  66. Wilson, M.; Mahmood, H.; Giordano, J. Detection and Mitigation of Cyberattacks against Power Measurement Channels Using LSTM Neural Networks. In Proceedings of the 2021 IEEE Energy Conversion Congress and Exposition (ECCE), Vancouver, BC, Canada, 10–14 October 2021; pp. 1419–1426. [Google Scholar]
Figure 1. Schematic representation of connections within the laboratory control network.
Sensors 23 06778 g001
Figure 2. Photo showing MAGLEV and heating–cooling sections of the workspace, with the main managed switch.
Sensors 23 06778 g002
Figure 3. Schematic view of the data flow and protocols used in the considered part of the laboratory workspace.
Sensors 23 06778 g003
Figure 4. The overall structure of the neural network used (top), and the internal configuration of the LSTM cell (bottom). Blue indicates the model’s internal weights, green the algebraic operations, and purple and red the sigmoidal and hyperbolic tangent activation functions, respectively.
Sensors 23 06778 g004
Figure 5. Schematic view of the data flow and protocols used in the considered part of the laboratory workspace when the Proxy has hijacked the communication.
Sensors 23 06778 g005
Figure 6. Best performing model outputs compared to the data from the validation data set: LSTM sin with n N = 64 and n A = 1 (top-left), LSTM sin SP with n N = 64 and n A = 3 (top-right), LSTM sq with n N = 64 and n A = 3 (bottom-left) and LSTM sq SP with n N = 8 and n A = 3 (bottom-right).
Sensors 23 06778 g006
Figure 7. Best performing models working online, compared to real data collected from the PLC: LSTM sin with n N = 64 and n A = 1 (top-left), LSTM sin SP with n N = 64 and n A = 3 (top-right), LSTM sq with n N = 64 and n A = 3 (bottom-left) and LSTM sq SP with n N = 8 and n A = 3 (bottom-right).
Sensors 23 06778 g007
Figure 8. Comparison between the LSTM sq and LSTM sq SP models working online vs. real data collected from the PLC after 200 s of continuous operation.
Sensors 23 06778 g008
Table 1. MSE errors for LSTM models for the sinusoidal set-point signal. The blue background indicates the best-performing models of each type with the lowest error value.
LSTM sin LSTM sin SP
n N n A = 1 n A = 2 n A = 3 n A = 1 n A = 2 n A = 3
82.1 × 10 −18.5 × 10 −36.3 × 10 −4 4.6 × 10 −48.5 × 10 −42.5 × 10 −4
121.0 × 10 −35.1 × 10 −42.3 × 10 −1 4.7 × 10 −47.5 × 10 −41.9 × 10 −4
166.5 × 10 −41.6 × 10 −37.6 × 10 −4 4.7 × 10 −42.9 × 10 −42.0 × 10 −4
241.1 × 10 −25.8 × 10 −35.9 × 10 −4 3.8 × 10 −41.7 × 10 −42.3 × 10 −4
326.2 × 10 −45.6 × 10 −41.1 × 10 −2 2.4 × 10 −42.0 × 10 −41.8 × 10 −4
640.000471.6 × 10 −32.1 × 10 −1 2.7 × 10 −41.7 × 10 −40.00013
Table 2. MSE errors for LSTM models for the square set-point signal. The blue background indicates the best-performing models of each type with the lowest error value.
LSTM sq LSTM sq SP
n N n A = 1 n A = 2 n A = 3 n A = 1 n A = 2 n A = 3
82.5 × 10 −12.8 × 10 −11.6 × 10 −1 1.0 × 10 −39.4 × 10 −40.00053
123.3 × 10 −12.3 × 10 −12.2 × 10 −1 5.9 × 10 −48.2 × 10 −49.5 × 10 −4
163.4 × 10 −11.4 × 10 −13.0 × 10 −1 6.5 × 10 −46.9 × 10 −46.4 × 10 −4
246.7 × 10 −26.2 × 10 −22.5 × 10 −2 6.3 × 10 −47.6 × 10 −47.3 × 10 −4
321.1 × 10 −15.1 × 10 −27.8 × 10 −2 6.3 × 10 −46.6 × 10 −47.2 × 10 −4
647.8 × 10 −26.3 × 10 −20.023 6.9 × 10 −46.2 × 10 −46.0 × 10 −4
Disclaimer/Publisher’s Note: The statements, opinions and data contained in all publications are solely those of the individual author(s) and contributor(s) and not of MDPI and/or the editor(s). MDPI and/or the editor(s) disclaim responsibility for any injury to people or property resulting from any ideas, methods, instructions or products referred to in the content.

